creating sustainable outcomes for agriculture - · pdf filecreating sustainable outcomes for...
TRANSCRIPT
Creating Sustainable Outcomes for Agriculture
Jerry Steiner, Executive Vice PresidentMonsanto Company
IPC Fall 2007 Seminar

2
Steering Committee Members and Participants
American Soybean AssociationBunge LimitedCargill, IncorporatedThe Coca-Cola CompanyConservation InternationalDuPontGeneral Mills Inc.Grocery Manufacturers Association/Food Products Association
The Heinz Center McDonald’s Mars, Inc.MonsantoNational Corn Growers AssociationNational Cotton CouncilThe Nature ConservancyUnited Soybean BoardWal-Mart Stores, Inc.World Wildlife Fund

3
The broad conversation on sustainability has matured in many sectors
Common sense and technology are teaming up to create practical solutions
4
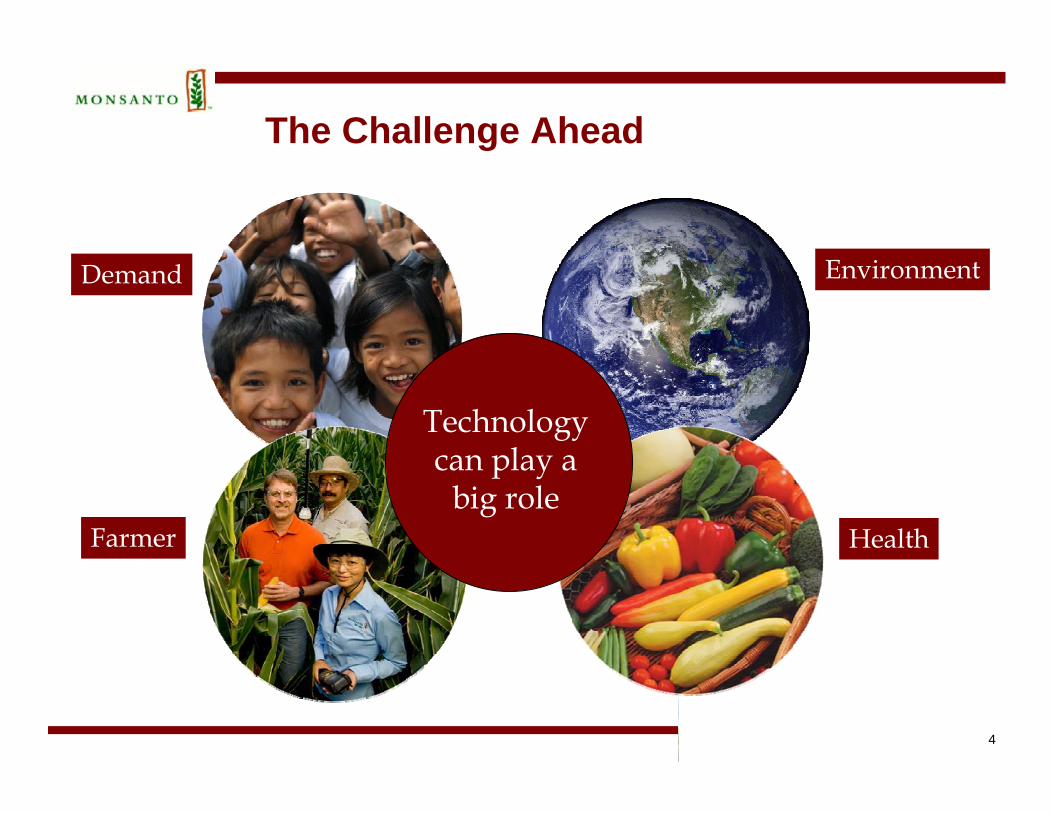
The Challenge Ahead
Technology can play a
big role
Demand
Farmer Health
Environment

5
There are opportunities to better define sustainability in agriculture – the global picture
Key environmental impacts of global agriculture:
And some key realities:Global food demand will double in 50 yearsIncreased income (globally 2.4 times by 2050) will lead to increased consumptionPer capita arable land globally is decreasingRenewables and biofuels are also a part of overall demand for agricultural productionThe poorest people on the planet have no land and can spend 75% of income on food and still go hungryBetter production systems exist for virtually all crops, but they are often disseminated too slowly
55% of habitable land and growing70% of human use of water, >60% wasted70-90% of farmers lose more carbon/year than put backHighest industry use of chemicalsMore environmental impact, including pollution, than any other human activityClimate change — 25+% of greenhouse gases that contribute to climate change
Source: World Wildlife Fund - US
6
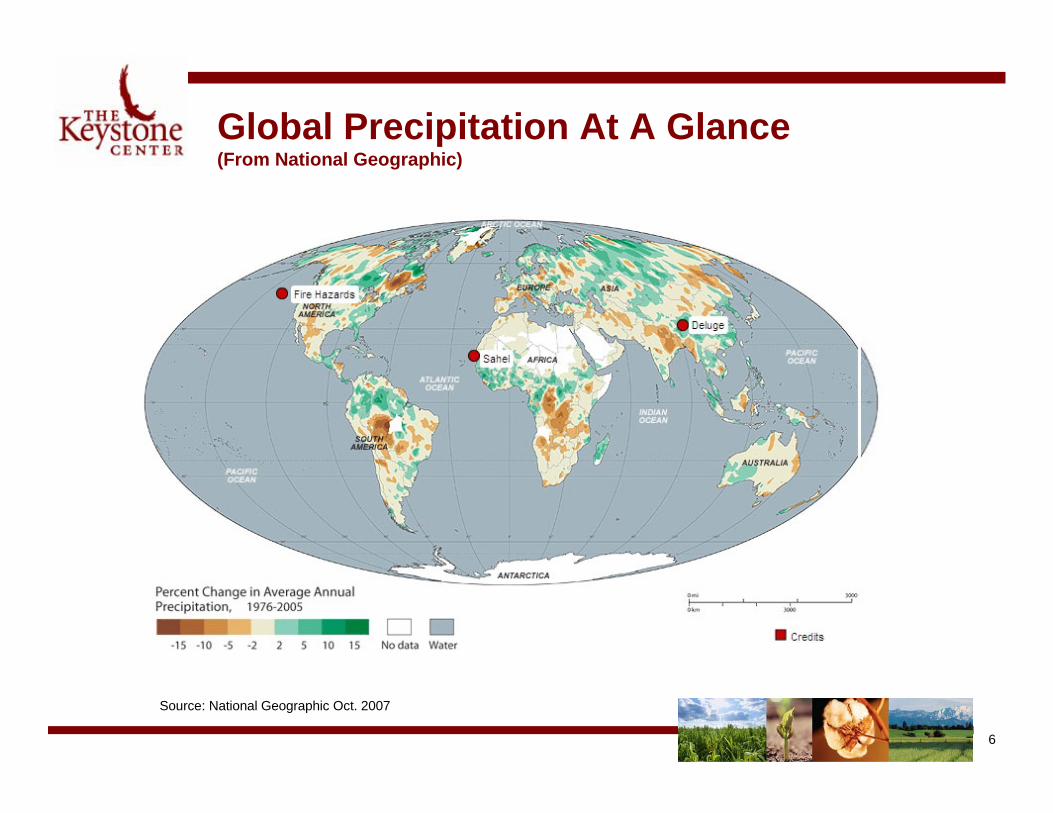
Global Precipitation At A Glance (From National Geographic)
Source: National Geographic Oct. 2007
7
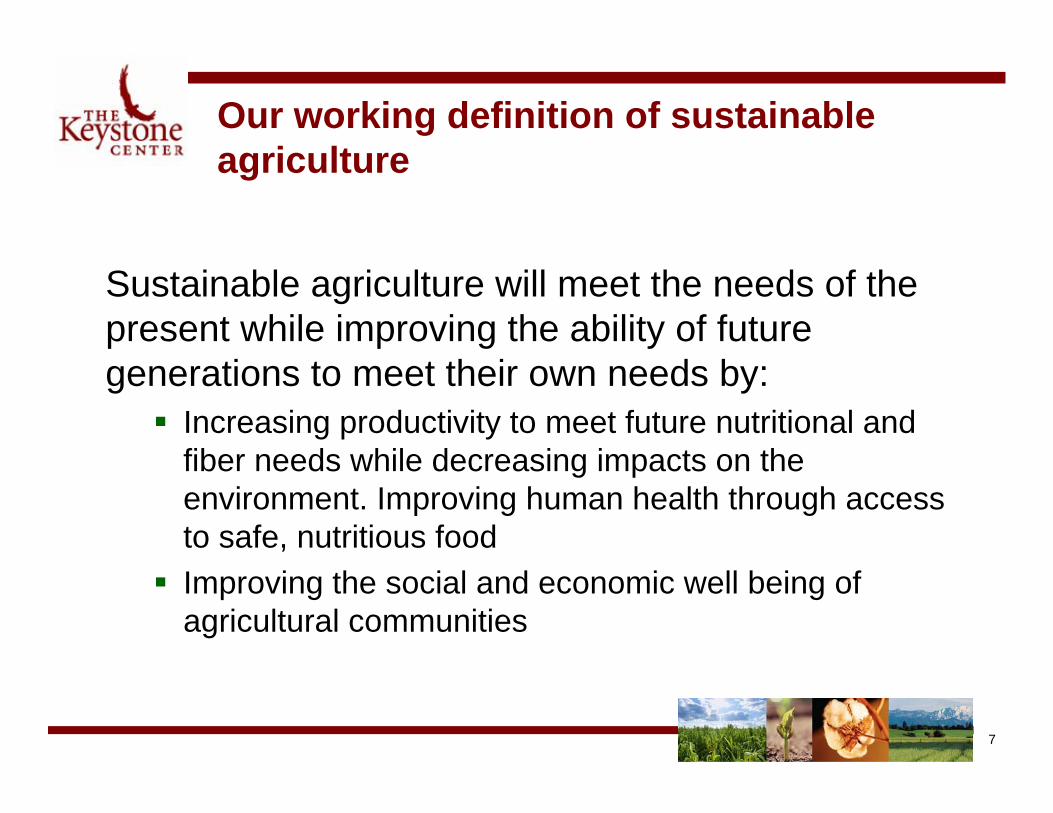
Our working definition of sustainable agriculture
Sustainable agriculture will meet the needs of the present while improving the ability of future generations to meet their own needs by:
Increasing productivity to meet future nutritional and fiber needs while decreasing impacts on the environment. Improving human health through access to safe, nutritious foodImproving the social and economic well being of agricultural communities

8
Premise: We can shift the discussion on sustainability in agriculture
We can:Focus on outcomes and results and allow producers to find the best way to achieve results through a full range of agriculturaltechnology choicesApply information at the grower level in support of larger, overarching goal of shifting the entire sustainability curveDrive change where the opportunity is greatest – throughout large area “conventional” agricultureEventually, create pull through the production system all the way to the consumer via partner companiesUse peer-reviewed science to identify goals and measure impacts, progress, and results

9
Water
Initial key impact areas for environmentally sustainable agriculture (Focus on Large Area Crops)
ExamplesImpact Area
Biodiversity, on-farm habitat, acres converted
Habitat
Water use, water effluent quality
Soil erosion, soil carbon, ground cover
Soil

10
What can be measured?
Work in Progress: Possible ideas :
Farmer Input: (Nitrogen usage, tillage, yields, green stripes, on farm wild habitat/biodiversityRemote Sensing: (crop residue, soil disturbance, water flow andpractices to prevent flow into streams, crop stressContinue other landscape Measurements (water quality etc.)
Broad Results such as reducing input per unit produced of: N, Soil Loss, Land used, Water added, etc., and added farmer viability
11
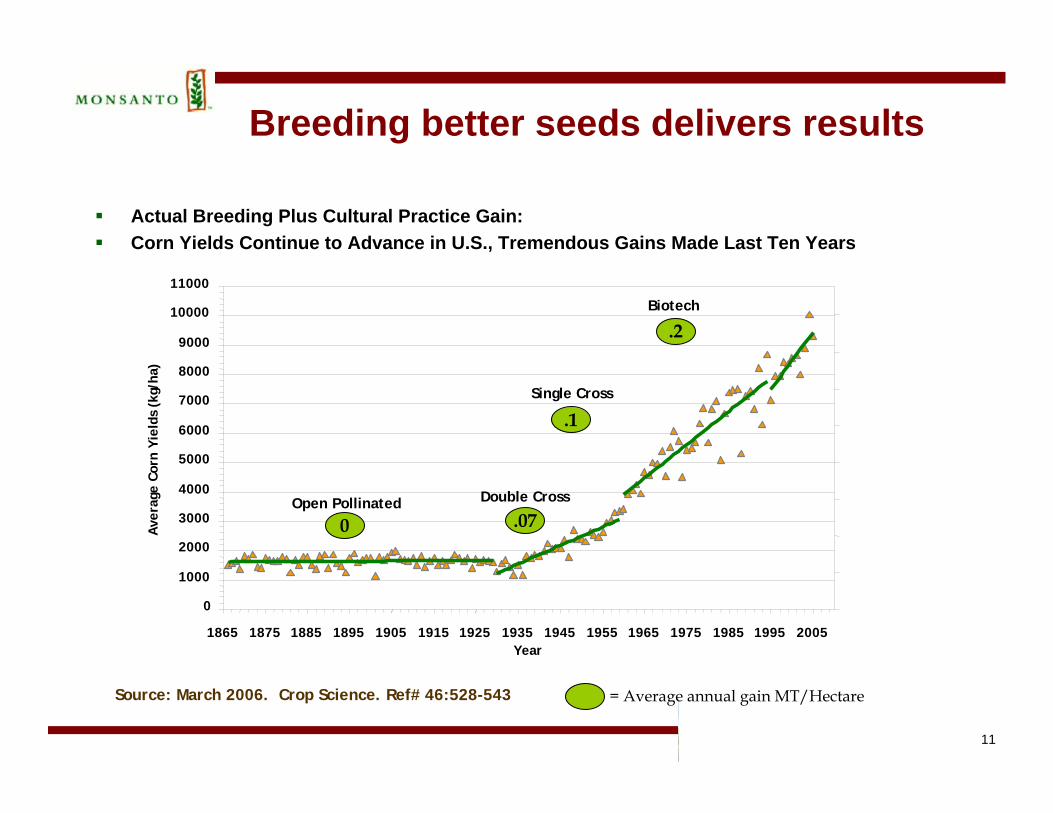
Breeding better seeds delivers results
Actual Breeding Plus Cultural Practice Gain: Corn Yields Continue to Advance in U.S., Tremendous Gains Made Last Ten Years
Source: March 2006. Crop Science. Ref# 46:528-543
0
1000
2000
3000
4000
5000
6000
7000
8000
9000
10000
11000
1865 1875 1885 1895 1905 1915 1925 1935 1945 1955 1965 1975 1985 1995 2005Year
Ave
rage
Cor
n Yi
elds
(kg
/ha)
Double CrossOpen Pollinated
Single Cross
Biotech
= Average annual gain MT/Hectare
.2
.1
.070

12
Working On Higher and More Stable Yields In Rainfed Settings
- Gene + Gene
Source: Monsanto field trial research, 2006.
2004 2005 2006
Hybrid 1
Percent yield difference vs. control
02468
101214
YIEL
D D
IFFE
REN
CE V
S.
CON
TRO
L (B
U/A
CRE)
Hybrid 1: 2004, 4 locations; 2005 5 locs; 2006, 1 loc (20 reps)
7.3% 10.5% 23.2%
NO
T TE
STED
2004 2005 2006
Hybrid 2
Percent yield difference vs. control
02468
101214
YIEL
D D
IFFE
REN
CE V
S.
CON
TRO
L (B
U/A
CRE)
Hybrid 2: 2004, not tested; 2005, 5 locs, 2006, 3 locs
10.9% 9.0%

13
Producing Higher Yields With Fewer Inputs Including Nitrogen
2006 FIELD RESULTS CONFIRM CONTINUED PERFORMANCE OF LEADS IDENTIFIED IN 2005
140
145
150
155
160
165
170
175
0
EVENT 1
EVENT 2
CONTROL
LEAD NITROGEN UTILIZATION GENE(ACROSS 3 LOCATIONS: ILLINOIS AND IOWA)
YIE
LD P
ER
AC
RE
Reduction in Applied Nitrogen
40 80 180
NITROGEN INPUT: LBS/ACRE
Source: Monsanto field trial research, 2006.

14
The Challenge Ahead
Technology can play a
big role
Demand
Farmer Health
Environment