the 1990s acceleration in labor productivity: causes · pdf filethe 1990s acceleration in...
TRANSCRIPT

FEDERAL RESERVE BANK OF ST. LOUIS REVIEW MAY/JUNE 2006 181
The 1990s Acceleration in Labor Productivity:Causes and Measurement
Richard G. Anderson and Kevin L. Kliesen
level, showed little pick up in productivitygrowth. Using more than a decade of vintage“real-time” data, we find that revisions to laborproductivity data have been large, in some casesso large as to fully reverse initial preliminaryconclusions regarding productivity growth slow-downs and accelerations.
The 1990s acceleration of labor productivityhas three important characteristics. First, it wasunforeseen. An example of economists’ typicalprojections during the mid-1990s is the 1996Economic Report of the President, prepared during1995, in which the Council of Economic Advisersforesaw no revolutionary change. The Councilforesaw labor productivity growth in the privatenonfarm business sector at an average annual rateof 1.2 percent from the third quarter of 1995 tothe end of 2002. This estimate largely extrapolatedrecent experience: productivity from 1973 to 1995had grown at an average annual rate of 1.4 percent.
O ver the past decade, economistshave reached a consensus that (i)the trend rate of growth of laborproductivity in the U.S. economy
increased in the mid-1990s and (ii) the underly-ing cause of that increase was technologicalinnovations in semiconductor manufacturingthat increased the rate of decrease of semicon-ductor prices.1 This productivity accelerationis remarkable because, unlike most of its prede-cessors, it continued with only a minor slow-down during the most-recent recession. In thisarticle, we briefly survey research on the genesisof the productivity rebound. We also examinethe “recognition problem” that faced economistsand policymakers during the 1990s when prelim-inary data, both economywide and at the industry
The acceleration of labor productivity growth that began during the mid-1990s is the definingeconomic event of the past decade. A consensus has arisen among economists that the accelera-tion was caused by technological innovations that decreased the quality-adjusted prices of semi-conductors and related information and communications technology (ICT) products, includingdigital computers. In sharp contrast to the previous 20 years, services-producing sectors—heavyusers of ICT products—led the productivity increase, besting even a robust manufacturing sector.In this article, the authors survey the performance of the services-producing and goods-producingsectors and examine revisions to aggregate labor productivity data of the type commonly discussedby policymakers. The revisions, at times, were large enough to reverse preliminary conclusionsregarding productivity growth slowdowns and accelerations. The unanticipated acceleration inthe services sector and the large size of revisions to aggregate data combine to shed light on whyeconomists were slow to recognize the productivity acceleration.
Federal Reserve Bank of St. Louis Review, May/June 2006, 88(3), pp. 181-202.
1 The first chapter of Jorgenson, Ho, and Stiroh (2005) surveys thedecrease in semiconductor prices.
Richard G. Anderson is an economist and vice president and Kevin L. Kliesen is an economist at the Federal Reserve Bank of St. Louis.The authors thank Aeimit Lakdawala, Tom Pollmann, Giang Ho, and Marcela Williams for research assistance.
© 2006, The Federal Reserve Bank of St. Louis. Articles may be reprinted, reproduced, published, distributed, displayed, and transmitted intheir entirety if copyright notice, author name(s), and full citation are included. Abstracts, synopses, and other derivative works may be madeonly with prior written permission of the Federal Reserve Bank of St. Louis.

Incoming data during 1995 and 1996 were notsignaling an increase in productivity growth.Gordon (2002, p. 245) notes that economists in1997 were still seeking to identify the causes ofthe post-1973 slowdown in productivity growth:“Those of us who participated in panels on pro-ductivity issues at the January 1998 meetings ofthe American Economic Association recall nosuch recognition [of a productivity growth rateincrease]. Rather, there was singular focus onexplaining the long, dismal period of slow pro-ductivity growth dating from 1972.”2 Today, withrevised data, we know that the productivity accel-eration started before 1995.
Labor productivity growth showed its resil-ience by slowing only modestly during the mild
2001 recession. Forecasters adopted new viewsof the trend. By 2001, the Council of EconomicAdvisors had increased its projection of theannual growth of structural labor productivity to2.3 percent per year. Other forecasters, includingmany in the Blue Chip Economic Indicators andthe Federal Reserve Bank of Philadelphia’s Surveyof Professional Forecasters, were even moreoptimistic.3 Yet, since the March 2001 NationalBureau of Economic Research (NBER) businesscycle peak, labor productivity has been strongerthan both these upward-revised forecasts and itsaverage following past cyclical peaks; the latterpoint is illustrated in Figure 1. Although no onecan be certain of future gains in productivity, itnow seems clear that the combination of lowerprices for information and communications tech-nology (ICT) equipment plus new related businesspractices have boosted the economy’s trend rate
Anderson and Kliesen
182 MAY/JUNE 2006 FEDERAL RESERVE BANK OF ST. LOUIS REVIEW
2 As the discussion in Edge, Laubach, and Williams (2004) indicates,Princeton University professor Alan Blinder in 1997 estimated thatfuture, near-term trend labor productivity growth was effectivelythe same as its average since 1974: 1.1 percent. Further, in 1999,Northwestern University professor Robert Gordon estimated atrend rate of growth of 1.85 percent; he then subsequently revisedthis up to 2.25 percent in 2000 and then to 2.5 percent in 2003.
20
18
16
14
12
10
8
6
4
2
0
–20 1 2 3 4 5 6 7 8 9 10 11 12 13 14 15 16 17 18 19
Percent Change from Peak Value, 2001:Q1 to 2005:Q4
Quarters after Peak
Current Estimate
Average Business Cycle
Figure 1
Nonfarm Labor Productivity
NOTE: The NBER’s business cycle dating committee on November 26, 2001, selected the first quarter of 2001 as the cyclical peak. Thebusiness-cycle average is calculated as the mean of the nine NBER post-World War II business cycles, excluding the 1980 and 2001recessions.
3 See the September 10, 2000, issue of the Blue Chip EconomicIndicators or the first quarter 2001 Survey of ProfessionalForecasters.

of productivity growth. We note that similarincreases in labor productivity growth haveoccurred in other eras and other countries, usuallyassociated with technological innovations.4
Second, the underlying cause was an increasein the rate of decrease of semiconductor prices and,in turn, of ICT capital equipment. In response tofalling ICT prices, producers in both services-producing and goods-producing sectors shiftedincreasing amounts of capital investment towardICT products, reducing in some cases purchasesof more traditional capital equipment. Subse-quently, many business analysts have noted that,following a gestation lag, the lower cost of ICTequipment has induced firms to “make everythingdigital” and reorganize their business practices;Friedman (2005) and Cohen and Young (2005)provide detailed case studies.
And third, the post-1995 productivity accel-eration is largely a services-producing sectorstory.5 After 1995, productivity growth in servicesincreased sharply while productivity growth inmanufacturing continued at approximately itsthen-extant pace. Ironically, the post-1973 slow-down in aggregate productivity growth also wasa services-producing sector story—but one inwhich productivity in services-producing sectorscollapsed.6 Post-1973 pessimists cited Baumol’s
(1967) analysis that services sectors had littlepotential to increase labor productivity andexpounded views that the expanding share ofservices in gross domestic product (GDP) fore-shadowed an eternal era of slow labor productivitygrowth for the U.S. economy.7 As early as the 1973productivity slowdown, however, the services-producing sector was a major user of informationtechnology, poised to benefit from improvementsin semiconductor manufacturing. Hence, the sig-nificant technological advances in the early 1990swere especially important for services-producingsectors (Triplett and Bosworth, 2004; Jorgenson,Ho, and Stiroh, 2005). The mechanism wasstraightforward: Sharp decreases in the pricesof semiconductors and related ICT capital goodsinduced services-sector firms to significantlyincrease their use of ICT capital, in turn increasingproductivity growth and, with it, productivitygrowth for the entire economy. Both then and now,three-quarters of private-sector real GDP arisesfrom services-producing sectors.
Poor data quality often has been cited as thebarrier to identifying the causes of the post-1973slowdown in services-sector productivity growth;see Griliches (1992 and 1994) or Sherwood (1994).Measurement issues for services-producing sectorshave a long history, largely focused on correctmeasures of “output,” including the price deflatorsnecessary for obtaining real output from nominalmagnitudes. As early as 1983, members of theFederal Open Market Committee (FOMC) ques-tioned the quality of data on output and productiv-ity in services-producing sectors; such discussionsbecame longer and more frequent after ChairmanGreenspan’s lengthy soliloquy at the December 22,1992, meeting.8 In 1996, Chairman Greenspannoted it was implausible that services-sector labor
Anderson and Kliesen
FEDERAL RESERVE BANK OF ST. LOUIS REVIEW MAY/JUNE 2006 183
4 Basu et al. (2004) compare and contrast the differing U.S. andU.K. experiences after 1995.
5 In this article, we follow the Bureau of Economic Analysis (BEA)data reporting schema. Before June 2004, the BEA followed the SIC(Standard Industrial Classification) schema. Services-producingindustries included transportation and public utilities; wholesaletrade; retail trade; finance, insurance, and real estate (FIRE), includ-ing depository and nondepository institutions; and services (busi-ness services, including computer and data processing services).Private goods-producing industries included agriculture, forestry,and fishing; mining; construction; and manufacturing. In June 2004,the BEA revised its schema to follow the 1997 North AmericanIndustry Classification System (NAICS). The composition ofservices-producing industries changed slightly to include utilities;wholesale trade; retail trade; transportation and warehousing;finance, insurance, real estate, rental and leasing (FIRE); professionaland business services, including computer systems design andrelated services; educational services, health care, and social assis-tance; arts, entertainment, recreation, accommodation, and foodservices; and other services, except government. Compared withthe SIC, the NAICS more consistently classifies high-technologyestablishments into the correct industry and provides increaseddetail on the services sector (Yuskavage and Pho, 2004). We do not,in this analysis, examine interactions between these redefinitionsand revisions to published data.
6 See Kozicki (1997).
7 Baumol (1967) argued that some services—including municipalgovernment, education, performing arts, restaurants, and leisuretime activities—had a “technological structure” that made long-term increases in the real cost of such services unavoidable becauseit was unlikely that productivity gains would be large enough tooffset increasing wages. Baumol did not suggest, however, that allservices-producing sectors were condemned to little or no produc-tivity growth even though some later authors attributed that posi-tion to him.
8 Anderson and Kliesen (2005) review the history of productivitydiscussions in the FOMC transcripts from 1982 to 1999.

productivity had not increased during the past 20years and requested the Board staff to conduct astudy of the quality of data for services-producingindustries. The resulting study—Corrado andSlifman (1999)—confirmed the problematic qual-ity of services-sector data but concluded that “theoutput, price, and unit-costs statistics for the non-financial corporate sector are internally consistentand economically plausible” (p. 332).9 Yet, evenin these data, measured productivity growth inmanufacturing was approximately double that innonmanufacturing: For 1989 to 1997, the increasesin output per hour were 2.9 and 1.4 percent formanufacturing and nonmanufacturing, respec-tively (Corrado and Slifman, 1999, p. 329, Table 1).
The situation has improved significantly inrecent years. During the past decade, data measure-ment programs at both the BEA and the Bureauof Labor Statistics (BLS) have produced well-measured data for the services sectors, culminatingin the BEA’s December 2005 publication of thefirst NAICS industry-level data fully consistentacross their input-output matrices, their annualindustry accounts, and the nationwide GDPnational income accounts system. Somewhatearlier, resolution of the vexing services-sectorproductivity problem occurred in 2000 whenthe BEA incorporated into the annual industryaccounts their October 1999 revisions to thenational income and product accounts (NIPA).10
Previously published data had shown somerebound in measured productivity growth forservices sectors, but services continued to lag wellbehind manufacturing. The revised sector andindustry data demonstrated that, far from beingthe laggard, labor productivity growth in services-producing sectors had exceeded productivitygrowth in manufacturing during the 1990s.
Two extensive recent analyses are Triplett andBosworth (2004) and Jorgenson, Ho, and Stiroh(2005). Unfortunately, the studies’ datasets andanalytics differ, making direct comparisons oftheir numerical productivity growth rates diffi-cult.11 For brevity, we cite results from only oneof the studies. Triplett and Bosworth (2004) findthat labor productivity in services-producingindustries increased at an annual average rate of2.6 percent between 1995 and 2001 (includingthe 2001 economic slowdown), slightly fasterthan manufacturing’s 2.3 percent pace. Services-producing sectors accounted for 73 percent of1995-2001 labor productivity growth and 76 per-cent of multifactor productivity growth (definedbelow). Increased use of ICT capital was the pri-mary cause behind the productivity acceleration:When weighted by its large share of the economy,increased ICT use in services accounts for 80 per-cent of the total contribution of ICT to increasedeconomywide labor productivity growth between1995 and 2001. Their conclusion? On page 2, theywrite, “As with labor productivity growth and
Anderson and Kliesen
184 MAY/JUNE 2006 FEDERAL RESERVE BANK OF ST. LOUIS REVIEW
9 Corrado and Slifman (1999) argued that most data problems werein the nonfinancial noncorporate sector, half of which was com-posed of difficult-to-measure services-sector firms. They concludedthat mismeasurement so contaminated these figures that data forthe nonfarm business sector should not be used for analysis.
10 During the 1990s, the BEA greatly expanded and improved itsindustry database, partly in response to controversy regardingproductivity growth. The BEA added gross output (shipments) byindustry in 1996 (Yuskavage, 1996). Gross output is more desirablefor productivity studies than gross product originating (value added),a point highlighted by Evsey Domar’s much-earlier quip that fewpeople find it interesting to study productivity in shoe manufactur-ing when leather is omitted. Interested readers can judge the impactof the October 1999 revisions by comparing studies before andafter their publication. Such a comparison is not included herebecause, in our opinion, methodological changes for the annualindustry accounts have been so large as to render comparisons ofvintage data of questionable value. Typical of the pre-revision analy-ses is Triplett and Bosworth (2001), a paper originally presentedat the January 2000 American Economic Association meetings.Ironically and with more than a touch of understatement, they notethat “The nonfarm multifactor productivity numbers are due forrevision in the near future, to incorporate the revisions to GDP that
were released in October, 1999. This will undoubtedly raise the non-goods estimate but not the manufacturing productivity estimate…”Shortly thereafter, they declared “Baumol’s disease” to be cured;see Triplett and Bosworth (2003 and 2006), the latter paper wasoriginally prepared for an April 2002 conference at Texas A&MUniversity. Interested readers might also compare Gordon (2000and 2003). One of the earliest studies using the revised data isStiroh (2002), which first appeared in January 2001 as FederalReserve Bank of New York Staff Report 115 (the published articlecontains later, revised data) and showed productivity accelerationsin broad service sectors, including wholesale and retail trade andfinance, insurance, and real estate.
11 Triplett and Bosworth use output and employment data from theBEA’s annual industry accounts and capital from the BLS’s capitalflow accounts. Their labor input measure is persons employed,not hours worked, and is not quality-adjusted. Although theseshortcomings perhaps bias upward their estimated level of laborproductivity, it seems unlikely that it distorts labor productivitygrowth significantly over shorter periods (i.e., 5 years or so).Jorgenson, Ho, and Stiroh measure output broadly to include theservices of household durable goods and housing. They also useconstant-quality index numbers for labor and capital input.

multifactor productivity growth, the IT [informa-tion technology] revolution in the United Statesis a services industry story.” It is important to note,as they do, that not all services-sector industrieshad productivity increases; most did, but someservices industries continue to have negativemeasured productivity growth.
THE ROLE OF SEMICONDUCTORPRICES
Understanding the sources of the labor produc-tivity acceleration makes it easier to appreciatethe difficulties in measuring it. Economists definelabor productivity as the ratio of the economy’sreal output, Y, to total hours of labor input, H, Y/H.Let us assume that total output is produced bymeans of an aggregate production function, Y =A × F(H,K), where K measures the flow of produc-tive services from the economy’s capital stockand A measures increases in output not due toincreases in labor (H) or capital (K), that is, multi-factor productivity (MFP).12 In this framework,there are two sources of increases in labor produc-tivity: capital deepening and increases in MFP.Capital deepening is defined as increases in theamount of capital equipment available per hourworked, K/H. Increases in MFP often are referredto as improvements “in the ways of doing things,”that is, changes in firms’ business managementpractices. The growth rate of A may be writtenas, and often is measured as, a residual by meansof the equation
,
where gA, gY, gK, and gH, respectively, are thegrowth rates of MFP, output, capital services, andlabor services and ν is the share of labor in totaloutput. When increases in output, Y, are fullyaccounted for by increases in H or K by means ofthe function F (H,K ), then by definition there isno change in A, that is, no increase in MFP (but
g g g gA Y K H= − −( ) +⎡⎣ ⎤⎦1 ν ν
labor productivity may continue to increasethrough capital deepening).
Note that mismeasurement of H or K will causemismeasurement of MFP. Specifically, if H and Kcontain unmeasured increases in quality, thenmeasured H and K will tend to understate the flowof labor and capital services and tend to overstategrowth of MFP.13 Productivity statistics publishedby the BLS use, for H, a constant-quality index oflabor input that adjusts for such changes by usinghourly wage rates to combine the working hoursof workers with different characteristics.14 For thebrief time periods considered here, labor qualityadjustments likely matter little: For 1995-2000,Jorgenson, Ho, and Stiroh (2005) find that thedifference between aggregate economywide hoursat work and their constant-quality quantity indexof labor volume is small. The constant-qualityindex grew only 0.34 percent faster than totalhours worked during the period, largely due tothe more rapid growth of higher-paid workers.
Measuring capital input, K, has similar issues.The productive capital stock of the United Statesis a heterogeneous collection of producers’ durableequipment and structures, each with differentspecific characteristics. Although macroecono-mists tend to measure the “capital stock” by sum-ming the constant-dollar purchase prices of allsuch capital assets (after a depreciation allowance),a superior practice for productivity analysis is tomeasure K as a constant-quality quantity index ofthe flow of capital services.15 Jorgenson, Ho, and
Anderson and Kliesen
FEDERAL RESERVE BANK OF ST. LOUIS REVIEW MAY/JUNE 2006 185
12 For simplicity, we are omitting intermediate inputs, making totaloutput equal to value added (real GDP originating). For a richermodel that contains intermediate inputs, see Jorgenson, Ho, andStiroh (2005). The term A also often is referred to as the Solowresidual.
13 This relationship has been well-known at least since Solow (1960).Note that Solow (1957) uses a capital stock measure that is notadjusted for quality change and, as a result, captures almost allproductivity improvements in A as MFP. Solow (2001) lauds theintroduction of constant-quality labor and capital services indexnumbers. Many macroeconomic studies, however, continue to usecapital stock measures unadjusted for quality; see, for example,Jones (2002).
14 Jorgenson, Gollop, and Fraumeni (1987) is the classic study. For arecent discussion that also provides newly constructed measuresfor ICT-related sectors, see Jorgeonson, Ho, and Stiroh (2005,Chap. 6).
15 Hulten (1992) has a clear exposition of the trade-off betweenmeasuring quality change in capital goods and measuring multi-factor productivity. Pakko (2002a) explores whether applying rea-sonable quality adjustments to non-ICT capital investment duringthe 1990s would change the then-published profile of investmentspending. He concludes it would not.

Stiroh (2005) emphasize that incorporating qualitymeasures for capital services is essential to under-standing the 1990s productivity acceleration.Many analysts have noted the short service lives,rapid depreciation rates, and high marginal prod-ucts of ICT equipment. Further, the technologicalinnovations that accelerated the fall in semicon-ductor prices have also allowed the creation ofentirely new types of ICT capital goods (as wellas innovative consumer goods).16 During the1990s, for example, businesses shifted their capitalinvestment spending patterns toward relativelyshorter-lived ICT capital; information processingequipment and software comprised 25.1 percentof private fixed investment in 2002 versus 11.4percent in 1977. Both Triplett and Bosworth (2004)and Jorgenson, Ho, and Stiroh (2005) use quality-adjusted capital stock data from the BLS con-structed using methods pioneered by Jorgenson.To be specific, a constant-quality quantity indexfor investment in asset j can be written as
,
where PI,j is a constant-quality price index thatreflects changes in the productive characteristicsand perceived “quality” of the capital asset (timesubscripts are omitted). If PI,j is correct, then Ij
measures the quantity of new nominal investmentin constant-quality “efficiency units” relative tothe base year of the price index (Hulten, 1990).Capital stocks are constructed by means of thesemethods, for example, in Jorgenson, Ho, andStiroh (2005, Chap. 5).
Solow (2001) emphasizes that constant-qualityprice and quantity indices are subtle concepts,as is the separation of capital deepening from MFP.Fundamentally, all productivity increases aredue to increases in knowledge: In some cases, aneconomist might measure these as increases inquality-adjusted capital and capital deepening;in other cases the economist might identify the
IPj
j
I j
=Nominal Investment
,
gains as MFP after quality adjustments have beenmade to labor and capital inputs. Regardless,increases in the knowledge of how to producegoods and services is the fundamental cause ofproductivity growth. Quality adjustments oftenare subjective and uncertain. Judgment errors inthe PI,j necessarily affect measures of both capitaldeepening and MFP. Overestimates of increasedquality potentially can inflate constant-qualityquantity indices to the extent that MFP vanishes.Solow offers an example to illustrate the issue.Consider a competitive two-sector economy inwhich one sector produces capital goods fromlabor (only) and the other produces consumergoods from labor and capital. Let us assume atechnological innovation occurs that reduces thequantity of labor required to produce one unit ofthe capital good but does not change its physicalcharacteristics. In this case, both the observedmarket price and the constant-quality price indexfall (no quality adjustment is made to the observedprice of the capital good). As profit-maximizingproducers of consumer goods increase the quantityof now less-expensive capital per hour of labor,both the physical capital stock and the constant-quality quantity index (as well as the capital-labor ratio) will increase. Alternatively, startingfrom the same two-sector economy as before, letus assume a technological innovation occurs thatincreases the productivity of each unit of capitalin the production of consumer goods but does notchange the amount of labor required to produceeach unit of the capital good. In this case, theobserved price of the capital good is unchangedbut the constant-quality price index for capitalgoods falls. As profit-maximizing producers ofconsumer goods replace older capital with newercapital, the constant-quality quantity index forcapital will increase even if the physical capitalstock does not, and the ratio of constant-qualitycapital units to labor volume will rise. Under mildassumptions, the long-run equilibrium economiceffect of the two alternative technological inno-vations is exactly the same, although the adjust-ment may entail a long lag when the technologicalimprovement is largely or entirely embedded in
Anderson and Kliesen
186 MAY/JUNE 2006 FEDERAL RESERVE BANK OF ST. LOUIS REVIEW
16 Innovations in communications equipment include cell phones,high-density multiplexers for fiber optic cable, and voice-over-Internet-protocol (VOIP) telephone equipment. Doms (2005) pro-vides a survey.

the new capital good (Pakko, 2002b and 2005).The widely used putty-clay model of Greenwood,Hercowitz, and Krussell (1997) is similar toSolow’s example. In their model, a single outputgood can be “hardened” into consumption goods,investment in structures, or investment in equip-ment. The production function for output includeslabor and both types of capital goods, allowingrich feedback effects among investment-specifictechnological progress, production of new capitalgoods, and capital deepening.17
Solow’s example is helpful in understandinghow investment in ICT equipment affects produc-tivity. To be specific, it is useful to distinguishbetween increases in productivity at firms thatmake high-technology products and at firms thatsolely use ICT.18 For the former, technologicalprogress in semiconductor manufacturing allowsmore computing power to be produced from thesame inputs of capital and labor because suchfirms are large users of information technologyequipment in development and production. Forthe latter, decreases in the cost of informationtechnology induce capital deepening—that is,they induce the firm to provide additional capitalequipment for each worker. Examples includeinitiating/expanding e-commerce on the Internet;improving the timeliness of linkages betweenpoint-of-sale cash registers and inventory manage-ment systems; and improving network links amonggeographically separated sites. Studies suggestthat such changes in business practice may takeconsiderable time to implement; hence, theresponse of productivity to changes in investment
in ICT equipment varies among firms and indus-tries. Such variation may delay timely recognitionthat forces have arisen, which, eventually, willincrease productivity economywide.
EMPIRICAL ESTIMATES OFACCELERATING AGGREGATELABOR PRODUCTIVITY
The above framework has been used by anumber of authors to measure the effect of invest-ment in ICT on productivity growth. Among themore important aggregate (not industry-level)studies are Oliner and Sichel (2002) and Jorgenson,Ho, and Stiroh (2002, 2003, and 2004). Althoughthe studies’ details differ, at the aggregate levelof the national economy the authors attributeapproximately three-fifths of the acceleration inlabor productivity during the second half of the1990s to capital deepening and two-fifths toincreases in MFP. In turn, the authors find thatapproximately four-fifths of the capital deepen-ing is due to investment in ICT equipment, withincreased spending on traditional business equip-ment accounting for the other one-fifth. Bothstudies emphasize that purchases of ICT equip-ment were boosted by rapid decreases in the pricesof such equipment, due in large part to rapidlyfalling prices of component semiconductors, andperhaps displaced to some extent purchases oftraditional equipment.
As an example of the interaction betweenmeasurement and economic modeling, considerthe Oliner and Sichel (2002) model. In this model,the rate of increase in MFP is measured by theinverse of the rate of decrease of semiconductorprices, creating a direct link between observeddecreases in semiconductor prices and unobservedincreases in productivity growth. The intuitionis that, because semiconductor prices are fallingrapidly relative to the aggregate price level, MFPat semiconductor manufacturers must be increas-ing; if not, the firms would exit the industry. Theeffect of this measurement technique is that thesharp decline in semiconductor prices in 1997,shown in Figure 2, appears immediately as an
Anderson and Kliesen
FEDERAL RESERVE BANK OF ST. LOUIS REVIEW MAY/JUNE 2006 187
17 Greenwood, Hercowitz, and Krussell (1997) compare their constant-quality capital stock measures for 1954-90, built from data as pub-lished circa early 1994, to the capital stock measures calculatedby the BEA (which at that time lacked quality adjustment) but notto the constant-quality quantity indices of the BLS. See Dean andHarper (2001) and Jorgenson, Landefeld, and Nordhaus (2006) forcomparisons of the BEA and BLS capital measures.
18 Readers are cautioned that Solow’s example, while illustrative, isonly an example; recall he assumes that capital goods are madefrom labor only. In the real world, semiconductor manufacturingis a large user of its own products in the form of computer-assisteddesign and manufacturing. In the model of Greenwood, Hercowitz,and Krussell (1997), the economy’s output can be hardened intocapital which, in following periods, is an input to the productionof more output, including future capital goods.

increase in labor productivity growth. Morerecent estimates provided to the authors by DanSichel, shown in Figure 2, suggest that the directcontribution from the semiconductor industrywas responsible for 0.08 percentage points of the0.37 percent growth of MFP from 1974 to 1990 and0.13 percentage points of the 0.58 percent growthfrom 1991 to 1995; after 1995, the proportionschange.19 He estimates that the direct contributionfrom the semiconductor industry from 1996 to2003 was responsible for 0.40 percentage pointsof the economy’s total 1.34 percent annual growthof MFP.
Complementary analyses are presented byJorgenson, Ho, and Stiroh (2002 and 2004). (Thelatter paper’s results differ from the former’sbecause of data revisions.) In their 2004 analysis,labor productivity (adjusted for shifts in laborquality) increased during the 1995-2003 period ata rate 1.6 percentage points greater than duringthe 1973-95 period; they attribute a little less thanthree-fifths of this increase to capital deepening.
If the acceleration of productivity was drivenby an increase in the rate of decrease of semicon-
ductor (and computer) prices, just how fast didprices fall? As shown in Figure 2, semiconductorprices decreased throughout the 1990s with therate of decrease accelerating during the latter halfof the decade. Caution must be used in interpretingthese figures, however, because rapid technologicalchange has introduced thorny quality-adjustmentproblems. The caution expressed by Gullicksonand Harper (2002) is typical:
These findings rest on estimated trends for hightech inputs and outputs that incorporate adjust-ments to account for changes in their quality.Many of the high tech input and output growthrates are well up in the double-digit percentagerange. These extraordinary trends, in turn, reston the use of quality adjusted price indexes indeflation. These indicate that prices for hightech goods of constant quality have fallen veryrapidly. These price trend estimates have with-stood much scrutiny, but we must emphasizetheir importance for our conclusions. Whileit is likely that real output trends have beenunderestimated in many or all of the servicesector industries with negative MFP trends, itis also possible that the growth trends for hightech inputs have been overestimated. Under-estimating service sector output trends wouldbias the aggregate productivity trend down-
Anderson and Kliesen
188 MAY/JUNE 2006 FEDERAL RESERVE BANK OF ST. LOUIS REVIEW
19 Unpublished estimates received from Dan Sichel via e-mail corre-spondence on June 28, 2004.
0
1
2
3
4
–1
–2
–30
–20
–10
0
10
–40
–50
–60
–70
–801983 1986 1989 1992 1995 1998 2001 2004
Percent PercentContribution from Capital Deepening
Contribution from MFPPercent Change in Relative Semiconductor Prices (right axis)
Figure 2
Contributions to Labor Productivity Growth and Relative Changes in Semiconductor Prices
SOURCE: Productivity data, Dan Sichel (via e-mail); semiconductor prices, BLS.

ward. Overestimating high tech input andoutput trends would bias the aggregate produc-tivity trend upward...We can express a concernthat the “measurement playing field” may notbe level. We have very intricate means of mak-ing quality adjustments to high tech goods, butwe have few means to make quality adjust-ments to service outputs.
In other cases, the survey sample for someproducts, such as semiconductors, has changed.20
Holdway (2001, p. 15), cautions:
It would be disingenuous to imply that the PPIhas been able to properly value and account fortechnological change in its cmpu [CPU] pricemeasurements. The standard PPI methodologiesfor valuing quality change [are] rather limitedwhen faced with quality improvements that areaccompanied by reduced input costs due toshifts in the production function.
Holdway also notes that the apparent accel-eration of semiconductor price decreases duringearly 1997, as shown in Figure 2, most likely is aresult of the introduction of secondary-sourcepricing data.21 Interested readers also should seeGrimm (1998) and Landefeld and Grimm (2000).Since 2000, the relative price of quality-adjustedsemiconductors (and related products) hasdecreased at a slower rate than during the latterpart of the 1990s; see Figure 2. Even though therelative prices of semiconductors fell by approx-imately 38 percent in 2004, this was less than itsaverage decline of approximately 65 percent from1998 to 2000.
LABOR PRODUCTIVITY:MEASUREMENT, VOLATILITY,AND REVISIONS
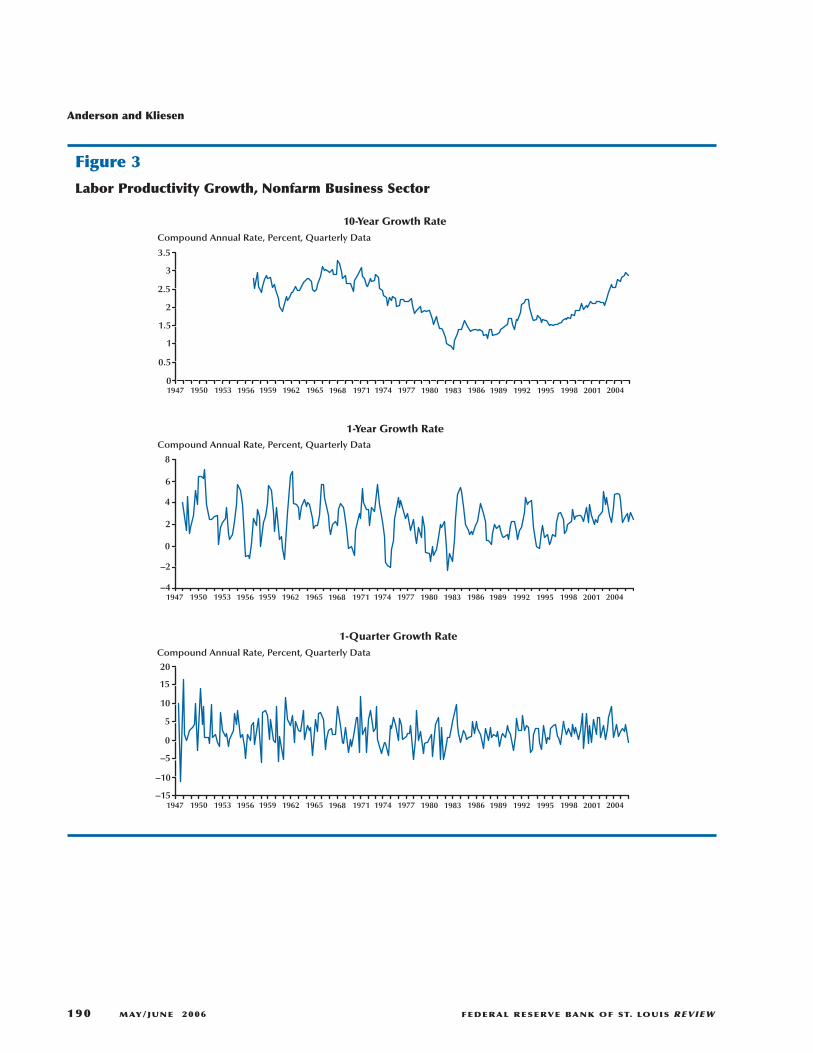
Published labor productivity growth rateshave two characteristics that complicate recogniz-ing changes in trend growth: volatility and revi-sions. Volatility is illustrated in Figure 3, whichshows compound annual growth rates calculatedfrom the most recently published data for 1-, 4-,and 40-quarter intervals. The high volatility isobvious. Beyond volatility, the figure also illus-trates that “trend” labor productivity growth sinceWorld War II appears to have gone through threephases: more rapid growth from 1948 to 1973;slower growth from 1973 to 1994; and more rapidgrowth beginning circa 1995. Measured laborproductivity growth in the nonfarm businesssector, for example, averaged 3 percent per annumduring 1949 to 1972 but less than half this paceduring 1973 to 1994, despite strong productivitygrowth in manufacturing.
Since 1995, the pace of productivity growthin the total nonfarm business sector has been aboutequal to its rate during the earlier high-growthperiod of 1949 to 1972; for the larger total privatebusiness sector, growth over the past 10 years stillremains modestly below its earlier pace. The lowertwo sections of Table 1 decompose productivitygrowth into growth of its numerator (output) andof its denominator (hours). The increase in produc-tivity growth from 1973-94 (column 2) to 1995-2004 (column 3) reflects both more rapid growthof the numerator (output) and slower growth ofthe denominator (hours). For broad sectors, thetable shows that the post-1973 productivity growthslowdown (compare columns 1 and 2) largely wasdue to slowdowns in the services and nondurablemanufacturing sectors—durable manufacturing’slabor productivity growth increased modestlythroughout the slowdown period. During the mostrecent decade, durable manufacturing’s produc-tivity growth has jumped to an average annualpace of approximately 5.75 percent, double its1949-72 pace.
Published measurements of the economy’soutput and labor input are frequently revised. Notonly do data revisions complicate the task facing
Anderson and Kliesen
FEDERAL RESERVE BANK OF ST. LOUIS REVIEW MAY/JUNE 2006 189
20 For semiconductor prices, for example, the BLS has a series in theproducer price index, the BEA has a series used in the nationalincome accounts, and the Federal Reserve Board has a pricemeasure used in its industrial production index. See, for example,Hulten (2001). The semiconductor price series plotted in Figure 7is the PPI measure relative to the GDP price index.
21 Secondary source prices are price figures collected from catalogsand industry publications, rather than from the manufacturer’sprice list. Holdway doesn’t speculate on whether secondary-sourceprice data, if available, might change the pre-1997 trend, but theabsence of such data introduces a risk into any study that attributesthe productivity acceleration to more rapid price decreases: Wouldthe studies reach the same conclusion if the rate of price decreasefrom 1993 to 1997 had been the same as that beginning in 1997?Or did the decision to solicit secondary-source price data reflectobservations of increased pricing pressure?
Anderson and Kliesen
190 MAY/JUNE 2006 FEDERAL RESERVE BANK OF ST. LOUIS REVIEW
1947 1950 1953 1956 1959 1962 1965 1968 1971 1974 1977 1980 1983 1986 1989 1992 1995 1998 2001 2004
Compound Annual Rate, Percent, Quarterly Data
3.5
3
2.5
2
1.5
1
0.5
0
8
6
4
2
0
–2
–4
20
15
10
5
0
–5
–10
–15
1947 1950 1953 1956 1959 1962 1965 1968 1971 1974 1977 1980 1983 1986 1989 1992 1995 1998 2001 2004
1947 1950 1953 1956 1959 1962 1965 1968 1971 1974 1977 1980 1983 1986 1989 1992 1995 1998 2001 2004
Compound Annual Rate, Percent, Quarterly Data
Compound Annual Rate, Percent, Quarterly Data
10-Year Growth Rate
1-Year Growth Rate
1-Quarter Growth Rate
Figure 3
Labor Productivity Growth, Nonfarm Business Sector

policymakers—changing perceived strength orweakness of economic conditions that inform theirjudgments—but they are often significant enoughto dramatically alter economic history.22 As anexample, each year the BEA revises the nationalincome and product accounts and the BLS revisesemployment and aggregate hours worked in theestablishment survey. Selected revisions, and theireffects, are shown in Table 2. For 1998 and 1999,for example, measured output growth in the sub-
Anderson and Kliesen
FEDERAL RESERVE BANK OF ST. LOUIS REVIEW MAY/JUNE 2006 191
sequent, revised data is sharply higher than in theearlier, preliminary data.23 Beginning with 2001,however, the pattern changed: Measured outputgrowth in the revised data has tended to be lowerthan in previous, preliminary figures. The NIPArevisions published during mid-2005, for example,trimmed measured real GDP growth over the pre-vious three years by 0.3 percentage points peryear, to approximately 3.25 percent.
Table 1Decomposition of Average Labor Productivity Growth for the Business Sector
Growth for periods indicated
1949-72 1973-94 1995-2005 1949-2005
Output per hour
Business 3.23 1.58 2.76 2.49
Nonfarm business 2.77 1.48 2.69 2.25
Manufacturing 2.58 2.59 4.44 2.94
Durable 2.64 3.02 5.86 3.40
Nondurable 2.83 1.90 2.85 2.47
Nonfinancial corporate business 2.61 1.40 3.34 2.21
Output
Business 4.10 3.18 3.61 3.65
Nonfarm business 4.22 3.17 3.64 3.70
Manufacturing 3.74 2.51 2.38 3.00
Durable 4.21 2.87 4.19 3.68
Nondurable 3.48 1.90 0.16 2.22
Nonfinancial corporate business 5.51 3.23 4.27 4.17
Hours
Business 0.84 1.57 0.83 1.12
Nonfarm business 1.41 1.66 0.92 1.41
Manufacturing 1.14 –0.08 –1.97 0.05
Durable 1.53 –0.15 –1.58 0.27
Nondurable 0.63 0.00 –2.61 –0.25
Nonfinancial corporate business 2.86 1.81 0.90 1.92
NOTE: Compounded annual growth rates using quarterly data: 1949:Q1 to 1972:Q4; 1972:Q4 to 1994:Q4; 1994:Q4 to 2005:Q4. Datafor nonfinancial corporations begins in 1958:Q1 and ends in 2005:Q3. Data for total manufacturing and durable and nondurablemanufacturing are on an SIC basis prior to 1987. Data for total manufacturing and durable and nondurable manufacturing are on anSIC basis prior to 1987.
SOURCE: BLS.
22 See Himmelberg et al. (2004), Kozicki (2004), Orphanides andvan Norden (2005), or Runkle (1998).
23 The 1999 revisions, it should be noted, were boosted by thereclassification of software purchased by businesses as fixedinvestment, rather than as an intermediate expense; see Gullicksonand Harper (2002).

Anderson and Kliesen
192 MAY/JUNE 2006 FEDERAL RESERVE BANK OF ST. LOUIS REVIEW
Table 2Major Statistical Revisions Since 1996 and Real-Time Estimates of Their Effects
Estimated Publication date Statistical series Major aspects of revision magnitude of revision
January 1996 Comprehensive revision Switch to chain-weighted price Revised estimates show real GDPof the NIPA indices from fixed-weighted grew at a 3.2 percent annual
price indices in the NIPA. rate from 1959 to 1984, 0.2Government investment defined percentage points faster than differently. New methodology for old estimate. Real GDP growthcalculating depreciation of fixed from 1987 to 1994 was loweredcapital. 0.1 percentage point.*
July 1998 Annual revision of the Updated source data. Methodology From 1994:Q4 to 1998:Q1 theNIPA changes to expenditures and growth of real GDP was revised
prices for autos and trucks; 0.3 percentage points higher toimproved estimates for several 3.4 percent; growth of real fixedcategories of consumer investment revised 0.6expenditures for services; new percentage points higher to 12.7method of calculating change in percent; growth of GDP pricebusiness inventories; some index reduced 0.3 percentagepurchases of software by points to 1.8 percent.businesses classified as expenses(removed from business fixedinvestment).
February 1999 Consumer price index (CPI) Switch to geometric means According to the BLS, this switchestimation to eliminate lower- will reduce the annual rate oflevel bias; affected 61 percent of increase of the CPI by 0.2consumer expenditures. percentage points per year.
According to the CEA,methodological changes to theCPI from 1994 to 1999 reducedthe annual rate of increase ofthe CPI by 0.6 percentage points in 1999 compared with the 1994 estimate.†
October 1999 Comprehensive revision Introduction of CPI geometric From 1987 to 1998, these revisionsof the NIPA weights; classification of boosted the annual rate of
software as a fixed investment; growth of real GDP by an incorporated data from the average of 0.4 percentage pointslatest 5-year economic census per year.‡and 1992 benchmark input-outputaccounts.
July 2001 Annual revision of the Updated source data (for example, Growth of real GDP duringNIPA Census Bureau Annual Surveys); revision period (1998:Q1 to
new price index for 2001:Q1) reduced from 4.1communications equipment from percent to 3.8 percent Federal Reserve Board; monthly (compared with pre-revisiondata used to calculate GDP estimates).converted from SIC to NAICS.
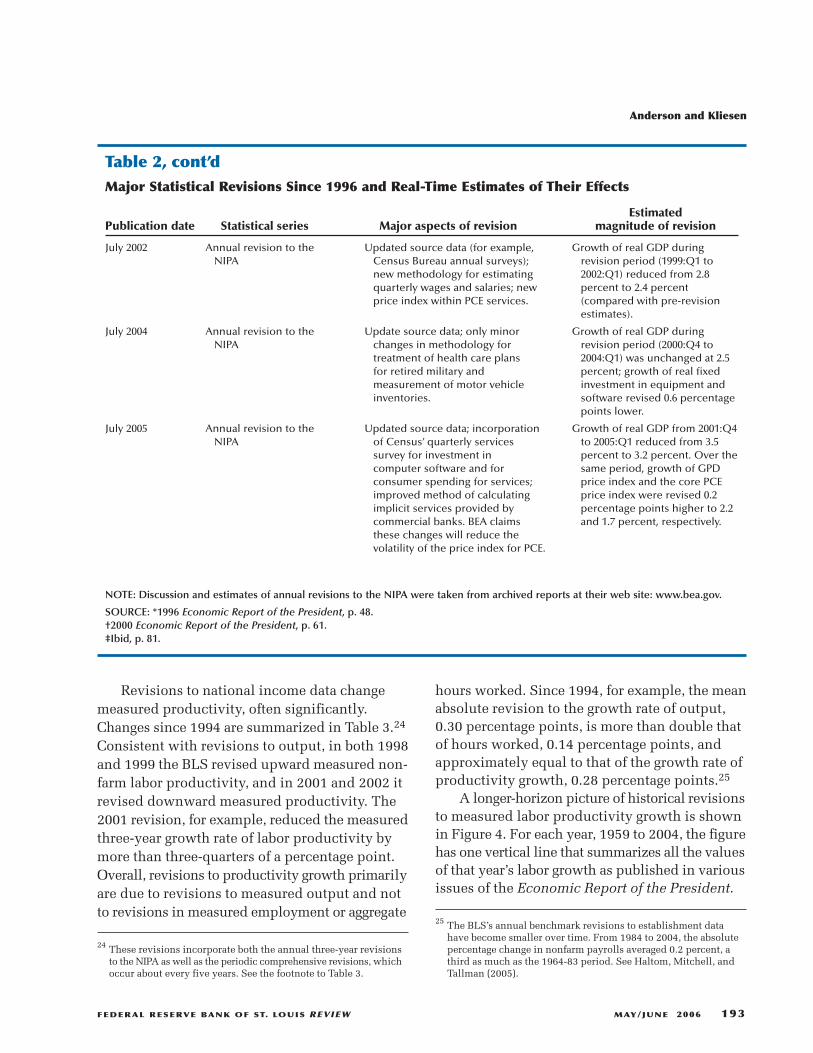
Revisions to national income data changemeasured productivity, often significantly.Changes since 1994 are summarized in Table 3.24
Consistent with revisions to output, in both 1998and 1999 the BLS revised upward measured non-farm labor productivity, and in 2001 and 2002 itrevised downward measured productivity. The2001 revision, for example, reduced the measuredthree-year growth rate of labor productivity bymore than three-quarters of a percentage point.Overall, revisions to productivity growth primarilyare due to revisions to measured output and notto revisions in measured employment or aggregate
hours worked. Since 1994, for example, the meanabsolute revision to the growth rate of output,0.30 percentage points, is more than double thatof hours worked, 0.14 percentage points, andapproximately equal to that of the growth rate ofproductivity growth, 0.28 percentage points.25
A longer-horizon picture of historical revisionsto measured labor productivity growth is shownin Figure 4. For each year, 1959 to 2004, the figurehas one vertical line that summarizes all the valuesof that year’s labor growth as published in variousissues of the Economic Report of the President.
Anderson and Kliesen
FEDERAL RESERVE BANK OF ST. LOUIS REVIEW MAY/JUNE 2006 193
25 The BLS’s annual benchmark revisions to establishment datahave become smaller over time. From 1984 to 2004, the absolutepercentage change in nonfarm payrolls averaged 0.2 percent, athird as much as the 1964-83 period. See Haltom, Mitchell, andTallman (2005).
Table 2, cont’dMajor Statistical Revisions Since 1996 and Real-Time Estimates of Their Effects
Estimated Publication date Statistical series Major aspects of revision magnitude of revision
July 2002 Annual revision to the Updated source data (for example, Growth of real GDP duringNIPA Census Bureau annual surveys); revision period (1999:Q1 to
new methodology for estimating 2002:Q1) reduced from 2.8quarterly wages and salaries; new percent to 2.4 percent price index within PCE services. (compared with pre-revision
estimates).
July 2004 Annual revision to the Update source data; only minor Growth of real GDP duringNIPA changes in methodology for revision period (2000:Q4 to
treatment of health care plans 2004:Q1) was unchanged at 2.5for retired military and percent; growth of real fixedmeasurement of motor vehicle investment in equipment andinventories. software revised 0.6 percentage
points lower.
July 2005 Annual revision to the Updated source data; incorporation Growth of real GDP from 2001:Q4NIPA of Census’ quarterly services to 2005:Q1 reduced from 3.5
survey for investment in percent to 3.2 percent. Over thecomputer software and for same period, growth of GPDconsumer spending for services; price index and the core PCEimproved method of calculating price index were revised 0.2implicit services provided by percentage points higher to 2.2commercial banks. BEA claims and 1.7 percent, respectively.these changes will reduce thevolatility of the price index for PCE.
NOTE: Discussion and estimates of annual revisions to the NIPA were taken from archived reports at their web site: www.bea.gov.
SOURCE: *1996 Economic Report of the President, p. 48.†2000 Economic Report of the President, p. 61.‡Ibid, p. 81.
24 These revisions incorporate both the annual three-year revisionsto the NIPA as well as the periodic comprehensive revisions, whichoccur about every five years. See the footnote to Table 3.

The lower and upper ends of each line correspondto the lowest and highest published growth rates,respectively, for that year, while the “dot” indi-cates the most recent estimate. For many years,the minimum-to-maximum range equals orexceeds 2 percentage points. Ranges for years after1995 are smaller, perhaps due to better measure-ment techniques, or perhaps because there arefewer observations.
Further insight can be gained from “casestudies” of periods during which breaks in trendproductivity growth occurred. Here, we consider1973 and 1995-96.
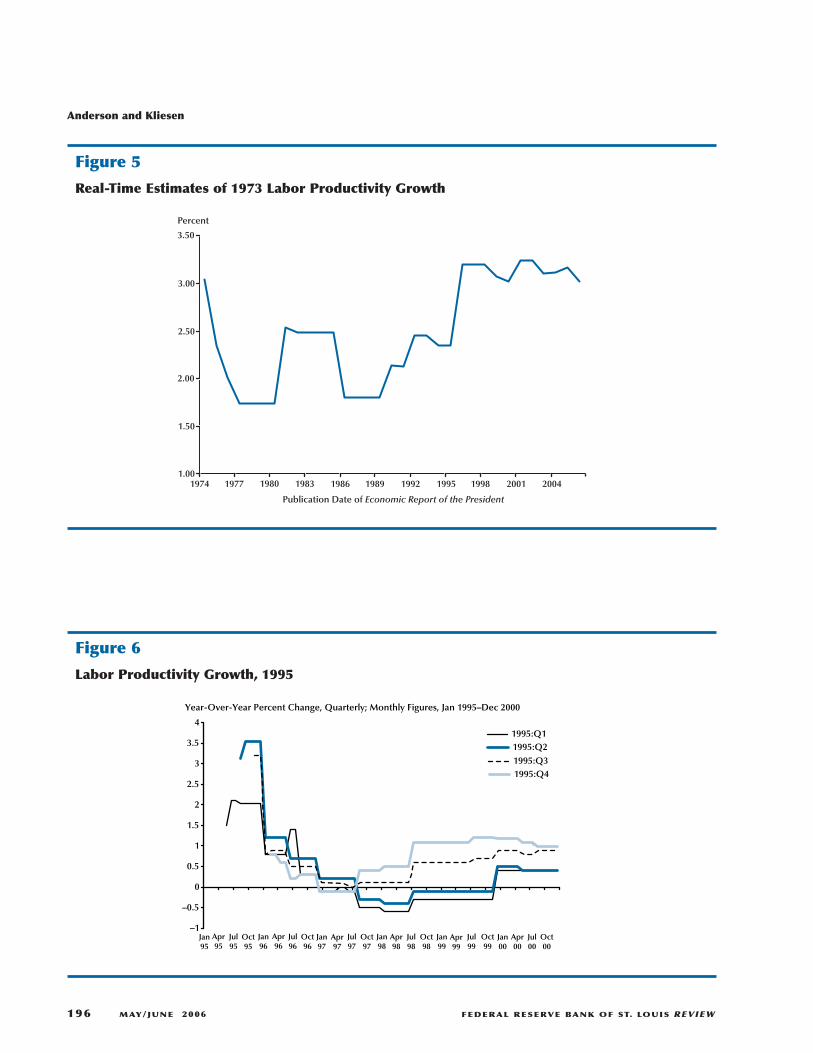
• For 1973, the first-published estimate oflabor productivity growth was approxi-mately 3 percent; see Figure 5. This value
fell sharply in subsequent revisions. Duringthe late 1980s, however, the published valuebegan to increase. In the most recently pub-lished data, 1973’s measured productivitygrowth is greater than its initially publishedvalue—removing entirely any “slowdown”during the year.26
• For 1995 and 1996, the most recently pub-lished values differ sharply from initialestimates. For 1995, the most recent valueis much lower than the initial estimate; seeFigure 6. For 1996, the most recent figure ismuch higher than the initial estimate; see
Anderson and Kliesen
194 MAY/JUNE 2006 FEDERAL RESERVE BANK OF ST. LOUIS REVIEW
Table 3Effect of Annual NIPA Revisions on Measured Growth of Labor Productivity, Output, and Hoursin the Nonfarm Business Sector (percent change at a compound rate)
Output per hour Output Hours
NIPA revision period Initial Revised Difference Initial Revised Difference Initial Revised Difference
1994 2.55 2.36 –0.19 3.99 4.12 0.13 1.40 1.70 0.30
1995 1.72 1.68 –0.04 4.70 4.85 0.15 2.87 3.09 0.22
1996 0.83 0.57 –0.26 2.92 2.84 -0.08 2.03 2.28 0.25
1997 0.75 0.88 0.13 3.21 3.33 0.12 2.40 2.44 0.04
1998 1.55 2.06 0.51 4.15 4.76 0.61 2.60 2.64 0.04
1999 2.31 2.60 0.29 4.44 4.74 0.30 2.38 2.42 0.04
2000 3.30 3.30 0.00 5.41 5.51 0.10 2.06 2.13 0.07
2001 3.05 2.28 –0.77 4.28 3.60 –0.68 1.16 1.27 0.11
2002 3.08 2.71 –0.37 2.00 1.44 –0.56 –1.08 –1.27 –0.19
2003 2.87 3.60 0.73 1.56 1.50 –0.06 –1.27 –2.02 –0.75
2004 4.69 4.45 –0.24 4.33 4.23 –0.10 –0.38 –0.23 0.15
2005 3.97 3.68 –0.29 4.76 4.59 0.17 0.76 0.87 0.11
Mean revision –0.04 0.01 0.03
Mean absolute 0.32 0.26 0.19revision
NOTE: Pre- and post-benchmark figures as published in the BLS Productivity and Cost Report. The NIPA revision period is the ninequarters up to and including the first quarter of the year indicated. The year indicated is the year of publication of the NIPA revision,usually July or August. The 1999 NIPA revision, more extensive than most, incorporated the October 28, 1999, introduction of computersoftware into business fixed investment. This resulted in revisions back to 1959. Nevertheless, for consistency, the revisions shown hereare for the nine quarters ending in the first quarter of the year indicated. (The 1999 revisions to “hours” appeared in the August 5, 1999,Productivity and Cost Report.)
26 In this vein, it appears that the switch to chain weights from fixedweights in 1996 (see Table 2) was particularly significant. SeeGullickson and Harper (2002).

Figure 7. The revision patterns for 1995 and1996 made it difficult to recognize, during1995 and 1996, that a change in trend pro-ductivity growth was occurring. Althoughthe initially published estimates for the firstthree quarters of 1995 suggested a produc-tivity acceleration, by mid-1996 these esti-mates had been revised downward to lessthan 1 percent. For 1996, initial estimatesfor all four quarters were between approxi-mately 0.5 and 1.5 percent, hardly support-ive of acceleration. Not until the thirdquarter of 1997 did revised estimates sug-
gest an acceleration, and not until mid-1998was its extent clearly visible in the reviseddata.
Differences between first-published and mostrecently published productivity figures for 1985to 2005 are summarized in Table 4 and Figures 8and 9. The principal conclusion to be drawn fromTable 4 is that, although mean revisions are small,mean absolute revisions are large, in some casesapproximately equal to the estimated annualgrowth rate itself. Revisions to four-quarter growthrates are smaller than revisions to one-quartergrowth rates, although this is due, in part, to the
Anderson and Kliesen
FEDERAL RESERVE BANK OF ST. LOUIS REVIEW MAY/JUNE 2006 195
Percentage Points Percentage Points
Percentage Points
1990
1991
1992
1993
1994
1995
1996
1997
1998
1999
2000
2001
2002
2003
2004
Percentage Points
6.0
5.0
4.0
3.0
2.0
1.0
0.0
–1.0
6.0
5.0
4.0
3.0
2.0
1.0
0.0
–1.0
–2.0
–3.0
–4.0
5.0
4.0
3.0
2.0
1.0
0.0
–1.0
–2.0
6.0
5.0
4.0
3.0
2.0
1.0
0.0
–1.0
–2.0
1980
1981
1982
1983
1984
1985
1986
1987
1988
1989
1970
1971
1972
1973
1974
1975
1976
1977
1978
1979
1960
1961
1962
1963
1964
1965
1966
1967
1968
1969
1959
1.5
4.03.3 3.1
–1.5
2.73.3
1.6 1.3
–0.3
3.8
1.2
3.1
4.5
3.53.0 3.1
3.6 3.4
1.7
0.1
1.9 1.7
4.1
0.4
1.2
0.5
2.7
1.6
2.8 2.8 2.7 2.5
4.0 3.83.4
–0.2
1.4
–1.0
4.5
2.01.5
3.1
0.5
1.7
0.7
Current Estimate
Current Estimate Current Estimate
Current Estimate
1970-791959-69
1980-89 1990-2004
Figure 4
Revisions to Real-Time Estimates of Labor Productivity Growth, 1959-2004
SOURCE: Economic Report of the President, annual issues, 1959-2004.
Anderson and Kliesen
196 MAY/JUNE 2006 FEDERAL RESERVE BANK OF ST. LOUIS REVIEW
3.50
3.00
2.50
2.00
1.50
1.001974 1977 1980 1983 1986 1989 1992 1995 1998 2001 2004
Percent
Publication Date of Economic Report of the President
Figure 5
Real-Time Estimates of 1973 Labor Productivity Growth
Year-Over-Year Percent Change, Quarterly; Monthly Figures, Jan 1995–Dec 2000
–1
–0.5
0
0.5
1
1.5
2
2.5
3
3.5
41995:Q11995:Q21995:Q31995:Q4
Jan95
Apr95
Jul95
Oct95
Jan96
Apr96
Jul96
Oct96
Jan97
Apr97
Jul97
Oct97
Jan98
Apr98
Jul98
Oct98
Jan99
Apr99
Jul99
Oct99
Jan00
Apr00
Jul00
Oct00
Figure 6
Labor Productivity Growth, 1995

Anderson and Kliesen
FEDERAL RESERVE BANK OF ST. LOUIS REVIEW MAY/JUNE 2006 197
0.00
0.50
1.00
1.50
2.00
2.50
3.00
3.50
4.00
Jan96
Apr96
Jul96
Oct96
Jan97
Apr97
Jul97
Oct97
Jan98
Apr98
Jul98
Oct98
Jan99
Apr99
Jul99
Oct99
Jan00
Apr00
Jul00
Oct00
Year-Over-Year Percent Change, Quarterly; Monthly Figures, Jan 1996–Dec 2000
1996:Q11996:Q21996:Q31996:Q4
Figure 7
Labor Productivity Growth, 1996
0
1
2
3
4
5
6
7
0 1 2 3 4 5 6 7
–1
–2 –1
Published Value as of 2005
Initial Published Value
Figure 8
Nonfarm Business Sector Labor Productivity Growth Estimates(four-quarter growth rate)
y = 0.4917x + 1.2572R2 = 0.331
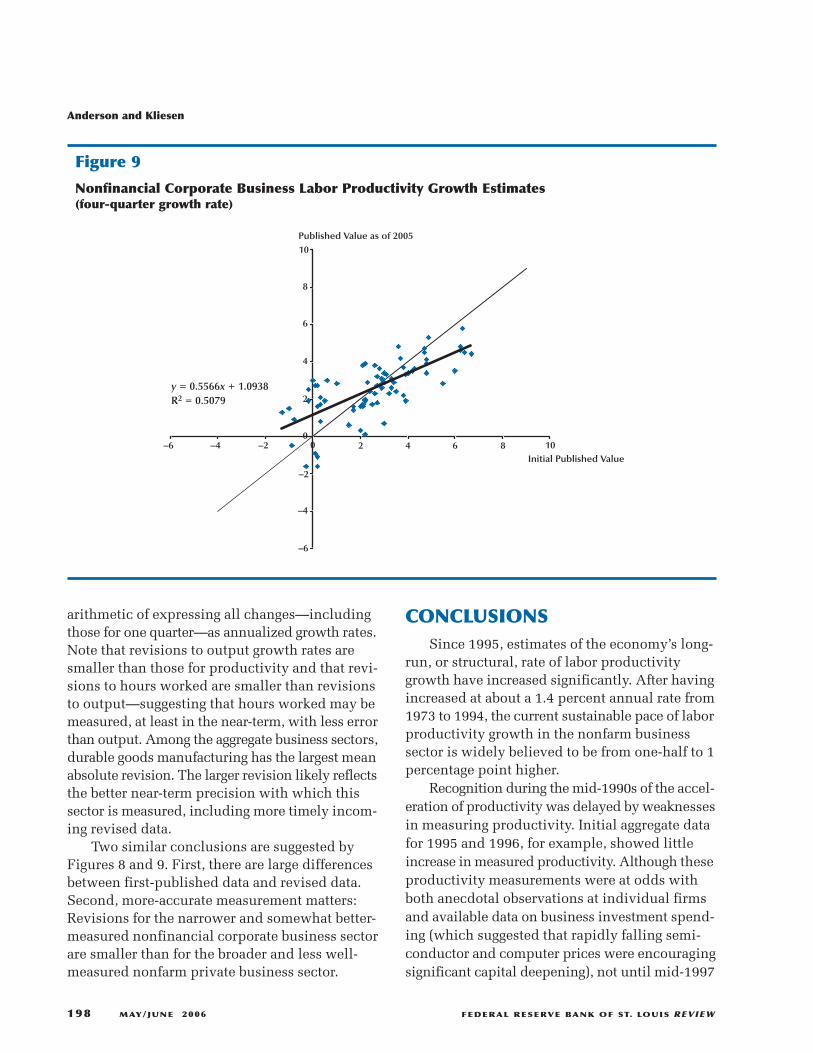
arithmetic of expressing all changes—includingthose for one quarter—as annualized growth rates.Note that revisions to output growth rates aresmaller than those for productivity and that revi-sions to hours worked are smaller than revisionsto output—suggesting that hours worked may bemeasured, at least in the near-term, with less errorthan output. Among the aggregate business sectors,durable goods manufacturing has the largest meanabsolute revision. The larger revision likely reflectsthe better near-term precision with which thissector is measured, including more timely incom-ing revised data.
Two similar conclusions are suggested byFigures 8 and 9. First, there are large differencesbetween first-published data and revised data.Second, more-accurate measurement matters:Revisions for the narrower and somewhat better-measured nonfinancial corporate business sectorare smaller than for the broader and less well-measured nonfarm private business sector.
CONCLUSIONSSince 1995, estimates of the economy’s long-
run, or structural, rate of labor productivitygrowth have increased significantly. After havingincreased at about a 1.4 percent annual rate from1973 to 1994, the current sustainable pace of laborproductivity growth in the nonfarm businesssector is widely believed to be from one-half to 1percentage point higher.
Recognition during the mid-1990s of the accel-eration of productivity was delayed by weaknessesin measuring productivity. Initial aggregate datafor 1995 and 1996, for example, showed littleincrease in measured productivity. Although theseproductivity measurements were at odds withboth anecdotal observations at individual firmsand available data on business investment spend-ing (which suggested that rapidly falling semi-conductor and computer prices were encouragingsignificant capital deepening), not until mid-1997
Anderson and Kliesen
198 MAY/JUNE 2006 FEDERAL RESERVE BANK OF ST. LOUIS REVIEW
0
2
4
6
8
2 4 6 8
10
–2
–4
–6
–4 0 10–2–6
Published Value as of 2005
Initial Published Value
Figure 9
Nonfinancial Corporate Business Labor Productivity Growth Estimates(four-quarter growth rate)
y = 0.5566x + 1.0938R2 = 0.5079

did revised data for 1995 and 1996 display gainsin productivity growth. Our analysis suggests thatsuch measurement delays and revisions are notuncommon.
REFERENCESAnderson, Richard G. and Kliesen, Kevin L.
“Productivity Measurement and MonetaryPolicymaking during the 1990s.” Working Paper2005-067, Federal Reserve Bank of St. Louis,October 2005.
Basu, Susanto; Fenald, John G.; Oulton, Nicholasand Srinivasan, Sylaja. “The Case of the MissingProductivity Growth: Or, Does InformationTechnology Explain Why Productivity Acceleratedin the US but Not in the UK?” NBER Working PaperNo. 10010, National Bureau of Economic Research,
October 2003, published in Mark Gertler andKenneth Rogoff, eds, NBER MacroeconomicsAnnual, 2003. Cambridge, MA: MIT Press, 2004.
Baumol, William J. “Macroeconomics of UnbalancedGrowth: The Anatomy of Urban Crisis.” AmericanEconomic Review, June 1967, 57(3), pp. 415-26.
Cohen, Linda and Young, Allie. Multisourcing:Moving Beyond Outsourcing to Achieve Growthand Agility. Cambridge, MA: Harvard BusinessSchool Press, 2005.
Corrado, Carol and Lawrence, Slifman. “Decompositionof Productivity and Unit Costs.” American EconomicReview, May 1999, 89(2), pp. 328-32.
Dean, Edwin R. and Harper, Michael J. “The BLSProductivity Measurement Program,” in Charles R.Hulten, Edwin R. Dean, and Michael J. Harper, eds.,New Developments in Productivity Analysis.
Anderson and Kliesen
FEDERAL RESERVE BANK OF ST. LOUIS REVIEW MAY/JUNE 2006 199
Table 4Initially Published vs. Most Recently Published Growth Rates of Nonfarm Labor Productivity,1985:Q3 to 2005:Q4
Output per hour Output Hours
Mean Mean Mean Mean absolute Mean absolute Mean absolute
revision revision revision revision revision revision
Growth from preceding period (quarterly, percent annual rate)
Business sector 0.40 1.78 0.37 1.55 –0.02 1.07
Nonfarm 0.41 1.80 0.34 1.54 –0.07 1.09
Manufacturing 0.03 2.12 –0.06 1.65 –0.06 1.28
Durable –0.08 2.77 –0.04 2.21 0.05 1.42
Nondurable 0.08 2.16 –0.18 1.73 –0.22 1.38
Nonfinancial corporate –0.12 2.01 –0.12 1.82 –0.02 1.04
Growth from corresponding period 1 year earlier (quarterly, percent annual rate)
Business sector 0.26 1.03 0.24 0.81 –0.02 0.62
Nonfarm 0.25 1.00 0.19 0.80 –0.05 0.62
Manufacturing –0.16 1.37 –0.18 0.89 –0.01 0.77
Durable –0.28 1.89 –0.19 1.43 0.11 0.83
Nondurable –0.11 1.13 –0.32 0.71 –0.18 0.79
Nonfinancial corporate –0.04 1.12 –0.04 1.04 –0.02 0.70
NOTE: Each figure is equal to the initially published growth rate minus the most recently published growth rate for the span indicated.
SOURCE: BLS, Productivity and Cost.

Chicago: University of Chicago Press for the NBER,2001, pp. 55-84.
Doms, Mark. “Communications Equipment: WhatHas Happened to Prices?” in Carol Corrado, JohnHaltiwanger, and Daniel Sichel, eds., MeasuringCapital in the New Economy. Chicago: Universityof Chicago Press for the NBER, 2005, pp. 323-62.
Edge, Rochelle M.; Laubach, Thomas and Williams,John C. “Learning and Shifts in Long-RunProductivity Growth.” Working Paper 2004-21,Board of Governors of the Federal Reserve System,April 2004.
Friedman, Thomas L. The World Is Flat. New York:Farrar, Straus, and Giroux, 2005.
Gordon, Robert J. “Does the ‘New Economy’ MeasureUp to the Great Inventions of the Past?” Journal ofEconomic Perspectives, 2000, 14(4), pp. 49-74.
Gordon, Robert J. “Productivity Growth and the NewEconomy: Comments.” Brookings Papers onEconomic Activity, 2002, 0(2), pp. 245-53.
Gordon, Robert J. “Exploding Productivity Growth:Context, Causes and Implications.” Brookings Paperson Economic Activity, 2003, 0(2), pp. 207-98.
Greenwood, Jeremy; Hercowitz, Zvi and Krusell, Per.“Long-Run Implications of Investment-SpecificTechnological Change.” American Economic Review,1997, 87(3), pp. 342-62.
Griliches, Zvi. Output Measurement in the ServiceSectors. Chicago: University of Chicago Press, 1992.
Griliches, Zvi. “Productivity, R&D, and the DataConstraint.” American Economic Review, March1994, 84(1), pp. 1-23.
Grimm, Bruce T. “Price Indexes for SelectedSemiconductors 1974–96.” Survey of CurrentBusiness, February 1998, 78(2), pp. 8-24.
Gullickson, William and Harper, Michael J. “Bias inAggregate Productivity Trends Revisited.” MonthlyLabor Review, March 2002, 125(3), pp. 32-40.
Haltom, Nicholas L.; Mitchell, Vanessa D. and Tallman,
Ellis W. “Payroll Employment Data: Measuring theEffects of Annual Revisions.” Federal ReserveBank of Atlanta Economic Review, Second Quarter2005, pp. 1-23.
Himmelberg, Charles P.; Mahoney, James M.; Bang,April and Chernoff, Brian. “Recent Revisions toCorporate Profits: What We Know and When WeKnew It.” Federal Reserve Bank of New York CurrentIssues in Economics and Finance, March 2004, 10(3),pp. 1-7.
Holdway, Mike. “An Alternative Methodology:Valuing Quality Change for Microprocessors in thePPI.” Presentation to the Advisory Committee tothe Bureau of Economic Analysis, May 11, 2001.
Hulten, Charles R. “The Measurement of Capital,” inErnst R. Berndt and Jack E. Triplett, eds., Fifty Yearsof Economic Measurement. Chicago: University ofChicago Press for the NBER, 1990, pp. 119-52.
Hulten, Charles R. “Growth Accounting WhenTechnical Change Is Embodied in Capital.” AmericanEconomic Review, September 1992, 82(4), pp. 964-80.
Hulten, Charles R. “Total Factor Productivity: A ShortBiography,” in Charles R. Hulten, Edwin R. Dean,and Michael J. Harper, eds., New Developments inProductivity Analysis. Chicago: University ofChicago Press for the NBER, 2001
Jones, Charles I. “Sources of U.S. Economic Growthin a World of Ideas.” American Economic Review,March 2002, 92(1), pp. 220-39.
Jorgenson, Dale W.; Gollop, Frank M. and Fraumeni,Barbara M. Productivity and U.S. Economic Growth.Harvard Economic Studies. Volume 159. Cambridge,MA: Harvard University Press, 1987.
Jorgenson, Dale W.; Ho, Mun S. and Stiroh, Kevin J.“Projecting Productivity Growth: Lessons from theU.S. Growth Resurgence.” Federal Reserve Bank ofAtlanta Economic Review, Third Quarter 2002,pp. 1-13.
Jorgenson, Dale W.; Ho, Mun S. and Stiroh, Kevin J.“Lessons from the U.S. Growth Resurgence.” Paperprepared for the First International Conference onthe Economic and Social Implications of Information
Anderson and Kliesen
200 MAY/JUNE 2006 FEDERAL RESERVE BANK OF ST. LOUIS REVIEW

Technology, Washington, DC, January 27-28, 2003;www.si.umich.edu/~kahin/hawk/htdocs/jorgensonpaper.doc.
Jorgenson, Dale W.; Ho, Mun S. and Stiroh, Kevin J.“Will the U.S. Productivity Resurgence Continue?”Federal Reserve Bank of New York Current Issuesin Economics and Finance, December 2004, 10(13).
Jorgenson, Dale W.; Ho, Mun S. and Stiroh, Kevin J.“Projecting Productivity Growth: Lessons from theU.S. Growth Resurgence,” in William H. Dutton etal., eds., Transforming Enterprises: The Economicand Social Implications of Information Technology.Cambridge, MA: MIT Press, 2005, pp. 49-75.
Jorgenson, Dale W.; Landefeld, J. Steven and Nordhaus,William D. A New Architecture for the U.S. NationalAccounts. Chicago: University of Chicago Press forthe NBER, 2006 (forthcoming).
Kozicki, Sharon. “The Productivity Growth Slowdown:Diverging Trends in the Manufacturing and ServiceSectors.” Federal Reserve Bank of Kansas CityEconomic Review, First Quarter 1997, pp. 31-46.
Kozicki, Sharon. “How Do Data Revisions Affect theEvaluation and Conduct of Monetary Policy?”Federal Reserve Bank of Kansas City EconomicReview, First Quarter 2004, 89(1), pp. 5-38.
Landefeld, J. Steven and Grimm, Bruce T. “A Noteon the Impact of Hedonics and Computers on RealGDP.” Survey of Current Business, December 2000,pp. 17-22.
Oliner, Stephen D. and Sichel, Daniel E. “InformationTechnology and Productivity: Where Are We Nowand Where Are We Going?” Federal Reserve Bankof Atlanta Economic Review, Third Quarter 2002,87(2), pp. 1-13.
Orphanides, Athanasios and van Norden, Simon.“The Reliability of Inflation Forecasts Based onOutput Gap Estimates in Real Time.” Journal ofMoney, Credit, and Banking, June 2005, 37(3), pp.583-601.
Pakko, Michael R. “The High-Tech Investment Boomand Economic Growth in the 1990s: Accounting
for Quality.” Federal Reserve Bank of St. LouisReview, March/April 2002a, 84(2), pp. 3-18.
Pakko, Michael R. “What Happens When theTechnology Growth Trend Changes? TransitionDynamics, Capital Growth and the ‘New Economy’.”Review of Economic Dynamics, April 2002b, 5(2),pp. 376-407.
Pakko, Michael R. “Changing Technology Trends,Transition Dynamics, and Growth Accounting.”Contributions to Macroeconomics, 2005, 5(1),Article 12.
Runkle, David E. “Revisionist History: How DataRevisions Distort Economic Policy Research.”Federal Reserve Bank of Minneapolis QuarterlyReview, Fall 1998, 22(4), pp. 3-12.
Sherwood, Mark K. “Difficulties in the Measurementof Service Outputs.” Monthly Labor Review, March1994, 117(3), pp. 11-19.
Solow, Robert. “Technical Change and the AggregateProduction Function.” Review of Economics andStatistics, 1957, 39(3), pp. 312-20.
Solow, Robert. “Investment and TechnologicalProgress,” in Kenneth Arrow, Samuel Karlin, andPatrick Suppes, eds., Mathematical Methods in theSocial Sciences. Stanford, CA: Stanford UniversityPress, 1960, pp. 89-104.
Solow, Robert. “After ‘Technical Progress and theAggregate Production Function’,” in Charles R.Hulten, Edwin R. Dean, and Michael J. Harper, eds.,New Developments in Productivity Analysis.Chicago: University of Chicago Press for the NBER,2001, pp.173-78.
Stiroh, Kevin J. “Information Technology and theU.S. Productivity Revival: What Do the IndustryData Say?” American Economic Review, December2002, 92(5), pp. 1559-76.
Triplett, Jack E. and Bosworth, Barry P. “Productivityin the Services Sector,” in Robert M. Stern, ed.,Services in the International Economy. Ann Arbor,MI: University of Michigan Press, 2001;www.brookings.edu/views/papers/triplett/20000112.htm.
Anderson and Kliesen
FEDERAL RESERVE BANK OF ST. LOUIS REVIEW MAY/JUNE 2006 201

Triplett, Jack E. and Bosworth, Barry P. “ProductivityMeasurement Issues in Services Industries:‘Baumol’s Disease’ Has Been Cured.” FederalReserve Bank of New York Economic PolicyReview, September 2003, 9(3), pp. 23–33.
Triplett, Jack E. and Bosworth, Barry P. Productivityin the U.S. Services Sector. Washington, DC:Brookings Institution, 2004.
Triplett, Jack E. and Bosworth, Barry P. “Baumol’sDisease Has Been Cured: IT and MultifactorProductivity Growth in the U.S. Services Industries,”in Dennis Jansen, ed., The New Economy andBeyond: Past, Present and Future. Cheltenham:Edward Elgar, 2006 (forthcoming); www.brookings.edu/es/research/projects/productivity/workshops/20020517_triplett.pdf.
Yuskavage, Robert E. “Improved Estimates of GrossProduct by Industry, 1959-94.” Survey of CurrentBusiness, August 1996, 76(8), pp. 133-55.
Yuskavage, Robert E. and Pho, Yvon H. “GrossDomestic Product by Industry for 1987-2000.”Survey of Current Business, November 2004, pp.33-53.
Anderson and Kliesen
202 MAY/JUNE 2006 FEDERAL RESERVE BANK OF ST. LOUIS REVIEW