the 16-day wave in the arctic and antarctic mesosphere and … · gion for five years with a...
TRANSCRIPT

Atmos. Chem. Phys., 10, 1461–1472, 2010www.atmos-chem-phys.net/10/1461/2010/© Author(s) 2010. This work is distributed underthe Creative Commons Attribution 3.0 License.
AtmosphericChemistry
and Physics
The 16-day wave in the Arctic and Antarctic mesosphere and lowerthermosphere
K. A. Day and N. J. Mitchell
Centre for Space, Atmospheric and Oceanic Science, Department of Electronic and Electrical Engineering, The University ofBath, Bath, BA2 7AY, UK
Received: 10 September 2009 – Published in Atmos. Chem. Phys. Discuss.: 25 November 2009Revised: 25 January 2010 – Accepted: 30 January 2010 – Published: 11 February 2010
Abstract. The 16-day planetary wave in the polar meso-sphere and lower thermosphere has been investigated usingmeteor radars at Esrange (68◦ N, 21◦ E) in the Arctic andRothera (68◦ S, 68◦ W) in the Antarctic. The measurementsspan the 10-year interval from October 1999 to July 2009and the 5-year interval February 2005 to July 2009, respec-tively. The height range covered is about 80–100 km. In bothpolar regions the wave is seen to occur in intermittent bursts,where wave amplitudes typically reach a maximum of about15 m s−1, and never more than about 20 m s−1. Horizontalwind variance within a wave-period range of 12 to 20 days isused as a proxy for the activity of the 16-day wave. Wave ac-tivity is strong for 3 to 4 months in winter, where it is presentacross the entire height range observed and monthly wavevariance reaches about 65 m2 s−2. Some weak and intermit-tent activity is observed throughout the other seasons includ-ing summer. However, there is a high degree of inter-annualvariability and in some individual years wave activity is al-most absent. The data are used to construct a representativeclimatology for the Arctic and Antarctic. The seasonal cycleof the 16-day wave is found to be very similar in both po-lar regions. The 16-day wave has slightly greater amplitudesin the zonal component of the winds than in the meridional.Mesospheric temperatures measured by the radars were usedto further investigate the 16-day wave. The temperatures re-veal a clear signature of the 16-day wave. Temperature am-plitudes are generally only a few Kelvin but occasional burstsof up to 10 K have been observed. Observations of the wavein summer are sometimes consistent with the suggestion ofducting from the winter hemisphere.
Correspondence to:K. A. Day([email protected])
1 Introduction
Planetary waves are important agents in the coupling be-tween the layers of the atmosphere. They act to move energy,momentum and chemical species both horizontally and verti-cally in the atmosphere. Planetary waves are known to propa-gate from sources in the troposphere and stratosphere into themesosphere and lower thermosphere (MLT) and also to begenerated in situ in the MLT (e.g.,Charney and Drazin, 1961;Dickinson, 1968; Salby, 1981a,b; Forbes et al., 1995). Plan-etary waves can reach amplitudes of several tens of m s−1 inthe MLT. The waves are known to interact with and mod-ulate the amplitudes of atmospheric tides (e.g.,Teitelbaumand Vial, 1991; Beard et al., 1997). They also modulatethe gravity-wave field of the middle atmosphere (e.g.,Forbeset al., 1991; Miyahara and Forbes, 1991a; Thayaparan et al.,1995; Nakamura et al., 1997; Manson et al., 1998, 2003).Planetary waves with a period of 16 days have been reportedin observations of wind, temperature and geopotential heightin the MLT region (e.g.,Forbes et al., 1995; Espy and Witt,1996; Espy et al., 1997; Mitchell et al., 1999; Luo et al.,2000, 2002a,b; Manson et al., 2003; Jiang et al., 2005; Limaet al., 2006). The temperature perturbations associated withplanetary waves are believed to modulate the occurrence ofPolar Mesospheric Clouds (e.g.,Espy and Witt, 1996; Merkelet al., 2003, 2008). Modelling studies have also investigatedthe 16-day wave (e.g.,Forbes et al., 1995; Miyoshi, 1999;Luo et al., 2002b).
The wave has been reported to have amplitudes of up to∼20 m s−1 in the winter-time MLT and up to∼7 m s−1 inthe summer-time MLT. The vertical wavelength has gener-ally been reported to have values between∼30 to 60 km(e.g.,Luo et al., 2000, 2002a,b). The 16-day wave has beenidentified as the manifestation of the gravest symmetricalwavenumber 1 westward travelling,s=1, Rossby mode and
Published by Copernicus Publications on behalf of the European Geosciences Union.
1462 K. A. Day and N. J. Mitchell: The 16-day wave in the polar mesosphere
suggested on theoretical grounds to occur with periods be-tween 11.1–20.0 days (e.g.,Salby, 1981b).
A number of studies have investigated the 16-day waveat mid- and low-latitudes in the MLT region. These studieshave revealed that the wave has a clear seasonal behaviour inthe MLT and displays wave periods of between about 12 to20 day, as predicted bySalby(1981b). Forbes et al.(1995)analysed 2 months of wind data, from a meteor-radar overObninsk, (54◦ N) and from a medium-frequency (MF) radarover Saskatoon (52◦ N) to observe the 16-day wave in theMLT at a time when there was a large oscillation in the tro-posphere and stratosphere.Mitchell et al.(1999) used 5 yearsof meteor-radar wind data and reported that the 16-day wavemaximised in winter and was also present in late summerover the UK at 53◦ N. The comprehensive studies ofLuoet al.(2000, 2002a,b) used MF-radars, HRDI/UARS and TheGlobal Scale Wave Model. They used wind data to observethe 16-day wave and reported largest wave amplitudes inwinter and smaller amplitudes in summer.Jiang et al.(2005)used meteor-radar wind data from over Wuhan (31◦ N) andMF-radar data from over Adelaide (35◦ S) to study the 16-day wave in 2002 and 2003. The wave was observed in allseasons over at least one of the sites. In general, the mid-latitude studies suggest that wave activity is strongest in win-ter with a secondary maximum occurring around the summermesopause.
At lower latitudesLima et al.(2006) observed the MLT re-gion for five years with a meteor-radar at Cachoeira Paulista(23◦ S). They concluded that there was no clear seasonal be-haviour and that the strongest wave activity was observed inautumn-winter for some years and spring-summer for others.
In contrast to the situation at mid-latitudes, there have beenonly a limited number of studies of the 16-day wave in thepolar MLT. Williams and Avery(1992) used a mesosphere-stratosphere-troposphere (MST) radar to observe winds overPoker Flat (65◦ N) and reported significant wave activity insummer and winter.Espy et al.(1997) used optical mea-surements of OH-layer temperatures over Stockholm (60◦ N)in the summers of 1992 to 1995 to investigate the 16-daywave. They reported a temperature oscillation correspond-ing to the 16-day wave.Luo et al.(2002b) used an MF-radarand reported observations of winds over Tromsø (70◦ N) dur-ing 1993 to 1994. They also reported stronger wave activityin the winter, but some summer-time wave activity was alsoevident.
Miyoshi (1999) reported numerical simulations in whichthe 16-day wave maximised in winter and summer, with thewinter amplitudes being greater. It was suggested that the16-day wave may be mainly excited by heating due to themoist convection in the troposphere.
One of the most interesting things about the 16-day waveis that a number of explanations have been proposed forthe wave activity observed in summer. The key point hereis that the summer-time wave activity in the MLT cannothave propagated to those heights from the summer tropo-
sphere/stratosphere. This is because the 16-day wave has alow zonal phase speed and so wave propagation is prohib-ited through the strong westward winds of the summer-timemiddle atmosphere (Charney and Drazin, 1961).
A mechanism that could account for in situ excitationof the wave has been proposed byWilliams and Avery(1992). In this mechanism, gravity waves rising from thelower atmosphere are filtered by a 16-day wave in the tropo-sphere/stratosphere. This imposes a 16-day modulation onthe gravity-wave field in the MLT. As these gravity wavesdissipate and transfer their momentum into the mean flow ofthe MLT this then excites a 16-day wave in situ.Smith(2003)demonstrated in a modelling study that this mechanism canproduce significant planetary-wave amplitudes in the MLT,at least for stationary planetary waves.
An alternative explanation proposed byMiyahara et al.(1991b) is that the 16-day wave of the winter hemispherepropagates across the equator into the summer-time MLT atheights above the strong westward flow of the summer-timemiddle atmosphere. This suggestion received further sup-port from the modelling study ofForbes et al.(1995). How-ever, these authors also noted that this ducting may be im-peded by gravity-wave stresses in the mesosphere. Experi-mental results which suggest such ducting takes place havebeen reported byEspy et al.(1997) andHibbins et al.(2009).These authors report a correlation between long-period plan-etary wave activity in the summer polar mesosphere and thephase of the equatorial Quasi-Biennual Oscillation (QBO),such that largest amplitudes occur during eastward phases ofthe QBO. These suggest that the waves observed in the po-lar regions have travelled there across the equator from thewinter hemisphere, i.e., have been ducted.
Here we present observations of winds and temperatures inthe MLT made using two meteor radars, one at Esrange in theArctic and one at Rothera in the Antarctic. These radars arelocated at conjugate geographical latitudes. Comparativelylong data sets are available from the sites (10 and 5 years,for Esrange and Rothera, respectively). The data from theseradars are used to characterize the inter-annual variability ofthe 16-day wave in the polar MLT and to construct simplerepresentative climatologies of the 16-day wave in the Arcticand Antarctic MLT.
2 Data analysis
Two all-sky meteor radars were used in this study. Theradars are SKiYMET VHF systems that operate with radiatedpower being largely independent of azimuth. The radio fre-quency that the radars operate at is 32.5 MHz, the pulse rep-etition frequency is 2144 Hz, the duty cycle is 15% and thepeak power is 6 kW. One radar is located at Esrange in Arc-tic Sweden (68◦ N, 21◦ E). It was deployed in August 1999and has produced largely-uninterrupted measurements sinceOctober of that year. The other is located at Rothera in the
Atmos. Chem. Phys., 10, 1461–1472, 2010 www.atmos-chem-phys.net/10/1461/2010/

K. A. Day and N. J. Mitchell: The 16-day wave in the polar mesosphere 1463
Antarctic (68◦ S, 68◦ W). It was deployed in February 2005and again has produced largely-uninterrupted measurementssince deployed. This gives a near-continuous data set of ap-proximately ten years for Esrange and five years for Rothera.
Horizontal winds are measured by both radars at heights of∼80–100 km. Six independent non-overlapping height gatesare used with representative height and time resolutions of ei-ther 3 or 5 km and 1 h, respectively. The vertical distributionof meteor echoes is strongly peaked at a height of∼90 km.The height gates used from 80 to 100 km have depths of 5,3, 3, 3, 3, 5 km to ensure there are sufficient meteors in theuppermost and lowermost height gates. The meteor-count-weighted centres of the height-gates are at 80.8, 84.7, 87.5,90.4, 93.3 and 97.1 km. The horizontal winds are calculatedfor each height gate in time steps of 1 h and resolved intozonal and meridional wind components. A more full descrip-tion of the radars and data analysis can be found inHockinget al. (2001) and Mitchell et al. (2002). These time seriesof the hourly winds form the basis of the wind data analysispresented here.
To complement the wind data, temperatures can also bemeasured by both of the radars. The temperature data is adaily value, representative of the whole height range avail-able, thus supplying one daily temperature for the meteorregion. The temperature data used here for Esrange coversthe interval from August 2002 to July 2009 and for Rotherafrom February 2005 to July 2009. A full description of thetemperature data analysis can be found inHocking (1999);Hocking et al.(2001, 2004).
As described in Sect. 1, the 16-day planetary wave hasbeen observed to occur with a wide range of periods between∼12 to 20 days. Here, we will consider all planetary waveactivity within the period range 12 to 20 day to be attributableto the “16-day wave”. This range of periods has also beenused in the studies of e.g.,Forbes et al.(1995); Luo et al.(2002a); Jiang et al.(2005); Lima et al.(2006), and is usedhere so that our results will be directly comparable with theseother studies.
3 Results
To investigate the planetary-wave field over Esrange andRothera, the time series of winds recorded over each sitewere analyzed using a wavelet technique. The wavelet anal-ysis uses a Morlet wavelet of non-dimensional wavenum-ber 6. This wavelet and wavenumber were chosen becausethey have approximately similar form to the bursts of plane-tary wave activity often reported in the MLT (e.g.,Kumar andFoufoula-Georgiou, 1997; Pancheva and Mukhtarov, 2000;Lastovicka et al., 2006).
An example of this analysis is shown in Fig.1. The figurepresents the results of the wavelet analysis for zonal windsrecorded at a height of∼85 km over Esrange and Rothera inthe time interval 2005 to 2009. These years are presented
Fig. 1. A wavelet analysis of(a) hourly zonal winds over Esrange ata height of 84.7 km during the interval January to December 2005 to2009 and(b) hourly zonal winds over Rothera at a height of 84.7 kmduring the interval January to December 2005 to 2009. Amplitudessmaller than 3 m s−1 are not plotted.
because they are the ones in which simultaneous data existsfor Esrange and Rothera. Results are only plotted for am-plitudes greater than 3 m s−1 to highlight episodes of strongwave activity.
From the figures it can be seen that the planetary-waveactivity is intermittent and occurs in bursts lasting approx-imately 1–2 months. Further, the wave period varies fromburst to burst and is only approximately 16 days. A signif-icant number of wave bursts are observed across the wholeperiod range 12 to 20 days. For example, a burst of strongwave activity is evident in March 2005 over Esrange with aperiod of near 16 days. However, over Rothera in July 2005the period of the burst of wave activity is nearer 13 days.Considering only the 16-day wave, it can be seen that waveamplitudes reached as large as∼15 m s−1 over Esrange and∼10 m s−1 over Rothera. Other bursts of wave activity areevident that occur at wave periods outside of the 12 to 20day range. For example, strong wave activity with a periodnear 9 days is evident over Esrange in January 2005 and overRothera August 2007.
www.atmos-chem-phys.net/10/1461/2010/ Atmos. Chem. Phys., 10, 1461–1472, 2010
1464 K. A. Day and N. J. Mitchell: The 16-day wave in the polar mesosphere
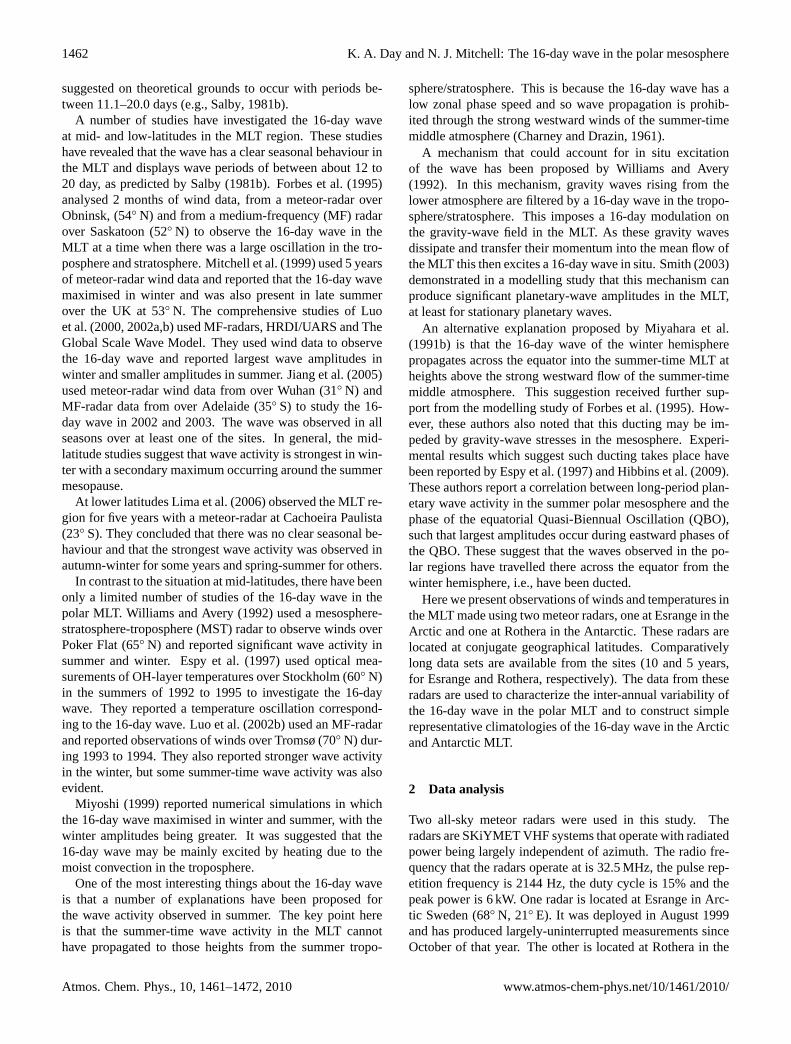
Fig. 2. Time-height contours of(a) the hourly zonal winds band-passed between 12 and 20 days over Esrange and(b) the hourlyzonal winds band-passed between 12 and 20 days over Rothera.
To investigate these 16-day waves further, a band-passanalysis of the horizontal winds in each height gate was per-formed. A second-order Butterworth band-pass filter wasused that had period limits of 12 to 20 days (the filter used
is the standard Butterworth found within MatLab). Theseperiod limits were chosen to make the analysis as similaras possible to that of some previous studies e.g.,Espy et al.(1997); Mitchell et al.(1999); Luo et al.(2002b); Jiang et al.(2005). From the wavelet analysis in Fig.1 it can be seen thatwave activity is significant within this period range and thetheoretical work mentioned above suggests that this is due toa global-scale wave number 1 planetary wave. Hereafter wewill refer to oscillations within this period range and as the“16-day wave”.
The vertical structure of the wave was then investigatedusing the six independent height gates available from eachof the radars. The time-height contours of the band-passedzonal winds recorded over Esrange and Rothera are pre-sented in Fig.2a and b, respectively (the meridional winds,not shown, reveal a generally similar behavior). The data isfor all years of data available, i.e. for Esrange, 1999 to 2009and for Rothera, 2005 to 2009. Wave activity is evident in allyears observed. Wave activity is generally stronger in winterthan summer and is present in all winters observed. The waveis present in most summers observed, but is generally signif-icantly weaker than in winter. Only in one year, 2005, doeswave activity appear to fall below amplitudes of∼3 m s−1 insummer. The bandpassed winds reveal a strongly phase co-herent wave structure across the height range observed. Clearphase fronts are evident in all seasons, although the patternbegins to break up when the wave reaches small amplitudesin some summer months. This phase coherency across the sixindependent height gates provides strong evidence that thedata are revealing the presence of a 16-day planetary wave.
Considering the figure in more detail, it can been seenthat the winter-time wave is present through all the heightsobserved. The winter-time enhancement in amplitude lastsfor several months and extends into the equinoxes, for in-stance the months of October to March over Esrange andMay to October over Rothera. Wave amplitudes regularlyreach∼15 m s−1 for intervals of several months. For ex-ample, over Esrange this amplitude is reached in most yearsfrom October to March. A similar behaviour is observed overRothera with strong wave activity evident from May to Oc-tober. However, there is also significant inter-annual vari-ability. For example, over Esrange in December 2001 theamplitude is mostly below∼5 m s−1, whereas in December2003 it is mostly above 15 m s−1. Similarly, over Rotherain July 2006 the amplitudes are generally less than 5 m s−1
compared with July 2007 where they reach 15 m s−1.In contrast to the winter, wave amplitudes are generally
smaller in summer. However, there are still some episodesof strong, but short-lived activity in the summer where waveamplitudes reach between 5 and 10 m s−1 on several occa-sions. For example, over Esrange in June and July at heightsat below 90 km in 2000 and for the same months at heightsabove 90 km in 2004. Summer-time wave activity is evenstronger over Rothera. For example, wave amplitude exceed10 m s−1 in January and February in 2007.
Atmos. Chem. Phys., 10, 1461–1472, 2010 www.atmos-chem-phys.net/10/1461/2010/
K. A. Day and N. J. Mitchell: The 16-day wave in the polar mesosphere 1465
Over Esrange there are six years where we have a contin-uous three months of data for observing the 16-day summer-time wave. In this there are five bursts where amplitudesreach greater than 5 m s−1. Over Rothera there are four burstsreaching amplitudes greater than 5 m s−1.
Examination of the phase fronts of the wave reveals thatthere is phase slope with height. Good examples of this in-clude November and December over Esrange in 2003 andAugust to October over Rothera in 2007. This suggests thatthe vertical wavelength, even though still long, is not as longas other planetary waves. A least squares fit to the data forwinter conditions suggests a vertical wavelength of∼70 km.
The seasonal and long-term variability suggested abovecan be investigated further using horizontal wind varianceas a proxy for wave activity. In this analysis the band-passedwinds in each height gate for each month are used to cal-culate a variance value for the meridional and zonal compo-nents of the winds. By examining these variances as a func-tion of height and time the seasonal and inter-annual behav-ior of the 16-day wave can be investigated. A similar analysishas been used in the the study of the 2-day and 5-day plane-tary waves (Tunbridge and Mitchell, 2009; Day and Mitchell,2010). Note that for a constant-amplitude oscillation, ampli-tude is equal to the square root of twice the variance. Forexample, a variance of 10 m2 s−2 corresponds to a wave am-plitude of 4.5 m s−1, a variance of 50 m2 s−2 corresponds toa wave amplitude of 10 m s−1 and a variance of 100 m2 s−2
corresponds to a wave amplitude of 14.1 m s−1 etc.Time-height contours of meridional and zonal monthly
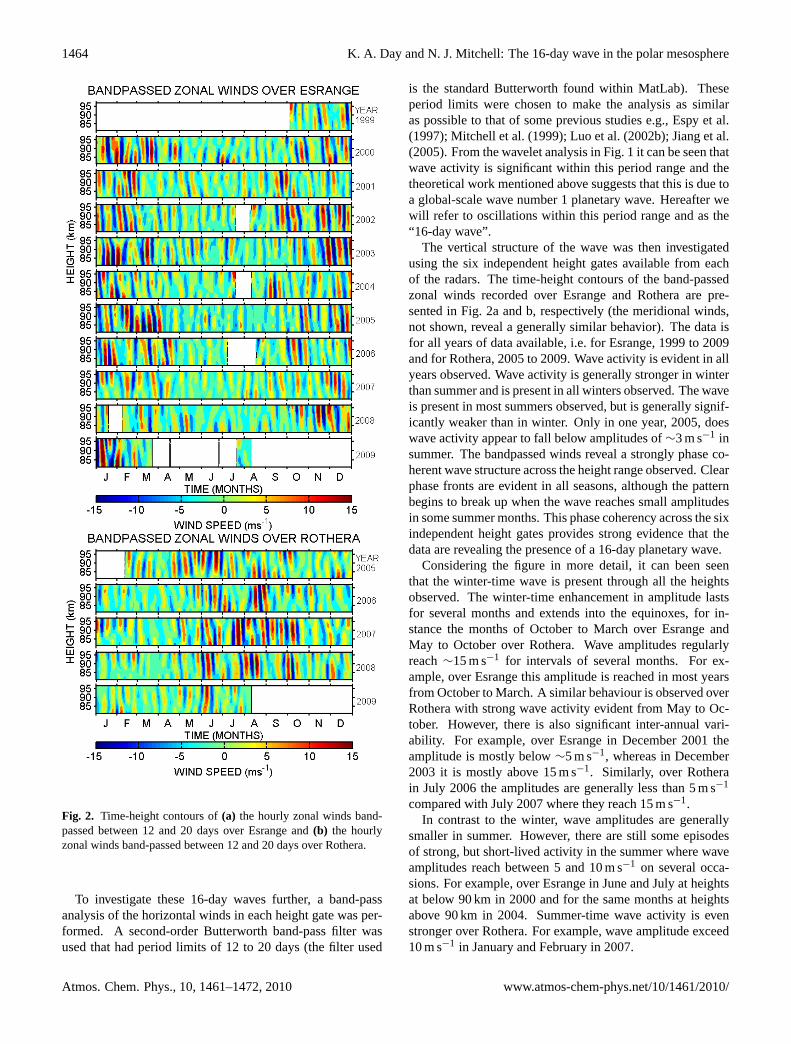
variances for all the years available over Esrange are pre-sented in Fig.3. The monthly-mean zonal winds for eachyear have been plotted over the top of the figure for that spe-cific year to enable a comparison of the background windsand the level of 16-day wave activity.
Figure3 shows a clear seasonal cycle in Arctic wave ac-tivity on top of which is superposed significant inter-annualvariability. Wave activity is strongest in winter. For exam-ple, zonal variances in February and March of 2005 show astrong 16-day wave at∼85 km where variances reach valuesin excess of∼100 m2 s−2. In contrast, during February andMarch of 2007, wave variances at the same height reachedonly ∼30 m2 s−2.
When considering the strong winter-time wave it can beseen that the zonal component is greater than the merid-ional for most winters (the average difference is approxi-mately a factor of 1.2). Consideration of the figure showsthat the wave has generally largest variances in the winterand equinoxes.
In the summer the wave is present but has significantlysmaller variances and is sometimes completely absent. Forexample, in the summer of 2003, zonal wave variancereaches values of∼35 m2 s−2 at the upper heights in Juneand July. Similarly, the summers of 2000, 2003, 2005 and2007 all show wave activity with variances in the range of 15to 40 m2 s−2. Careful inspection of the bandpass data (Fig.2)
Fig. 3. Time-height contours (filled color contours) of the monthlyvariance of winds band-passed between 12 and 20 days over Es-range in the Arctic for both meridional and zonal components, for1999 to 2009. Also plotted are the monthly-mean zonal winds. Thezero-wind line is indicated by the heavy dashed line.
www.atmos-chem-phys.net/10/1461/2010/ Atmos. Chem. Phys., 10, 1461–1472, 2010
1466 K. A. Day and N. J. Mitchell: The 16-day wave in the polar mesosphere
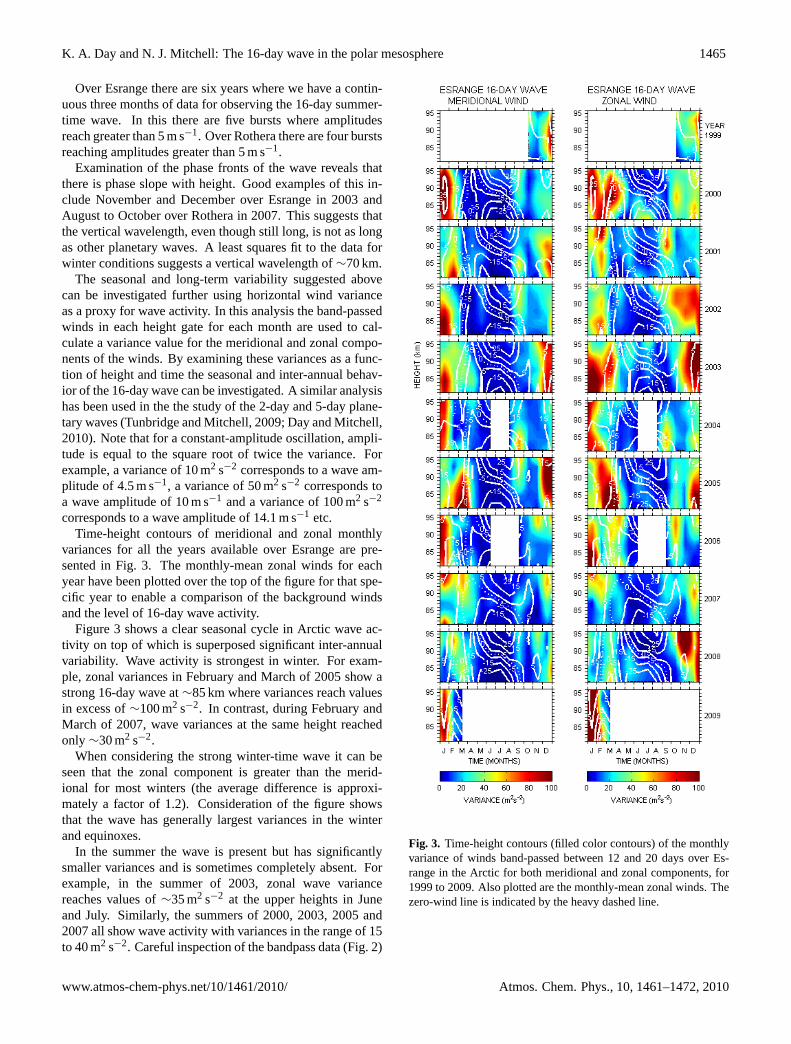
Fig. 4. Time-height contours (filled color contours) of the monthlyvariance of winds band-passed between 12 and 20 days overRothera in the Antartic for both meridional and zonal components,for 2005 to 2009. Also plotted are the monthly-mean zonal winds.The zero-wind line is indicated by the heavy dashed line.
reveals short-lived episodes of wave activity correspondingto these maxima in variance.
Figure4 shows the results of a similar analysis for windsrecorded over Rothera in the Antarctic during February 2005to July 2009. As with the Arctic results of Fig.3, these showa seasonal cycle and significant inter-annual variability. Theactivity maximizes strongly in winter, compared with sum-mer where it is weaker. For example, zonal variances duringAugust 2007 (Antarctic winter) show a strong 16-day wavein all the height gates observed, maximizing at∼92 km andreaching variances of∼100 m2 s−2. In contrast, during Au-gust 2005, wave variances at the same height reached only∼25 m2 s−2. The figure also shows a clear secondary max-imum in summer. For example, in January and February ofall of the years the variance reaches a maximum of about60 m2 s−2.
From Charney and Drazin theorem (1961), in order topropagate a planetary wave must obey 0< u − cx < Uc,whereu is the zonal wind speed, cx is the zonal phase speedof the planetary wave andUc is the critical Rossby speed.For the 16-day wave at a latitude of 68◦ the phase speed,cx , is −10.9 m s−1. The mean zonal wind speed,u, shouldthus be greater than−10.9 m s−1 for the wave to propagate.
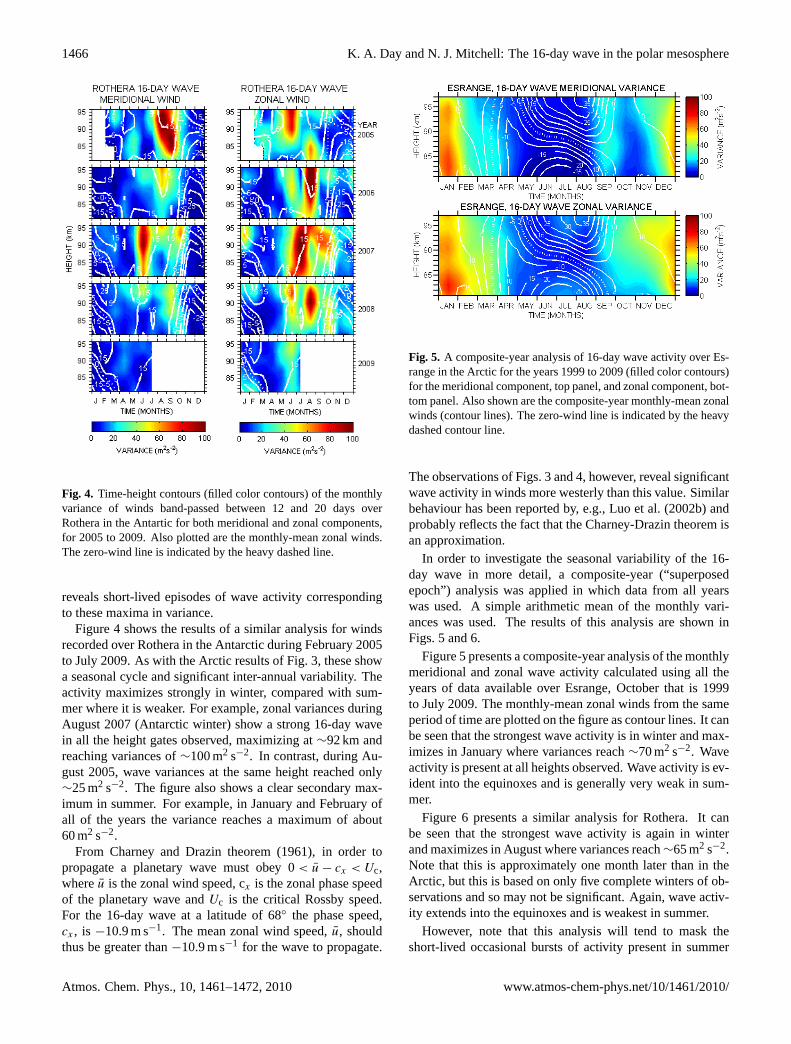
Fig. 5. A composite-year analysis of 16-day wave activity over Es-range in the Arctic for the years 1999 to 2009 (filled color contours)for the meridional component, top panel, and zonal component, bot-tom panel. Also shown are the composite-year monthly-mean zonalwinds (contour lines). The zero-wind line is indicated by the heavydashed contour line.
The observations of Figs.3 and4, however, reveal significantwave activity in winds more westerly than this value. Similarbehaviour has been reported by, e.g.,Luo et al.(2002b) andprobably reflects the fact that the Charney-Drazin theorem isan approximation.
In order to investigate the seasonal variability of the 16-day wave in more detail, a composite-year (“superposedepoch”) analysis was applied in which data from all yearswas used. A simple arithmetic mean of the monthly vari-ances was used. The results of this analysis are shown inFigs.5 and6.
Figure5 presents a composite-year analysis of the monthlymeridional and zonal wave activity calculated using all theyears of data available over Esrange, October that is 1999to July 2009. The monthly-mean zonal winds from the sameperiod of time are plotted on the figure as contour lines. It canbe seen that the strongest wave activity is in winter and max-imizes in January where variances reach∼70 m2 s−2. Waveactivity is present at all heights observed. Wave activity is ev-ident into the equinoxes and is generally very weak in sum-mer.
Figure 6 presents a similar analysis for Rothera. It canbe seen that the strongest wave activity is again in winterand maximizes in August where variances reach∼65 m2 s−2.Note that this is approximately one month later than in theArctic, but this is based on only five complete winters of ob-servations and so may not be significant. Again, wave activ-ity extends into the equinoxes and is weakest in summer.
However, note that this analysis will tend to mask theshort-lived occasional bursts of activity present in summer
Atmos. Chem. Phys., 10, 1461–1472, 2010 www.atmos-chem-phys.net/10/1461/2010/
K. A. Day and N. J. Mitchell: The 16-day wave in the polar mesosphere 1467
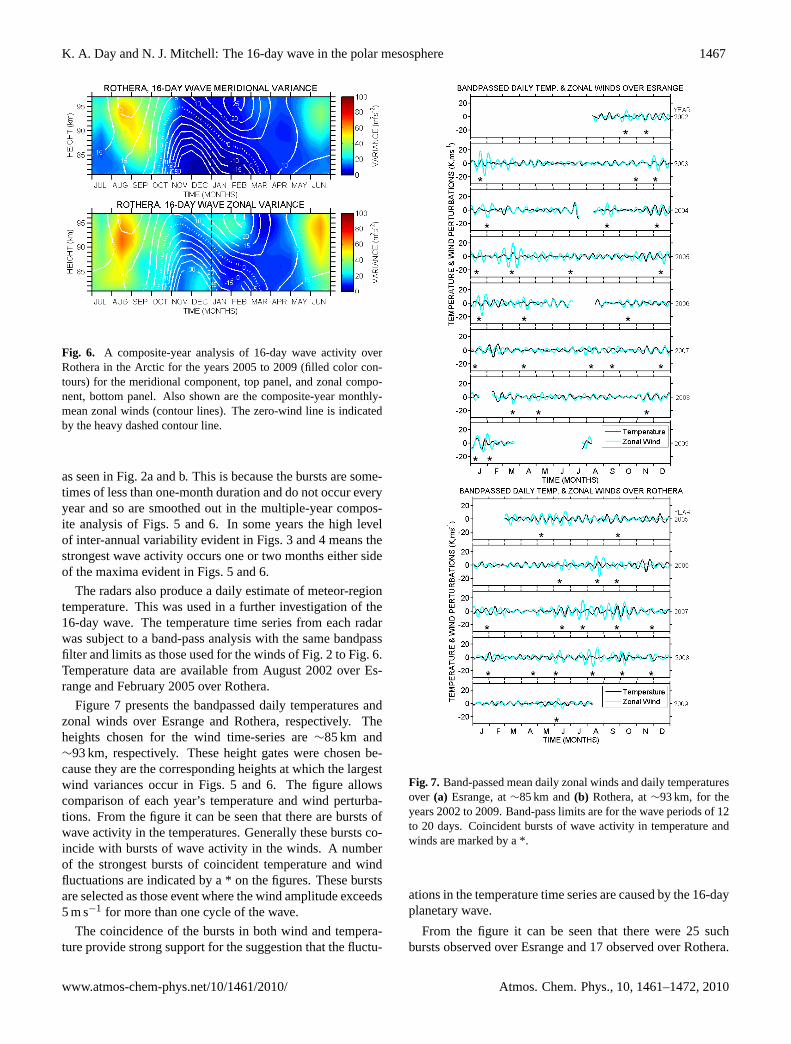
Fig. 6. A composite-year analysis of 16-day wave activity overRothera in the Arctic for the years 2005 to 2009 (filled color con-tours) for the meridional component, top panel, and zonal compo-nent, bottom panel. Also shown are the composite-year monthly-mean zonal winds (contour lines). The zero-wind line is indicatedby the heavy dashed contour line.
as seen in Fig.2a and b. This is because the bursts are some-times of less than one-month duration and do not occur everyyear and so are smoothed out in the multiple-year compos-ite analysis of Figs.5 and6. In some years the high levelof inter-annual variability evident in Figs.3 and4 means thestrongest wave activity occurs one or two months either sideof the maxima evident in Figs.5 and6.
The radars also produce a daily estimate of meteor-regiontemperature. This was used in a further investigation of the16-day wave. The temperature time series from each radarwas subject to a band-pass analysis with the same bandpassfilter and limits as those used for the winds of Fig.2 to Fig.6.Temperature data are available from August 2002 over Es-range and February 2005 over Rothera.
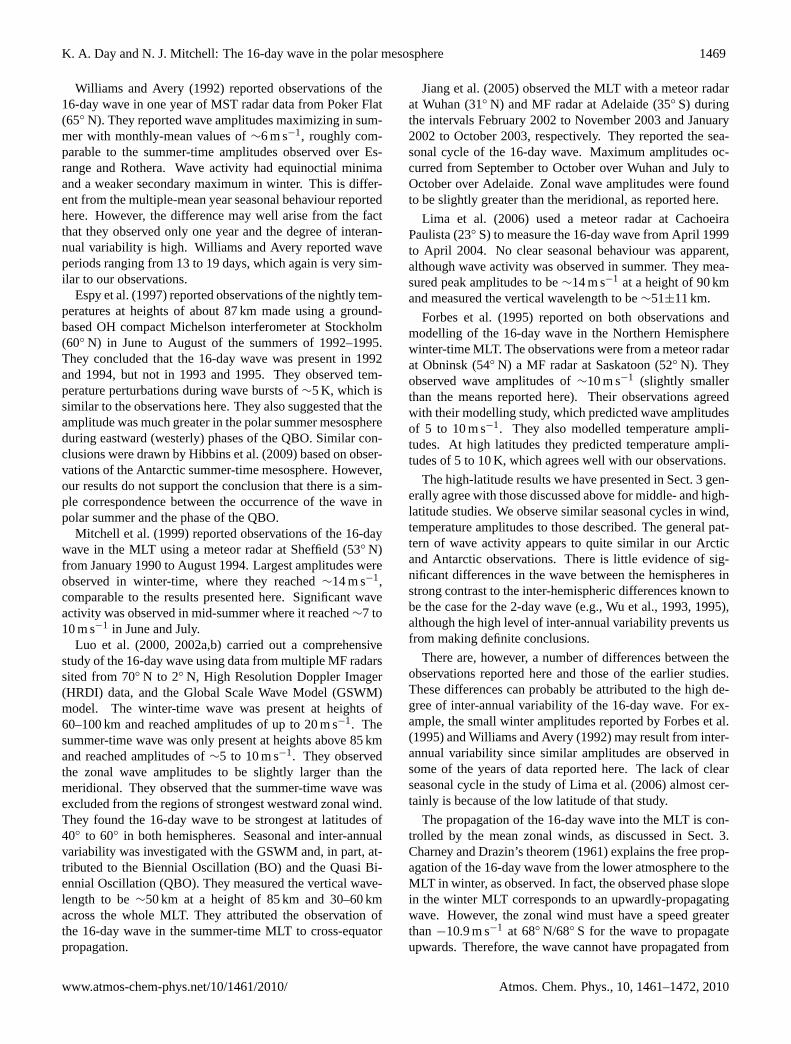
Figure7 presents the bandpassed daily temperatures andzonal winds over Esrange and Rothera, respectively. Theheights chosen for the wind time-series are∼85 km and∼93 km, respectively. These height gates were chosen be-cause they are the corresponding heights at which the largestwind variances occur in Figs.5 and 6. The figure allowscomparison of each year’s temperature and wind perturba-tions. From the figure it can be seen that there are bursts ofwave activity in the temperatures. Generally these bursts co-incide with bursts of wave activity in the winds. A numberof the strongest bursts of coincident temperature and windfluctuations are indicated by a * on the figures. These burstsare selected as those event where the wind amplitude exceeds5 m s−1 for more than one cycle of the wave.
The coincidence of the bursts in both wind and tempera-ture provide strong support for the suggestion that the fluctu-
Fig. 7. Band-passed mean daily zonal winds and daily temperaturesover (a) Esrange, at∼85 km and(b) Rothera, at∼93 km, for theyears 2002 to 2009. Band-pass limits are for the wave periods of 12to 20 days. Coincident bursts of wave activity in temperature andwinds are marked by a *.
ations in the temperature time series are caused by the 16-dayplanetary wave.
From the figure it can be seen that there were 25 suchbursts observed over Esrange and 17 observed over Rothera.
www.atmos-chem-phys.net/10/1461/2010/ Atmos. Chem. Phys., 10, 1461–1472, 2010

1468 K. A. Day and N. J. Mitchell: The 16-day wave in the polar mesosphere
Fig. 8. A least-square fit of temperature versus wind amplitude forbursts of activity over Esrange and Rothera that are greater than5 m s−1, last for longer than 1 cycle and passing the Student T-test90% confidence level.
Generally, larger bursts of activity in zonal winds correspondto larger bursts of activity in temperature perturbations. Forexample, in June 2003 over Esrange the∼15 m s−1 ampli-tude winds are accompanied by∼5 K amplitude temperatureperturbations. A similar event can be seen over Rothera inSeptember–October 2007. The wind perturbation and tem-perature perturbations are∼10 m s−1 and∼8 K, respectively.It can be seen that when the wind and temperature perturba-tions are at their largest values they appear to be generally inphase. This is evident in most events marked by a * in Fig.7.
The bursts of wave activity show that there is a relation-ship between wind and temperature perturbations. Generally,greater wind perturbations correspond to greater temperatureperturbations. The temperature perturbations range from 1 Kto more than 6 K. To quantify the relationship between them,a least squares fit of the wind and temperature amplitudes forthe above bursts of activity was carried out. The burst arealso subjected to the criteria of the Student T-test for them tobe statistically related at a 90% confidence level. Figure8,presents the wind and temperature amplitudes determinedfor the 35 burst of wave activity that satisfied this criterionover Esrange and Rothera. A least-squares straight-line fit tothese data suggests that temperature and wind perturbations,T ′ andu′, are related byT ′
= 0.27u′. Note that the fit wasforced through zero.
The seasonal behaviour of the 16-day wave can also beinvestigated using the temperature data. A temperature vari-ance can be used as a proxy for wave activity in much thesame way as the analysis of the wind data, although thereis no height resolution for the temperature data and thus itrepresents an average across the meteor region.
Fig. 9. A composite year analysis of the 16-day wave activity usingtemperatures over Esrange in the Arctic and Rothera in the Antarcticfor the years 2002 to 2009.
Further investigation into the seasonal variability of the16-day wave can be made by a composite-year variance anal-ysis of the temperatures, as per the results of Figs.5 and6. The results of this analysis are shown in Fig.9, whichpresents a composite-year analysis of the temperature vari-ances calculated using all the years data available. From thefigure it can be seen that the winter-time wave over Esrangeis large from November through to February, reaching vari-ances as large as∼13 K2. The summer-time wave is signif-icantly weaker and the variances only reach∼4 K2. In con-trast, the winter-time maximum is not evident over Rotheraand, in fact, the largest variances occur in November. Frominspection of Fig.7b it can be seen that this spring-timepeak largely results from the single large-amplitude event ofNovember 2006.
4 Discussion
There are a comparatively small number of published stud-ies of the 16-day wave in the polar MLT. Radar and satelliteobservations have revealed wave amplitudes of up to about15 m s−1 and 5 K. The wave has been observed to have a widerange of periods ranging from about 12 to 20 days. Theseobservations have been interpreted as a manifestation of theRossby (1,3) normal mode, proposed on theoretical groundsto have wave periods in the range of 11.1 to 20.0 days bySalby(1981b).
The results presented in Sect. 3 display a clear seasonalbehaviour in the occurrence of the 16-day wave in the po-lar MLT. The wave is evident mainly in the winter over thewhole height range observed, but is also present more weaklyin the summer-time. The zonal wind component is generallyslightly greater than the meridional.
Atmos. Chem. Phys., 10, 1461–1472, 2010 www.atmos-chem-phys.net/10/1461/2010/
K. A. Day and N. J. Mitchell: The 16-day wave in the polar mesosphere 1469
Williams and Avery(1992) reported observations of the16-day wave in one year of MST radar data from Poker Flat(65◦ N). They reported wave amplitudes maximizing in sum-mer with monthly-mean values of∼6 m s−1, roughly com-parable to the summer-time amplitudes observed over Es-range and Rothera. Wave activity had equinoctial minimaand a weaker secondary maximum in winter. This is differ-ent from the multiple-mean year seasonal behaviour reportedhere. However, the difference may well arise from the factthat they observed only one year and the degree of interan-nual variability is high. Williams and Avery reported waveperiods ranging from 13 to 19 days, which again is very sim-ilar to our observations.
Espy et al.(1997) reported observations of the nightly tem-peratures at heights of about 87 km made using a ground-based OH compact Michelson interferometer at Stockholm(60◦ N) in June to August of the summers of 1992–1995.They concluded that the 16-day wave was present in 1992and 1994, but not in 1993 and 1995. They observed tem-perature perturbations during wave bursts of∼5 K, which issimilar to the observations here. They also suggested that theamplitude was much greater in the polar summer mesosphereduring eastward (westerly) phases of the QBO. Similar con-clusions were drawn byHibbins et al.(2009) based on obser-vations of the Antarctic summer-time mesosphere. However,our results do not support the conclusion that there is a sim-ple correspondence between the occurrence of the wave inpolar summer and the phase of the QBO.
Mitchell et al.(1999) reported observations of the 16-daywave in the MLT using a meteor radar at Sheffield (53◦ N)from January 1990 to August 1994. Largest amplitudes wereobserved in winter-time, where they reached∼14 m s−1,comparable to the results presented here. Significant waveactivity was observed in mid-summer where it reached∼7 to10 m s−1 in June and July.
Luo et al. (2000, 2002a,b) carried out a comprehensivestudy of the 16-day wave using data from multiple MF radarssited from 70◦ N to 2◦ N, High Resolution Doppler Imager(HRDI) data, and the Global Scale Wave Model (GSWM)model. The winter-time wave was present at heights of60–100 km and reached amplitudes of up to 20 m s−1. Thesummer-time wave was only present at heights above 85 kmand reached amplitudes of∼5 to 10 m s−1. They observedthe zonal wave amplitudes to be slightly larger than themeridional. They observed that the summer-time wave wasexcluded from the regions of strongest westward zonal wind.They found the 16-day wave to be strongest at latitudes of40◦ to 60◦ in both hemispheres. Seasonal and inter-annualvariability was investigated with the GSWM and, in part, at-tributed to the Biennial Oscillation (BO) and the Quasi Bi-ennial Oscillation (QBO). They measured the vertical wave-length to be∼50 km at a height of 85 km and 30–60 kmacross the whole MLT. They attributed the observation ofthe 16-day wave in the summer-time MLT to cross-equatorpropagation.
Jiang et al.(2005) observed the MLT with a meteor radarat Wuhan (31◦ N) and MF radar at Adelaide (35◦ S) duringthe intervals February 2002 to November 2003 and January2002 to October 2003, respectively. They reported the sea-sonal cycle of the 16-day wave. Maximum amplitudes oc-curred from September to October over Wuhan and July toOctober over Adelaide. Zonal wave amplitudes were foundto be slightly greater than the meridional, as reported here.
Lima et al. (2006) used a meteor radar at CachoeiraPaulista (23◦ S) to measure the 16-day wave from April 1999to April 2004. No clear seasonal behaviour was apparent,although wave activity was observed in summer. They mea-sured peak amplitudes to be∼14 m s−1 at a height of 90 kmand measured the vertical wavelength to be∼51±11 km.
Forbes et al.(1995) reported on both observations andmodelling of the 16-day wave in the Northern Hemispherewinter-time MLT. The observations were from a meteor radarat Obninsk (54◦ N) a MF radar at Saskatoon (52◦ N). Theyobserved wave amplitudes of∼10 m s−1 (slightly smallerthan the means reported here). Their observations agreedwith their modelling study, which predicted wave amplitudesof 5 to 10 m s−1. They also modelled temperature ampli-tudes. At high latitudes they predicted temperature ampli-tudes of 5 to 10 K, which agrees well with our observations.
The high-latitude results we have presented in Sect. 3 gen-erally agree with those discussed above for middle- and high-latitude studies. We observe similar seasonal cycles in wind,temperature amplitudes to those described. The general pat-tern of wave activity appears to quite similar in our Arcticand Antarctic observations. There is little evidence of sig-nificant differences in the wave between the hemispheres instrong contrast to the inter-hemispheric differences known tobe the case for the 2-day wave (e.g.,Wu et al., 1993, 1995),although the high level of inter-annual variability prevents usfrom making definite conclusions.
There are, however, a number of differences between theobservations reported here and those of the earlier studies.These differences can probably be attributed to the high de-gree of inter-annual variability of the 16-day wave. For ex-ample, the small winter amplitudes reported byForbes et al.(1995) andWilliams and Avery(1992) may result from inter-annual variability since similar amplitudes are observed insome of the years of data reported here. The lack of clearseasonal cycle in the study ofLima et al.(2006) almost cer-tainly is because of the low latitude of that study.
The propagation of the 16-day wave into the MLT is con-trolled by the mean zonal winds, as discussed in Sect. 3.Charney and Drazin’s theorem (1961) explains the free prop-agation of the 16-day wave from the lower atmosphere to theMLT in winter, as observed. In fact, the observed phase slopein the winter MLT corresponds to an upwardly-propagatingwave. However, the zonal wind must have a speed greaterthan−10.9 m s−1 at 68◦ N/68◦ S for the wave to propagateupwards. Therefore, the wave cannot have propagated from
www.atmos-chem-phys.net/10/1461/2010/ Atmos. Chem. Phys., 10, 1461–1472, 2010
1470 K. A. Day and N. J. Mitchell: The 16-day wave in the polar mesosphere
below in summer-time because of the strong westward windsof the middle atmosphere.
Our observation show that the 16-day wave is largely ab-sent from the regions of strong westward flow observed insummer (e.g. Figs.5 and6) this therefore leads to the con-clusion that the wave has not propagated from below to theheights where it is observed. As discussed in Sect. 1, it hasbeen proposed that the summer-time wave activity must thenresult from either ducting across the equator from the winterhemisphere or from in situ excitation by modulated gravity-wave fluxes.
If ducting is indeed occurring from the winter to the sum-mer hemisphere, then simultaneous wave activity should beobserved in the Arctic and Antarctic. Considering the yearsof simultaneous data, occurrences of simultaneous wave ac-tivity can be searched for. The level of wave activity that wewill consider to be significant is taken to be monthly vari-ances of above an arbitrary threshold of 50 m2 s−2.
Using this criterion, Arctic winter-time wave activity ac-companied by simultaneous Antarctic summer-time wave ac-tivity can be seen in the Januaries of 2007, 2008, and 2009.Similarly, Antarctic winter-time wave activity accompaniedsimultaneously by Arctic summer-time wave activity can beseen in September 2005 and October 2006. These episodesare consistent with the possibility of inter-hemispheric duct-ing, but are not in themselves conclusive proof.
In contrast, there are also episodes of wave activity inthe winter-time which arenot accompanied by simultaneoussummer-time wave activity in the other hemisphere. In par-ticular, Arctic winter-time wave activity is not accompaniedby simultaneous Antarctic summer-time wave activity in Jan-uary 2006. Similarly, Antarctic winter-time wave activity notaccompanied by simultaneous Arctic summer-time wave ac-tivity in the Septembers of 2007 and 2008. These resultssuggest that ducting is not occurring in the high latitudesover Esrange and Rothera for at least some years and thattherefore if ducting does occur, it does not occur every year.One possible explanation for variability in inter-hemisphericducting has been proposed byEspy et al.(1997) and Hib-bins et al.(2009), who suggests that the QBO strongly mod-ulates such ducting, resulting in a QBO modulation of polarplanetary-wave activity in summer.
A deeper investigation of the role of inter-hemisphericducting would ideally require observations of the 16-daywave at low latitudes where the wave could be observed inany cross-equator duct. Such observations could be madeby low-latitude ground-based radars and/or by satellite ob-servations. Observations of a summer-time polar 16-daywave where no such wave was detected crossing the equa-tor would strongly support the proposal that the wave wasexcited in situ by modulated gravity-wave momentum fluxes(e.g.,Williams and Avery, 1992), whereas the presence ofsuch a wave at the equator would support the suggestionof inter-hemispheric ducting (e.g.,Miyahara et al., 1991b;
Forbes et al., 1995). We intend to investigate this possibilityin a follow-on study.
5 Conclusions
The 16-day wave has been observed in both the Arctic andAntarctic MLT using wind and temperature data. The obser-vations span several years and reveal a high level of inter-annual variability. Observations nevertheless demonstratethat the wave has a clear and well-defined seasonal cycle,which is very similar in each polar region. Throughout thewinter the wave is present in all the heights observed (∼80–100 km). Wave activity, measured by the winds, during thewinter-time was found to be strongest at a height of∼85 kmwhere it reached amplitudes in excess of∼15 m s−1. Asummer-time wave was also observed, but with weaker am-plitudes seldom in excess of∼6 m s−1. Weak wave activityis also evident throughout some of the equinoxes. In all sea-sons the wave amplitudes vary over time scales of a few tensof days. In the long-term average the wave amplitudes areslightly larger in the zonal component.
The temperature data also reveal a clear 16-day wave sig-nature. Temperature amplitudes typical range from 1 to 6 K.Examination of wind and temperature amplitudes suggests arelationship of formT ′
= 0.27u′.Comparisons with other studies reveal generally similar
seasonal behaviour, but some differences are apparent. How-ever the high level of inter-annual variability evident in ourextended data set suggests that such differences can be ex-plained by the shorter duration of other studies.
In some cases simultaneous wave activity is evident inthe winter and summer hemispheres. This observation isnot inconsistent with the suggestion that the 16-day waveobserved in the summer MLT has propagated there from thewinter hemisphere.
Edited by: F.-J. Lubken
References
Beard, A. G., Mitchell, N. J., Williams, P. J. S., Jones, W., andMuller, H. G.: Mesopause-region tidal variability observed bymeteor radar, Adv. Space Res., 20, 1237–1240, 1997.
Charney, J. G. and Drazin, P. G.: Propagation of planetary-scaledisturbances from lower into the upper atmosphere, J. Geophys.Res., 66, 83–109, 1961.
Day, K. A. and Mitchell, N. J.: The five-day wave in the arctic andantarctic mesosphere and lower thermosphere, J. Geophys. Res.,115, D091109, doi:10.1029/2009JD012545, 2010.
Dickinson, R. E.: Planetary Rossby waves propagating verticallythrough weak westerly wind wave guides, J. Atmos. Sci., 25,984–1002, 1968.
Espy, P. J. and Witt, G.: Observation of a quasi 16-day oscillation inthe polar summer mesospheric temperature, Geophys. Res. Lett.,23, 1071–1074, 1996.
Atmos. Chem. Phys., 10, 1461–1472, 2010 www.atmos-chem-phys.net/10/1461/2010/
K. A. Day and N. J. Mitchell: The 16-day wave in the polar mesosphere 1471
Espy, P. J., Stegman, J., and Witt, G.: Interannual variations of thequasi-16-day oscillation in the polar summer mesospheric tem-perature, J. Geophys. Res., 102, 1983–1990, 1997.
Forbes, J. M., Jun, G., and Miyahara, S.: On the interactions be-tween gravity waves and the diurnal propagating tides, Planet.Space Sci., 39, 1249–1257, 1991.
Forbes, J. M., Hagan, M. E., Miyahara, S., Vial, F., Mason, A. H.,Meek, C. E., and Portnyagin, Y. I.: Quasi 16-day oscillation inthe mesosphere and lower thermosphere, J. Geophys. Res., 100,9149–9163, 1995.
Hibbins, R. E., Jarvis, J. M., and Ford, E. A. K.: Quasi-biennialoscillation influence on long-period planetary waves in theAntarctic upper mesosphere, J. Geophys. Res., 114, D09109,doi:10.1029/2008JD011174, 2009.
Hocking, W., Singer, W., Bremer, J., Mitchell, N. J., Batista, P.,Clemesha, B., and Donner, M.: Meteor Radar Temperatures atmultiple sites derived with SKiYMET radars and compared toOH, rocket and lidar measurements, J. Atmos. Solar-Terr. Phys.,66, 585–593, 2004.
Hocking, W. K.: Temperatures using radar-meteor decay times,Geophys. Res. Lett., 26, 3229–3300, 1999.
Hocking, W. K., Kelley, M., Roger, R., Brown, W. O. J., Moorcroft,D., and St Maurice, J. P.: Resolute Bay VHF radar: A multipur-pose tool for studies of tropospheric motions, middle atmospheredynamics meteor physics and ionospheric physics, Radio Sci.,36, 1839–1857, 2001.
Jiang, G.-Y., Xiong, J.-G., Wan, W.-X., Ning, B.-Q., Liu, L.-B.,Vincent, R. A., and I., R.: The 16-day waves in the meso-sphere and lower thermosphere over Wuhan (30.6◦ N, 114.5◦ E)and Adelaide (35◦ S, 138◦ E), Adv. Space Res., 35, 2005–2010,2005.
Kumar, P. and Foufoula-Georgiou, E.: Wavelet analysis for geo-physical applications, Rev. Geophys., 35, 385–412, 1997.
Lastovicka, J., Sauli, P., and Krizan, P.: Persistance of planetarywave type oscillations in the mid-latitude ionosphere., Ann. Geo-phys., 49, 1189–1200, 2006.
Lima, L. M., Batista, P. P., Clemasha, B. R., and Takahashi, H.: 16-day wave observed in the meteor winds at low latitudes in thesouthern hemisphere, Adv. Space Res., 38, 2615–2620, 2006.
Luo, Y., Manson, A. H., Meek, C. E., Meyer, C. K., and Forbes,J. M.: The quasi 16-day oscillation in the mesosphere and lowerthermosphere at Saskatoon (52◦ N, 107◦ W), 1980–1996, J. Geo-phys. Res., 195, 2125–2138, 2000.
Luo, Y., Manson, A. H., Meek, C. E., Thayaparan, T., MacDougall,J., and Hocking, W. K.: The 16-day wave in the mesosphere andthe lower thermosphere: simultaneous observations at Saskatoon(52◦ N, 107◦ W), London (43◦ N, 81◦ W), Canada, J. Atmos.Solar-Terr. Phys., 64, 1287–1307, 2002a.
Luo, Y., Manson, A. H., Meek, C. E., Meyer, C. K., Burrage, M.D., Fritts, D. C., Hall, C. M., Hocking, W. K., MacDougall,J., Riggin, D. M., and Vincent, R. A.: The 16-day planetarywaves: multi-MF radar observations from the arctic to equatorand comparisons with the HRDI measurements and the GSWMmodelling results, Ann. Geophys., 20, 691–709, 2002b,http://www.ann-geophys.net/20/691/2002/.
Manson, A. H., Meek, C. E., and Hall, G. E.: Correlation of grav-ity waves and tides in the mesosphere over Sasktoon, J. Atmos.Solar-Terr. Phys., 60, 1089–1107, 1998.
Manson, A. H., Meek, C. E., Luo, Y., Hocking, W. K., MacDougall,
J., Riggin, D., Fritts, D. C., and Vincent, R. A.: Modulation ofgravity waves by planetary waves (2 and 16 d): observations withthe North American-Pacific MLT – MFR radar network, J. At-mos. Solar- Terr. Phys., 65, 85–104, 2003.
Merkel, A. W., Thomas, G. E., Palo, S. E., and Bailey, S. M.: Obser-vations of the 5-day planetary wave in PMC measurements fromthe Student Nitric Oxide Explorer Satellite, Geophys. Res. Lett.,30(4), 1196, doi:10.1029/2002GL016524, 2003.
Merkel, A. W., Garcia, R. R., Bailey, S. M., and Russell III, J. M.:Observational studies of planetary waves in PMCs and meso-spheric temperature measured by SNOE and SABER, J. Geo-phys. Res., 113, D14202, doi:10.1029/2007JD009396, 2008.
Mitchell, N. J., Middleton, H. R., Beard, A. G., Williams, P. J. S.,and Muller, H. G.: The 16-day planetary wave in the mesosphereand lower thermosphere, Ann. Geophys., 17, 1447–1456, 1999,http://www.ann-geophys.net/17/1447/1999/.
Mitchell, N. J., Pancheva, D., Middleton, H. R., and Hagan,M. E.: Mean winds and tides in the Artic mesosphere and lowerthermosphere, J. Geophys. Res.-Space Phys., 107, A11004,doi:10.1029/2001JA900127, 2002.
Miyahara, S. and Forbes, M.: Interactions between gravity wavesand the diurnal tide in the mesosphere and lower thermosphere,J. Meteorol. Soc. Jpn., 69, 523–531, 1991a.
Miyahara, S. P. Y. I., Forbes, J. M., and Solovjeva, T. V.: Meanzonal acceleration and heating of the 70- to 100-km region, J.Geophys. Res., 96, 1225–1238, 1991b.
Miyoshi, Y.: Numerical simulations of the 5-day and 16-day wavesin the mesopause region, Earth Planets Space, 51, 763–772,1999.
Nakamura, T., Fritts, D. C., Isler, J. R., Tsuda, T., Vincent, R. A.,and Reid, M.: Short-period fluctuations of the diurnal tide ob-served with low-latitude MF and meteor radars during CADRE:Evidence for gravity wave/tidal interactions, J. Geophys. Res.-Atmos., 102, 26225–26238, 1997.
Pancheva, D. and Mukhtarov, P.: Wavelet analysis on transient be-haviour of tidal amplitude fluctuations observed by meteor radarin the lower thermosphere above Bulgaria, Ann. Geophys., 18,316–331, 2000,http://www.ann-geophys.net/18/316/2000/.
Salby, M. L.: Rossby Normal Modes in Nonuniform BackgroundConfigurations. Part I: Simple fields, J. Atmos. Sci., 38, 1803–1826, 1981a.
Salby, M. L.: Rossby Normal Modes in Nonuniform BackgroundConfigurations. Part II: Equinox and Solstice Conditions, J. At-mos. Sci., 38, 1827–1840, 1981b.
Smith, A. K.: The origins of stationary planetary waves in the uppermesosphere, American Meteorological Society, pp. 3033–3041,2003.
Teitelbaum, H. and Vial, F.: On tidal variability induced by non-linear interaction with planetary waves, J. Geophys. Res., 96,14169–14178, 1991.
Thayaparan, T., Hocking, W. H., and MacDougall, J.: Observa-tional evidence of tidal/gravity wave interactions using the UWO2 MHz radar, Geophys. Res. Lett., 22, 373–376, 1995.
Tunbridge, V. M. and Mitchell, N. J.: The two-day wave in theAntarctic and Arctic mesosphere and lower thermosphere, At-mos. Chem. Phys., 9, 6377–6388, 2009,http://www.atmos-chem-phys.net/9/6377/2009/.
Williams, C. R. and Avery, S. K.: Analysis of long-period waves us-
www.atmos-chem-phys.net/10/1461/2010/ Atmos. Chem. Phys., 10, 1461–1472, 2010
1472 K. A. Day and N. J. Mitchell: The 16-day wave in the polar mesosphere
ing the mesosphere-stratosphere-troposphere radar at poker flats,Alaska, J. Geophys. Res., 97, 20855–20861, 1992.
Wu, D. L., Hays, P. B., Marshall, A. R., Burrage, M. D., Lieber-man, R. S., and Ortland, D. A.: Observations of the quasi 2-daywave from the high resolution doppler imager on UARS, Geo-phys. Res. Lett., 20, 2853–2856, 1993.
Wu, D. L., Fishbein, E. F., Read, W. G., and Waters, J. W.:Excitation and Evolution of the quasi-2-day wave observed inUARS/MLS temperature measurements, J. Atmos. Sci., 53, 728–738, 1995.
Atmos. Chem. Phys., 10, 1461–1472, 2010 www.atmos-chem-phys.net/10/1461/2010/