texas transportation institute -...
TRANSCRIPT

Texas Transportation Institute
Public Perceptions Regarding the Texas Department of Transportation: Focus Group Results Work performed under TxDOT RMC 0‐6581, Task 5
Tina Geiselbrecht, Timothy Lomax, and Joan Hudson September 30, 2009


iii
TABLE OF CONTENTS
Page
Executive Summary................................................................................................................................................. 1
What They Said ................................................................................................................................................... 1
The Take‐Aways and Some Possible Solutions.................................................................................................... 3
Introduction ............................................................................................................................................................ 5
Participant Recruitment .......................................................................................................................................... 6
Houston............................................................................................................................................................... 6
Killeen.................................................................................................................................................................. 8
Amarillo ............................................................................................................................................................... 8
El Paso ................................................................................................................................................................. 9
Brownsville .......................................................................................................................................................... 9
Brownwood......................................................................................................................................................... 9
Lufkin................................................................................................................................................................... 9
Arlington.............................................................................................................................................................. 9
Focus Group Discussion ........................................................................................................................................ 10
Role of TxDOT.................................................................................................................................................... 10
Impressions of TxDOT ....................................................................................................................................... 10
What Success Looks Like ................................................................................................................................... 10
Allocation Scenarios .......................................................................................................................................... 11
Observations by Region Type............................................................................................................................ 15
Conclusions ........................................................................................................................................................... 16
Recommendations ................................................................................................................................................ 17
Appendix A: Summary of Notes by Focus Group .................................................................................................. 19
Appendix B: Allocation Surveys............................................................................................................................. 28
Appendix C: Funding Allocation Survey Results ................................................................................................... 38
Appendix D: Funding Allocation Comments ........................................................................................................ 37
Appendix E: Demographics of Focus Groups ........................................................................................................ 39
Appendix F: Video Questionnaire Results ............................................................................................................ 40
Comments Received on the Video Questionnaire ............................................................................................ 42

iv
LIST OF FIGURES
Figure 1. Sample Flyer Used for Recruitment in Targeted Locations...................................................................... 7
Figure 2. Flyer as It Appeared in the Newspaper Advertisements. ........................................................................ 8
LIST OF TABLES
Table 1. 2009 Focus Group Allocations. .................................................................................................................. 2
Table 2. Lufkin Focus Group Allocation Survey. .................................................................................................... 13
Table 3. Arlington Focus Group Allocation Survey................................................................................................ 14
Table 4. 2009 Focus Group Allocations. ................................................................................................................ 15
Table 5. Amarillo Focus Group. ............................................................................................................................. 28
Table 6. Arlington Focus Group............................................................................................................................. 29
Table 7. Brownsville Focus Group. ........................................................................................................................ 30
Table 8. Brownwood Focus Group. ....................................................................................................................... 31
Table 9. El Paso Focus Group. ............................................................................................................................... 32
Table 10. Houston Focus Group. ........................................................................................................................... 33
Table 11. Killeen Focus Group............................................................................................................................... 34
Table 12. Lufkin Focus Group. ............................................................................................................................... 35
Table 13. Focus Group Allocations for Each Region.............................................................................................. 38
Table 14: Demographics of Focus Groups............................................................................................................. 39
Table 15. Video Questionnaire Results. ................................................................................................................ 40
1
“Projects take
too long. Once
done, they start
over on the
same road.”
Public Perceptions Regarding the Texas Department of Transportation: Focus Group Results
EXECUTIVE SUMMARY
Focus groups are an excellent method to delve into complicated issues and uncover what the public is
thinking, why they think that and how they react to additional information or alternative scenarios. The Texas
Transportation Institute (TTI) conducted a series of focus groups in July and August 2009 in eight Texas cities
designed to investigate issues relating to mobility, connectivity, pavement quality, funding and general
perceptions of Texas Department of Transportation (TxDOT) operations. The findings from the groups of seven
to 12 participants are not a statistical sample of public opinion.
The findings suggest several challenges for TxDOT in the topics of providing information about the
condition, status, plans and performance of the transportation system and the decision process for making
investments to improve the system. They also indicate a general understanding that the Texas road system is
better than that of nearby states and that the funding challenges are substantial. This executive summary
identifies several themes from the focus groups and suggests some steps that should be considered to address
the issues.
What They Said
Almost every focus group participant misunderstood some element of how TxDOT is funded. When
asked an open‐ended question like “where does TxDOT get its funding?,” few participants could identify even
the basic funding sources – fuel taxes and vehicle registration fees – and even fewer knew that public schools
are funded with fuel taxes. Other significant TxDOT funding issues – funding diversions to other agencies or
the general fund – were also not understood.
Focus group participants had a good understanding of TxDOT’s general role in the funding, creation
and maintenance of the street and highway network, and most understood that TxDOT had a small role in
public transportation. About half of the participants could identify that TxDOT had responsibility for some
major roads and the city or county was responsible for most minor roads. But the specific knowledge about
which roads are in which jurisdiction was found infrequently. Participants in most of the focus groups thought
that TxDOT could be spending its funds more wisely, specifically mentioning the following:
Long construction schedules mean a road is torn up, creating more congestion and travel difficulties for many years. Several construction stages covering only short sections of a corridor at a time were mentioned as harming motorists, truck routes, emergency services and adjacent businesses.
Many believed TxDOT was directly responsible for construction and expressed concern over construction workers standing idle or project work zones with no activity in them.
Roads that had recently been finished were being resurfaced (e.g., seal coat treatments) sooner than required.
Roads that were either inadequate when initially opened (e.g., not wide

2
enough) or poorly designed were mentioned as causing doubt about TxDOT’s planning, design and oversight program.
When the conversation turned to experience with roads in other states, Texas was generally
considered to have much better roads than neighboring states and in most cases better than any roads the
participants had experienced in the United States. Texas’ smooth roads and good rest areas were noted by
several travelers. Texas lagged behind in the perception of the extent and effectiveness of intercity and urban
public transportation modes and services. Several of the groups had the perception that the long‐range
transportation plans they knew about were mostly for roads and toll roads, and there was not enough
discussion about adapting to high gas prices, limited fuel, climate change policies or larger numbers of older
Texans who will be less able to drive.
After a brief explanation of the current transportation funding situation, participants were provided
with information about the future outcomes of a set of options for allocating TxDOT funding to two broad
categories: pavement maintenance and bridge quality versus urban mobility and rural connectivity. Current
and future conditions were calibrated to each focus group location using data on current conditions and
findings from the 2030 Committee Texas Transportation Needs Report. Participants were “given” $100 to
allocate to each of the two categories, with outcome conditions described for each $10 increment. In general
the pavement descriptions were similar, though the metro and urban groups focused on reducing congestion
and the rural group focused on improving rural connectivity. For all eight cities, the descriptions required that
$90 of the $100 be allocated to the pavement and bridge category to maintain current conditions. The initial
allocations were discussed among the group, and a re‐allocation was allowed although only small changes
were noted in most locations. A surprisingly large range of funding allocation was made with $46 to $82 for
pavement and bridge issues, as noted in Table 1. A simple average of the values indicates that in the present
environment of limited funding, participants are willing to see lower‐quality roads and more bridges with
weight limits in exchange for additional lanes and roads in urban areas and more divided highways in rural
areas.
Table 1. 2009 Focus Group Allocations.
Region Pavement/Bridge Mobility/Connectivity
Overall 64 36
Amarillo 82 18
Arlington 46 54
Brownsville 46 54
Brownwood 72 28
El Paso 55 45
Houston 70 30
Killeen 63 37
Lufkin 58 42
Current funding was noted as a significant barrier to progress, but there was general agreement
among the participants that their lack of current knowledge was a barrier to their support for funding
increases. If they could be convinced that their tax dollars were being well spent and that any additional taxes
would be well spent, the current system of vehicle registration and motor fuel taxes had the most support as

3
“Flying under
the radar” is
both appealing
and daunting.
“Success is when
I don’t have to
think about
TxDOT or the
roads – they just
work.”
the mechanism for increased funding. Tolls and vehicle travel fees had some support, but also met with more
skepticism about how these new processes would be instituted and fear about the misuse of the information
collected. It should also be noted that the participants mentioned safety needs, even though there were no
data available to identify the cost of those solutions.
When asked about a “successful” TxDOT, most participants identified solutions to the above problems
and perceived inadequacies, but they also mentioned that one of their problems was with the lack of
information about current and future activities. They appreciated the opportunity to talk to the researchers
about TxDOT and wished there were more opportunities to discuss concerns. They also wondered why there
was such a lack of knowledge about TxDOT within the group. Interestingly, a few
participants noted that this might be a good goal for TxDOT (expressed as “success is
when I don’t have to think about TxDOT or the roads – they just work”). But more
often the issue was approached from the perspective of requesting more information
about the agency, its performance, and current and future plans. Almost all
participants said they left knowing more than when they began the focus group and
looked forward to other opportunities to learn about transportation issues.
The Take‐Aways and Some Possible Solutions
The findings of the focus group discussion relate to two broad areas of potential future activity for
TxDOT. There are several issues related to activities that will address perceived shortcomings or enhance
areas of good practice or positive trends. There were also findings that point to how and when the messages
might be conveyed.
People Don’t Know Who You Are, What You Do or How You Get Your Money
This is the most significant and consistent finding in all eight focus groups. While the general activities
of TxDOT are well understood, that knowledge is very thin, and in many cases the “knowledge” is just wrong.
In some sense this is consistent with other technically oriented government agencies; the topics are complex,
the issues numerous, and the outcomes relatively mundane. The idea that success
means not thinking about transportation is both appealing if one likes “flying under the
radar” and daunting for an agency attempting to persuade the public of the value of its
services.
There must be a better education component to TxDOT’s program. Many
taxpayers do not know the basic information needed to properly assess transportation’s role in society and the
economy, and are even less equipped to properly judge TxDOT’s functions. An agency in this position is hard
pressed to have a discussion about the proper roles, expectations, vision and funding sources or levels. The
public must see the value they get for the limited funds available before the discussion can turn to what may
be done with additional funding.
Across the United States, over the past decade there have been several local and statewide elections
to increase funding, provide additional operating and funding flexibility, or develop new programs or projects
(American Road and Transportation Builders Association [ARTBA] website:
http://www.artba.org/advocacy/government‐affairs/transportations‐‐elections/ ). A review of these elections
suggests that they passed because the voters perceived the agency as operating efficiently and effectively, saw
the plan or program as providing good value for the expenditures, and saw the right amount of transparency

4
and accountability in place to maintain the schedule and budget that were promised (with updates and
changes as required by the projects).
The following message elements could help inform the public on some of the basic misunderstandings
identified in the focus groups. These are basic information pieces rather than a campaign storyboard; the
proper mix of message and target audiences was not the subject of this research effort:
What does the public care about?
Funding sources – where does the money come from?
Spending categories – where does the money go?
Funding trend – for the recent past revenues and near‐term future.
Improvement trends – the Interstate‐era spending in the 1960s and 1970s led to good conditions in the 1980s; now those roads have to be rebuilt, in addition to adding new capacity to handle growth.
Status of projects, programs and problems – building on the activities in Project Tracker, TxDOT’s web‐based project tracking website.
Current conditions – for all major TxDOT activities at the district, county and state level.
The goal of these efforts is to be consistent and persistent. Erroneous understanding and
misinformation will not be addressed in a few weeks, and trust is built over time. Effective communication on
the technical topics that make up the bulk of TxDOT’s program requires continuous interaction between the
public and the technical information providers; complicated topics require more than sound bites. The
information program must be a part of the commitment to transparency and accountability and should not be
conducted only when there is a push for additional funding. Focus group participants were ready to be
informed but appeared to be interested in a longer conversation about TxDOT’s needs. Building a base of
public information will lead to public support if TxDOT is doing a good job and making the best decisions. This
longer‐range view has proven to be successful in the past, and is more sustainable than a “momma wants new
shoes” approach to providing public information only during funding increase campaigns.
A Few Logical Information Steps
Project Tracker is a good beginning for the kind of information that the focus group participants
expressed a desire for. The information on projects and programs is an important component of the
accountability and transparency aspects. While Project Tracker was not reviewed in depth (and therefore we
cannot draw any conclusions about the style, format and organization of the website), the display and regular
updating of key public information will be important in the future.
Focus group participants indicated they were interested in learning more about important
transportation issues and TxDOT activities, but they did not think this education should be a product of
30‐second television commercials (i.e., they did not want to be “sold” on TxDOT). This seemed to be a product
of two issues – these are difficult concepts to communicate in a short time period and the suggestion that
television commercials would be produced at a high public cost. With all of the free media channels open to
an agency (e.g., Twitter, Facebook and its own website), there should be enough methods to provide an
interested public with facts, current conditions and forecasts as well as to share information through surveys
and study results. There may also be a role for viral or inexpensive information exchanges.
Building on reports and requirements from the Texas Legislature is another method for attracting
attention to public interest issues. Project Tracker can be the “source for everything you want to know about

5
TxDOT,” but content such as current weather and road conditions, traffic congestion maps, travel time
information, the 100 most congested roads, pavement quality maps and other elements may encourage
visitors to look at other pages on the website. These can be the portals that are used to pull citizens into the
information streams in a way that short‐time‐period campaigns cannot accomplish.
INTRODUCTION
Focus groups are an effective means of evaluating general perceptions of various topics. Focus group–
derived data allow for an in‐depth exploration of thoughts and opinions related to a particular topic, and
demonstrate how those thoughts and opinions are communicated. Focus groups can provide a qualitative
sample of public opinion that is particularly useful input as organizational changes are implemented.
TxDOT wished to develop an understanding of the current perceptions of the public about its agency,
its functions and processes, and plans for the future. A series of focus groups were conducted in July and
August 2009 to assess the strengths and weaknesses of TxDOT in a few significant topic areas. The output
identified issues and priorities that were important to the public. The information gathered and described in
this tech memo will be valuable input to TxDOT as new goals are developed and put forth. Moreover, the
results can be used to formulate clear, articulate messages that resonate with the public.
The following eight focus group locations offered geographic diversity as well as representation from
both urban and rural areas:
Amarillo,
Arlington,
Brownsville,
Brownwood,
El Paso,
Houston,
Killeen, and
Lufkin.
The focus group conversation concentrated on three main topics:
general impressions of TxDOT, the transportation system in Texas and what the public appreciates
about the system;
what actions and attributes would make TxDOT more successful, i.e., what success would look like
for the department; and
a discussion of funding priorities, which required participants to allocate available funding to
pavement, bridge, mobility and rural connectivity. Information for each location was developed so
that the input and resulting condition descriptions were meaningful to the participants. For
example, comparisons of pavement conditions for well‐known local roads and major highways

6
were noted to provide a connection between the “real world” and the 2007 pavement condition
measurements. The participants also received information on the urban travel time reduction
effects and the effect on intercity rural routes from added spending. The participants, thus, had
examples of the effects of various funding allocations and projected outcomes, benefits and
relative costs.
Each focus group session lasted two hours with a free exchange of ideas, questions and comments.
The elements of the discussion are reviewed in the next several sections, with particular attention to what the
participants said about current conditions and situations and what changes they might support.
PARTICIPANT RECRUITMENT
Recruitment of participants in the eight cities selected for the focus groups varied greatly depending
on the size of the city. For some cities such as Houston, El Paso and Arlington, the researchers had available to
them a list of past survey respondents who indicated a desire to participate in future research. These cities
also host offices of the Texas Transportation Institute in local office buildings, and researchers were able to
post flyers within those buildings to recruit locally (Figure 1). These same cities, along with the Killeen‐Temple
metropolitan area, also have active Craigslist websites. Response to posting the flyer in the “gig: event”
category on Craigslist in these cities was good, and in the case of Arlington the Craigslist users filled the session
before contact was able to be made with the list of past participants. While Amarillo and Brownsville have
their own Craigslist websites, the response from these locations was less than expected. The remaining cities,
Brownwood and Lufkin, do not have Craigslist websites dedicated to their specific cities but are included in the
Abilene and Tyler/East Texas websites, respectively. Posting the flyer on these websites attracted few
respondents. These two cities, along with Brownsville, had a much better response from the placement of the
flyer as an advertisement in their local newspapers (Figure 2).
The use of other means of recruitment, specifically community calendars, contact with social
organizations and social media venues such as Facebook, was not effective, except in the case of Amarillo,
when a TTI employee in College Station saw the request for contacts on Facebook and forwarded the contents
of the flyer to former classmates in the area. One social club located in the Amarillo area also responded to the
request to make the flyer available to its membership. The recruitment process for each city is detailed below.
Houston
The recruiter contacted participants from past focus groups who had indicated interest in future focus
groups and had provided email addresses. A flyer was also posted in the office building where the focus group
session would be held and emailed to three social groups in the area. Seventeen individuals responded, filling
the focus group and providing alternates should someone drop out.
Of the 17, one was from the previous focus group participant list, and at least four more were
recruited by word of mouth from that person. Two others were recruited by word of mouth from TTI
employees, and the rest responded to the flyer posted in the building.

7
Figure 1. Sample Flyer Used for Recruitment in Targeted Locations.

8
Figure 2. Flyer as It Appeared in the Newspaper Advertisements.
Killeen
No past participant list was available for recruiting purposes. While seeking a location to hold the
focus group, the recruiter also asked contacts if they would post the flyer. The Killeen YMCA agreed to post it
at the front desk. At Mary Hardin‐Baylor University, the student union was under renovation, but the contact
there asked that we send the flyer anyway and he would circulate it among the approximately 50 students that
were on campus for the summer. The recruiters also sent the flyer to Central Texas Community College to
post in the student union and to local libraries in Killeen, Harker Heights, Belton, Temple and Copperas Cove.
In addition, the contents of the flyer were posted to the Killeen‐Temple Craigslist website and two
online social organizations in the Killeen‐Temple area.
Of the individuals that registered, one person was recruited via the online social groups and three
others by direct contact from the recruiter in the process of making posting requests. The remaining people
were recruited via Craigslist, either directly or by word of mouth from the Craigslist participants.
Amarillo
No past participant list was available for this area. The recruiter requested that the flyer be posted at
the location of the focus group session and at the other libraries in the city. The contents of the flyer were
posted to the “event” category on the Amarillo Craigslist website, and a copy was sent to a local social club.
After receiving little response the first week of recruitment, a post was made on the personal Facebook
account of the recruiter, asking for friends with contacts in Amarillo to provide suggestions on additional
locations in the area to post the flyer. One individual who was recruited volunteered to post the flyer in her
place of employment, a health‐care facility.
One member from the social club was recruited to participate, at least one other participant was
recruited via a library flyer, one was recruited via word of mouth from a TTI employee in another division who

9
saw the Facebook post, and the remaining people were recruited after the Craigslist ad was reposted under
the “gig: event” category.
El Paso
The recruiter contacted participants from past focus groups who had indicated interest in future focus
groups and had provided email addresses. A flyer was also posted in the office building where the focus group
session would be held and was emailed to a local social organization. The contents of the flyer were also
posted to the El Paso Craigslist website. Four individuals responded from the past focus group participant list.
The rest of the participants were recruited equally from the building flyer and the Craigslist posting.
Brownsville
The recruiter requested that the flyer be posted at the local library as well as at the building hosting
the focus group session. The contents of the flyer were electronically posted on the Brownsville Craigslist
website and EventSetter.com website. After two weeks with very little response, a post for contacts in the
Brownsville area was placed on the recruiter’s personal Facebook page, hoping that more opportunities to
post flyers would be found, and a TTI employee from another program sent a flyer to a relative that works at
the University of Texas in Brownsville to post on campus. A final attempt to recruit participants was made by
placing an abbreviated version of the flyer as an advertisement in the Brownsville Herald on August 12, 2009.
Three participants were recruited via the Craigslist posting. No participants were recruited via
EventSetter.com, flyers or Facebook contacts. The newspaper advertisement filled the remainder of the focus
group slots and garnered several potential alternate attendees.
Brownwood
No past participant list was available. Researchers requested that the flyer be posted at the local
library. The flyer was electronically posted to the Abilene, Texas, Craigslist website, which covers the area of
Texas between Abilene and San Angelo. Only two participants were recruited via Craigslist after two weeks of
posting, so a newspaper ad was placed in the Brownwood Bulletin. The ad ran on Sunday, August 9, and
Tuesday, August 11. All of the remaining participants were recruited through the newspaper advertisement.
Lufkin
No past participant list was available. Researchers posted the contents of the flyer to the Tyler‐East
Texas Craigslist website and to the Lufkin Chamber of Commerce online calendar. The flyer was also sent to
acquaintances in Lufkin for general distribution. Four participants were recruited from the Craigslist posting.
An advertisement placed in the Sunday, August 23, edition of the Lufkin Daily News resulted in the recruitment
of the remaining participants.
Arlington
The focus group held at the TTI offices in Arlington on August 31 was recruited in its entirety from
individuals who responded to the posting of the flyer on the local Craigslist website. In this instance, the

10
“TxDOT should get
the project done
right the first
“Success means
not having to
worry about
dying.”
recruiter had to actively screen out residents of counties other than Tarrant County since the ad resulted in an
inundation of responses.
FOCUS GROUP DISCUSSION
Role of TxDOT
In each focus group, there is confusion over what TxDOT does. People understand that TxDOT handles
construction and maintenance of the roadway system. Not always clear, however, is which roads fall under
TxDOT’s jurisdiction. Farm‐to‐market roads are confused with county and city roads. Additionally, mass
transit services are often confused as a duty of the department. When asked, participants guessed
responsibilities such as issuing driver’s licenses, giving speeding tickets, installing fencing to keep the deer from
crossing the roads and setting tax rates. This misunderstanding points to the need to educate the public about
the role of the agency.
Impressions of TxDOT
Even though the responsibilities of TxDOT are not completely clear, there are definite opinions about
the job TxDOT is doing. Of highest profile are the construction projects. In each focus group, some issues
relating to projects taking too long, workers standing around and travel delays associated with construction
were conveyed. They say that maintenance should be the highest priority. There is an overall sense that the
agency is disorganized and wasteful.
There is a sense that congestion is getting worse and TxDOT is not doing an adequate job planning for
the future. As a Brownsville participant stated, “TxDOT should get the project done right the first time.”
Several of the cities mentioned the need for better public transportation as an
alternative approach to increased capacity projects. This sentiment is less apparent
in the large metropolitan areas where wider roadways with more lanes are desired.
Seeking more input from the public is preferred when making funding decisions and
acquiring right‐of‐way.
It is not all bad, however. Some very positive comments were heard. One person in Lufkin stated that
TxDOT is a very impressive organization. In both Amarillo and Brownwood, participants said that projects are
being done quickly. In Killeen and elsewhere, people indicated that highways in Texas are better than in other
states. In El Paso, half of the participants raised their hands saying that TxDOT is doing a good job at roadway
maintenance. The large metropolitan cities like Houston reported good impressions: they are very happy with
the finished I‐10 project. Even Arlington and Brownsville shared a few positive remarks. Therefore, virtually
every focus group indicated satisfaction with some aspect of the department.
What Success Looks Like
Success means not having to worry about dying, as one person in Brownsville put it. The need for safe
roads was heard across the state and surfaced in various discussions surrounding pavement condition, rest
areas, rumble strips, pavement markings, pedestrians, speed limits, nighttime
illumination, landscaping and trucks. It was quoted as the highest priority for TxDOT

11
“On I‐30 there was a
pothole big enough to
hurt a car. Some sort of
hotline would be good.”
in focus groups across the state. Even though they could not use this priority in the funding allocation survey,
they considered it when “spending” their $100 in the funding exercise.
After safety, the next most frequently heard measure of success surrounds maintenance. When it
comes to maintenance, people desire smooth roads where debris is swept clean, structures are repaired
quickly, traffic signs are clear, and potholes are fixed. One person in Arlington said, “On I‐30 there was a
pothole big enough to hurt a car. Some sort of hotline would be good.”
Problems associated with large aggregate surfaced in more than one focus
group as reports of broken windshields and uncomfortable rides were made.
Roadside mowing was mentioned in Brownsville as a way to measure success.
A Lufkin participant had a creative idea about using the roadside as a place to
harvest grass.
Finally, planning for the future was stated as a measure of success. They want smooth‐flowing traffic
using available technology like warning systems that alert drivers of incidents. In El Paso, someone mentioned
the way crashes were quickly moved off the highway in Las Vegas, Nevada, where he/she used to live. It does
not happen as quickly in El Paso, resulting in congestion and frustration. Planning also means understanding
where growth will occur and accommodating it appropriately. The oil shortage, global warming and massive
increases in gas prices need to be addressed by providing alternatives to driving alone. One Lufkin participant
said that TxDOT should not be so interested in pouring concrete. Involving the public in these processes is
also a part of good planning practices. Part of good planning practices means communicating with other local
agencies. Several participants mentioned the need for more cooperation and coordination among agencies in
planning for the future.
Allocation Scenarios
The element of the focus groups that dealt with the funding allocation issue drew upon the findings of
the 2030 Needs Report and the current pavement condition rating surveys. The regional needs and current
trends were combined into an information document that provided participants with realistic choices
connected to expected outcomes based on current revenue trends. The pavement and mobility allocation
surveys (described below) used in one metropolitan region and one rural area are illustrated in Tables 2 and 3.
Pavement and bridge quality – While the 2030 Needs Report analysis only produced statewide
pavement and bridge maintenance cost information, the district‐level condition studies conducted
every year provided information to guide the preparation of the condition scenarios. In all eight
regions, “keep pavement and bridge ratings where they are now” required 90 percent of the
funding; this might be on the low end of the necessary percentage of spending depending on the
amount and type of growth. All of the scenarios were phrased in similar ways. Bridge
deterioration was described as resulting in load‐limiting bridges (rather than identifying “bridges
falling down”) based on input from subject experts and a desire to keep pavement concerns
separate from safety concerns. Examples of pavement condition rating were provided by pointing
to specific road sections and using pictures of roads with pavement scores.
Urban mobility and rural connectivity – Focus groups in larger population centers were presented
with choices that described the effects on congestion due to the variety of investment levels.

12
Rural and small area urban choices concentrated on expected investments in wider and divided
highways linking to larger towns or major routes.
The participants were informed about the general trend in vehicle registration fees and motor fuel tax
receipts over the last 20 years to clear any misinformation on that topic. They were advised of their choices
and the need to spend only $100, and allowed 10 minutes to study the pictures and consider their choices.
The participants made their choices individually for the most part, but the group was then asked to discuss
their choices and then allowed to re‐prioritize their “spending” after hearing other participants’ thoughts; in
most cases no changes were made.
Table 4 illustrates the final spending profiles for each focus group. While there was support for
maintaining the system, it should be noted that the average of each focus group was below the 90 percent of
spending needed to keep pavements in their current condition. No one is suggesting that maintenance of the
current system is not important, and the authors recognize that pavement quality deterioration has a
nonlinear effect on the cost to repair damage (i.e., it is much more costly to repair a road that is damaged than
it is to keep a road from becoming damaged). But the percentages show that in a time of limited funding,
there is support for allowing minor roads to deteriorate if more divided highways can be constructed and
travel times can be reduced.

13
Table 2. Lufkin Focus Group Allocation Survey.
Dollar Value
Pavement and Bridge Quality Dollar Value
Mobility and Connections to Other Cities
0 None of the roads have “good” pavement quality. Average road is “poor” – like 1st Street between Abney and Lufkin.
0 Current roads only
10 10 percent of all roads have “good” or “very good” pavement quality. Average road is “poor” – like 1st Street between Abney and Lufkin.
10 A few major four‐lane roads that do not have a median are divided.
20 20 percent of all roads have “good” or “very good” pavement quality. Average road is “poor” – like 1st Street between Abney and Lufkin.
20 Half of the major four‐lane roads that do not have a median are divided.
30 30 percent of all roads have “good” or “very good” pavement quality. Average road is “fair” – like Raguet Street between Henderson and Thompson or Frank Avenue (SH 94) between Bynum and Herndon.
30 All major four‐lane roads that do not have a median are divided.
40 40 percent of all roads have “good” or “very good” pavement quality. Average road is “fair” – like Raguet Street between Henderson and Thompson or Frank Avenue (SH 94) between Bynum and Herndon.
40 All major and a few minor four‐lane roads that do not have a median are divided.
50 50 percent of all roads have “good” or “very good” pavement quality. Average road is “fair” – like Raguet Street between Henderson and Thompson or Frank Avenue (SH 94) between Bynum and Herndon.
50 All major and many minor four‐lane roads that do not have a median are divided.
60 60 percent of all roads have “good” or “very good” pavement quality. Average road is “fair” – like Raguet Street between Henderson and Thompson or Frank Avenue (SH 94) between Bynum and Herndon.
60 All major and most minor four‐lane roads that do not have a median are divided.
70 70 percent of all roads have “good” or “very good” pavement quality. Average road is “good” – like 1st Street between Lufkin and Timberland.
70 All major and minor four‐lane roads that do not have a median are divided.
80 80 percent of all roads have “good” or “very good” pavement quality. Average road is “good” – like 1st Street between Lufkin and Timberland.
80 All major and minor four‐lane roads that do not have a median are divided. One major congested street is widened.
90 88 percent of all roads have “good” or “very good” pavement quality. This is close to the current condition. Average road is “good” – like 1st Street between Lufkin and Timberland.
90 All major and minor four‐lane roads that do not have a median are divided. A few major congested streets are widened.
100 93 percent of all roads have “good” or “very good” pavement quality. Average road is “very good” – like John Redditt Drive (US 69) between Raguet Street and Frank Avenue (SH 94).
100 All major and minor four‐lane roads that do not have a median are divided. A few major congested streets are widened, and one major congested rural road is widened.

14
Table 3. Arlington Focus Group Allocation Survey.
Dollar Value
Pavement and Bridge Quality Dollar Value
Congestion
0 None of the roads have “good” pavement quality. Average road is “poor” – like SH 360 Freeway between Park Row and Division Street or Pioneer Parkway between Center and Collins.
0 A trip that takes 25 minutes now will take 60 minutes; stop‐and‐go traffic on many roads and freeways for 8.5 hours each weekday.
10 5 percent of all roads have “good” or “very good” pavement quality. Average road is “poor” – like SH 360 Freeway between Park Row and Division Street or Pioneer Parkway between Center and Collins.
10 A trip that takes 25 minutes now will take 58 minutes; stop‐and‐go traffic on many roads and freeways for 8.5 hours each weekday.
20 10 percent of all roads have “good” or “very good” pavement quality. Average road is “poor” – like SH 360 Freeway between Park Row and Division Street or Pioneer Parkway between Center and Collins.
20 A trip that takes 25 minutes now will take 56 minutes; stop‐and‐go traffic on many roads and freeways for 8.5 hours each weekday.
30 20 percent of all roads have “good” or “very good” pavement quality. Average road is “fair” – like Cooper Street between Park Row and Abrams.
30 A trip that takes 25 minutes now will take 54 minutes; stop‐and‐go traffic on many roads and freeways for 8 hours each weekday.
40 30 percent of all roads have “good” or “very good” pavement quality. Average road is “fair” – like Cooper Street between Park Row and Abrams.
40 A trip that takes 25 minutes now will take 52 minutes; stop‐and‐go traffic on many roads and freeways for 8 hours each weekday.
50 40 percent of all roads have “good” or “very good” pavement quality. Average road is “fair” – like Cooper Street between Park Row and Abrams.
50 A trip that takes 25 minutes now will take 50 minutes; stop‐and‐go traffic on many roads and freeways for 7.5 hours each weekday.
60 50 percent of all roads have “good” or “very good” pavement quality. Average road is “fair” – like Cooper Street between Park Row and Abrams.
60 A trip that takes 25 minutes now will take 48 minutes; stop‐and‐go traffic on many roads and freeways for 7.5 hours each weekday.
70 60 percent of all roads have “good” or “very good” pavement quality. Average road is “good” – like the SH 360 frontage roads north of I‐30 Freeway.
70 A trip that takes 25 minutes now will take 46 minutes; stop‐and‐go traffic on many roads and freeways for 7.5 hours each weekday.
80 70 percent of all roads have “good” or “very good” pavement quality. Average road is “good” – like the SH 360 frontage roads north of I‐30 Freeway.
80 A trip that takes 25 minutes now will take 44 minutes; stop‐and‐go traffic on many roads and freeways for 7 hours each weekday.
90 Three‐fourths of all roads have “good” or “very good” pavement quality. This is close to the current condition. Average road is “good” – like the SH 360 frontage roads north of I‐30 Freeway.
90 A trip that takes 25 minutes now will take 42 minutes; stop‐and‐go traffic on many roads and freeways for 7 hours each weekday.
100 85 percent of all roads have “good” or “very good” pavement quality. Average road is “very good” – like SH 360 Freeway south of I‐20 Freeway.
100 A trip that takes 25 minutes now will take 40 minutes; stop‐and‐go traffic on many roads and freeways for 7 hours each weekday.

15
“Congestion is like breathing. It is a fact of life. I grew up in traffic.”
Table 4. 2009 Focus Group Allocations.
Region Pavement/Bridge Mobility/Connectivity
Overall 64 36
Amarillo 82 18
Arlington 46 54
Brownsville 46 54
Brownwood 72 28
El Paso 55 45
Houston 70 30
Killeen 63 37
Lufkin 58 42
Observations by Region Type
No single summary of the findings is possible; each of the eight regions had interesting facets to the
spending allocations, and the results were not easily summarized by “metropolitan” or “rural.” The categories
used below describe the set of choices provided to the participants. Participants in all groups recognized the
need for additional funding and appeared to be open to an informed discussion about the alternative sources
and uses of funds. Most groups also included a discussion about the types of congestion solutions that would
be deployed, with some support for public transportation in all eight groups. Focus group participants in the
smaller regions indicated both an understanding of the transportation needs of large population centers and a
willingness to discuss a reduction in funding for their region to address the “big city” needs.
Large Metropolitan Regions
The high pavement/bridge scores in Houston were due to two factors: the negative effects of potholes
and rough pavement on safety and the relatively small gains in travel time that would be achieved for
additional spending on mobility improvement. They accept congestion as a way
of life as one person said, “Congestion is like breathing. It is a fact of life. I grew
up in traffic.” The Arlington group took the expected approach for a major region
(and did not include safety in their maintenance thinking); participants favored
mobility funding over pavement quality, despite the low 2007 pavement scores.
Small Metropolitan Regions
Brownsville and El Paso illustrated similar choices with comments focusing on the relatively good road
conditions now and the need to improve urban congestion levels and major intercity routes.
Rural Regions The rural and small urban focus groups in Amarillo, Lufkin, Brownwood and Killeen allocated more
than half of their share of funding to maintaining smooth roads and bridges, but most of them saw the need to
spend funds addressing the connectivity problems.
16
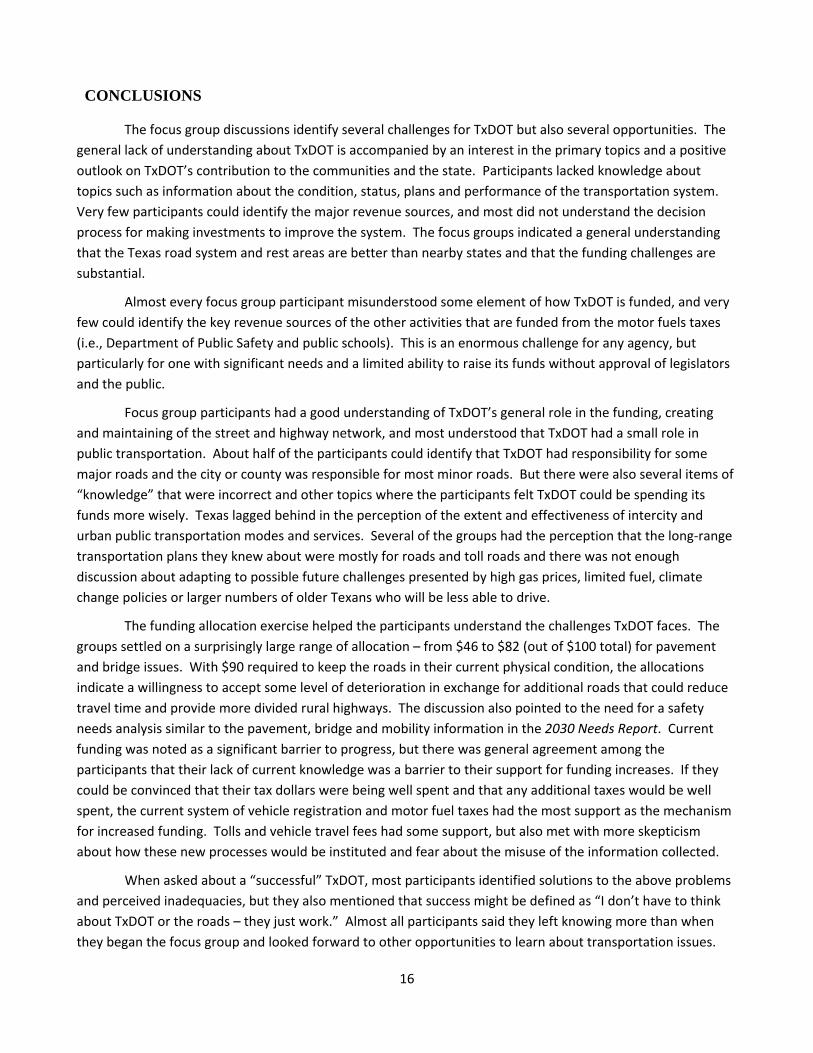
CONCLUSIONS
The focus group discussions identify several challenges for TxDOT but also several opportunities. The
general lack of understanding about TxDOT is accompanied by an interest in the primary topics and a positive
outlook on TxDOT’s contribution to the communities and the state. Participants lacked knowledge about
topics such as information about the condition, status, plans and performance of the transportation system.
Very few participants could identify the major revenue sources, and most did not understand the decision
process for making investments to improve the system. The focus groups indicated a general understanding
that the Texas road system and rest areas are better than nearby states and that the funding challenges are
substantial.
Almost every focus group participant misunderstood some element of how TxDOT is funded, and very
few could identify the key revenue sources of the other activities that are funded from the motor fuels taxes
(i.e., Department of Public Safety and public schools). This is an enormous challenge for any agency, but
particularly for one with significant needs and a limited ability to raise its funds without approval of legislators
and the public.
Focus group participants had a good understanding of TxDOT’s general role in the funding, creating
and maintaining of the street and highway network, and most understood that TxDOT had a small role in
public transportation. About half of the participants could identify that TxDOT had responsibility for some
major roads and the city or county was responsible for most minor roads. But there were also several items of
“knowledge” that were incorrect and other topics where the participants felt TxDOT could be spending its
funds more wisely. Texas lagged behind in the perception of the extent and effectiveness of intercity and
urban public transportation modes and services. Several of the groups had the perception that the long‐range
transportation plans they knew about were mostly for roads and toll roads and there was not enough
discussion about adapting to possible future challenges presented by high gas prices, limited fuel, climate
change policies or larger numbers of older Texans who will be less able to drive.
The funding allocation exercise helped the participants understand the challenges TxDOT faces. The
groups settled on a surprisingly large range of allocation – from $46 to $82 (out of $100 total) for pavement
and bridge issues. With $90 required to keep the roads in their current physical condition, the allocations
indicate a willingness to accept some level of deterioration in exchange for additional roads that could reduce
travel time and provide more divided rural highways. The discussion also pointed to the need for a safety
needs analysis similar to the pavement, bridge and mobility information in the 2030 Needs Report. Current
funding was noted as a significant barrier to progress, but there was general agreement among the
participants that their lack of current knowledge was a barrier to their support for funding increases. If they
could be convinced that their tax dollars were being well spent and that any additional taxes would be well
spent, the current system of vehicle registration and motor fuel taxes had the most support as the mechanism
for increased funding. Tolls and vehicle travel fees had some support, but also met with more skepticism
about how these new processes would be instituted and fear about the misuse of the information collected.
When asked about a “successful” TxDOT, most participants identified solutions to the above problems
and perceived inadequacies, but they also mentioned that success might be defined as “I don’t have to think
about TxDOT or the roads – they just work.” Almost all participants said they left knowing more than when
they began the focus group and looked forward to other opportunities to learn about transportation issues.

17
RECOMMENDATIONS
The most significant and consistent finding in all eight focus groups was that most Texans generally
understand TxDOT’s operations, but that knowledge is very thin and in many cases wrong. In some sense this
is consistent with other technically oriented government agencies; the topics are complex, the issues
numerous and the outcomes relatively mundane. The idea that success means not thinking about
transportation is both appealing if one likes “flying under the radar” and daunting for an agency attempting to
persuade the public of the value of its services.
There must be an education component to TxDOT’s program – Many taxpayers do not know the
basic information needed to properly assess transportation’s role in society and the economy, and
are even less equipped to properly judge TxDOT’s functions. An agency in this position is hard
pressed to have a discussion about the proper roles, expectations, vision and funding sources or
levels. The public must see the value they get for the limited funds available before the discussion
can turn to what may be done with additional funding. Focus group participants in the smaller
regions indicated both an understanding of the transportation needs of large population centers
and a willingness to discuss a reduction in funding for their region to address the “big city” needs.
Education must be followed by action – Across the United States, over the past decade there have
been several local and statewide elections to increase funding, provide additional operating and
funding flexibility, or develop new programs or projects
(http://www.artba.org/advocacy/government‐affairs/transportations‐‐elections/). A review of
these elections suggests that they passed because the voters perceived the agency as operating
efficiently and effectively, saw the plan or program as providing good value for the expenditures,
and saw the right amount of transparency and accountability in place to maintain the schedule and
budget that were promised (with updates and changes as required by the projects). Such an
approach puts pressure on the agency to perform well, to tell the public about good and bad
performance, and to develop plans that react to public needs.
A few basic message elements communicated persistently and consistently will help – The ideas
below are basic information pieces rather than a “campaign storyboard”; the proper mix of
message and target audiences was not the subject of this research effort.
o What does the public care about?
o Funding sources – where does the money come from?
o Spending categories – where does the money go?
o Funding trend – for the recent past revenues and near‐term future.
o Improvement trends – the Interstate‐era spending in the 1960s and 1970s led to good
conditions in the 1980s; those roads have to be rebuilt, in addition to adding new capacity
to handle growth.
o Status of projects, programs and problems – building on the activities in Project Tracker.
o Current conditions – for all major TxDOT activities at the district, county and state level.
Effective communication on the technical topics that make up the bulk of TxDOT’s program requires
continuous interaction between the public and the technical information providers; complicated topics require

18
more than sound bites. The information program must be a part of the commitment to transparency and
accountability and should not be conducted only when there is a push for additional funding. Focus group
participants were ready to be informed but appeared to be interested in a longer conversation about TxDOT’s
needs. Project Tracker is a good example of the kind of information for which focus group participants
expressed a desire.
Focus group participants indicated they were interested in learning more about important
transportation issues and TxDOT activities, but they did not think this education should be a product of
30‐second television commercials (i.e., they did not want to be “sold” on TxDOT). This seemed to be a product
of two issues – the fact that these are difficult concepts to convey in short time periods and television
commercials would be produced at a high public cost. With all of the free media channels open to an agency
(e.g., Twitter, Facebook and its own website), there should be enough methods to provide an interested public
with facts, current conditions and forecasts as well as to share information through surveys and study results.
There may also be a role for viral or inexpensive information exchanges.
Building on reports and requirements from the Texas Legislature is another method for attracting
attention to public interest issues. Project Tracker can be the “source for everything you want to know about
TxDOT,” but content such as current weather and road conditions, traffic congestion maps, travel time
information, the 100 most congested roads, pavement quality maps and other elements may encourage
visitors to look at other pages on the website. These can be the portals that are used to pull citizens into the
information streams in a way that short‐time‐period campaigns cannot accomplish.

19
APPENDIX A: SUMMARY OF NOTES BY FOCUS GROUP
Amarillo
Seven participants were female, and three were male. Two were students, six were employed, and
two were unemployed.
Impressions of TxDOT:
TxDOT is responsible for road construction and associated delays, roadway maintenance, expansion
projects, planning and street signs
Participants also list responsibilities that belong to other agencies: issue driver’s licenses, perform red
light enforcement, issue speeding tickets and set tax rates
Need to educate the public about the role of the agency
The freeway congestion is getting worse; much delay due to construction projects
Maintenance should be the highest priority since repairs are not being done quickly enough, though
one participant was surprised by quickness of project completion
Focus on inspecting and repairing overpasses
Debris removal is not occurring
Success Looks Like:
Traffic flowing smoothly; TxDOT does a good job timing signals
Seek input from the public on funding decisions; more needed
Success is not having to think about it; TxDOT has done a good job in this regard
Better planning needed because Amarillo is becoming congested
Safe roads should be a priority
There is not a big difference in roadways in Texas as compared to New Mexico and Oklahoma
Nine participants say TxDOT is successful, while one says maybe
The Funding Game:
One participant knew that TxDOT is funded through the gas tax
One participant said that tying fuel consumption to revenue generation is a problem because people
are encouraged to consume less fuel; this same participant said that increasing the vehicle registration
fee might be a better way to bring in revenue
None are aware of the diversions of the gas tax to the Department of Public Safety or education; mixed
responses on whether funding education from the gas tax is a good idea
Need to educate the public on how transportation in the state is funded
All of the participants placed a higher priority on pavement and bridge quality with most putting
70 percent of their money there over connecting to other cities
The Future:
Participants generally agree that toll roads are a good way to make money; equity issues surrounding
toll roads were mentioned by several participants
Two participants said they would not support a tax increase, while four agree to an incremental
approach of raising gas taxes, with a set maximum

20
When asked about paying fees based on mileage, all participants said they do not support such a
concept; the fuel tax is effectively “hidden,” so drivers are unaware they are being charged, while
mileage‐based fees are not hidden, so the public would attempt to bypass the fee
Rest areas are getting too big; all that is needed is a bathroom and water fountain
Dislike automated speed enforcement
People here drive larger vehicles for safety and do not intend to buy a hybrid
Participants agree that roadways will deteriorate if funding is not increased
Arlington
Four females and three males participated. Most have lived in the area for more than 10 years. All are
employed, but all mentioned the need for the extra money for participating in the focus group.
Impressions of TxDOT:
Waste money
TxDOT does a fairly decent job (give them a C+ or B‐)
They do a quick fix and perform shoddy work on repairing potholes
Not doing a good job handling growth; by the time projects are done, they are already outdated
In construction zones, many people are not working
Construction projects take too long
Success Looks Like:
Better roads
Safety – repairing the roads
Roadway expansion; more lanes and wider roadways
Bridge maintenance
Priority should be on maintenance, not on making things pretty; another disagrees; nice trees and
landscaping stimulates senses, so more likely to stay awake; trees in median block headlight glare;
safety concern with trees in median, though
Good lighting along the highway
The Funding Game:
No one knows how TxDOT is funded
Three of the seven place higher priority on pavement quality, while two put priority on mobility and
congestion, and two gave 50/50 split
Should not send our tax dollars to other states
Increase sin tax and take a percentage for transportation
Recognize that TxDOT does need help
Not opposed to gas tax increase as long as they have assurance that things will get done
Skeptical about giving more money to the government
Most are interested in the “pay as you go” alternative to the gas tax; would like to see more
information
The Future:

21
The system will look much like it does today 20 years from now
In favor of wider and more lanes
Rest areas are important, and there are not enough of them
Call boxes are good where there is no cell phone coverage
Concerned with privacy issues; do not want to be tracked
Brownsville
Six males and four females participated. Nine of the ten participants are lifelong residents of the area.
Two are disabled, two are students, and five are employed full time.
Impressions of TxDOT:
Construction projects take too long and, once finished, begin again
Responsibilities include maintaining highways, frontage roads and farm roads
Farm roads are very dangerous
Need better coordination between schools and TxDOT; schools built on two‐lane farm‐to‐market roads
bring more traffic and increased crashes
Should get the project done right the first time
They do not plan for the future; it used to take 15 minutes to get to work, and now it is 35 minutes
We do not know what is going on; more education and communication needed
Success Looks Like:
Smooth traffic and clear signs and markings
Need call boxes for emergencies; many people do not have cell phones
Too many signs distract drivers
Slower vehicles for safer crossing by foot
Better safety for pedestrians and motorists; should study high crash locations and fix the problem
Success means not having to worry about dying
Need rail from San Antonio to Brownsville
Trucks should be restricted to designated highways or at least truck restriction lanes
Nice rest areas should be built in this area
TxDOT is doing okay moving along with the generation, but there is room for improvement
Better communication with the public
Better maintenance of roadways, like mowing, debris sweeping and pothole repair
Need more people to get the job done
The Funding Game:
3 of the 10 gave equal parts to maintenance and mobility, 3 gave more to maintenance, and 4 gave
more to mobility
The Future:
All recognize that more money is needed
Mixed review on toll roads
Flat gas tax fee should be a percentage
Should not be any diversion of funds

22
3 say to raise the gas tax, 3 say not to raise the gas tax, and 1 says maybe; needs to know how much
increase would be necessary to make a big difference
Need more public transportation
Do not like vehicle registration fee
Brownwood
Six females and four males participated. Four of the participants have lived in the area for more than
20 years. Five have lived in the area for 5‐8 years, and one moved here 3 years ago. Three are unemployed.
Impressions of TxDOT:
Help stranded motorists
Repair the streets
Ride around in the truck all day
Construction takes a long time
Workers sitting around
Success Looks Like:
Get projects done quickly
Safety is a priority; likes rumble strips
Better planning for work force needs
Nighttime safety
Focus on one project at a time
Use materials that last, and make sure they work
The Funding Game:
No one knows how TxDOT is funded
All participants put their money toward maintenance with most using a 70/30 split
Agree that more money is needed, but gas prices are high enough
Could increase registration fees
Bring in other revenue sources like casinos, alcohol tax or something fun that also helps the
government
Public does not feel the gas tax as much; could have a small increase
Have donations help fund TxDOT
The Future:
More public transportation in Brownwood
The future will see many more people in this area
Everybody needs money; hard to not make people mad
Develop a TxDOT lottery

23
El Paso
Four females and seven males participated. All participants have lived here all their lives or longer
than 25 years. All are employed.
Impressions of TxDOT:
Disorganized
Construction workers not working
Bottleneck problems on I‐10 not being addressed, even though participant called on numerous
occasions
Highways look better in other cities around the state
Success Looks Like:
Pass‐through financing for the inner loop (Spur 61) was a success
The loop and highways are good, but more markings and more lights needed
Monorail system would be good
Should not completely shut down roadways due to crashes; better warning system needed
Better coordination between law enforcement and TxDOT needed
Would like to see high‐occupancy vehicle (HOV) lanes, dynamic traffic warning signs and improved
entrance/exit ramps
Should focus on repairs (example: complete the loop construction) and better communication with
other agencies as well as better utilization of technology for providing information
Ramp metering would be helpful here
Need wider roads
Information is needed on what the various agencies do like the metropolitan planning organization
(MPO), TxDOT, etc.
To solve the bickering that occurs at the local level, TxDOT should serve as the leader in transportation
The Funding Game:
On the whole, participants do not know how transportation is funded
TxDOT should increase the vehicle registration fees to help fund transportation
No participants are aware that a portion of the gas tax goes to fund education
Six of the participants are in favor of raising fuel taxes; one said that fuel tax is already too high
Transportation should be a priority in the state
If TxDOT were run more efficiently and effectively, the public would be more open to raising taxes
Half of the participants said that TxDOT is doing a good job at roadway maintenance
6 of the 10 participants placed a higher priority on maintaining pavement and bridges, while the
remaining four put more money toward mobility
The Future:
Reduce truck traffic by being more self‐sufficient in terms of producing goods locally; others say this
approach is not possible, so TxDOT should focus on intercity mobility
Six say they will buy a hybrid vehicle in the future
Most agree with replacing the fuel tax with a fee based on miles driven

24
Four say it is fine for TxDOT to spend money on advertising what the agency does

25
Houston
There were seven females and four males. Ten are employed, and one is a student.
Impressions of TxDOT:
Right‐of‐way needs are huge; wants to be able to provide input before government takes land
Hurricane evacuation – should have had a better plan; contra flow should have started sooner
Since project is complete, I‐10 is great now
Toll road discussion – likes the EZ Pass but wants to have option to pay with cash too
HOV lanes confusing – fear of getting lost
Need better public education
Success Looks Like:
Free‐flowing traffic is success – example I‐10 but took too long to update highway; US 290 needs
updating but no money left after I‐10
Better planning (bad example is Sugarland)
Maintenance
Mass transit
Safety – should be number one priority (rumble strips, big pavement symbols and No Truck lanes)
The Funding Game:
Most participants put more dollars on the maintenance side rather than the congestion side
Takes more dollars to effectively address congestion, so put most dollars on addressing maintenance
Sees maintenance as a safety issue
The Future:
More mass transit (rail on US 290 needed)
TxDOT should fix congestion, but make sure roads are good quality
Funding solutions – fines on speeding, tax the hybrids and emissions tests
More toll roads and pay for use
Increase gas tax
Need to make roads safe
Killeen
Five participants were female, and four were male. Most have lived in the area for less than 3 years.
There were three students, three were unemployed, one retired, and two were employed.
Impressions of TxDOT:
Construction projects take too long
Mass transit lacking in Killeen
Good roads in Texas
Toll roads need to have cash option
Need more overpasses to make U‐turns (do not like one‐way frontage roads)

26
Should consider options other than increased capacity
Need smoother roads
Better coordination needed between agencies (transit, TxDOT, etc.)
Success Looks Like:
Construction projects done quickly
Maintenance of roads
Education about who they are
Safety in terms of the condition of the road
Create alternatives to big cars
Nice rest areas
The Funding Game:
Six participants put more dollars on maintenance, two put more on congestion/connectivity, one split
money evenly, and the last did not understand
People want everything for nothing
Increase the vehicle registration fee (one‐time fee)
Weight of vehicle and number of miles should be factors into how much user spends
The Future:
Pay at the pump instead of through invoice
Do not want to pay for number of miles used
Toll roads get mixed reviews here
Raise gas prices, and then people would drive less and would ride mass transit
Do not do a fixed price gas tax; instead, base it on a percentage
Educate us through public service announcements
Lufkin
Six females and four males participated. Most have lived in the area for more than 10 years, and most
are employed.
Impressions of TxDOT:
Road maintenance sometimes not needed
Impressive organization, but also a big bureaucracy; controlled by governor
Very good roads as compared to Louisiana
Not planning for big changes, like when gas is $20/gallon; need to plan for transit instead of only being
interested in pouring concrete
Too many people watching people work
Construction has made a mess of the intersection at the loop near the mall
Success Looks Like:
Nice highways, good safety and good signs
Mass transit – partner with the city
Need alternatives to driving on the road
Bad seal coat job near Lufkin High School – rocks coming up too soon

27
No consistency in pavement material quality
Use the right‐of‐way for good; harvest the grass and hay; cut less often
The Funding Game:
No one knows how TxDOT is funded
Six people put higher priority on maintenance with most using a 60/40 split; three put equal priority on
maintenance and mobility; one put higher priority on mobility
Roads are designed to travel too fast
The Future:
More mass transit
Train to big cities
No new highways needed; use roads differently
More dedicated lanes for slower traffic like bicycle lanes
Cars will be smaller
Dedicated truck lanes on the rural roads
Need to manage what funds we do have instead of asking for more
Place a higher tax on big fuel consumers
Instead of hiring out work, have TxDOT build and maintain roadways
TxDOT should be more open with decisions and get more people’s opinions
We spread out because gas is cheap
Most do not like mileage fees; driving is a necessity, not a recreational activity
Have vehicle registration fee based on fuel efficiency
Wary of getting more money for TxDOT; needs transparency and oversight
Needs to educate but not with commercials; use the web or newspaper

28
APPENDIX B: ALLOCATION SURVEYS
Table 5. Amarillo Focus Group.
Dollar Value
Pavement and Bridge Quality Dollar Value
Mobility and Connections to Other Cities
0 None of the roads have “good” pavement quality. Average road is “poor” – like Amarillo Boulevard between Hughes Street and Taylor Street.
0 Current roads only
10 10 percent of all roads have “good” or “very good” pavement quality. Average road is “poor” – like Amarillo Boulevard between Hughes Street and Taylor Street.
10 A few major four‐lane roads that do not have a median are divided.
20 20 percent of all roads have “good” or “very good” pavement quality. Average road is “poor” – like Amarillo Boulevard between Hughes Street and Taylor Street.
20 Half of the major four‐lane roads that do not have a median are divided.
30 30 percent of all roads have “good” or “very good” pavement quality. Average road is “fair” – like Amarillo Boulevard between Western Street and McMasters Street.
30 All major four‐lane roads that do not have a median are divided.
40 40 percent of all roads have “good” or “very good” pavement quality. Average road is “fair” – like Amarillo Boulevard between Western Street and McMasters Street.
40 All major and a few minor four‐lane roads that do not have a median are divided.
50 50 percent of all roads have “good” or “very good” pavement quality. Average road is “fair” – like Amarillo Boulevard between Western Street and McMasters Street.
50 All major and many minor four‐lane roads that do not have a median are divided.
60 60 percent of all roads have “good” or “very good” pavement quality. Average road is “fair” – like Amarillo Boulevard between Western Street and McMasters Street.
60 All major and most minor four‐lane roads that do not have a median are divided.
70 70 percent of all roads have “good” or “very good” pavement quality. Average road is “good” – like I‐40 between South Grand Street and Eastern Street.
70 All major and minor four‐lane roads that do not have a median are divided.
80 Three‐fourths of all roads have “good” or “very good” pavement quality. Average road is “good” – like I‐40 between South Grand Street and Eastern Street.
80 All major and minor four‐lane roads that do not have a median are divided. One major congested street is widened.
90 83 percent of all roads have “good” or “very good” pavement quality. This is close to the current condition. Average road is “good” – like I‐40 between South Grand Street and Eastern Street.
90 All major and minor four‐lane roads that do not have a median are divided. A few major congested streets are widened.
100 90 percent of all roads have “good” or “very good” pavement quality. Average road is “very good” – like I‐40 between West Loop 335 and South Tyler Street.
100 All major and minor four‐lane roads that do not have a median are divided. A few major congested streets are widened, and one major congested rural road is widened.
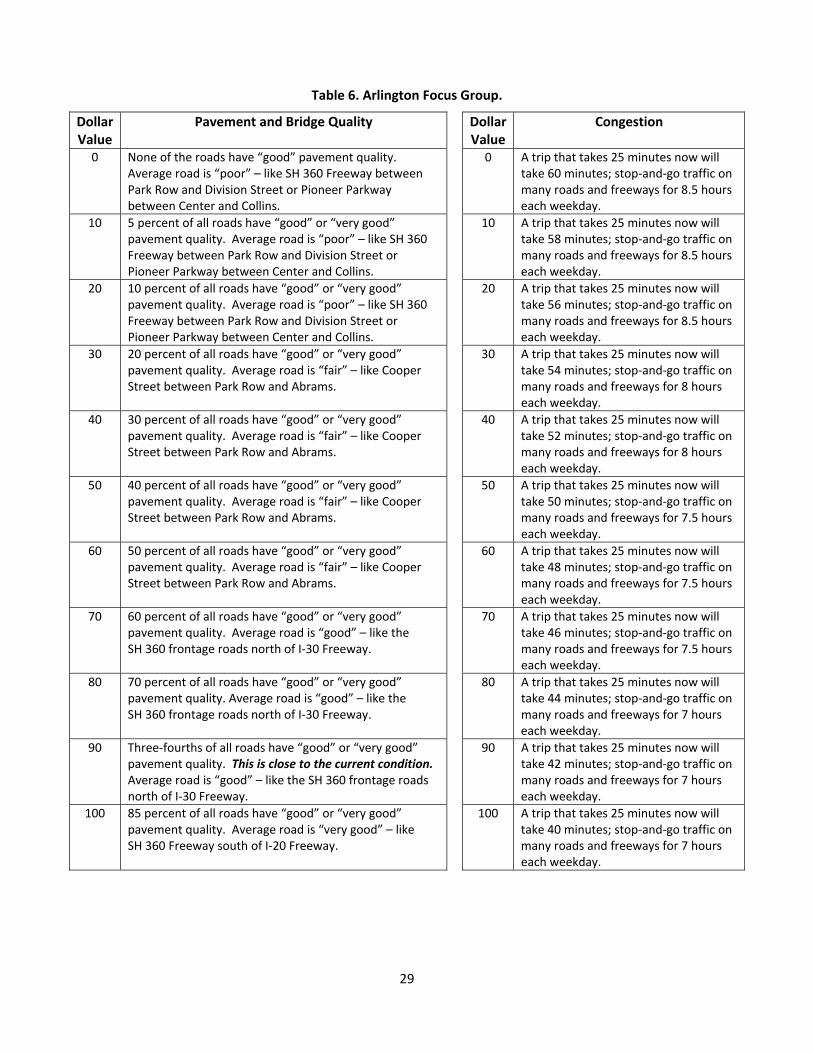
29
Table 6. Arlington Focus Group.
Dollar Value
Pavement and Bridge Quality Dollar Value
Congestion
0 None of the roads have “good” pavement quality. Average road is “poor” – like SH 360 Freeway between Park Row and Division Street or Pioneer Parkway between Center and Collins.
0 A trip that takes 25 minutes now will take 60 minutes; stop‐and‐go traffic on many roads and freeways for 8.5 hours each weekday.
10 5 percent of all roads have “good” or “very good” pavement quality. Average road is “poor” – like SH 360 Freeway between Park Row and Division Street or Pioneer Parkway between Center and Collins.
10 A trip that takes 25 minutes now will take 58 minutes; stop‐and‐go traffic on many roads and freeways for 8.5 hours each weekday.
20 10 percent of all roads have “good” or “very good” pavement quality. Average road is “poor” – like SH 360 Freeway between Park Row and Division Street or Pioneer Parkway between Center and Collins.
20 A trip that takes 25 minutes now will take 56 minutes; stop‐and‐go traffic on many roads and freeways for 8.5 hours each weekday.
30 20 percent of all roads have “good” or “very good” pavement quality. Average road is “fair” – like Cooper Street between Park Row and Abrams.
30 A trip that takes 25 minutes now will take 54 minutes; stop‐and‐go traffic on many roads and freeways for 8 hours each weekday.
40 30 percent of all roads have “good” or “very good” pavement quality. Average road is “fair” – like Cooper Street between Park Row and Abrams.
40 A trip that takes 25 minutes now will take 52 minutes; stop‐and‐go traffic on many roads and freeways for 8 hours each weekday.
50 40 percent of all roads have “good” or “very good” pavement quality. Average road is “fair” – like Cooper Street between Park Row and Abrams.
50 A trip that takes 25 minutes now will take 50 minutes; stop‐and‐go traffic on many roads and freeways for 7.5 hours each weekday.
60 50 percent of all roads have “good” or “very good” pavement quality. Average road is “fair” – like Cooper Street between Park Row and Abrams.
60 A trip that takes 25 minutes now will take 48 minutes; stop‐and‐go traffic on many roads and freeways for 7.5 hours each weekday.
70 60 percent of all roads have “good” or “very good” pavement quality. Average road is “good” – like the SH 360 frontage roads north of I‐30 Freeway.
70 A trip that takes 25 minutes now will take 46 minutes; stop‐and‐go traffic on many roads and freeways for 7.5 hours each weekday.
80 70 percent of all roads have “good” or “very good” pavement quality. Average road is “good” – like the SH 360 frontage roads north of I‐30 Freeway.
80 A trip that takes 25 minutes now will take 44 minutes; stop‐and‐go traffic on many roads and freeways for 7 hours each weekday.
90 Three‐fourths of all roads have “good” or “very good” pavement quality. This is close to the current condition. Average road is “good” – like the SH 360 frontage roads north of I‐30 Freeway.
90 A trip that takes 25 minutes now will take 42 minutes; stop‐and‐go traffic on many roads and freeways for 7 hours each weekday.
100 85 percent of all roads have “good” or “very good” pavement quality. Average road is “very good” – like SH 360 Freeway south of I‐20 Freeway.
100 A trip that takes 25 minutes now will take 40 minutes; stop‐and‐go traffic on many roads and freeways for 7 hours each weekday.

30
Table 7. Brownsville Focus Group.
Dollar Value
Pavement and Bridge Quality Dollar Value
Mobility and Connections to Other Cities
0 None of the roads have “good” pavement quality. Average road is “very poor” – like Elizabeth and Washington Streets between Palm and International Boulevard.
0 A trip that takes 22 minutes now will take 40 minutes; stop‐and‐go traffic on many roads and freeways for 6 hours each weekday.
10 10 percent of all roads have “good” or “very good” pavement quality. Average road is “poor” – like Boca Chica Boulevard near US 77.
10 A trip that takes 22 minutes now will take 39 minutes; stop‐and‐go traffic on many roads and freeways for 6 hours each weekday.
20 20 percent of all roads have “good” or “very good” pavement quality. Average road is “poor” – like Boca Chica Boulevard near US 77.
20 A trip that takes 22 minutes now will take 38 minutes; stop‐and‐go traffic on many roads and freeways for 5.5 hours each weekday.
30 30 percent of all roads have “good” or “very good” pavement quality. Average road is “fair” –like Military Highway (US 281) between Camino del Rey and Russell Drive.
30 A trip that takes 22 minutes now will take 37 minutes; stop‐and‐go traffic on many roads and freeways for 5.5 hours each weekday.
40 40 percent of all roads have “good” or “very good” pavement quality. Average road is “fair” – like Military Highway (US 281) between Camino del Rey and Russell Drive.
40 A trip that takes 22 minutes now will take 36 minutes; stop‐and‐go traffic on many roads and freeways for 5 hours each weekday.
50 50 percent of all roads have “good” or “very good” pavement quality. Average road is “fair” – like Military Highway (US 281) between Camino del Rey and Russell Drive.
50 A trip that takes 22 minutes now will take 35 minutes; stop‐and‐go traffic on many roads and freeways for 5 hours each weekday.
60 60 percent of all roads have “good” or “very good” pavement quality. Average road is “fair” – like Military Highway (US 281) between Camino del Rey and Russell Drive.
60 A trip that takes 22 minutes now will take 34 minutes; stop‐and‐go traffic on many roads and freeways for 5 hours each weekday.
70 70 percent of all roads have “good” or “very good” pavement quality. Average road is “good” – like Military Highway (US 281) between Alton Gloor Boulevard (FM 3248) and Camino del Rey.
70 A trip that takes 22 minutes now will take 33 minutes; stop‐and‐go traffic on many roads and freeways for 4.5 hours each weekday.
80 Three‐fourths of all roads have “good” or “very good” pavement quality. Average road is “good” – like Military Highway (US 281) between Alton Gloor Boulevard (FM 3248) and Camino del Rey.
80 A trip that takes 22 minutes now will take 32 minutes; stop‐and‐go traffic on many roads and freeways for 4.5 hours each weekday.
90 83 percent of all roads have “good” or “very good” pavement quality. This is close to the current condition. Average road is “good” – like Military Highway (US 281) between Alton Gloor Boulevard (FM 3248) and Camino del Rey.
90 A trip that takes 22 minutes now will take 31 minutes; stop‐and‐go traffic on many roads and freeways for 4 hours each weekday.
100 90 percent of all roads have “good” or “very good” pavement quality. Average road is “very good” – like US 77 Freeway between Morrison and East 18th Street.
100 A trip that takes 22 minutes now will take 30 minutes; stop‐and‐go traffic on many roads and freeways for 4 hours each weekday.

31
Table 8. Brownwood Focus Group.
Dollar Value
Pavement and Bridge Quality Dollar Value
Mobility and Connections to Other Cities
0 None of the roads have “good” pavement quality. Average road is “poor” – like Austin Avenue between Melwood Avenue and Brady Avenue.
0 Current roads only
10 15 percent of all roads have “good” or “very good” pavement quality. Average road is “poor” – like Austin Avenue between Melwood Avenue and Brady Avenue.
10 A few major four‐lane roads that do not have a median are divided.
20 25 percent of all roads have “good” or “very good” pavement quality. Average road is “poor” – like Austin Avenue between Melwood Avenue and Brady Avenue.
20 Half of the major four‐lane roads that do not have a median are divided.
30 35 percent of all roads have “good” or “very good” pavement quality. Average road is “fair” – like Main Avenue between Austin Avenue and Commerce Street.
30 All major four‐lane roads that do not have a median are divided.
40 45 percent of all roads have “good” or “very good” pavement quality. Average road is “fair” – like Main Avenue between Austin Avenue and Commerce Street.
40 All major and a few minor four‐lane roads that do not have a median are divided.
50 55 percent of all roads have “good” or “very good” pavement quality. Average road is “fair” – like Main Avenue between Austin Avenue and Commerce Street.
50 All major and many minor four‐lane roads that do not have a median are divided.
60 65 percent of all roads have “good” or “very good” pavement quality. Average road is “fair” – like Main Avenue between Austin Avenue and Commerce Street.
60 All major and most minor four‐lane roads that do not have a median are divided.
70 75 percent of all roads have “good” or “very good” pavement quality. Average road is “good” – like Austin Avenue between Brady Avenue and Parkway Street.
70 All major and minor four‐lane roads that do not have a median are divided.
80 80 percent of all roads have “good” or “very good” pavement quality. Average road is “good” – like Austin Avenue between Brady Avenue and Parkway Street.
80 All major and minor four‐lane roads that do not have a median are divided. One major congested street is widened.
90 88 percent of all roads have “good” or “very good” pavement quality. This is close to the current condition. Average road is “good” – like Austin Avenue between Brady Avenue and Parkway Street.
90 All major and minor four‐lane roads that do not have a median are divided. A few major congested streets are widened.
100 95 percent of all roads have “good” or “very good” pavement quality. Average road is “very good” – like US 183 between County Road 368 and Early Boulevard.
100 All major and minor four‐lane roads that do not have a median are divided. A few major congested streets are widened, and one major congested rural road is widened.

32
Table 9. El Paso Focus Group.
Dollar Value
Pavement and Bridge Quality Dollar Value
Mobility and Connections to Other Cities
0 None of the roads have “good” pavement quality. Average road is “poor” – like Paisano between Corona and Chamizal Memorial.
0 A trip that takes 22 minutes now will take 40 minutes; stop‐and‐go traffic on many roads and freeways for 6 hours each weekday.
10 10 percent of all roads have “good” or “very good” pavement quality. Average road is “poor” – like Paisano between Corona and Chamizal Memorial.
10 A trip that takes 22 minutes now will take 39 minutes; stop‐and‐go traffic on many roads and freeways for 6 hours each weekday.
20 20 percent of all roads have “good” or “very good” pavement quality. Average road is “poor” – like Paisano between Corona and Chamizal Memorial.
20 A trip that takes 22 minutes now will take 38 minutes; stop‐and‐go traffic on many roads and freeways for 5.5 hours each weekday.
30 30 percent of all roads have “good” or “very good” pavement quality. Average road is “fair” – like I‐10 between Copia and US 54 Patriot Freeway.
30 A trip that takes 22 minutes now will take 37 minutes; stop‐and‐go traffic on many roads and freeways for 5.5 hours each weekday.
40 40 percent of all roads have “good” or “very good” pavement quality. Average road is “fair” – like I‐10 between Copia and US 54 Patriot Freeway.
40 A trip that takes 22 minutes now will take 36 minutes; stop‐and‐go traffic on many roads and freeways for 5 hours each weekday.
50 50 percent of all roads have “good” or “very good” pavement quality. Average road is “fair” – like I‐10 between Copia and US 54 Patriot Freeway.
50 A trip that takes 22 minutes now will take 35 minutes; stop‐and‐go traffic on many roads and freeways for 5 hours each weekday.
60 60 percent of all roads have “good” or “very good” pavement quality. Average road is “fair” – like I‐10 between Copia and US 54 Patriot Freeway.
60 A trip that takes 22 minutes now will take 34 minutes; stop‐and‐go traffic on many roads and freeways for 5 hours each weekday.
70 70 percent of all roads have “good” or “very good” pavement quality. Average road is “good” – like Paisano between Stanton and Cotton.
70 A trip that takes 22 minutes now will take 33 minutes; stop‐and‐go traffic on many roads and freeways for 4.5 hours each weekday.
80 Three‐fourths of all roads have “good” or “very good” pavement quality. Average road is “good” – like Paisano between Stanton and Cotton.
80 A trip that takes 22 minutes now will take 32 minutes; stop‐and‐go traffic on many roads and freeways for 4.5 hours each weekday.
90 83 percent of all roads have “good” or “very good” pavement quality. This is close to the current condition. Average road is “good” – like Paisano between Stanton and Cotton.
90 A trip that takes 22 minutes now will take 31 minutes; stop‐and‐go traffic on many roads and freeways for 4 hours each weekday.
100 90 percent of all roads have “good” or “very good” pavement quality. Average road is “very good” – like I‐10 from US 54 Patriot Freeway to Paisano.
100 A trip that takes 22 minutes now will take 30 minutes; stop‐and‐go traffic on many roads and freeways for 4 hours each weekday.

33
Table 10. Houston Focus Group.
Dollar Value
Pavement and Bridge Quality Congestion
0 None of the roads have “good” or “very good” pavement quality. Average road is “very poor” – like North Loop near I‐45 or Cullen near South Loop.
A trip that takes 25 minutes now will take 60 minutes; stop‐and‐go traffic on many roads and freeways for 8.5 hours each weekday.
10 5 percent of the roads have “good” or “very good” pavement quality. Average road is “very poor” – like North Loop near I‐45 or Cullen near South Loop.
A trip that takes 25 minutes now will take 58 minutes; stop‐and‐go traffic on many roads and freeways for 8.5 hours each weekday.
20 10 percent of the roads have “good” or “very good” pavement quality. Average road is “very poor” – like North Loop near I‐45 or Cullen near South Loop.
A trip that takes 25 minutes now will take 56 minutes; stop‐and‐go traffic on many roads and freeways for 8.5 hours each weekday.
30 20 percent of the roads have “good” or “very good” pavement quality. Average road is “poor” – like I‐45 near downtown.
A trip that takes 25 minutes now will take 54 minutes; stop‐and‐go traffic on many roads and freeways for 8 hours each weekday.
40 30 percent of the roads have “good” or “very good” pavement quality. Average road is “poor” – like I‐45 near downtown.
A trip that takes 25 minutes now will take 52 minutes; stop‐and‐go traffic on many roads and freeways for 8 hours each weekday.
50 40 percent of the roads have “good” or “very good” pavement quality. Average road is “poor” – like I‐45 near downtown.
A trip that takes 25 minutes now will take 50 minutes; stop‐and‐go traffic on many roads and freeways for 7.5 hours each weekday.
60 50 percent of the roads have “good” or “very good” pavement quality. Average road is “fair” – like Westheimer between Hillcroft and Chimney Rock or North Shepherd north of the North Loop.
A trip that takes 25 minutes now will take 48 minutes; stop‐and‐go traffic on many roads and freeways for 7.5 hours each weekday.
70 60 percent of the roads have “good” or “very good” pavement quality. Average road is “fair” – like Westheimer between Hillcroft and Chimney Rock or North Shepherd north of the North Loop.
A trip that takes 25 minutes now will take 46 minutes; stop‐and‐go traffic on many roads and freeways for 7.5 hours each weekday.
80 70 percent of the roads have “good” or “very good” pavement quality. Average road is “good” – like Westheimer between West Loop and Chimney Rock or Southwest Freeway between West Loop and Hillcroft.
A trip that takes 25 minutes now will take 44 minutes; stop‐and‐go traffic on many roads and freeways for 7 hours each weekday.
90 Three‐fourths of the roads have “good” or “very good” pavement quality. This is close to the current condition. Average road is “good” – like Westheimer between West Loop and Chimney Rock or Southwest Freeway between West Loop and Hillcroft.
A trip that takes 25 minutes now will take 42 minutes; stop‐and‐go traffic on many roads and freeways for 7 hours each weekday.
100 85 percent of all roads have “good” or “very good” pavement quality. Average road is “good” – like Westheimer between West Loop and Chimney Rock or Southwest Freeway between West Loop and Hillcroft.
A trip that takes 25 minutes now will take 40 minutes; stop‐and‐go traffic on many roads and freeways for 7 hours each weekday.

34
Table 11. Killeen Focus Group.
Dollar Value
Pavement and Bridge Quality Mobility and Connections to Other Cities
0 None of the roads have “good” pavement quality. Average road is “poor” – like Buffalo Trail Road (FM 3219).
Current roads only
10 15 percent of all roads have “good” or “very good” pavement quality. Average road is “poor”– like Buffalo Trail Road (FM 3219).
A few major four‐lane roads that do not have a median are divided.
20 25 percent of all roads have “good” or “very good” pavement quality. Average road is “poor” – like Buffalo Trail Road (FM 3219).
Half of the major four‐lane roads that do not have a median are divided.
30 35 percent of all roads have “good” or “very good” pavement quality. Average road is “fair” – like Veteran’s Memorial from Roy Reynolds to US 190 Highway.
All major four‐lane roads that do not have a median are divided.
40 45 percent of all roads have “good” or “very good” pavement quality. Average road is “fair” – like Veteran’s Memorial from Roy Reynolds to US 190 Highway.
All major and a few minor four‐lane roads that do not have a median are divided.
50 55 percent of all roads have “good” or “very good” pavement quality. Average road is “fair” – like Veteran’s Memorial from Roy Reynolds to US 190 Highway.
All major and many minor four‐lane roads that do not have a median are divided.
60 65 percent of all roads have “good” or “very good” pavement quality. Average road is “fair” – like Veteran’s Memorial from Roy Reynolds to US 190 Highway.
All major and most minor four‐lane roads that do not have a median are divided.
70 75 percent of all roads have “good” or “very good” pavement quality. Average road is “good” – like Veteran’s Memorial from MLK to S. Gray Street or Stan Schlueter (FM 3470) from Trimmer to Elms Road.
All major and minor four‐lane roads that do not have a median are divided.
80 80 percent of all roads have “good” or “very good” pavement quality. Average road is “good” – like Veteran’s Memorial from MLK to S. Gray Street or Stan Schlueter (FM 3470) from Trimmer to Elms Road.
All major and minor four‐lane roads that do not have a median are divided. One major congested street is widened.
90 88 percent of all roads have “good” or “very good” pavement quality. This is close to the current condition. Average road is “good” – like Veteran’s Memorial from MLK to S. Gray Street or Stan Schlueter (FM 3470) from Trimmer to Elms Road.
All major and minor four‐lane roads that do not have a median are divided. A few major congested streets are widened.
100 95 percent of all roads have “good” or “very good” pavement quality. Average road is “very good” – like MLK from US 190 Highway to Veteran’s Memorial Boulevard.
All major and minor four‐lane roads that do not have a median are divided. A few major congested streets are widened, and one major congested rural road is widened.

35
Table 12. Lufkin Focus Group.
Dollar Value
Pavement and Bridge Quality Dollar Value
Mobility & Connections to Other Cities
0 None of the roads have “good” pavement quality. Average road is “poor” ‐ like 1st Street between Abney and Lufkin.
0 Current roads only
10 10 percent of all roads have “good” or “very good” pavement quality. Average road is “poor” ‐ like 1st Street between Abney and Lufkin.
10 A few major four‐lane roads that do not have a median are divided
20 20 percent of all roads have “good” or “very good” pavement quality. Average road is “poor” ‐ like 1st Street between Abney and Lufkin.
20 Half of the major four‐lane roads that do not have a median are divided
30 30 percent of all roads have “good” or “very good” pavement quality. Average road is “fair” – like Raguet Street between Henderson and Thompson or Frank Ave (SH 94) between Bynum and Herndon.
30 All major four‐lane roads that do not have a median are divided
40 40 percent of all roads have “good” or “very good” pavement quality. Average road is “fair” ‐ like Raguet Street between Henderson and Thompson or Frank Ave (SH 94) between Bynum and Herndon.
40 All major and a few minor four‐lane roads that do not have a median are divided
50 50 percent of all roads have “good” or “very good” pavement quality. Average road is “fair” – like Raguet Street between Henderson and Thompson or Frank Ave (SH 94) between Bynum and Herndon.
50 All major and many minor four‐lane roads that do not have a median are divided
60 60 percent of all roads have “good” or “very good” pavement quality. Average road is “fair” ‐ like Raguet Street between Henderson and Thompson or Frank Ave (SH 94) between Bynum and Herndon.
60 All major and most minor four‐lane roads that do not have a median are divided.
70 70 percent of all roads have “good” or “very good” pavement quality. Average road is “good” ‐ like 1st Street between Lufkin and Timberland.
70 All major and minor four‐lane roads that do not have a median are divided.
80 80 percent of all roads have “good” or “very good” pavement quality. Average road is “good” ‐ like 1st Street between Lufkin and Timberland.
80 All major and minor four‐lane roads that do not have a median are divided. One major congested street is widened.
90 88 percent of all roads have “good” or “very good” pavement quality. This is close to the current condition. Average road is “good” ‐ like 1st Street between Lufkin and Timberland.
90 All major and minor four‐lane roads that do not have a median are divided. A few major congested streets are widened.
100 93 percent of all roads have “good” or “very good” pavement quality. Average road is “very good” ‐ like John Redditt Dr (US 69) between Raguet Street and Frank Ave (SH 94).
100 All major and minor four‐lane roads that do not have a median are divided. A few major congested streets are widened and one major congested rural road is widened.

36

APPENDIX C: FUNDING ALLOCATION SURVEY RESULTS
Table 13. Focus Group Allocations for Each Region.
Values represent percentage of funding for two categories in first attempt (1st) and after review and group discussion (2nd):
pavement and bridge quality and
mobility and rural connectivity.
Amarillo Brownsville Brownwood El Paso
Pavement Mobility Pavement Mobility Pavement Mobility Pavement Mobility
Person 1st 2nd 1st 2nd 1st 2nd 1st 2nd 1st 2nd 1st 2nd 1st 2nd 1st 2nd
1 70 90 30 10 30 30 70 70 40 70 60 30 70 50 30 50
2 70 90 30 10 70 70 30 30 80 70 20 30 40 30 60 70
3 80 90 20 10 40 40 60 60 70 70 30 30 70 80 30 20
4 70 90 30 10 10 10 90 90 70 70 30 30 60 80 40 20
5 60 90 40 10 50 50 50 50 70 70 30 30 70 30 30 70 6 70 60 30 40 80 80 20 20 70 70 30 30 90 70 10 30
7 50 90 50 10 70 70 30 30 70 70 30 30 20 30 80 70
8 80 80 20 20 50 50 50 50 90 90 10 10 40 40 60 60
9 70 70 30 30 50 50 50 50 70 70 30 30 0 0 100 100
10 70 70 30 30 10 10 90 90 70 70 30 30 90 90 10 10
11 90 90 10 10
12 70 70 30 30
Average 69 82 31 18 46 46 54 54 70 72 30 28 59 55 41 45Std.
Deviation 9 11 9 11 24 24 24 24 12 6 12 6 29 29 29 29
Change 13 0 2 –4
35
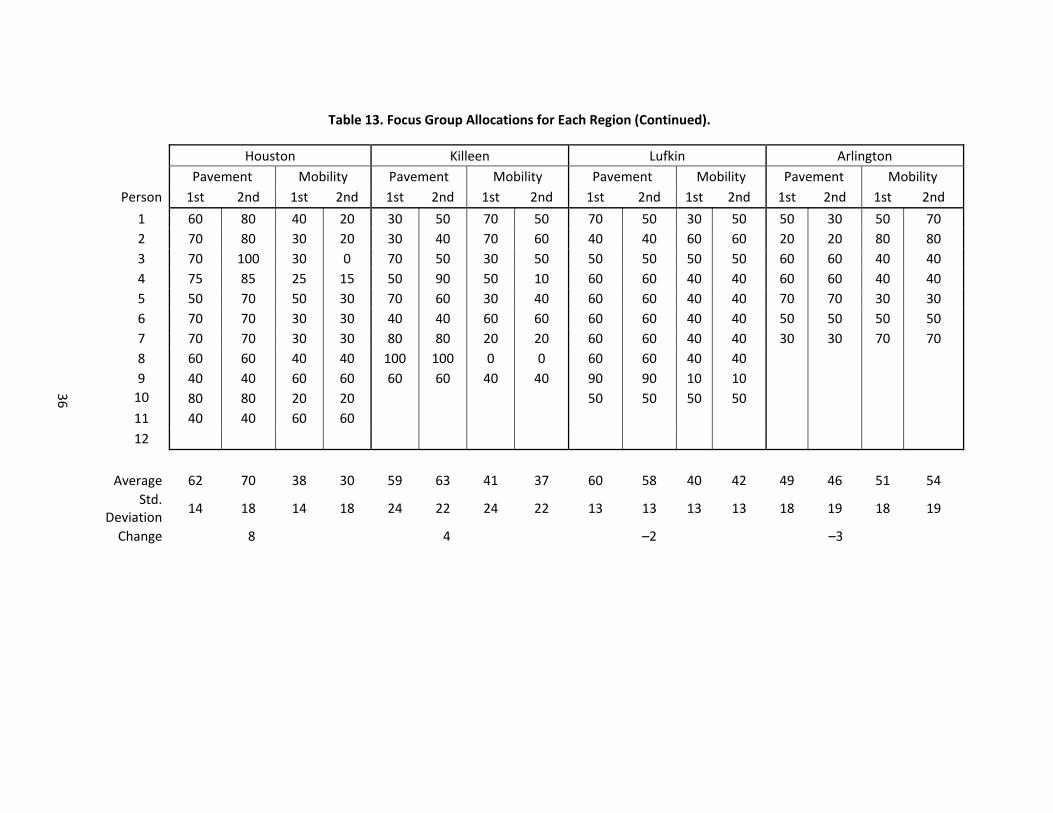
Table 13. Focus Group Allocations for Each Region (Continued).
Houston Killeen Lufkin Arlington
Pavement Mobility Pavement Mobility Pavement Mobility Pavement Mobility
Person 1st 2nd 1st 2nd 1st 2nd 1st 2nd 1st 2nd 1st 2nd 1st 2nd 1st 2nd
1 60 80 40 20 30 50 70 50 70 50 30 50 50 30 50 70
2 70 80 30 20 30 40 70 60 40 40 60 60 20 20 80 80
3 70 100 30 0 70 50 30 50 50 50 50 50 60 60 40 40
4 75 85 25 15 50 90 50 10 60 60 40 40 60 60 40 40
5 50 70 50 30 70 60 30 40 60 60 40 40 70 70 30 30
6 70 70 30 30 40 40 60 60 60 60 40 40 50 50 50 50
7 70 70 30 30 80 80 20 20 60 60 40 40 30 30 70 70
8 60 60 40 40 100 100 0 0 60 60 40 40
9 40 40 60 60 60 60 40 40 90 90 10 10
10 80 80 20 20 50 50 50 50
11 40 40 60 60
12
Average 62 70 38 30 59 63 41 37 60 58 40 42 49 46 51 54
Std. Deviation
14 18 14 18 24 22 24 22 13 13 13 13 18 19 18 19
Change 8 4 –2 –3
36

37
APPENDIX D: FUNDING ALLOCATION COMMENTS
Focus Group Comments on Funding Allocation
Amarillo
1. Quality of road/pavement is much more important to me than changing lane configuration. Potholes and guardrail quality is more important than adding lanes.
2. Chose 90/10 in order to keep current conditions from deteriorating even though I feel current conditions could be improved upon.
3. Think the current conditions are met closest. And happy with current road conditions in Amarillo. I think the roads I‐40/I‐27 are maintained well.
4. Like the roads in current condition. Would not want pavement and bridge quality to go down to improve mobility.
5. Want to keep status quo on roads. Another priority would be to improve on‐ramps and off‐ramps along I‐27. Some are too short (e.g., Georgia southbound), and some are dangerous (e.g., Hillside southbound – hill by off‐ramp makes it hard to judge traffic if you are on access road).
6. Conditions in Amarillo are great. Sacrificing condition for mobility and ease of use seems acceptable to me.
7. I appreciate the TxDOT roads that we currently have in Amarillo. I see no major problems.
8. I like the current conditions. I think we could readjust our focus slightly, but would again like to bring it back to the 90/10 mix in the future.
9. I think our road and mobility conditions are good where they’re at, and I don’t want them to change.
10. I’m happy with the pavement quality at this time.
Brownsville
None
Brownwood
1. Busy residential areas really need to be four lanes like TxDOT is doing. For example, Austin Avenue.
3. The roads that are traveled on regularly need to be maintained, but the minor four‐lane roads do not need dividers.
4. Initially, I chose 60/40. With a second look, before our discussion – I noticed that for $10 more my average road condition goes from “fair” to “good.” In deciding whether I wanted to spare $10 from my Column B, the fact that all of my major four‐lane roads are divided was good enough for me. In all honesty, I feel that a division of any sort on minor four‐lane roads is more of a hindrance.
5. I chose this because the average road is good versus fair, so both categories benefit to a great extent.
6. Not as important to have four lanes divided as it is to have good quality of roads to avoid accidents and car repairs.
7. Make roads safer for even safe, good drivers and for vehicle safety as well (less broken shocks for example or flats).
9. All four‐lanes need to at least have a divider to help cut down accidents. If the roads are at least of good quality, there won’t be as many accidents.
10. All the roads should be in good condition and wider for better traffic flow.

38
El Paso
1. Changed to incorporate more funding for mass transit and commuter transit (i.e., light rail, commuter trains).
2. Mobility is key for other forms of transportation.
4. If these areas are already doing well, they need to continue to be maintained. Time is relative, and without alternate routes, I’d be OK with 20 minutes and the increased time to travel.
5. Good point made on time versus upkeep. By 2030, gas will be even closer to running out; mass transit will be imperative, including for movement of goods. So – why maintain roads for types of transport that are not sustainable? Use funds for mobility planning.
6. Try to make mobility a little better.
8. I feel mobility and connection to other cities is important. Congestion needs to be reduced.
Houston
8. Safety.
Killeen
2. I guess to be fairer to the citizens of Texas, and not only me, pavement should be taken into greater consideration. If pavement and bridges were to be divided into their own separate pools, I would have given less to pavement. To me, congestion and traffic are more frustrating and annoying.
3. I changed due to the fact that as I’m driving on these roads, my number one concern is safety. I didn’t consider congestion, but after hearing other viewpoints, congestion and pavement quality are equally important to me.
4. I changed my mind in order to prioritize the funding so that 88 percent of the roads have “good” or “very good” pavement quality because it’s important for safety of bridges and road quality for vehicle maintenance. Maintenance is important for major roads.
5. Sacrificing road and bridge quality for congestion is difficult to achieve. Reduction in congestion requires 80 percent to go to the mobility column. This would reduce the average pavement and bridge quality to fair.
6. TxDOT should have increased funding.
7. Need more money for mobility and connections to other cities.
8. More money for expansion on major congested roads.
Lufkin
4. Opinion unchanged after discussion.
5. Keep up condition of roads at 60 percent but work to divide for safety.
10. Slower speed limits.

39
APPENDIX E: DEMOGRAPHICS OF FOCUS GROUPS
Table 14: Demographics of Focus Groups.

40
APPENDIX F: VIDEO QUESTIONNAIRE RESULTS
Table 15. Video Questionnaire Results.
El Paso Amarillo Brownsville Brownwood Lufkin Arlington Totals Did this video provide new information for you about future transportation issues? Yes 10 8 8 7 5 4 42 No 2 2 2 3 5 2 16 Was there any information that surprised you? Yes 6 3 6 3 2 3 23 No 6 7 3 6 8 3 33 Was there too much information or not enough? Too much 0 0 1 0 0 0 1 Not enough 5 7 5 8 7 2 34 Just enough 1 0 0 0 0 1 2 Do you have a smart phone? Yes 5 9 3 7 7 5 36 No 7 1 7 3 3 2 23 Do you use it to plan your travel? Yes 2 2 2 2 5 3 16 No 3 7 3 6 2 4 25 Do you know about intelligent transportation systems? Yes 9 4 1 2 3 1 20 No 3 6 9 8 7 5 38 Are you in favor of them? Yes 10 9 6 3 7 2 37 No 0 0 0 1 0 1 2 Maybe 1 0 0 1 0 0 2 Do you think that state population will dramatically increase? Yes 10 10 10 10 8 7 55 No 2 0 0 0 1 0 3 Do you think we will run out of oil? Yes 10 7 7 7 6 1 38 No 2 2 3 3 3 6 19 Do you plan to buy a hybrid or alternative fuel vehicle in the next few years? Yes 7 2 6 3 2 3 23 No 3 8 4 7 6 4 32 Maybe 1 0 0 0 1 0 2 Where do you live? Urban 3 3 2 2 0 2 12 Suburban 6 5 6 3 1 3 24 Rural 2 1 2 5 8 0 18 How do you primarily travel? Car 10 10 9 10 9 7 55 Bus 0 0 0 0 0 0 0 Train 0 0 0 0 0 0 0 Motorcycle 1 0 0 0 0 0 1 How regularly do you use the transportation system? Daily 5 6 5 7 5 2 30 Almost daily 0 0 1 1 2 3 7 Several time a week 0 0 1 0 0 1 Once or twice a month 0 0 2 0 1 3 Less than once a month 3 1 1 0 1 1 7

41

42
Comments Received on the Video Questionnaire
Was there any information in the video that surprised you? El Paso Charging fees based on use Yes, the damage of road structure due to less gas taxes Surprised to see we had taken all aspects of transit into consideration Renting a vehicle by the hour Seeing the desolation of the areas – L.A. freeways and abandoned gas stations along with alternative options of train and ride share made me think twice The idea of self‐driving vehicle These are all ideas that are being presently used Amarillo cars that talked to roads/highways; that’s awesome paying per mile; doubt it would work mileage‐based user fees – this seems like it would be very expensive to initiate and difficult to enforce shopping in the car didn’t seem feasible because someone has to deliver; mileage tax – nasty thought! Unfair Brownsville rechargeable electric car was great; communities where everything was accessible what if we run out of oil less gas consumption means less money, and there would be a need to get money from other sources like charging to use the highway roads talking to cars communication teleworking surprised by the idea of being charged for the amount of miles you drive similar to a phone bill Brownwood some solutions to the issues were surprising roads that talk to cars and shopping while you drive – scary roads that talk to cars and shopping while you drive – they’re both a little disheartening Lufkin organized ride‐sharing – is it safe?; how do you know you’re getting in the car with a sane person? the implication that self‐driven cars are a possibility trains that could possibly talk to cars and the idea of teleworking all these modes of transportation have been discussed for years before “no” oil there will be very expensive oil; $ 10.00/gallon will change behaviors dramatically Arlington it made me feel the future is dead tomatoes at $24.00 higher transportation for deliveries

43
What do you know about intelligent transportation systems (ITS)? El Paso digital signs with road condition updates
computer‐guided vehicles programmed to enter and exit at specific points carpool to and from work tramways, charter buses, park and ride highway alerts ITS can support an efficient mass transportation system Amarillo computers in the car navigate you to your destination kind of like autopilot it is a way to evaluate travel needs on a real‐time basis using Internet access and then quickly fill the needs cars driving in accord with other cars around them Brownsville sounds a little too futuristic and makes me uneasy because what if all the kinks aren’t worked out that you can have your car drive you Brownwood systems designed to work with smart cars to drive either more efficiently or independently Lufkin real‐time traffic conditions are very nice could help drivers change their habits concerning daily driving Arlington I believe it is tracking your car with GPS or something like On Star Mercedes is using smart cars to keep you awake, brakes for you and keeps in your lane GPS – use it for trips How would a big population boom affect you? El Paso short term: roads more congested; takes longer to travel; long term: gasoline used up sooner; radically changes all transport for work, commerce and personal travel would all be curtailed my ability to drive from A to B would significantly deteriorate; confine me to a smaller area more congestion on the road it would encourage me to spend my time more wisely unknown – things may get worse before they start to improve congestion and wait time on just about everything minimally it would affect me tremendously because this causes an increased strain on resources and infrastructure streets/highways will be more congested, causing longer travel times and less personal travel Amarillo would only increase current conditions and problems roads would have to be expanded; tax would have to be raised for more work on highways
44
take longer to get places more congestion on roads future comments between home and work increased congestion on the roads besides traffic and Texas, probably not very directly it would help the economy; make roads more congested
probably not dramatically; most growth will occur in Dallas‐Fort Worth, Austin, Waco, etc. more congestion on highways and interstates, delays in arrival to locations Brownville it affects the way you plan your day and/or recreational activities traffic congestion/accidents more taxes jobs, more time on the road higher population = more traffic congestions = more commute time more people on the road would mean having to leave earlier to get to work smoke fumes it will affect the larger cities more because that were live to have a better lifestyle make it even harder to find work, which would lean to even more poverty, which would mean less traveling and less money available for repairing our roads Brownwood take long to get to work and places have to deal with more people on the street; I left the big city of Houston because of crowds we live in the country, and I can see our country road and area being a subdivision more traffic; more time spend in daily commutes more traffic; more risk heavy increase in traffic more crime, more traffic, cost of living will increase in every little aspect of my whole life I would expect it to at least double in 50 years Lufkin more traffic more traffic and more pollution might make jobs and goods even harder to come by crowded streets and stores it would most definitely affect my career choice and if I choose to relocate more congestion on roads; cost increases due to shortages larger cities will spread out, creating more congestion outside our metropolitan areas negatively; being in a rural community in a large boom would have limited effect; however, in a big city longer transit times maybe there would be accompanying mass transit Arlington more cars on the highway, which mean more deterioration; more congestion on the highways, more businesses going up in growing areas more people = more automobiles and congestion traffic, pollution more traffic, crime, cost of living will go up

45
traffic, commuting issues more congestion on highways; less food
How would a big population boom affect your local transportation systems? El Paso they would crash since they are stressed already it would definitely overwhelm the systems; less mobility would affect consumer buying habits more traffic lights overcrowding/congestion mass transit or monorail would be priority jam it up more big time – our freeway, I‐10, wouldn’t support it at the already existing bottleneck areas I believe public transportation will increase force them to be smarter and more efficient even the slightest increase would affect it more vehicles on the roadways time and money; crowding Amarillo cost and demand it would take longer to build, fix or repairs roads longer to get places more necessary to develop public transportation have a negative impact; already congested in some areas we have very poorer public transportation to begin with, so hopefully it would improve as need increased on Highway 287S from Amarillo to Wichita Falls would probably have to be widened; roads and traffic lights would flow less smoothly we would not get as much funding in Amarillo for roads and bridges due to the increased needs in larger cities I’m sure it would be a negative effect but not overwhelming Congestion Brownsville more traffic; time getting to and from slower more traffic, more driving time the roads are ill equipped to handle a sharp increase in population hopefully it would increase local transportation so that we would be less dependent on our cars and maybe ease up gas dependency very little; the commute in the RGV is not that hectic compared to metro cities we would need wider roads to fill the need crowded streets more traffic it already seems impossible to imagine them getting any worse, so I can’t even comprehend the trouble it would bring on us
Brownwood could not get to A and B safely and on time more congestion on the streets I can see traffic backed up

46
more people driving as we do not have mass communication it would overwhelm it none more road expansion and construction and maintenance more congestion on the streets, streets deteriorating more quickly, more accidents nobody would ever get anywhere in a timely manner more cars = more wrecks and deterioration; more time for daily travel Lufkin more traffic, so it would take longer to get somewhere it will make them regret not thinking further ahead about the what‐ifs what local system?; it’s every person for himself more street traffic we would actually need to create one none, we have a very small system increase in demand requires more money to provide; users cannot cover the costs of their use if current system for financing is not modified more cars moving into rural areas longer transit times if mass transit was available, there would be no problem Arlington again more money from taxpayers because more drivers who are tearing up barriers, deteriorating freeways, causing transportation system to spend more on employees to make repairs I would have to figure out an alternative way such as public transportation we would like a bigger transportation system take longer to get anywhere it will tax the transportation system probably be forced to improve them more cars on road unless they convert to smaller cars How do you think the state should prepare to deal with resulting transportation demands? El Paso in conjunction with local, county and federal agencies innovate with new technologies lower the percentage cost of repairing roads inform the public with education think, get organized, reduce waste and plan projects and funding start talking with local city government and MPO; involve the public; begin doing county‐wide surveys allowing for suggestions as a precursor for updated changes how to find funding without hindering or causing higher taxes coordination of transportation with public and private section population will continue to grow, state needs to find ways to generate revenue for projects be apprised of the needs of the community take action now Amarillo research and public relations to find solutions

47
find ways to increase other issues that affect TxDOT make bigger roads raise taxes, develop additional public transportation, give incentives to conserve energy must increase funding, perhaps by increasing the flat tax currently being used increase gas tax gradually; possible registration cost increase civil engineers need to be hired to help plan and to forecast how demands will be made upon the transportation systems using technology keep roads in good condition/encourage deployment of affordable mass transit possibly widen highways; maybe other modes of transportation to reduce maintenance cost Brownsville in‐state gas and oil production more focus meetings; inform public when building roads, bigger is better; while it may cost more in beginning, the fruits will be reaped more taxes to accommodate the demand they will have to find the funds to deal with any and all transportation issues survey build more highways, evacuation systems and increase public transportation it seems like our only option is to increase taxes or in a very desperate attempt reach out to the people and try to raise money Brownwood find out what is best way, work to get traffic moving safely better planning, fewer projects at one time to get them done quicker do fund raisers; ask some of the more fortunate people for generous donations the governor is going to have to be more involved, and the people in transportation work field need to be more connected with each other plan ahead for additional funding and multiple streams of funding more tax on vehicle registration find ways to save budget dollars while planning and constructing more roads better funding, better planning, one job at a time planning, funding ideas, anticipating problems before they arise more mass transportation, buses and transit Lufkin think public transportation commuter rail infrastructure come up with innovative ideas from the public and gather different opinions improve existing roads more mass transit and ways to fund it road maintenance should be maintained research into population behavior and options for revenue once oil is obsolete mass transit – coordinate city planning; rail is a must, provide the backbone Arlington build more highways and attach freeways to unexpected areas of travel we need to increase our research in order to come up with a plan to avoid congestion before it gets out of control

48
transit, wider roads fix roads, widen, new roads, carpool lanes start expanding now find new ways to increase funding not sure How will running out of oil affect you? El Paso the same way it will affect everyone; completely revamp daily work and personal life will need to replace vehicle and will probably do less traveling clean the air and create an increase in the need for travel; therefore, we will need to find other ways to get revenue for our roads I will have to find different methods of transportation I believe technology is evolving as well, I feel we will have no use for oil in our vehicles in the future it will alter the modes of transportation available will need to find alternatives for transportation cost Amarillo unless an alternative is provided, it would change many aspects of daily life no oil, then no vehicle; we need different ways of traveling other than gasoline take forever to get to work on a bike will need to find alternative transportation, fuels, etc. a complete transportation overhaul would be necessary, which would affect everyone we will eventually be forced to drill inside our own borders it will affect every aspect of my life unless an alternative is provided, it would be devastating Brownsville life as we know it would be totally altered, so alternative ways of reaching our destination would need to be explored have to find new fuels everything; transportation costs will go up, which will be passed on to the consumer it would just set us back to old time when everyone rode horses the cost of gas among our other everyday purchases would increase it will increase gas prices unless we’re able to create a new standardized form of energy, I don’t know how I’ll be able to get to work or school Brownwood make transportation hard to get around gas, food, all prices rising; change in transportation will have to find other means of transportation keep things like groceries going up and not be able to get out as much, example: church, movies, ball games I can’t even begin to fathom all the ways Lufkin no cars with gas engines

49
it won’t happen in my lifetime I better dust off my bike or learn to ride a horse I believe another technology which will be better than fossil fuels will replace it we won’t run out overnight, so I guess I would have to invest in an electric vehicle before we run out, it will be expensive and change behavior; less driving, concentrated living area, more fuel‐efficient vehicles Arlington would have to carpool have to get a new car there are hidden reserves tied up in politics What is the main purpose of your regular use of the transportation system? El Paso commuting to work commute to work to and from work work/errands work/errands commuting to work work/errands commute commute work Amarillo work/errands work work work/errands work/errands errands errands work work/errands Brownsville commuting to work doctor visits/grocery shopping work errands work/errands work work school work/school

50
Brownwood work/errands work/errands work/errands work/errands business/errands work/errands work commute to work work/errands work Lufkin work/school commuting to work commuting/errands shopping trips work/errands work/errands work/errands work/errands Arlington work work/errands work work work/errands commute to work/errands What transportation solutions should we focus on? El Paso mass transportation options communication and coordination of various levels of bureaucracy create another highway or expand the highway that runs from east side to west side of El Paso mass transit funding roads getting away from oil cooperate with counties and cities to plan overall solutions; not act individually mass transit train development above freeway and toll freeway the funding of better roads light rail and high‐speed rail mass transit and reduce environmental impacts mass transit efficient transportation Amarillo pavement conditions, safety conditions and awareness

51
funding/safety how to better use the money you have, such as don’t give as much to public education; they have plenty of resources develop or assist with public transportation; railroads, magnetic highways maintenance of roads and safety future need and future funding – always sufficient number of lanes on state roads and highways; synchronize traffic lights anything we can do to stop using oil maintain roads, encourage people to get fuel‐efficient vehicles; develop mass transit for cities and between cities expansion of highways in metro areas focusing on safety of small farm roads Brownsville more bus systems public transportation more, faster ways of traveling to certain main highways general maintenance bigger roads; in theory this would slow down congestion how to tax smart cars/hybrids because without fuel tax there will be no roads maintain road condition better maintenance safety and public transportation Brownwood cleaner and safer more efficient planning; different areas than we already have for raising necessary funds keep roads safe for drivers and finish projects in a timely manner; make roads better, not worse fixing one area at a time planning ahead and being open to new ideas improve roads, focus on one project instead of 50 cost reduction; road planning maintenance safety now and planning for the future higher‐quality roads that last Lufkin more trains more public ways to do things to cut down on oil passenger and light railways safety and cost management better management of existing facilities ways to lessen the need to travel for some purposes; cheaper, more cost‐effective and less‐polluting models accountability; let the public know and understand decisions interested in the micro transit systems in bigger cities via networking and ridesharing and automated vehicles build the rails; privatize the trains Arlington highway expansion more lane highways, better transportation system

52
transit more lanes and more roads expand planning and expanding wider highways, studies, aerial views Please share other comments about the video. El Paso great idea to have focus groups; should give you input and gives the public an idea of what you do maintaining roads is important to eliminate additional costs for auto repair the video made great points; nothing is forever; people will always travel, and it is more important to get to your destination than how cool I enjoyed the presentation – thanks I feel it opened my eyes to the future of transportation the technology to improve the system is there, the public just needs to get involved and informed Amarillo video needs more info, more pros and cons video had great teasers but lacked actual information – more facts would be very appreciated fairly pointless – waste of state funds in general it was a good video in that it promoted thought and a need to find more information make another and promote it to the general public Brownsville video was very enlightening; offered ideas I was not aware of very helpful I liked the video; it touched on several topics I had never heard about, but it didn’t go into detail how does TxDOT tax the cars that use vegetable oil or are solar powered? video had some good insight wish it was more elaborated Brownwood if people were more friendly, trustworthy, carpooling is an awesome solution for cutting down on traffic good; it said a lot in a short amount of time video had a lot of neat ideas to solve transportation issues very enjoyable quite interesting, but I wish it were a bit longer and just a tad more informative it didn’t mention hovercrafts; accurate but not enough info or details about each subject Lufkin gas – wow please give more concrete information; when are these technologies coming? the video was an eye‐opener; great video I thought it might have been funded by oil interest because one part of it tried to make me feel scared about running out of oil concise and to the point, maybe more could be conveyed about intelligent and alternative driving plan, plan, plan – no more bulldozing new roads

53
Arlington it was an advertising medium to make you aware of what to expect too focused on liberal ideas! higher costs for everything