testing hypotheses for the origin of steep slope of lunar ... · pdf filetesting hypotheses...
TRANSCRIPT

Earth Planets Space, 55, 39–51, 2003
Testing hypotheses for the origin of steep slope of lunar size-frequencydistribution for small craters
Noriyuki Namiki1 and Chikatoshi Honda2
1Department of Earth and Planetary Sciences, Kyushu University, Hakozaki 6-10-1, Higashi-ku, Fukuoka 812-8581, Japan2The Institute of Space and Astronautical Science, Yoshinodai 3-1-1, Sagamihara 229-8510, Japan
(Received June 13, 2001; Revised June 24, 2002; Accepted January 6, 2003)
The crater size-frequency distribution of lunar maria is characterized by the change in slope of the populationbetween 0.3 and 4 km in crater diameter. The origin of the steep segment in the distribution is not well understood.Nonetheless, craters smaller than a few km in diameter are widely used to estimate the crater retention age for areasso small that the number of larger craters is statistically insufficient. Future missions to the moon, which will obtainhigh resolution images, will provide a new, large data set of small craters. Thus it is important to review currenthypotheses for their distributions before future missions are launched. We examine previous and new argumentsand data bearing on the admixture of endogenic and secondary craters, horizontal heterogeneity of the substratum,and the size-frequency distribution of the primary production function. The endogenic crater and heterogeneoussubstratum hypotheses are seen to have little evidence in their favor, and can be eliminated. The primary productionhypothesis fails to explain a wide variation of the size-frequency distribution of Apollo panoramic photographs.The secondary craters are likely the major source of the steepening of the distribution. It is ambiguous, however,which primary craters can produce sufficiently numerous secondary craters. The regional variation of the size-frequency distributions shows that few large impacts produce enough secondary craters to affect the distributionsin the surrounding area. We emphasize that a crater size-frequency distribution of small craters on the moon shouldnot be taken as an indication of the surface age. More data obtained from future lunar missions should be viewed inthis context, and continued to be examined for further insight into the possible formation mechanism for secondarycraters.
1. IntroductionIt is well known that a number density of craters increases
monotonically with time on planets and satellites where vol-canic resurfacing and fluid erosion are of negligible impor-tance. Also, crater counting on planetary surfaces revealsthat the number density decreases as the crater diameter in-creases (e.g., Basaltic Volcanism Study Project, 1981; Chap-man and McKinnon, 1986; Melosh, 1989). Then, in the idealcase, the cumulative number density of craters per km2, σ ,is described by a power-law distribution of crater diameterin km, D (Basaltic Volcanism Study Project, 1981; Melosh,1989),
σ(D) = αDβ, (1)
where α is a coefficient that increases with the age of surface.The index, β, is the slope of (1) in a log(D) vs. log(σ ) plotand is usually a constant close to −2 (e.g., Melosh, 1989).
The crater size-frequency distribution on the lunar mariais a well-known exception from (1) (e.g., Basaltic VolcanismStudy Project, 1981; Wilhelms et al., 1987; Melosh, 1989).An average crater size-frequency distribution over the lunarmaria consists of three segments (Fig. 1). These segmentsare divided at diameters around 0.3 and 4 km, and each seg-ment has a characteristic slope. In the segment for D larger
Copy right c© The Society of Geomagnetism and Earth, Planetary and Space Sciences(SGEPSS); The Seismological Society of Japan; The Volcanological Society of Japan;The Geodetic Society of Japan; The Japanese Society for Planetary Sciences.
than 4 km, the value of β of (1) varies in the range between−1.6 and −2.0 depending on the area, with the average of−1.8 (Wilhelms et al., 1987). Because the value of α of (1)in this diameter range uniquely corresponds to the radiomet-ric age of the returned rock samples, α in this segment isused to determine the surface age of the lunar maria (e.g.,Basaltic Volcanism Study Project, 1981). In the segment forD smaller than 0.3 km, the value of β is again close to −2.According to the previous studies by impact experiments andnumerical simulations, the craters in this diameter range areinferred to be in equilibrium (e.g., Gault, 1970; Chapmanand McKinnon, 1986; Hartmann and Gaskel, 1997). Thatis, the number density of craters has reached steady state, inwhich the formation of the new craters and the consequenterosion of old craters are in balance. In crater equilibrium,α in (1) does not depend on time, but is a constant between0.015 and 0.15 (e.g., Gault, 1970; Melosh, 1989).
The segment for diameter larger than 0.3 km and smallerthan 4 km is distinguished by a steep slope where the valueof β lies in the range between −3 and −4 with the averageof β of −3.4 (e.g., Melosh, 1989). Such an abrupt change inthe slope (Fig. 1) has been proposed to result from either ad-mixture of endogenic craters (Kuiper et al., 1966; Chapmanet al., 1970; Schultz et al., 1976), horizontal heterogeneityof the properties of the substratum in which impact cratersformed (Gault, 1970; Chapman et al., 1970, 1979; Schultz etal., 1977), a primary production function that shows a sim-
39

40 N. NAMIKI AND C. HONDA: LUNAR SIZE-FREQUENCY DISTRIBUTION FOR SMALL CRATERS
10-7
10-5
10-3
10-1
101
0.1 100
Cum
ulat
ive
crat
er s
ize-
freq
uenc
ydi
stri
buti
on [
km-2
]
Crater diameter [km]
0.3 4.0
β = −3.4
β = −1.8
β = −2.0
Fig. 1. A compilation of cumulative crater size-frequency distributions inlunar maria. The average cumulative crater size-frequency distribution isshown by solid line and open squares (Basaltic Volcanism Study Project,1981, table 8.4.1; Melosh, 1989). The shaded band indicates craterequilibrium, for which α and β are between 0.15 and 0.015, and −2,respectively (Melosh, 1989).
ilar abrupt decrease in the slope (Neukum and Wise, 1976;Neukum and Ivanov, 1994; Chapman et al., 1996), or pre-dominance of secondary craters in the size-frequency distri-bution for diameters smaller than 4 km (Shoemaker, 1965;Wilhelms et al., 1978). Since high-resolution lunar imagesbecame available after Apollo and Lunar Orbiter spacecraft,there has been a controversy among these hypotheses (e.g.,Basaltic Volcanism Study Project, 1981). While the causeof the steepening remains unsolved, small craters are widelyused to estimate a surface age (e.g., Greeley et al., 1993;Neukum and Ivanov, 1994; Hartmann et al., 1999, Hartmannand Berman, 2000) on the basis of the primary productionhypothesis (Neukum and Wise, 1976; Neukum and Ivanov,1994; Chapman et al., 1996). An advantage of large numberof small crater increases as images taken by the future lunarexplorations, such as Japanese LUNAR-A (Mizutani, 1995)and SELENE (Sasaki et al., 1999), are expected to achievehigher resolution than previous ones. Therefore it is impor-tant to review possible hypotheses for this steepening beforethe new missions are launched.
These hypotheses predict that the steep slope segment isassociated with a surface age or local properties of the stud-ied area. Therefore we attempt to evaluate these hypothe-ses by measuring the size-frequency distributions of craterssmaller than a few km in series of photographs coveringCopernicus and Tycho craters, Oceanus Procellarum, andMare Imbrium, and comparing the distributions with otherdata sets. For example, the endogenic crater hypothesis(Kuiper et al., 1966; Chapman et al., 1970; Schultz et al.,1976) implies that the steep slope segment is most distinc-tive on a unit such as Marius Hills where past magmatic ac-tivity is indicated from geologic studies (Weitz and Head,1999). In contrast, on a surface younger than the cease of lu-nar magmatism, such as ejecta blanket of Copernican craters,the steep slope segment is not expected. Thus, measurementof the crater size-frequency distributions in young craters canbe a test of this hypothesis.
The physical properties of the substrate also have been
considered to influence the crater size-frequency distribution(the heterogeneous substratum hypothesis) (Gault, 1970;Chapman et al., 1970, 1979; Schultz et al., 1977). Becausethe crater diameter is dependent on the strength of the targetin a strength regime (Chapman and McKinnon, 1986), me-chanical structure of the lunar surface may affect the cratersize-frequency distribution (Gault, 1970; Chapman et al.,1970, 1979). Schultz et al. (1977) further point out thatproperties of the target strongly affect degradation of smallcraters. In this case, the crater size-frequency distributioncan reveal some correlation with geophysical data sets, if thedata sets manifest the horizontal heterogeneity of the sub-surface structure. In this context, we first investigate a cor-relation between the crater size-frequency distribution andthickness of mare basalt. The thickness of mare basalt is es-timated to be between 0.1 and 2 km (DeHon and Waskom,1976; DeHon, 1979; Yingst and Head, 1997, 1999; Bud-ney and Lucey, 1998). A boundary at this depth may berelated to the inflection of the crater size-frequency distri-bution around 4 km in diameter (Fig. 1). A shift of theinflection point to, for example, larger diameter results inan apparent increase of the α value. Second, we comparethe crater size-frequency distributions with the topographyof mare surface (Smith et al., 1997). If the topography re-flects superposition of basaltic layers, a regional variation ofthe crater size-frequency distributions may show a correla-tion with the topography. And third, we compare variationsof the distributions with the Bouguer gravity anomaly (Kono-pliv et al., 1998; Wieczorek and Phillips, 1998; Konopliv andYuan, 1999). The gravity data represent the structure of lu-nar interior, therefore the horizontal heterogeneity of targetproperties beneath the mare surface may be somehow relatedto the gravity anomaly.
Neukum and Wise (1976) have proposed a third possi-bility that attributes the steep slope segment of the cratersize-frequency distribution to the crater production func-tion. Their primary production hypothesis is supported bya discovery of the same steep slope segment in the cratersize-frequency distribution on the asteroid Gaspra (Neukumand Ivanov, 1994; Chapman et al., 1996) and in the size-frequency distribution of Earth-crossing asteroids (Rabi-nowitz et al., 1994). On the other hand, the crater size-frequency distribution on Eros shows β greater than −2(Veverka et al., 2001). Therefore the size-frequency distri-bution of primary production requires further investigation.If the crater size-frequency distribution in the lunar maria issimply indicating that of the projectile (Neukum and Wise,1976; Neukum and Ivanov, 1994; Chapman et al., 1996), thevalue of α necessarily corresponds to the eruption age of themare basalt. Naturally α in the steep-slope segment can beapplied to crater chronology and would be extremely usefulto estimate the age of so small an area that only a few craterslarger than 4 km exist (Greeley et al., 1993; Hartmann etal., 1999; Hartmann and Berman, 2000). We wish to test thishypothesis from a comparison of radiometric ages with the α
values of the steep slope segment. However, the sample lo-cations are restricted to the Apollo and Luna landing sites,and current rock samples cover only a limited portion ofthe maria. Instead, we take geological maps (Pieters, 1978;Whitford-Stark and Head, 1980; Wilhelms et al., 1987) un-

N. NAMIKI AND C. HONDA: LUNAR SIZE-FREQUENCY DISTRIBUTION FOR SMALL CRATERS 41
Table 1. Summary of location, geologic classification, least-squares fits, and χ2 test for all photographs taken in this study (Pieters, 1978; Whitford-Starkand Head, 1980; Wilhelms et al., 1987).
LO5H127 −41.0 13.0 Co 0.0068 ± 0.0045 -4.39 ± 0.30 0.750 0.08 - 0.30LO5H153 10.0 20.0 Co 2.42 ± 0.24 -3.30 ± 0.12 0.710 0.114 - 0.559LO4H121 10.0 15.0 Co 0.89 ± 0.08 -3.64 ± 0.26 0.790 0.921 - 2.57
AS 15-2056 26.1 9.6 7.76 ± 0.18 -3.02 ± 0.04 0.855 1.06 - 2.92AS 15-2060 27.0 15.3 6.91 ± 0.64 -4.42 ± 0.20 0.514 1.05 - 2.90AS 15-2064 27.8 20.5 4.27 ± 0.39 -3.28 ± 0.18 0.423 0.75 - 2.91AS 15-2068 28.3 25.7 4.37 ± 0.20 -3.36 ± 0.04 0.997 1.47 - 5.80AS 15-2072 28.6 31.3 3.16 ± 0.07 -4.09 ± 0.12 0.575 0.74 - 2.06AS 15-2076 28.8 36.6 5.25 ± 0.24 -3.49 ± 0.11 0.539 0.75 - 2.95AS 15-2080 28.6 42.1 7.08 ± 0.16 -3.29 ± 0.05 0.832 1.03 - 2.89AS 15-2480 28.8 48.0 7.59 ± 1.23 (-2.69 ± 0.22) 0.598 1.42 - 3.98AS 15-2484 28.7 54.0 2.95 ± 0.20 -3.23 ± 0.21 0.454 0.71 - 1.99AS 15-2746 28.4 59.7 3.39 ± 0.63 -3.07 ± 0.64 (0.007) 0.71 - 2.00AS 15-2748 27.7 65.5 3.24 ± 0.03 -3.37 ± 0.03 0.905 0.72 - 2.02AS 15-2490 27.7 62.7 3.31 ± 0.03 (-2.90 ± 0.03) 0.889 0.70 - 1.99AS 15-1838 25.7 22.8 3.31 ± 0.03 (-2.93 ± 0.05) 0.865 1.01 - 2.83AS 15-1842 25.6 28.2 8.71 ± 4.38 -3.91 ± 0.43 0.642 2.05 - 5.79AS 15-1846 25.3 33.7 5.25 ± 0.73 -3.72 ± 0.32 0.295 1.02 - 2.89AS 15-1850 24.9 39.1 6.03 ± 1.12 -3.86 ± 0.42 0.231 1.02 - 2.89AS 15-0260 26.6 23.5 hDSA Er 1.58 ± 0.01 -4.25 ± 0.02 0.997 0.383 - 1.41AS 15-0264 26.9 24.9 LBSP Im 0.525 ± 0.13 -4.76 ± 0.25 0.452 0.272 - 0.690AS 15-0268 27.1 26.3 hDSA Er 1.82 ± 0.34 -4.03 ± 0.18 0.494 0.278 - 0.711AS 15-0272 27.3 27.3 hDSA Er 2.40 ± 0.11 -3.61 ± 0.03 0.909 0.207 - 0.708AS 15-0276 27.5 29.3 hDSA Er 1.82 ± 0.17 -3.89 ± 0.13 0.967 0.284 - 1.44AS 15-0280 27.7 30.7 hDSA Er 3.80 ± 0.62 -3.55 ± 0.14 0.456 0.217 - 0.758AS 15-0284 27.9 32.2 LBSP Im 9.77 ± 0.23 -3.29 ± 0.02 0.956 0.387 - 1.03AS 15-0288 28.1 33.6 LBSP Sharp Im 1.82 ± 0.25 -3.95 ± 0.25 0.792 0.385 - 1.43AS 15-0292 28.2 35.0 LBSP Sharp-Hermann Im 2.14 ± 0.97 -5.05 ± 1.07 0.103 0.533 - 1.46AS 15-0296 28.3 36.5 LBSP Hermann Im 9.12 ± 0.21 -3.05 ± 0.05 0.991 0.526 - 2.02AS 15-0300 28.5 37.9 hDSA Sharp-Hermann Er 4.68 ± 0.98 -4.16 ± 0.52 0.365 0.539 - 1.48AS 15-0304 28.5 39.5 LBSP Sharp-Hermann Im 3.89 ± 0.36 -4.22 ± 0.12 0.680 0.373 - 1.00AS 15-0308 28.6 41.0 LBSP Telemann Im 1.26 ± 0.12 -4.77 ± 0.13 0.750 0.367 - 0.988
α
LunarOrbiter
Metric 1
Wilhelmset al. (1987)*
Pieters(1978)§
Whitford-Stark α , x 10 -3GroupPhotograph
NumberLatitude,
°NLongitude,
°W
ClassificationsQ
Diameter range,km
Metric 2
AS 15-0312 28.7 42.3 LBSP Telemann Im 5.37 ± 0.37 -4.08 ± 0.13 0.945 0.362 - 1.94AS 15-0316 28.8 43.7 LBSP Telemann Im 5.75 ± 0.13 -3.90 ± 0.11 0.905 0.702 - 1.95AS 15-0320 28.8 45.2 LBG- Telemann Im 5.75 ± 0.27 -3.17 ± 0.05 0.972 0.347 - 1.32AS 15-0324 28.8 46.7 LBG- Telemann Im 2.00 ± 0.09 -4.86 ± 0.07 0.794 0.365 - 0.995AS 15-0328 28.8 48.3 LBG- Telemann Im 33.11 ± 5.36 -3.20 ± 0.27 0.880 0.960 - 3.78AS 15-0332 28.8 49.4 LBG- Telemann Im 8.32 ± 0.58 -3.33 ± 0.15 0.745 0.481 - 1.32AS 15-0344 28.6 53.6 Undivided Telemann Er 4.27 ± 0.20 -3.37 ± 0.12 0.895 0.472 - 1.84AS 15-0348 28.6 54.9 HDSA Telemann Er 9.77 ± 0.23 -3.12 ± 0.03 0.956 0.556 - 1.54AS 15-0352 28.5 56.3 HDSA Sharp Co 1.00 ± 0.01 -4.22 ± 0.01 0.951 0.257 - 0.705AS 15-0356 28.4 57.7 HDSA Sharp Co 2.69 ± 0.25 -3.61 ± 0.07 0.583 0.181 - 0.493AS 15-0358 28.3 58.4 HDSA Sharp Co 2.75 ± 0.64 -3.75 ± 0.30 0.712 0.354 - 0.983AS 15-0360 28.3 59.1 HDSA Sharp Co 4.57 ± 0.53 -3.31 ± 0.13 0.430 0.222 - 1.21AS 15-0362 28.1 60.4 hDSA Sharp Co 3.47 ± 0.08 -3.58 ± 0.05 0.934 0.434 - 1.21AS 15-0364 28.0 62.0 hDSA Sharp Co 2.04 ± 0.09 -4.19 ± 0.07 0.899 0.302 - 1.19AS 15-0366 27.8 63.4 hDSA Sharp Er 11.5 ± 0.11 -3.13 ± 0.01 0.950 0.221 - 0.616AS 15-0370 27.4 66.3 mISP Hermann Im 2.00 ± 0.23 -4.66 ± 0.20 0.712 0.428 - 1.20
Panoramic
and Head (1980)#
Note: Photographs grouped as metric 1 and 2 are taken from different tracks of Apollo 15 (Fig. 2). The average latitude of metric 1 and 2 groups are28.0◦N and 25.4◦N, respectively. §: Classification is based on spectral map compiled by Wilhelms et al. (1987, pl. 4) from Pieters et al. (1975), Head et al.(1978), and Pieters (1978). The region adopted in this work has been studied by Pieters (1978). First letter H-h-m-L indicates range of UV/VIS ratios fromH (high) to L (low), respectively. Second letter B-I-D indicates albedo, from Bright (B) to dark (D), respectively. Third letter S-G indicates nature of themafic mineral absorption band near 1 mm, strong (S) and gentle (G), respectively. Forth letter P-A indicates nature of the pyroxene absorption band near2 mm, prominent (P) and attenuated (A). #: Geologic units are classified by surface age (Whitford-Stark and Head, 1980). The Sharp formation consistsof the youngest units, and the Telemann formation consist of the oldest units. Sharp + Hermann indicates that the panoramic picture lies on the boundarybetween the two formations. ∗: Classification is taken from surface age determined by Wilhelms et al. (1987, pl. 12). Im, Er, and Co denote Imbrian,Eratosthenian, and Copernican, respectively.
der the assumption that each geological unit represents con-current eruptions.
As for the secondary crater hypothesis (Shoemaker, 1965;Wilhelms et al., 1978), there are two different interpretationsdepending on the size of the primary crater. First, if all pri-mary craters are accompanied by small secondary craters,this interpretation is indistinguishable from the primaryproduction hypothesis (Basaltic Volcanism Study Project,1981). There is then no need for a new test. Second, if onlyprimary craters larger than a few tens km in diameter canproduce secondary craters (Shoemaker, 1965), the number
density of the secondary craters would decrease with dis-tance from a local large crater. Thus, we can test this hy-pothesis by examining a variation of the α value of the steepslope segment depending on the distance from large primarycraters.
2. Data Sets and Handling2.1 Geological settings and photographs of the studied
areaWe examine the crater size-frequency distributions of
Copernicus and Tycho craters first. Copernicus crater lies

42 N. NAMIKI AND C. HONDA: LUNAR SIZE-FREQUENCY DISTRIBUTION FOR SMALL CRATERS
Aristarchus
Krieger DeLisle
Diophantus
Euler
LambertTimocharis
70° W
20° N
40° N0° W
Archimedes
Herodotus
Pytheas
Lichtenberg
Fig. 2. A mosaic of Clementine UV/VIS images from 0◦W to 70◦W and from 20◦N to 40◦N. The area covered by the panoramic, metric 1, and metric 2photographs (Table 1) are superimposed by small solid rectangles, large open rectangles, and large dashed rectangles, respectively.
at 10◦N and 20◦W on the southernmost part of Mare Im-brium. Its age is estimated to be about 0.81 b.y. from U-Th-Pb and K-Ar dating of regolith sample and a degassing eventin KREEP glass collected at the Apollo 12 site (e.g., Silver,1971; Alexander et al., 1976, 1977; Bogard et al., 1992).Tycho crater lies on the highland at 43◦S and 11◦W. Its ageis estimated to be about 0.109 b.y. from a peak in Apollo17 soil cosmic ray exposure ages (e.g., Drozd et al., 1974;Wolfe et al., 1975; Lucchitta, 1977). We adopt three high-resolution images taken by Lunar Orbiters 4 and 5 (Table 1).The LO5H127, LO5H153, and LO4H121 are photographsof the ejecta blanket of Tycho crater, and the ejecta blanketand floor of Copernicus crater, respectively. The maximumresolutions of these images are about 60 m, 2 m, and 2 m,respectively (Wilhelms et al., 1987).
We also investigate the crater size-frequency distributionsin parts of Oceanus Procellarum and Mare Imbrium (Fig. 2).Oceanus Procellarum and Mare Imbrium are interpreted tobe covered by basaltic volcanism that occurred between 3.10and 3.25 and between 3.20 and 3.35 b.y. ago, respectively,from the radiometric ages of the rock samples returned byApollo 12 and 15 (Basaltic Volcanism Study Project, 1981).While Wilhelms et al. (1987) claim that eruptions occurredin the Imbrian, Eratosthenian, and even Copernican systems,their age estimates are possibly subject to the population ofcraters in the diameter range discussed in this work. Thereare several craters larger than 25 km in diameter in thisregion (Fig. 2). Among these craters, Aristarchus (23.7◦Nand 47.4◦W, D = 40 km), Timocharis (26.7◦N and 13.1◦W,D = 34 km), and Euler (23.3◦N and 29.2◦W, D = 28km) craters belong to the Copernican system and DeLisle(29.9◦N and 34.6◦W, D = 25 km) and Lambert (5.8◦N and21.0◦W, D = 30 km) craters belong to the Eratostheniansystem (Taylor, 1982; McEwen et al., 1997). We adopt aseries of Apollo 15 metric photographs as well as panoramicphotographs (Table 1) covering the region between 26◦N and32◦N, and between 6◦W and 69◦W (Fig. 2). As listed inTable 1, those metric photographs cover a wider area thanpanoramic photographs (Fig. 2). The maximum resolutionsof metric and panoramic photographs are 20 m and 2 m,respectively (Wilhelms et al., 1987).
2.2 Corrections of Apollo 15 metric and panoramicphotographs
The metric and panoramic photographs were taken alongtracks of the Apollo 15 orbiter. As a consequence, a sunelevation gradually changes from a few to 40 degrees. Acorrection for different solar angle has been made such thatcrater diameter increases from a measurement by 1 m perdegree as sun elevation increases (Young, 1975, 1977).
Next we have made a small correction for the scale ofprinted photographs. Original sizes of the Apollo 15 metricand panoramic photographs are 5 by 5 and 5 by 48 inches, re-spectively. We have requested National Space Science DataCenter to enlarge both metric and panoramic photographs by2 and 3.2 times, respectively, so as to count small craters. Atthe same time, we extract only the central region (5 by 6.25inches) from the original panoramic photograph because theimage is highly distorted far from the center of the photo-graph. In order to account for differences of enlargementof each photograph, we have first measured in metric pho-tographs the diameter of the crater that has been alreadycatalogued by Wilhelms et al. (1987). While some met-ric photographs lack the catalogued craters, all metric pho-tographs overlap each other (Fig. 2). Then the scales of thosemetric photographs have been interpolated from the over-laps with the adjacent photographs. Second, we have deter-mined the scales of the panoramic photographs from thoseof metric photographs by taking advantage of the fact thatall panoramic photographs are overlapped by metric pho-tographs (Fig. 2). Finally, as an additional test, the lengthsof letters “APOLLO” printed on the rim of the panoramicphotographs are measured when they are found. Without theadjustment described above, the average and standard devi-ation of the length of the letters are 139 and 5 mm, respec-tively. Therefore the ambiguity in scale due to enlargementis less than 4%.2.3 Other data sets
We adopt three geophysical data sets for tests of the en-dogenic processes and heterogeneous substratum hypothe-ses. For thickness of mare basalt, we take estimates byDeHon (1979). Although new estimates of basalt thick-ness for Humorum, Orientale, Smithii, and Maginis basins,and lava ponds in South Pole-Aitken basin have been ob-

N. NAMIKI AND C. HONDA: LUNAR SIZE-FREQUENCY DISTRIBUTION FOR SMALL CRATERS 43
tained from the detailed analyses of Clementine multispec-tral images (Yingst and Head, 1997, 1999; Budney andLucey, 1998), basalt thickness estimates for Oceanus Procel-larum and Mare Imbrium have not been revised since DeHon(1979). For topography model, we adopt a set of sphericalharmonic coefficients (GLTM-2) calculated from the topo-graphic data obtained by Clementine lidar experiment (Smithet al., 1997). And for Bouguer gravity anomaly model of theMoon, we adopt the harmonic coefficients JGL100J1 (Kono-pliv et al., 1998; Wieczorek and Phillips, 1998; Konoplivand Yuan, 1999). This gravity model is calculated from ra-dio tracking of the Lunar Orbiters 1 to 5, Apollo 15 and 16,Clementine, and Lunar Prospector spacecraft. The referencegeoid is set to be a sphere of radius of 1738 km, and crustaland mean densities are assumed to be 2800 and 3340 kg m−3,respectively. Magnetic anomaly data are another possiblesource to constrain subsurface structures. However, becauseHalekas et al. (2001) find no clear association between ge-ologic features and magnetic anomalies in Lunar Prospectorelectron reflectometer measurements, we do not include amagnetic anomaly map in this study.
As a reference of regional geology, we adopt geologicand spectral maps of the moon by Pieters (1978), Whitford-Stark and Head (1980), and Wilhelms et al. (1987) (Table 1).For some provinces, elemental and mineralogical maps havebeen already revised on the basis of multispectral analysesof Clementine UVVIS images (e.g., Yingst and Head, 1999;Gillis and Spudis, 2000; Hiesinger et al., 2000a, b; Pieters etal., 2001; Staid and Pieters, 2001) and Lunar Prospector γ -ray and neutron spectrometer data (Elphic et al., 1998; Feld-man et al., 1998a, b; Lawrence et al., 1998). However, wedo not adopt these newer maps for two reasons. First, manyof these maps are not classified into geologic units. Second,when geologic units are interpreted, the crater density hasbeen already taken into account in the classification. Thusthese newer maps are neither applicable to nor independentfrom our tests.
3. Results3.1 Examination of statistical procedures
The result of crater count in each size bin is listed forall photographs in Table 2, and examples of the crater size-frequency distributions are shown in Figs. 3, 4, 5, and 6. Inthese figures, formal errors are calculated as a square root ofthe cumulative number of craters in each size bin. In prac-tice, however, it is possible that the bias of an individualresearcher is greater than the statistical deviation (BasalticVolcanism Study Project, 1981). We compare our resultswith previous works (Neukum and Konig, 1976; Guinnessand Arvidson, 1977; Young, 1977) to evaluate the bias inour counts. In Figs. 3, 4, and 5, the results by Guinnessand Arvidson (1977) and Young (1977) are shown for com-parison. While the differences of crater counts among thedifferent workers are not negligible, the number densitiesagree each other in general. Two exceptions are the cratersize-frequency distributions in a diameter range greater than100 m in Fig. 3, and that of the Copernicus floor by Young(1977) in Figs. 4(a) and (b). A comparison with the re-sults by Neukum and Konig (1976) is made only graphi-cally because the numbers of craters counted by Neukum and
Konig (1976) are not available in the literature. Their cratercounts on Copernicus floor and ejecta blanket are consistentwith others while that on Tycho is markedly different. Thecause of occasional differences among these databases is notclear. However, the general agreement supports the use ofour crater counts.
We find the best-fit parameters of (1) for each photographpaying attention to the left/right-hand effect (Pickering et al.,1995) and the goodness-of-fit. First, no crater smaller than1 mm in diameter on Apollo metric and Lunar Orbiter pho-tographs is taken into account in our statistics. We set thiscriterion as a conservative lower bound through preliminarytests. For panoramic photographs, we have started with thecrater counts of AS15-0260 (Table 1). Then we have con-firmed that craters smaller than 2.8 mm in diameter on thephotograph (D = 0.13 ∼ 0.18 km on the moon) are in thecrater equilibrium (e.g., Gault, 1970; Chapman and McKin-non, 1986; Hartmann and Gaskel, 1997) (Table 2 and Fig. 6).Therefore the craters smaller than this diameter are not takeninto account in the later counts of Apollo panoramic pho-tographs (Table 1). Although the craters at this diameter arenot in the equilibrium in some photographs, our estimates ofα and β (Table 1) are little dependent on this lower bound ofthe diameter range (Table 2).
Second, in order to determine the diameter range of thesteep slope segment in a statistical manner, we apply the χ2
test (Press et al., 1988) to our crater counts. We calculateα and β for least-squares fit on cumulative plot, and thenevaluate the goodness-of-fit, Q, for all diameter ranges tofind a maximum value of Q for each photograph. In Table 1,the α and β, the maximum value of Q, and the adopted rangeof diameter are summarized for each photograph. Among48 photographs, the crater size-frequency distributions ofthree metric photographs reveal β greater than −3 (AS15-2480, 2490, and 1838). Because an obvious signature ofthe steep slope segment is absent, these photographs areexcluded from the following discussions. In addition, themetric photograph AS15-2746 is also excluded, because themaximum Q value is smaller than 0.1. The least-squares fitof this photograph is not statistically reliable (Press et al.,1988).
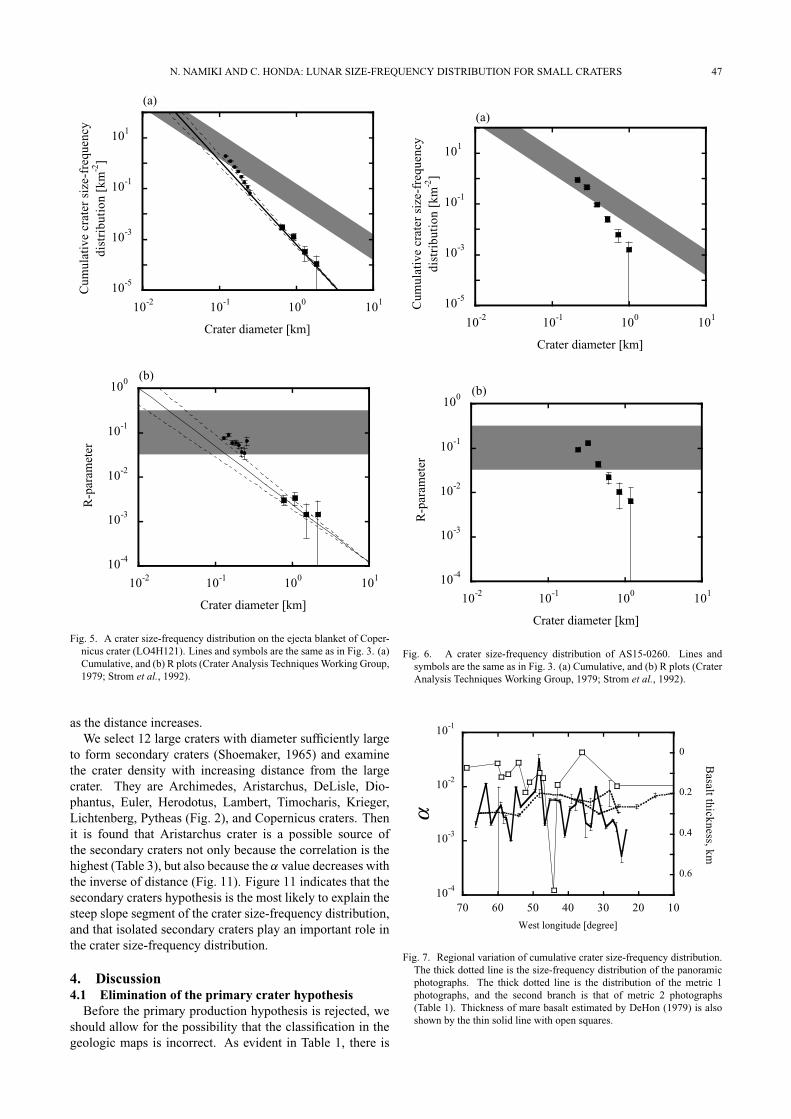
The variation of α in Oceanus Procellarum and Mare Im-brium is shown in Fig. 7. It is clear in this figure that α val-ues of the panoramic photographs show regional variationsas large as a factor of 10. Such large variations cannot be ex-plained by statistical deviations. In contrast, variations of α
in the metric photographs is less than a factor of 3 (Table 1).As a test of internal consistency of our counts, we have com-pared the average density of panoramic photographs and thatof metric photographs for the areas of overlap; both densi-ties match within a statistical error. A variation of a factor of2 between adjacent photographs in Oceanus Procellarum isalso found in the work by Young (1977). Therefore we con-sider that this regional variation is statistically significant.3.2 The crater size-frequency distribution in young
cratersFirst we test the endogenic crater hypothesis (Kuiper et
al., 1966; Chapman et al., 1970; Schultz et al., 1976) onthe basis of our crater size-frequency distributions in youngcraters. In Figs. 3 and 5, the steep slope segments are iden-

44 N. NAMIKI AND C. HONDA: LUNAR SIZE-FREQUENCY DISTRIBUTION FOR SMALL CRATERS
Table 2. Incremental numbers of all crater counting. Boxes indicate bins adopted for χ2 test in Table 1.
Number ofcraters per
bin
Surface
area, km2
Number ofcraters per
bin
Surface
area, km2
Number ofcraters per
bin
Surface
area, km2
Number ofcraters per
bin
Surface
area, km2
Number ofcraters per
bin
Surface
area, km2
0.059 - 0.080 111 136 0.042 - 0.052 1602 285 0.657 - 0.921 16 9420 0.76 - 1.06 317 25800 0.75 - 1.05 170 257000.080 - 0.109 42 136 0.052 - 0.066 1026 285 0.921 - 1.29 9 9420 1.06 - 1.48 105 25800 1.05 - 1.47 103 257000.109 - 0.150 15 136 0.066 - 0.086 670 285 1.29 - 1.82 2 9420 1.48 - 2.08 41 25800 1.47 - 2.06 28 257000.150 - 0.209 2 136 0.086 - 0.114 506 285 1.82 - 2.57 1 9420 2.08 - 2.92 13 25800 2.06 - 2.90 2 257000.209 - 0.296 1 136 0.114 - 0.153 286 285 2.92 - 4.11 3 25800 2.90 - 4.09 2 25700
0.153 - 0.209 126 285 4.11 - 5.80 1 25800 4.09 - 5.76 1 257000.209 - 0.288 32 285 5.80 - 8.19 1 25800 5.76 - 8.14 1 257000.288 - 0.400 19 285 8.19 - 11.6 2 25800 8.14 - 11.5 0 257000.400 - 0.559 2 285 11.6 - 16.3 1 25800 11.5 - 16.2 0 257000.559 - 0.783 4 285 16.3 - 23.1 0 25800 16.2 - 23.0 0 257000.783 - 1.11 1 285 23.1 - 32.7 1 25800 23.0 - 32.4 0 25700
32.4 - 45.8 1 25700
0.75 - 1.05 179 25800 0.75 - 1.04 157 25800 0.74 - 1.04 202 25500 0.75 - 1.05 247 26600 0.73 - 1.03 237 257001.05 - 1.47 77 25800 1.04 - 1.47 56 25800 1.04 - 1.46 56 25500 1.05 - 1.48 95 26600 1.03 - 1.45 109 257001.47 - 2.07 16 25800 1.47 - 2.06 21 25800 1.46 - 2.06 6 25500 1.48 - 2.09 22 26600 1.45 - 2.05 38 257002.07 - 2.91 6 25800 2.06 - 2.91 7 25800 2.06 - 2.90 8 25500 2.09 - 2.95 4 26600 2.05 - 2.89 9 257002.91 - 4.10 2 25800 2.91 - 4.10 2 25800 2.90 - 4.09 1 25500 2.95 - 4.17 1 26600 2.89 - 4.08 3 257004.10 - 5.79 1 25800 4.10 - 5.80 1 25800 4.09 - 5.78 0 25500 4.17 - 5.89 3 26600 4.08 - 5.77 4 257005.79 - 8.18 1 25800 5.78 - 8.17 1 25500 5.89 - 8.33 0 26600 5.77 - 8.15 0 257008.18 - 11.6 0 25800 8.17 - 11.5 0 25500 8.33 - 11.8 1 26600 8.15 - 11.5 1 2570011.6 - 16.3 0 25800 11.5 - 16.3 0 25500 11.8 - 16.7 0 2660016.3 - 23.1 0 25800 16.3 - 23.1 1 25500 16.7 - 23.5 1 2660023.1 - 32.7 1 25800 23.5 - 33.2 1 26600
AS15-2080AS15-2064 AS15-2068 AS15-2072 AS15-2076
AS15-2060
Bin diameter, km Bin diameter, km Bin diameter, km Bin diameter, km Bin diameter, km
LO5H127 LO5H153 LO4H121 AS15-2056
0.72 - 1.01 171 18600 0.71 - 1.00 97 14600 0.71 - 1.00 155 18300 0.72 - 1.01 122 18600 0.70 - 1.00 146 246001.01 - 1.42 41 18600 1.00 - 1.41 25 14600 1.00 - 1.42 24 18300 1.01 - 1.43 41 18600 1.00 - 1.41 53 246001.42 - 2.00 37 18600 1.41 - 1.99 9 14600 1.42 - 2.00 12 18300 1.43 - 2.02 6 18600 1.41 - 1.99 15 246002.00 - 2.82 11 18600 1.99 - 2.82 3 14600 2.00 - 2.83 5 18300 2.02 - 2.86 6 18600 1.99 - 2.82 7 246002.82 - 3.98 2 18600 2.82 - 3.98 2 14600 2.83 - 4.00 2 18300 2.86 - 4.04 2 18600 2.82 - 3.99 2 246003.98 - 5.63 1 18600 3.98 - 5.63 1 14600 4.00 - 5.65 3 18300 4.04 - 5.71 3 18600 3.99 - 5.65 4 246005.63 - 7.96 6 18600 5.65 - 7.99 2 18300 5.71 - 8.08 1 18600 5.65 - 7.99 2 24600
Number ofcraters per
bin
Surface
area, km2
Number ofcraters per
bin
Surface
area, km2
Number ofcraters per
bin
Surface
area, km2
Number ofcraters per
bin
Surface
area, km2
Number ofcraters per
bin
Surface
area, km2
0.72 - 1.01 203 25200 0.73 - 1.03 139 26100 0.72 - 1.02 232 26000 0.72 - 1.02 196 16800 0.213 - 0.284 281 6401.01 - 1.42 82 25200 1.03 - 1.45 53 26100 1.02 - 1.45 104 26000 1.02 - 1.44 81 16800 0.284 - 0.383 227 6401.42 - 2.01 29 25200 1.45 - 2.05 23 26100 1.45 - 2.05 20 26000 1.44 - 2.04 14 16800 0.383 - 0.523 43 6402.01 - 2.83 10 25200 2.05 - 2.90 12 26100 2.05 - 2.89 6 26000 2.04 - 2.89 3 16800 0.523 - 0.721 12 6402.83 - 4.00 4 25200 2.90 - 4.10 2 26100 2.89 - 4.09 0 26000 2.89 - 4.09 1 16800 0.721 - 1.00 3 6404.00 - 5.65 2 25200 4.10 - 5.79 0 26100 4.09 - 5.79 2 26000 4.09 - 5.78 3 16800 1.00 - 1.41 1 6405.65 - 7.99 0 25200 5.79 - 8.19 0 26100 5.79 - 8.18 1 260007.99 - 11.3 0 25200 8.19 - 11.6 0 26100 8.18 - 11.6 0 2600011.3 - 16.0 0 25200 11.6 - 16.4 0 26100 11.6 - 16.4 0 2600016.0 - 22.6 0 25200 16.4 - 23.1 0 26100 16.4 - 23.2 1 2600022.6 - 32.0 1 25200 23.1 - 32.7 1 26100
0.205 - 0.272 259 586 0.209 - 0.278 274 629 0.207 - 0.276 281 595 0.212 - 0.284 403 671 0.217 - 0.292 416 7070.272 - 0.367 106 586 0.278 - 0.377 130 629 0.276 - 0.374 95 595 0.284 - 0.386 112 671 0.292 - 0.398 124 7070.367 - 0.501 32 586 0.377 - 0.515 46 629 0.374 - 0.513 34 595 0.386 - 0.529 35 671 0.398 - 0.547 58 7070.501 - 0.690 3 586 0.515 - 0.711 8 629 0.513 - 0.708 7 595 0.529 - 0.732 9 671 0.547 - 0.758 18 7070.690 - 0.959 2 586 0.711 - 0.99 5 629 0.708 - 0.985 4 595 0.732 - 1.02 4 671 0.758 - 1.058 1 7070.959 - 1.33 2 586 0.99 - 1.40 3 629 0.985 - 1.37 3 595 1.02 - 1.44 1 671 1.058 - 1.47 2 707
1.33 - 1.88 1 586 1.37 - 1.93 0 595 1.47 - 2.08 1 7071.93 - 2.71 1 5952.71 - 3.83 1 595
AS15-0280AS15-0264 AS15-0268 AS15-0272 AS15-0276
AS15-0260
Bin diameter, km Bin diameter, km Bin diameter, km Bin diameter, km Bin diameter, km
AS15-1838 AS15-1842 AS15-1846 AS15-1850
AS15-2480 AS15-2484 AS15-2746 AS15-2748 AS15-2490
tified in the crater size-frequency distributions on the ejectablankets of Tycho and Copernicus craters. While the steepslope on Tycho ejecta blanket is not perceived by some previ-ous work (Basaltic Volcanism Study Project, 1981), the steepslope segment can be recognized in not only our results butalso others (Young, 1977) (Figs. 3(a) and (b)). These resultsindicate that the endogenic crater hypothesis is implausible,because no volcanic activity is reported on the ejecta blan-kets of young Tycho and Copernicus craters. Even thoughpost-impact volcanism is suggested for the floors of these
two craters (Basaltic Volcanism Study Project, 1981), the ob-served size-frequency distribution on the floor of the Coper-nicus crater (Table 2 and Fig. 4) is nearly identical with thaton the ejecta blanket (Table 2 and Fig. 5).3.3 A comparison with geophysical data sets
We consider the second hypothesis that attributes the steepsegment of the crater size-frequency distributions to variablestrength of target (Gault, 1970; Schultz et al., 1977; Chap-man et al., 1979). Unfortunately, our knowledge on the sub-surface structure under the lunar maria is limited. Instead

N. NAMIKI AND C. HONDA: LUNAR SIZE-FREQUENCY DISTRIBUTION FOR SMALL CRATERS 45
Table 2. (continued).
0.211 - 0.284 426 670 0.210 - 0.282 111 669 0.210 - 0.283 129 677 0.206 - 0.279 289 665 0.210 - 0.284 463 7030.284 - 0.387 245 670 0.282 - 0.385 72 669 0.283 - 0.386 89 677 0.279 - 0.381 156 665 0.284 - 0.390 252 7030.387 - 0.532 98 670 0.385 - 0.531 41 669 0.386 - 0.533 31 677 0.381 - 0.526 82 665 0.390 - 0.539 109 7030.532 - 0.737 34 670 0.531 - 0.736 8 669 0.533 - 0.739 18 677 0.526 - 0.730 27 665 0.539 - 0.749 39 7030.737 - 1.03 14 670 0.736 - 1.03 4 669 0.739 - 1.03 9 677 0.730 - 1.02 10 665 0.749 - 1.05 6 703
1.03 - 1.46 4 670 1.03 - 1.43 0 669 1.03 - 1.46 1 677 1.02 - 1.43 4 665 1.05 - 1.48 3 7031.43 - 2.02 1 669 1.43 - 2.02 2 665
Number ofcraters per
bin
Surface
area, km2
Number ofcraters per
bin
Surface
area, km2
Number ofcraters per
bin
Surface
area, km2
Number ofcraters per
bin
Surface
area, km2
Number ofcraters per
bin
Surface
area, km2
0.200 - 0.272 442 644 0.197 - 0.267 356 622 0.193 - 0.263 452 613 0.194 - 0.264 521 624 0.185 - 0.252 200 5680.272 - 0.373 222 644 0.267 - 0.367 178 622 0.263 - 0.362 291 613 0.264 - 0.363 286 624 0.252 - 0.347 125 5680.373 - 0.515 114 644 0.367 - 0.507 70 622 0.362 - 0.501 157 613 0.363 - 0.504 108 624 0.347 - 0.481 59 5680.515 - 0.716 33 644 0.507 - 0.706 17 622 0.501 - 0.697 38 613 0.504 - 0.702 21 624 0.481 - 0.671 23 5680.716 - 1.00 5 644 0.706 - 0.988 2 622 0.697 - 0.977 13 613 0.702 - 0.984 10 624 0.671 - 0.941 7 568
1.00 - 1.40 4 644 0.988 - 1.38 1 622 0.977 - 1.37 2 613 0.984 - 1.38 3 624 0.941 - 1.32 1 5681.40 - 1.98 1 644 1.38 - 1.95 1 622 1.37 - 1.94 1 613 1.38 - 1.95 1 624 1.32 - 1.85 0 568
1.85 - 2.61 1 5682.61 - 3.69 1 5683.69 - 5.22 1 568
0.193 - 0.264 326 649 0.186 - 0.254 301 596 0.182 - 0.249 309 577 0.176 - 0.243 550 572 0.205 - 0.284 509 6680.264 - 0.365 257 649 0.254 - 0.352 231 596 0.249 - 0.345 284 577 0.243 - 0.338 287 572 0.284 - 0.397 253 6680.365 - 0.508 142 649 0.352 - 0.490 172 596 0.345 - 0.481 174 577 0.338 - 0.472 101 572 0.397 - 0.556 109 6680.508 - 0.709 27 649 0.490 - 0.684 77 596 0.481 - 0.671 39 577 0.472 - 0.661 18 572 0.556 - 0.780 27 6680.709 - 0.995 4 649 0.684 - 0.960 31 596 0.671 - 0.943 11 577 0.661 - 0.931 8 572 0.780 - 1.09 9 6680.995 - 1.39 1 649 0.960 - 1.34 16 596 0.943 - 1.32 3 577 0.931 - 1.30 2 572 1.09 - 1.54 4 668
1.39 - 1.97 2 649 1.34 - 1.90 6 596 1.32 - 1.87 3 577 1.30 - 1.84 1 572 1.54 - 2.18 0 6681.90 - 2.67 1 596 2.18 - 3.08 1 6682.67 - 3.78 0 5963.78 - 5.35 1 596
AS15-0348AS15-0324 AS15-0328 AS15-0332 AS15-0344
AS15-0320
Bin diameter, km Bin diameter, km Bin diameter, km Bin diameter, km Bin diameter, km
AS15-0304 AS15-0308 AS15-0312 AS15-0316
AS15-0284 AS15-0288 AS15-0292 AS15-0296 AS15-0300
0.185 - 0.257 413 600 0.181 - 0.251 502 587 0.181 - 0.253 490 613 0.159 - 0.222 517 495 0.158 - 0.221 711 5050.257 - 0.359 140 600 0.251 - 0.352 169 587 0.253 - 0.354 204 613 0.222 - 0.310 231 495 0.221 - 0.309 283 5050.359 - 0.502 34 600 0.352 - 0.493 59 587 0.354 - 0.496 68 613 0.310 - 0.435 90 495 0.309 - 0.434 104 5050.502 - 0.705 7 600 0.493 - 0.697 8 587 0.496 - 0.697 14 613 0.435 - 0.611 17 495 0.434 - 0.611 25 5050.705 - 0.994 3 600 0.697 - 0.983 4 613 0.611 - 0.861 8 495 0.611 - 0.862 7 5050.994 - 1.41 1 600 0.983 - 1.38 2 613 0.861 - 1.21 1 495 0.862 - 1.21 1 505
1.38 - 1.95 1 613 1.21 - 1.71 1 495 1.21 - 1.71 1 5051.71 - 2.41 1 495 1.71 - 2.42 0 5052.41 - 3.41 1 495 2.42 - 3.42 0 505
3.42 - 4.84 0 5054.84 - 6.84 1 505
Number ofcraters per
bin
Surface
area, km2
Number ofcraters per
bin
Surface
area, km2
Number ofcraters per
bin
Surface
area, km2
0.154 - 0.215 775 474 0.157 - 0.221 839 506 0.152 - 0.214 933 4570.215 - 0.302 307 474 0.221 - 0.311 429 506 0.214 - 0.303 555 4570.302 - 0.425 106 474 0.311 - 0.438 149 506 0.303 - 0.428 128 4570.425 - 0.598 29 474 0.438 - 0.616 56 506 0.428 - 0.603 41 4570.598 - 0.844 6 474 0.616 - 0.871 16 506 0.603 - 0.854 7 4570.844 - 1.19 2 474 0.871 - 1.22 4 506 0.854 - 1.20 1 457
1.22 - 1.73 0 506 1.20 - 1.70 1 4571.73 - 2.45 1 506
Bin diameter, km Bin diameter, km Bin diameter, km
AS15-0364 AS15-0366 AS15-0370
AS15-0352 AS15-0356 AS15-0358 AS15-0360 AS15-0362
we examine the correlation of the crater size-frequency dis-tribution with thickness of mare basalt (DeHon, 1979), to-pography (Smith et al., 1997), and Bouguer gravity anomaly(Konopliv et al., 1998; Wieczorek and Phillips, 1998; Kono-pliv and Yuan, 1999) assuming that these geophysical datasets are influenced by crustal structure.
The results are shown in Figs. 7, 8, and 9. In Fig. 7, weadopt 13 craters that lie in an area between 10◦W and 70◦W,and between 26◦N and 32◦N from the list by DeHon (1979).The mare thickness estimated from those 13 craters is shownas open squares in Fig. 7 by the longitude regardless of thelatitude. In this figure, the mare thickness appears to haveno correlation with crater size-frequency distributions of ei-ther metric or panoramic photographs. The topography and
Bouguer gravity anomaly at the center of each photographare calculated by using sets of spherical harmonic coeffi-cients, GLTM-2 (Smith et al., 1997) and JGL100J1 (Kono-pliv et al., 1998; Wieczorek and Phillips, 1998; Konopliv andYuan, 1999), respectively. It is evident in Figs. 8 and 9 thatno significant correlation is found between the crater size-frequency distributions and the topography or Bouguer grav-ity anomaly. Consequently correlations calculated for thesedata sets are low (Table 3). Thus, the variable target hypoth-esis is not supported from the present data sets.3.4 A comparison with geologic units
If the crater size-frequency distribution corresponds to thatof projectiles, the distribution is necessarily a function of sur-face age until the density reaches in equilibrium. Therefore a

46 N. NAMIKI AND C. HONDA: LUNAR SIZE-FREQUENCY DISTRIBUTION FOR SMALL CRATERS
10-5
10-3
10-1
101
10-2 10-1 100 101
Cum
ulat
ive
crat
er s
ize-
freq
uenc
ydi
stri
buti
on [
km-2
]
Crater diameter [km]
(a)
10-2 10-1 100 10110-4
10-3
10-2
10-1
100
R-p
aram
eter
Crater diameter [km]
(b)
Fig. 3. A crater size-frequency distribution on the ejecta blanket surround-ing Tycho crater (LO5H127). Solid circles and squares are the cratersize-frequency distributions from Young (1977) and this work, respec-tively. Solid and dotted lines are an average and errors determined byGuiness and Arvidson (1977). The shaded band indicates crater equilib-rium for which the value of α is between 0.15 and 0.015 (Melosh, 1989).(a) Cumulative, and (b) R plots (Crater Analysis Techniques WorkingGroup, 1979; Strom et al., 1992).
test of this hypothesis is to compare the crater size-frequencydistribution of the photographs in Table 1 with radiometricage at each location. For example, Young (1977) argues thata ratio of crater number density for Copernicus to that forTycho at a-100-m diameter is consistent with approximateages of these craters. While our counts reveal a similar ratioat this diameter (Figs. 3 and 5), it is obvious from the lownegative β values in Table 1 that the ratio strongly dependson diameter.
For Oceanus Procellarum and Mare Imbrium, a directcomparison between the size-frequency distribution and theradiometric age is difficult because of a lack of samples tobe measured. Instead we compare the α value of each pho-tograph with classification in geologic maps (Pieters et al.,1975; Head et al., 1978; Pieters, 1978; Whitford-Stark andHead, 1980; Wilhelms et al., 1987) assuming that each ge-ologic unit represents the same surface age (Figs. 10(a), (b),
10-5
10-3
10-1
101
10-2 10-1 100 101
Cum
ulat
ive
crat
er s
ize-
freq
uenc
ydi
stri
buti
on [
km-2
]
Crater diameter [km]
(a)
10-2 10-1 100 10110-4
10-3
10-2
10-1
100
R-p
aram
eter
Crater diameter [km]
(b)
Fig. 4. A crater size-frequency distribution on the floor within Copernicuscrater (LO5H153). Lines and symbols are the same as in Fig. 3. (a)Cumulative, and (b) R plots (Crater Analysis Techniques Working Group,1979; Strom et al., 1992).
and (c)). In Figs. 10(a), (b), and (c), we classify the α valuesby geologic and spectral units. And also we show an aver-age and a standard deviation of α in the same geologic unitby open squares. Because the standard deviation is muchgreater than errors of each photograph, no relation is foundbetween the α values and geologic classification. Thereforewe conclude that the primary production hypothesis is un-likely.3.5 A comparison among panoramic photographs
The crater size-frequency distributions of the panoramicphotographs in Oceanus Procellarum and Mare Imbrium(Fig. 7) can serve as a test of the secondary crater hypoth-esis. At the first glance, clusters of secondary craters are rec-ognized on the photographs AS15-0280, 0284, 0296, 0300,0304, 0316, 0328, 0332, 0356, 0358, 0360, 0362, and 0366(Table 1). While their contribution to the α values is ap-parently minor except for the photographs AS15-0328 and0362, it is necessary to take into consideration the possiblepresence of many isolated secondary craters. Therefore weexamine the α value and distance from a local large crater,because the density of small craters is expected to decrease
N. NAMIKI AND C. HONDA: LUNAR SIZE-FREQUENCY DISTRIBUTION FOR SMALL CRATERS 47
10-5
10-3
10-1
101
10-2 10-1 100 101
Cum
ulat
ive
crat
er s
ize-
freq
uenc
ydi
stri
buti
on [
km-2
]
Crater diameter [km]
(a)
10-2 10-1 100 10110-4
10-3
10-2
10-1
100
R-p
aram
eter
Crater diameter [km]
(b)
Fig. 5. A crater size-frequency distribution on the ejecta blanket of Coper-nicus crater (LO4H121). Lines and symbols are the same as in Fig. 3. (a)Cumulative, and (b) R plots (Crater Analysis Techniques Working Group,1979; Strom et al., 1992).
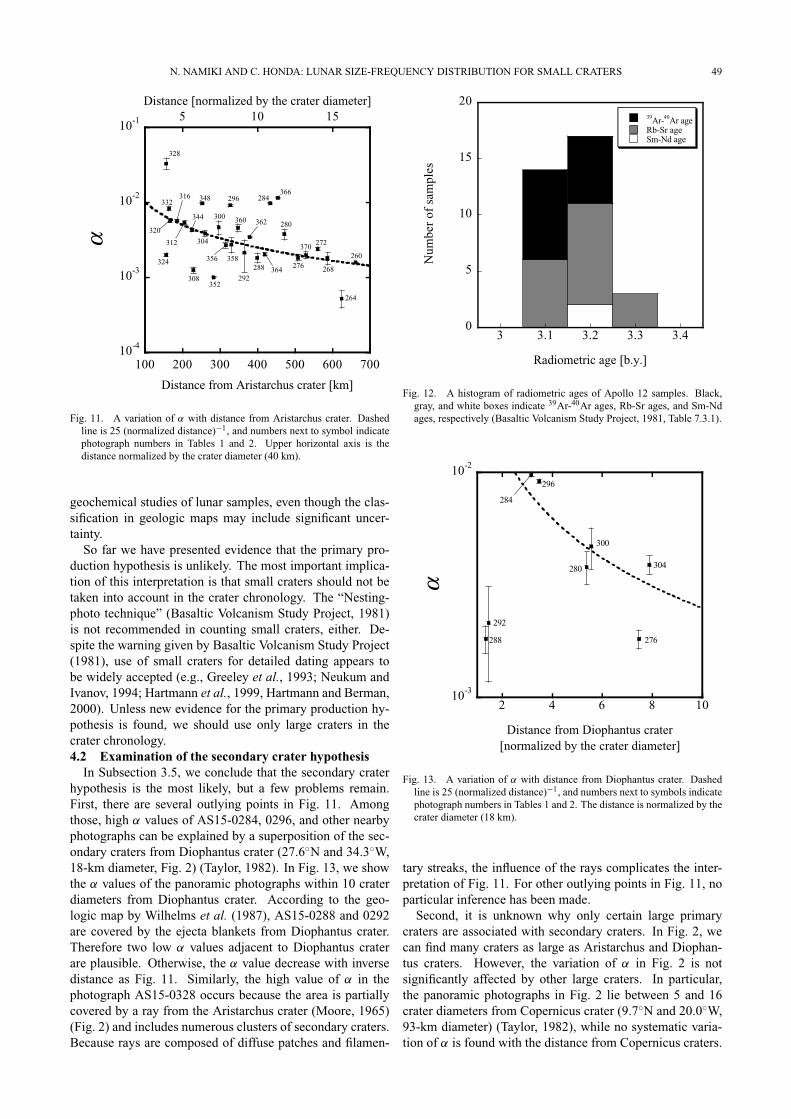
as the distance increases.We select 12 large craters with diameter sufficiently large
to form secondary craters (Shoemaker, 1965) and examinethe crater density with increasing distance from the largecrater. They are Archimedes, Aristarchus, DeLisle, Dio-phantus, Euler, Herodotus, Lambert, Timocharis, Krieger,Lichtenberg, Pytheas (Fig. 2), and Copernicus craters. Thenit is found that Aristarchus crater is a possible source ofthe secondary craters not only because the correlation is thehighest (Table 3), but also because the α value decreases withthe inverse of distance (Fig. 11). Figure 11 indicates that thesecondary craters hypothesis is the most likely to explain thesteep slope segment of the crater size-frequency distribution,and that isolated secondary craters play an important role inthe crater size-frequency distribution.
4. Discussion4.1 Elimination of the primary crater hypothesis
Before the primary production hypothesis is rejected, weshould allow for the possibility that the classification in thegeologic maps is incorrect. As evident in Table 1, there is
10-5
10-3
10-1
101
10-2 10-1 100 101
Cum
ulat
ive
crat
er s
ize-
freq
uenc
ydi
stri
buti
on [
km-2
]
Crater diameter [km]
(a)
10-2 10-1 100 10110-4
10-3
10-2
10-1
100
R-p
aram
eter
Crater diameter [km]
(b)
Fig. 6. A crater size-frequency distribution of AS15-0260. Lines andsymbols are the same as in Fig. 3. (a) Cumulative, and (b) R plots (CraterAnalysis Techniques Working Group, 1979; Strom et al., 1992).
10-4
10-3
10-2
10-1
0
0.2
0.4
0.6
10203040506070
α
Basalt thickness, km
West longitude [degree]
Fig. 7. Regional variation of cumulative crater size-frequency distribution.The thick dotted line is the size-frequency distribution of the panoramicphotographs. The thick dotted line is the distribution of the metric 1photographs, and the second branch is that of metric 2 photographs(Table 1). Thickness of mare basalt estimated by DeHon (1979) is alsoshown by the thin solid line with open squares.

48 N. NAMIKI AND C. HONDA: LUNAR SIZE-FREQUENCY DISTRIBUTION FOR SMALL CRATERS
10-4
10-3
10-2
10-1
-2400 -2000 -1600 -1200
α
Topography [m]
Fig. 8. Cumulative crater size-frequency distributions and topogra-phy. Solid circles, triangles, and squares indicate metric 1 and 2, andpanoramic photographs, respectively (Table 1).
10-4
10-3
10-2
10-1
160 170 180 190 200 210 220 230
α
Bouguer gravity anomaly [mGal]
Fig. 9. Cumulative crater size-frequency distributions and Bouguer gravityanomaly. Solid circles, triangles, and squares indicate metric 1, metric 2,and panoramic photographs, respectively (Table 1).
Table 3. Correlation of crater size-frequency distribution with other datasets (Smith et al., 1997; Konopliv et al., 1998; Wieczorek and Phillips,1998).
Data set Correlation Figure
Topography 0.005 8
Bouguer gravity anomaly 0.051 9
Distance from Aristarchus crater 0.474 11
a notable discrepancy among the geologic maps by differ-ent workers (Pieters et al., 1975; Head et al., 1978; Pieters,1978; Whitford-Stark and Head, 1980; Wilhelms et al.,1987). If the steep slope segment of the lunar crater size-frequency distribution is indeed indicating the surface age asproposed by Neukum and Ivanov (1994), the large variationof α (Fig. 7) suggests that the current geologic maps needto be fully revised, and that the scale of geologic units maybe significantly smaller than currently accepted (Hiesingeret al., 2000a, b; Rajmon and Spudis, 2001). Thus, a vol-canic history more complicated than our present knowledge
10-4
10-3
10-2
10-1
α
HDSA hDSA LBSPLBG-mlSP
348
352
356
358
360
260
268272
276
300
362
364
366
370 324
328
332
264
284
288
304
308
312
316
280320
292
296
(a)
10-4
10-3
10-2
10-1
α
Sharp Telemann
Harmann
Sharp+Harmann
288
352
356
358
360
362
364
366300
304
370
308
312
316
324
328
332
344
348
292
296
320
(b)
10-4
10-3
10-2
10-1
α
Copernican ImbrianEratosthenian
352
356
358
360
362
364260
268
276
280300
344
348
366
264
284
288
304
308
312
316
324
328
332
370
272292
296
320
(c)
Fig. 10. A comparison of the α values of panoramic photographs (Table 1)with geologic or taxologic units. Numbers next to symbols indicate pho-tograph numbers in Tables 1 and 2. For each unit the average of α valuesand the standard deviation are shown by open squares. Classificationsare based on (a) a spectral map compiled by Wilhelms et al. (1987, pl.4) from Pieters et al., (1975), Head et al. (1978), and Pieters (1978), (b)a geologic map by Whitford-Stark and Head (1980), and (c) a geologicmap by Wilhelms et al. (1987, pl. 12).
(Basaltic Volcanism Study Project, 1981) is implied. For ex-ample, values of α as low as 1.0×10⁻³ (Fig. 7) indicate a sur-face age as young as that of the Copernicus impact (Table 1).On the other hand, radiometric ages of Apollo 12 samplesare concentrated within a narrow range from 3.05 to 3.35 b.y.(Fig. 12) (Basaltic Volcanism Study Project, 1981). There-fore the primary production hypothesis is not supported by
N. NAMIKI AND C. HONDA: LUNAR SIZE-FREQUENCY DISTRIBUTION FOR SMALL CRATERS 49
10-4
10-3
10-2
10-1
100 200 300 400 500 600 700
5 10 15
α
Distance from Aristarchus crater [km]
Distance [normalized by the crater diameter]
328
260
264
268
272
276
280
284
288
292
296
300
304
308
312
316
320
324
332
344
348
352
356 358
360 362
364
370
366
Fig. 11. A variation of α with distance from Aristarchus crater. Dashedline is 25 (normalized distance)−1, and numbers next to symbol indicatephotograph numbers in Tables 1 and 2. Upper horizontal axis is thedistance normalized by the crater diameter (40 km).
geochemical studies of lunar samples, even though the clas-sification in geologic maps may include significant uncer-tainty.
So far we have presented evidence that the primary pro-duction hypothesis is unlikely. The most important implica-tion of this interpretation is that small craters should not betaken into account in the crater chronology. The “Nesting-photo technique” (Basaltic Volcanism Study Project, 1981)is not recommended in counting small craters, either. De-spite the warning given by Basaltic Volcanism Study Project(1981), use of small craters for detailed dating appears tobe widely accepted (e.g., Greeley et al., 1993; Neukum andIvanov, 1994; Hartmann et al., 1999, Hartmann and Berman,2000). Unless new evidence for the primary production hy-pothesis is found, we should use only large craters in thecrater chronology.4.2 Examination of the secondary crater hypothesis
In Subsection 3.5, we conclude that the secondary craterhypothesis is the most likely, but a few problems remain.First, there are several outlying points in Fig. 11. Amongthose, high α values of AS15-0284, 0296, and other nearbyphotographs can be explained by a superposition of the sec-ondary craters from Diophantus crater (27.6◦N and 34.3◦W,18-km diameter, Fig. 2) (Taylor, 1982). In Fig. 13, we showthe α values of the panoramic photographs within 10 craterdiameters from Diophantus crater. According to the geo-logic map by Wilhelms et al. (1987), AS15-0288 and 0292are covered by the ejecta blankets from Diophantus crater.Therefore two low α values adjacent to Diophantus craterare plausible. Otherwise, the α value decrease with inversedistance as Fig. 11. Similarly, the high value of α in thephotograph AS15-0328 occurs because the area is partiallycovered by a ray from the Aristarchus crater (Moore, 1965)(Fig. 2) and includes numerous clusters of secondary craters.Because rays are composed of diffuse patches and filamen-
0
5
10
15
20
3 3.1 3.2 3.3 3.4
39Ar-40Ar ageRb-Sr ageSm-Nd age
Num
ber
of s
ampl
es
Radiometric age [b.y.]
Fig. 12. A histogram of radiometric ages of Apollo 12 samples. Black,gray, and white boxes indicate 39Ar-40Ar ages, Rb-Sr ages, and Sm-Ndages, respectively (Basaltic Volcanism Study Project, 1981, Table 7.3.1).
10-3
10-2
2 4 6 8 10
α
Distance from Diophantus crater
288
292
284
296
300
304280
276
[normalized by the crater diameter]
Fig. 13. A variation of α with distance from Diophantus crater. Dashedline is 25 (normalized distance)−1, and numbers next to symbols indicatephotograph numbers in Tables 1 and 2. The distance is normalized by thecrater diameter (18 km).
tary streaks, the influence of the rays complicates the inter-pretation of Fig. 11. For other outlying points in Fig. 11, noparticular inference has been made.
Second, it is unknown why only certain large primarycraters are associated with secondary craters. In Fig. 2, wecan find many craters as large as Aristarchus and Diophan-tus craters. However, the variation of α in Fig. 2 is notsignificantly affected by other large craters. In particular,the panoramic photographs in Fig. 2 lie between 5 and 16crater diameters from Copernicus crater (9.7◦N and 20.0◦W,93-km diameter) (Taylor, 1982), while no systematic varia-tion of α is found with the distance from Copernicus craters.

50 N. NAMIKI AND C. HONDA: LUNAR SIZE-FREQUENCY DISTRIBUTION FOR SMALL CRATERS
Thus our results suggest that only particular craters, suchas Aristarchus and Diophantus craters in this study, form anumber of secondary craters sufficient to influence the size-frequency distribution in the surrounding area. This interpre-tation may explain the conflict of our argument with that ofNeukum et al. (1975), who have demonstrated that the size-frequency distribution of small craters in Mare Serenitatis islittle dependent on a distance from Bessel crater and there-fore have rejected the secondary crater hypothesis.
Figures 11 and 13 imply that the secondary craters andthe ejecta blanket play important roles on the size-frequencydistribution of small craters. However, neither their rolesnor a mechanism to produce the secondary craters have beenfully understood yet (e.g., Chapman and McKinnon, 1986).Advances in experimental studies of hyper-velocity impact(e.g., Gault and Wedekind, 1978; Yamamoto and Nakamura,1997; Yamamoto, 2002) are necessary. As well, comparativetests in different regions, using high-resolution images thatare expected from future lunar missions (Mizutani, 1995;Sasaki et al., 1999), are important.
5. ConclusionsMost of the crater size-frequency distributions on sur-
faces from Imbrian to Copernican ages of the moon revealthe steep-slope segment for diameters smaller than a fewkm. The endogenic crater hypothesis cannot account forthe steep slope of the crater size-frequency distributions onejecta blankets of young Tycho and Copernicus craters. Atthe same time, the crater size-frequency distribution has littleto do with basalt thickness, topography, or Bouguer gravityanomaly. Therefore it is unlikely that the physical propertyof subsurface materials influences the steep slope segmentof the crater size-frequency distribution. The regional vari-ation of the crater size-frequency distributions in Mare Im-brium and Oceanus Procellarum appears to have no correla-tion with the geologic classification, thus allowing rejectionof the primary production hypothesis. We note that craterssmaller than a few km should not be adopted for age determi-nation. Finally regional variations of the size-frequency dis-tributions reveal a close relation with a distance from a locallarge crater. Isolated secondary craters are the likely causeof the steep slope segment, although the reason why only asmall number of craters form numerous secondary craters isunknown.
Needless to say, the area studied in this work is limitedin both space and geologic ages. Therefore it is difficult torule out completely any hypotheses. However, our results doindicate that creation of the small craters is more complexthan previously thought. New high-resolution images fromfuture lunar explorations and experimental studies on crater-ing mechanisms may yield new insights.
Acknowledgments. The Lunar Orbiter and Apollo photographswere processed at and provided by the National Space Sci-ence Data Center. Some of the Lunar Orbiter photographswere processed at and provided by the Regional Planetary Im-age Facility in the Institute of Space and Astronautical Sci-ence. The lunar gravity model JGL100J1 and topography modelGLTM-2 were supplied by Geophysics Subnode of NASA’sPlanetary Data System (PDS) via the World Wide Web at:http://pds-geophys.wustl.edu/pds/. We gratefully
acknowledge Jennifer A. Grier and an anonymous reviewer for crit-ical and thoughtful comments. We also thank Patrick J. McGovernfor his comments to the revised manuscript. This research was sup-ported by the Ministry of Education of Japan under the grants-in-aidfor Encouragement of Young Scientist (08740364, 09740382, and12740265).
ReferencesAlexander, E. C., Jr., A. Bates, M. R. Coscio, Jr., J. C. Dragon, V. R. Murthy,
R. O. Peping, and T. R. Venkatesan, K/Ar dating of lunar soils II, Proc.Lunar Sci. Conf. 7th, 625–648, 1976.
Alexander, E. C., Jr., M. R. Coscio, Jr., J. C. Dragon, R. O. Peping, andK. Saito, K/Ar dating of lunar soils III: Comparison of 39Ar-40Ar andconventional techniques; 12032 and the age of Copernicus, Proc. LunarSci. Conf. 8th, 2725–2740, 1977.
Basaltic Volcanism Study Project, Basaltic Volcanism on the TerrestrialPlanets, 1286 pp., Pergamon, New York, 1981.
Bogard, D. D., D. H. Garrison, D. S. McKay, and S. J. Wentworth, The ageof Copernicus: New evidence for 800±15 million years (abstract), LunarPlanet. Sci., 23, 133–134, 1992.
Budney, J. C. and P. G. Lucey, Basalt thickness in Mare Humorum: Thecrater excavation method, J. Geophys. Res., 103, 16855–16870, 1998.
Chapman, C. R. and W. B. McKinnon, Cratering of planetary satellites,in Satellites, edited by J. A. Burns and M. S. Matthews, pp. 492–580,Arizona University Press, Tucson, 1986.
Chapman, C. R., J. A. Mosher, and G. Simmons, Lunar cratering anderosion from Orbiter 5 photographs, J. Geophy. Res., 75, 1445–1466,1970.
Chapman, C. R., J. C. Aubele, W. J. Roberts, and J. A. Cutts, Sub-kilometerlunar craters: Origins, ages, processes of degradation, and implicationsfor mare basalt petrogenesis (abstract), Lunar Planet. Sci., 10, 190–191,1979.
Chapman, C. R., J. Veverka, M. J. S. Belton, G. Neukum, and D. Morrison,Cratering on Gaspra, Icarus, 120, 231–245, 1996.
Crater Analysis Techniques Working Group, Standard techniques for pre-sentation and analysis of crater size-frequency data, Icarus, 37, 467–474,1979.
DeHon, R. A., Thickness of the western mare basalts, Proc. Lunar Planet.Sci. Conf. 10th, 2935–2955, 1979.
DeHon, R. A. and J. D. Waskom, Geologic structure of the eastern marebasins, Proc. Lunar Sci. Conf. 7th, 2729–2746, 1976.
Drozd, R. J., C. M. Hohenberg, C. J. Morgan, and C. E. Ralston, Cosmicray exposure history at the Apollo 16 and other lunar sites: lunar surfacedynamics, Geochim. Cosmochim. Acta, 38, 1625–1642, 1974.
Elphic, R. C., D. J. Lawrence, W. C. Feldman, B. L. Barraclough, S. Mauris,A. B. Binder, and P. G. Lucey, Lunar Fe and Ti abundances: Compositionof Lunar Prospector and Clementine data, Science, 281, 1493–1496,1998.
Feldman, W. C., B. L. Barraclough, S. Mauris, R. C. Elphic, D. J. Lawrence,D. R. Thomsen, and A. B. Binder, Major compositonal units of the Moon:The Lunar Prospector thermal and fast neutrons, Science, 281, 1489–1493, 1998a.
Feldman, W. C., S. Mauris, A. B. Binder, B. L. Barraclough, R. C. Elphic,and D. J. Lawrence, Fluxes of fast and epithermal neutrons from LunarProspector: Evidence for water ice at the lunar pole, Science, 281, 1496–1500, 1998b.
Gault, D. E., Saturation and equilibrium conditions for impact cratering onthe lunar surface: Criteria and implications, Radio Sci., 5, 273–291, 1970.
Gault, D. E. and J. A. Wedekind, Experimental studies of oblique impact,Proc. Lunar Planet. Sci. Conf. 9th, 3843–3875, 1978.
Gillis, J. J. and P. D. Spudis, Geology of the Smythii and Marginis region ofthe Moon: Using integrated remotely sensed data, Science, 105, 4217–4233, 2000.
Greeley, R., S. D. Kadel, D. A. Williams, L. R. Gaddis, J. W. Head, A.S. McEwen, S. Murchie, E. Nagel, G. Neukum, C. M. Pieters, J. M.Sunshine, R. Wagner, and M. J. S. Belton, Galileo observation of lunarmaria and related deposits, J. Geophys. Res., 98, 17183–17206, 1993.
Guinness, E. A. and R. E. Arvidson, On the constancy of the lunar crateringflux over the past 3.3 × 10⁹ yr, Proc. Lunar Sci. Conf. 8th, 3475–3494,1977.
Halekas, J. S., D. L. Mitchell, R. P. Lin, S. Frey, L. L. Hood, M. H. Acuna,and A. B. Binder, Mapping of crustal magnetic anomalies on the lunarnear side by the Lunar Prospector electron reflectometer, J. Geophys.Res., 106, 27841–27852, 2001.
Hartmann, W. K. and D. C. Berman, Elysium Planitia lava flows: Crater

N. NAMIKI AND C. HONDA: LUNAR SIZE-FREQUENCY DISTRIBUTION FOR SMALL CRATERS 51
count choronology and geological implications, J. Geophys. Res., 105,15011–15025, 2000.
Hartmann, W. K. and R. W. Gaskel, Planetary cratering 2: Studies ofsaturation equilibrium, Meteorit. Planet. Sci., 32, 109–121, 1997.
Hartmann, W. K., M. Malin, A. McEwen, M. Carr, L. Soderblom, P.Thomas, E. Danielson, P. James, and J. Veverka, Evidence for recentvolcanism on Mars from crater counts, Nature, 397, 586–589, 1999.
Head, J. W., J. B. Adams, T. B. McCord, C. M. Pieters, and S. H. Zisk,Regional stratigraphy and geologic history of Mare Crisium, in Mare cri-sium, the view from Luna 24: proceedings of the Conference on Luna24, Houston, Texas, December 1–3, 1977/compiled by Lunar and Plan-etary Institute (Geochimica et Cosmochimica Acta. suppl. 9), pp. 43–74,Pergamon, New York, 1978.
Hiesinger, H., J. W. Head, U. Wolf, and G. Neukum, Lunar mare basalts inOceanus Procellarum: Initial results on age and composition (abstract),Lunar Planet. Sci. (CD-ROM), 31, #1278, 2000a.
Hiesinger, H., R. Jaumann, G. Neukum, and J. W. Head, Ages of marebasalts on the lunar nearside, J. Geophys. Res., 105, 29239–29275,2000b.
Konopliv, A. S. and D. N. Yuan, Lunar Prospector 100th degree gravitymodel development (abstract), Lunar Planet. Sci. (CD-ROM), 30, #1067,1999.
Konopliv, A. S., A. B. Binder, L. L. Hood, A. B. Kucinskas, W. L. Sjogren,and J. G. Williams, Improved gravity field of the moon from LunarProspector, Science, 281, 1476–1480, 1998.
Kuiper, G. P., R. G. Strom, and R. S. Le Poole, Interpretation of the Rangerrecords, in Ranger VIII and IX. part II. Experimenters’ Analyses andInterpretation, Jet Propulsion Lab. Tech. Rep., 32–248, 1966.
Lawrence, D. J., W. C. Feldman, B. L. Barraclough, A. B. Binder, R. C.Elphic, S. Mauris, and D. R. Thomsen, Global elemental maps of theMoon: The Lunar Prospector gamma-ray spectrometer, Science, 281,1484–1489, 1998.
Lucchita, B. K., Crater clusters and light mantle at the Apollo 17 site: Aresult of secondary impact from Tycho, Icarus, 30, 80–96, 1977.
McEwen, A. S., J. M. Moore, and E. M. Shoemaker, The Phanerozoicimpact cratering rate: Evidence from the farside of the Moon, J. Geophys.Res., 102, 9231–9242, 1997.
Melosh, H. J., Impact Cratering: A Geologic Process, 245 pp., OxfordUniversity Press, New York, 1989.
Mizutani, H., Lunar interior exploration by Japanese Lunar penetrator mis-sion, Lunar-A, J. Phys. Earth, 43, 657–670, 1995.
Moore, H. J., Geologic map of the Aristarchus region of the Moon: USGSMap1-465, scale 1:1,000.000, 1965.
Neukum, G. and B. A. Ivanov, Crater size distributions and impact probabil-ities on Earth from lunar, terrestrial-planet, and asteroid cratering data, inHazards Due to Comets and Asteroids, edited by T. Gehrels, pp. 359–416,Univ. of Arizona Press, Tucson, 1994.
Neukum, G. and B. Konig, Dating of individual lunar craters, Proc. LunarSci. Conf. 7th, 2867–2881, 1976.
Neukum, G. and D. U. Wise, Mars: A standard crater curve and possiblenew time scale, Science, 194, 1381–1387, 1976.
Neukum, G., B. Konig, and J. Arkani-Hamed, A study of lunar impact cratersize-distributions, The Moon, 12, 201–229, 1975.
Pickering, G., J. M. Bull, and D. J. Sanderson, Sampling power-law distri-butions, Tectonophys., 248, 1–20, 1995.
Pieters, C. M., Mare basalt types on the front side of the moon: A summaryof spectral reflectance data, Proc. Lunar Planet. Sci. Conf. 9th, 2825–2849, 1978.
Pieters, C. M., J. W. Head, T. B. McCord, J. B. Adams, and S. H. Zisk,Geochemical and geological units of Mare Humorum: Definition usingremote sensing and lunar sample information, Proc. Lunar Sci. Conf. 6th,2689–2710, 1975.
Pieters, C. M., J. W. Head, L. Gaddis, B. Jolliff, and M. Duke, Rock typesof South Pole-Aitken basin and extent of basaltic volcanism, J. Geophys.Res., 106, 28001–28022, 2001.
Press, W. H., B. P. Flannery, S. A. Teukolsky, and W. T. Vetterling, Numeri-cal Recipes in C, 735 pp., Cambridge Univ. Press, Cambridge, 1988.
Rabinowitz, D., E. Bowell, E. Shoemaker, and K. Muinonen, The popula-tion of Earth-crossing asteroids, in Hazards Due to Comets and Asteroids,edited by T. Gehrels, pp. 285–314, Univ. of Arizona Press, Tucson, 1994.
Rajmon, D. and P. Spudis, Mixing of the mare regolith: A Clementine test
(abstract), Lunar Planet. Sci. (CD-ROM), 31, #1372, 2001.Sasaki, S., Y. Iijima, K. Tanaka, M. Kato, M. Hashimoto, H. Mizutani, K.
Tsuruda, and Y. Takizawa, Scientific research in the SELENE mission,paper IAF-99-Q.4.04, 50th International Astronautical Congress, Ams-terdam, 4–8 October, 1999.
Schultz, P., R. Greeley, and D. Gault, Degradation of small mare surfacefeatures, Proc. Lunar Sci. Conf. 7th, 985–1003, 1976.
Schultz, P., R. Greeley, and D. Gault, Interpreting statistics of small craters,Proc. Lunar Sci. Conf. 8th, 3539–3564, 1977.
Shoemaker, E. M., Preliminary analysis of fine structure of the lunar surfacein Mare Cognitum, in Ranger 7, part 2, Experimenters’ Analyses andInterpretations, JPL, Technical Report 32-700, 75–132, 1965.
Silver, L. T., U-Th-Pb isotope systems in Apollo 11 and 12 regolithicmaterials and a possible age for the Copernican impact, Eos Trans. AGU,52, 534, 1971.
Smith, D. E., M. T. Zuber, G. A. Neumann, and F. G. Lemoine, Topographyof the Moon from the Clementine lidar, J. Geophys. Res., 102, 1591–1611, 1997.
Staid, M. I. and C. M. Pieters, Mineralogy of the last lunar basalts: Resultsfrom Clementine, J. Geophys. Res., 105, 27887–27900, 2001.
Strom, R. G., S. K. Croft, and N. G. Barlow, The Martian impact crateringrecord, in Mars, edited by H. H. Kieffer, B. M. Jakosky, C. W. Snyder,and M. S. Matthews, pp. 383–423, Arizona University Press, Tucson,1992.
Taylor, S. R., Planetary Science: A Lunar Perspective, 481 pp., Lunar andPlanetary Institute, Houston, 1982.
Veverka, J., P. C. Thomas, M. Robinson, S. Murchie, C. Chapman, M.Bell, A. Harch, W. J. Merline, J. F. Bell, B. Bussey, B. Carcich, A.Cheng, B. Clark, D. Domingue, D. Dunham, R. Farquhar, M. J. Gaffey,E. Hawkins, N. Izenberg, J. Joseph, R. Kirk, H. Li, P. Lucey, M. Malin,L. McFadden, J. K. Miller, W. M. Owen, C. Peterson, L. Prockter, J.Warren, D. Wellnitz, B. G. Williams, and D. K. Yeomans, Imaging ofsmall-scale features on 433 Eros from NEAR: Evidence for a complexregolith, Science, 292, 484–488, 2001.
Weitz, C. M. and J. W. Head, Spectral properties of the Marius Hills volcaniccomplex and implications for the formation of lunar domes and cones, J.Geophys. Res., 104, 18933–18956, 1999.
Wieczorek, M. A. and R. J. Phillips, Potential anomalies on a sphere:Applications to the thickness of the lunar crust, J. Geophys. Res., 103,1715–1724, 1998.
Whitford-Stark, J. L. and J. W. Head, Stratigraphy of Oceanus Procellarumbasalts: Sources and styles of emplacement, J. Geophys. Res., 85, 6579–6609, 1980.
Wilhelms, D., V. Oberbeck, and H. Aggarwal, Size-frequency distributionof primary and secondary lunar impact craters, Proc. Lunar Sci. Conf.9th, 3735–3762, 1978.
Wilhelms, D., J. McCauley, and N. Trask, The Geologic History of theMoon, 302 pp., USGS Professional Paper 1348, 1987.
Wolfe, E. W., B. K. Lucchitta, V. S. Reed, G. E. Ulrich, and A. G. Sanchez,Geology of the Taurus-Littrow valley floor, Proc. Lunar Sci. Conf. 6th,2463–2482, 1975.
Yamamoto, S., Measurement of impact ejecta from regolith targets inoblique impacts, Icarus, 158, 87–97, 2002.
Yamamoto, S. and A. M. Nakamura, Velocity measurements of impactejecta from regolith targets, Icarus, 128, 160–170, 1997.
Yingst, R. A. and J. W. Head, Volumes of lunar lava ponds in South Pole-Aitken and Orientale basins: Implications for eruption conditions, trans-port mechanism, and magma source regions, J. Geophys. Res., 102,10909–10931, 1997.
Yingst, R. A. and J. W. Head, Geology of mare deposits in South Pole-Aitken basin as seen by Clementine UV/VIS data, J. Geophys. Res., 104,18957–18979, 1999.
Young, R. A., Mare crater size-frequency distributions: Implications forrelative surface ages and regolith development, Proc. Lunar Sci. Conf.6th, 2645–2662, 1975.
Young, R. A., The lunar impact flux, radiometric age correlation, and datingof specific lunar features, Proc. Lunar Sci. Conf. 8th, 3457–3473, 1977.
N. Namiki (e-mail: [email protected]) and C. Honda