test validation & analysis program manual - · pdf filesteps for validating and analyzing...
TRANSCRIPT

Copyright © 2010 Biddle Consulting Group, Inc.
TVAP
Test Validation & Analysis Program
Version 7.0
July 2010
Biddle Consulting Group, Inc.
193 Blue Ravine, Suite 270
Folsom, CA 95630 / 916.294.4250 ext. 113
www.biddle.com


I
Contents
Program Setup and Overview .......................................................................................... 1
System Requirements and Setup Instructions ......................................................... 1
Program Overview .................................................................................................. 1
Historical/Legal Background of the Program ......................................................... 2
Steps for Validating and Analyzing Tests Using the Program ..................................... 4
Validate the Test Content Using the Test Validation Workbook ........................... 4
Step 1: Have SMEs Rate Items Using the Test Item Survey and Input Survey
Data into Test Item Survey Workbook .................................................................. 4 Step 2: Evaluate the Question Analysis Sheet in the Test Validation Workbook
and Select Surviving Items .................................................................................... 5 Step 3: Export the Angoff Ratings from the Test Analysis Export Sheet and
Import to the Test Analysis Workbook ................................................................. 7
Analyze the Test Results and Establish Cutoff Score Options Using the Test
Analysis Workbook ................................................................................................. 7
Step 1: Rater Input: Import Angoff Ratings and Keep only Ratings for Items that
Survived the Question Analysis Review ............................................................... 7 Step 2: Rater Analysis: Evaluate Rater Reliability and Remove Outlier Raters ... 7 Step 3: Finalize and Administer the Test and Announce the Critical Score ........ 10 Step 4: Complete Item Analyses .......................................................................... 11 Step 5: Remove Test Items Based on Item Analyses .......................................... 14 Step 6: Complete Overall Test Analyses ............................................................. 14 Step 7: Calculate Three Cutoff Score Options and Set the Final Cutoff Score ... 16 Step 8: Cutoff Results by Gender/Ethnicity & Adverse Impact Analyses .......... 20
Glossary ............................................................................................................................ 22
References ........................................................................................................................ 24
Attachment A - Instructions for Completing the Test Item Survey ........................... 27
Introduction ........................................................................................................... 27
Administering the Test Item Survey ..................................................................... 27
Instructions for Providing Ratings on Checklist (Questions 1-10) ...................... 28 Instructions for Rating Job Knowledge Tests (Questions 11-14) ........................ 31
Test Item Comment Form ..................................................................................... 32
Attachment B - The Conditional Standard Error of Measurement (CSEM)............ 33
Attachment C - Test Item Writing Guidelines ............................................................. 43
Test Item Writing Guidelines ................................................................................ 43
Item Writing .......................................................................................................... 43
Item Format When Developing Tests ................................................................... 48
Examples of Test Items ......................................................................................... 49
Examples of Item Types........................................................................................ 50
Test Plan Example................................................................................................. 51
Attachment D - Upward Rating Bias on Angoff Panels .............................................. 54


1
Program Setup and Overview
System Requirements and Setup Instructions
Before installing the Test Validation & Analysis Program, be sure that your computer is
equipped with at least the following:
• CD ROM drive
• Pentium III processor (or higher)
• 1 GB of RAM minimum (more recommended)
• 150 megabytes of free hard drive space
• Super VGA monitor, 800x600 resolution minimum, 1024x768 recommended
• Microsoft Windows® version XP/Vista/7.0
• Microsoft Excel® XP/2003/2007
• Excel must also be configured so that macros are enabled for the Program to operate
To install the Program, insert the CD and run the ―setup.exe‖ file and follow the on-screen
instructions.
Program Overview
This Program is designed for use by human resource professionals to aid in validating
and analyzing written tests (the Program may also be used for other types of tests—please call
for assistance). Because this Program uses a content validity approach for validation (see Section
14C and 15C of the Uniform Guidelines, 1978), it is most appropriate for validating tests
designed to measure knowledges, skills, abilities, and personal characteristics (―KSAPCs‖) that
can be validated using this method. Note that the Uniform Guidelines specify that tests
measuring abstract traits or constructs that cannot be ―operationally defined‖ in terms of
observable aspects of job behavior (see Sections 14C[1] and Questions & Answer #75) should
not be validated using a content validation strategy.
The Program was developed by integrating concepts and requirements from professional
standards, the Uniform Guidelines (1978), and relevant court cases into a system that is relatively
automated. While efforts were made to automate these processes as much as possible,
professional judgment should be used when operating this Program and evaluating its results.
The Program includes two separate Workbooks: the Test Validation Workbook and the
Test Analysis Workbook. These Workbooks operate in Microsoft Excel and include numerous
features that use embedded programming and macros to complete the calculations. Microsoft
Excel was chosen as a development platform for this Program to allow the user to readily import
and export data and relevant analysis results and to make custom changes if desired. Used in
sequence, the Workbooks provide a complete set of tools to validate written tests (entry level or
promotional), analyze item-level and test-level results (after administration), and set job-related
and defensible cutoff scores using court-approved methods.

Copyright © Biddle Consulting Group, Inc. 2
To use the two Workbooks in a successful test development and validation process, the
user needs two documents in advance. The first is a job analysis document that includes a list of
important and/or critical job duties and KSAPCs for the target position. The second is the draft
written test—which was (hopefully) developed based on the job analysis and developed using
both subject-matter experts (―SMEs‖) and human resource staff. If these two documents are
available, the test validation and analysis process can begin by using the two Workbooks in the
following manner.
The Test Validation Workbook includes the tools for validating a test before it is
administered to applicants. This Workbook includes a survey that is printed and given to a panel
of SMEs. The SMEs use the survey to rate each question on the draft written test. These ratings
are then entered into the Test Validation Workbook and analyzed using the Program to evaluate
which items to include on the final test (and which items to discard, or save for re-evaluation by
SMEs after revision). After the final items are identified using this Workbook, part of the SME
ratings (the Angoff ratings that reflect the opinions from SMEs regarding the minimum passing
level for each item on the test) are exported to the Test Analysis Workbook for the remaining
steps in the process.
The Test Analysis Workbook is used to analyze the test results (at both an item and
overall test level), modify and improve the test based on these results, and then set job-related
cutoffs using methods that have been previously endorsed by the courts. There are eight steps
included in this Workbook, all of which should be completed the first time a new test is
administered and only some of which are used to analyze test data for subsequent
administrations.
In summary, the Test Validation Workbook is used before a test is administered
(primarily to decide which questions to include on the test) and the Test Analysis Workbook is
used to analyze the test after being administered and to set cutoffs based on various factors.
This manual is designed to provide the user with instructions for operating both
Workbooks and interpreting their results. It should be noted that some background in statistics
and test development/validation is needed to operate these Workbooks and effectively analyze
their results. There is a Glossary at the end of this manual that defines key terms.
There are four attachments in this manual:
Attachment A - Instructions for Completing the Test Item Survey can be used as a
guide for administering the Test Item Survey to SMEs and facilitating a test item
validation workshop.
Attachment B - The Conditional Standard Error of Measurement (CSEM) describes
some of the technical aspects included in this Manual, specifically regarding the use of
statistics to establish a cutoff score and create top-down score bands.
Attachment C - Test Item Writing Guidelines provides information for working with
SMEs and human resource staff to write effective test items.
Attachment D - Upward Rating Bias on Angoff Panels provides a brief description of
the tools and methods in the Program for detecting (and correcting where appropriate) an
upward rating bias that sometimes occurs when establishing cutoff scores for tests.
Historical/Legal Background of the Program
Written tests have been the focus of litigation for several decades. Completing a thorough
validation process, such as the one facilitated by this Program, offers two key benefits to the
employer. First, it helps insure that the test used for selection or promotion is sufficiently related

Copyright © 2010 Biddle Consulting Group, Inc. 3
to the job and includes only test items that SMEs have deemed fair and effective. Second, a
validation process generates documentation that can be used as evidence should the test ever be
challenged in an arbitration or civil rights litigation setting.
Some of the standards used in the Program were adopted from court cases where the
criteria pertaining to test validation have been litigated. Two of these court cases are Contreras v.
City of Los Angeles (656 F.2d 1267. 9th Cir. 1981) and U.S. v. South Carolina (434 US 1026,
1978).
In the Contreras v. City of Los Angeles case, a three-phase process was used to develop
and validate an examination for an Auditor position. In the final validation phase, where the
SMEs were asked to identify a knowledge, skill, or ability that was measured by the test item, a
―5 out of 7‖ rule (71%) was used to screen items for inclusion on the final test. After extensive
litigation, the Ninth Circuit approved the validation process of constructing a written test using
items that had been linked to the knowledges, skills, abilities, and personal characteristics
(KSAPCs) of a job analysis by at least five members of a seven-member SME panel.
In U.S. v. South Carolina, SMEs were convened into ten-member panels and asked to
provide certain judgments to evaluate whether each question on the tests (which included 19
subtests on a National Teacher Exam used in the state) involved subject matter that was a part of
the curriculum at his or her teacher training institution, and therefore appropriate for testing.
These review panels determined that between 63% and 98% of the items on the various tests
were content valid and relevant for use in South Carolina. The U.S Supreme Court endorsed this
process as ―sufficiently valid‖ to be upheld.
These cases provide guidelines for establishing minimum thresholds (71% and 63%
respectively) for the levels of SME endorsement necessary for screening test items for inclusion
on a final test to be used for selection or promotion purposes. In either case, it is important to
note that at least an ―obvious majority‖ of the SMEs was required to justify that the items were
sufficiently related to the job to be selected for inclusion on the test.
Following the reasonable precedence established by these two cases, this Program uses a
―>65% job duty or KSAPC linkage‖ criteria for classifying items as ―acceptable‖ for inclusion
on a test. If less than 65% of the SMEs link the item to a job duty or KSAPC, the Program
simply ―red flags‖ the item for closer evaluation. It should be noted, however, that because this
Program function requires at least a 65% endorsement level for each item, the collective
endorsement level for all of the items used for an actual test is likely to be much higher. This is
because several of the items are likely to have much higher SME endorsement levels.

Copyright © Biddle Consulting Group, Inc. 4
Steps for Validating and Analyzing
Tests Using the Program
As previously mentioned, a Job Analysis document and a draft written test are needed
before beginning the test validation and analysis process. It is necessary that the Job Analysis
used for this process consist of important and/or critical job duties and KSAPCs, which need to
be in a numbered list for the SMEs to provide ratings through the process (e.g., Job Duties 1-23
and KSAPCs 1-41). The draft written test should consist of multiple choice and/or true/false
questions, and also be arranged in numerical order for SME reference during the rating process.
After these two documents have been compiled, the steps below can be completed using the
Program.
Important Note! There are 11 steps described below for completing the test
validation and analysis process facilitated by the Program. Three (3) of
the steps are completed using the Test Validation Workbook. Eight (8) of
the steps are completed using the Test Analysis Workbook.
Validate the Test Content Using the Test Validation Workbook
Step 1: Have SMEs Rate Items Using the Test Item Survey and Input Survey Data
into Test Item Survey Workbook
This step can be completed by printing the Test Item Survey contained in the Test
Validation Workbook, having SMEs complete the surveys using the test, answer key, and
appropriate job analysis documents, and then inputting their ratings into the SME Sheets in
the Workbook (e.g., SME I, SME II, SME III, etc.). See ―Instructions for Completing Test
Item Survey‖ in Attachment A for detailed instructions on conducting this workshop. It is
recommended that no fewer than 3 and no more than 12 SMEs participate in a panel (it is
difficult to evaluate rater reliability if there are fewer than 3 raters and more than 12 can
sometimes be unwieldy and provide no different or ―better‖ results than a panel with fewer
SMEs).
Important Note! The Test Item Survey includes a total of 14 survey questions to be
evaluated by SMEs for every item on a test (14 questions are needed for job
knowledge tests; only 10 are needed for all other types of tests). So, for a job
knowledge test with 100 items, does this mean that each SME needs to provide 14
X 100 ratings, or 1,400 ratings? Yes. Survey questions 6, 8, 9, 12, and 14 are
“active” questions that require the SME to provide a unique response (e.g., the
minimum passing percentage for each item). The remaining 9 questions are
“passive” questions, meaning that the SMEs only need to dissent on these
questions if they desire to provide a negative response. For this reason, an “Auto-
Fill” function has been added to the Program, which will allow the user to
populate all 9 “passive” questions with “Yes” for a specified number of SMEs and
test items. This way, only the “No” ratings from the SMEs need to be input for
these questions.

Copyright © 2010 Biddle Consulting Group, Inc. 5
When inputting data into the Test Validation Workbook, users should start at the
Menu Sheet. To begin inputting data from the Test Item Survey, click on ―SME I.‖ After the
data entry screen appears, begin inputting data for the first test question, using the ―tab‖ key
to move between fields (note that ―tab‖ is used to move down fields; ―shift-tab‖ is used to
move up). Note that ―1‖ should be input for a ―No‖ response, and ―2‖ should be input for a
―Yes‖ response for fields requiring Yes or No input. The ―Close‖ button on the data entry
screen is used to close the data entry screen. Alternatively, data may be input directly into the
spreadsheet using the required input values. Repeat the data entry process for all test items
and all SMEs. For entering multiple duty and/or KSAPC linkages for test items, separate
each number using a comma.
Important Note! Because Excel has limited file saving/recovery features, be sure to
save your work frequently when using the Program.
Step 2: Evaluate the Question Analysis Sheet in the Test Validation Workbook and
Select Surviving Items
After completing and double-checking the data entry, return to the Menu Sheet and
click on the ―Question Analysis‖ button. This will calculate all the values and summarize the
results in the Question Analysis Sheet. The different values shown on this screen are
described below.
Column Descriptions
# Red Flags: The number shown in this column represents the number of potential problem
areas with each corresponding test item. Test items that are red flagged should be
considered for removal from the test or revised and re-evaluated by SMEs (some minor
changes can be made to the test items without requiring a re-evaluation of the items by
SMEs, however, items that are substantially re-worked to address the problem areas
identified by SMEs should be re-evaluated by SMEs). Because some survey criteria are
more significant than others, professional judgment should be used in this process.
Columns 1-5: These columns provide the ―Yes/No‖ ratio of the SMEs (e.g., 67% indicates
that two-thirds of the SMEs answered ―Yes‖ to the survey question) regarding the quality
of the item stem (the part of the test item that asks the question) and the alternatives. A
>65% criteria is used for survey questions 1, 2, 4, and 5. A >86% criteria is used for
question 3 (correct key).
Column 6: This column shows the average Angoff rating (minimum competency rating) for
the item. No red flag criteria are used for this rating, however, items that are rated very
low (near a ―chance score‖ for the item) or very high (e.g., >95%) should be closely
evaluated (see the Section titled, ―Administering the Test Item Survey‖ in Attachment A).
This survey question is designed to address Sections 5H, 14C(7), and 15C(7) of the
Uniform Guidelines. See Attachment A for detailed instructions on how to gather these
ratings from SMEs.
Column 7: This column shows the ratio of SMEs who agree that the item is fair to all
groups, and free from unnecessary bias or culturally loaded content. A >86% criteria is
used for this question.
Columns 8-9: These columns show the percentage of SMEs who linked the test item to a
duty (column 8) or a KSAPC (column 9). A >65% criteria is used for these ratings. It is
not necessary that items are linked to both job duties and KSAPCs if an acceptable
Copyright © Biddle Consulting Group, Inc. 6
KSAPC/job duty linkage study was included in the job analysis process (where SMEs
identified where the KSAPCs are actually applied on the job). These survey questions are
designed to address Sections 14C(4-5), and 15C(4-5) of the Uniform Guidelines.
Column 10: This column provides the ―Yes/No‖ ratio of the ―Necessary on the First Day of
the Job‖ rating, and a >65% criteria is used for this rating. Tests should measure an aspect
of the targeted KSAPC that is needed before on-the-job training. This survey question is
designed to address Section 14C(1) and 5F of the Uniform Guidelines. While the job
analysis process may insure that only KSAPCs that are needed the first day on the job are
selected for measurement on the written test, this survey question helps to insure that the
specific aspect of the KSAPC measured on the test are needed before on-the-job training.
NOTE: Survey Questions 11-14 are only required for tests that include
items measuring job knowledge.
Column 11: This column provides the ratio of SMEs who believed that the item was ―Based
on Current Information.‖ An item that fails to meet the >65% endorsement criteria used
for this question may not be based on current job knowledge (or, even if the item is
technically based on current information, the SMEs are indicating that, with their current
level of understanding of the job, it may not be practically based on current information).
Column 12: This column provides the average ―Memorized‖ rating (using a 0-2 scale). A
>=1.0 criteria is used for this question. Tests measuring job knowledge should only
measure job knowledge areas that are needed in memory while a person is performing the
job (rather than job knowledge areas that can be easily looked up while performing the
job without a potential negative consequence). Sometimes job knowledge tests measure
areas of job knowledge that are provided on a reading list that applicants are directed to
study before taking the test. Tests measuring these ―directed‖ areas of job knowledge are
acceptable, provided that the majority of SMEs endorse that the item is measuring a
specific area of knowledge that is necessary to have in memory and cannot be looked up
without some potential negative consequence on the job.
Column 13: This column provides the ―Yes/No‖ ratio regarding the level of difficulty of the
item. A >65% criteria is used for this rating. Test items designed to measure job
knowledge should be written at a level of difficulty that is similar to how the job
knowledge will be actually applied on the job. This survey question is designed to
address Section 14C(4) and Question & Answer #79 of the Uniform Guidelines.
Column 14: This column provides the average for the ―Consequences‖ rating (using a 0-2
scale). A >=1.0 criteria is used for this rating. This survey question is designed to flag
items that measure only trivial aspects of job knowledge. This rating is useful for
screening out items that may be linked to a job knowledge domain (survey question 9)
that may be (globally) critical to job performance, however the specific aspect of the
knowledge measured by the item is not critically important. This survey question is
designed to address Section 14C(4) and Question & Answer #62 of the Uniform
Guidelines.
The >65% criteria are used for the majority of the survey questions for at least three reasons.
First, this criteria level has been previously endorsed in two high-profile court cases that
involved written tests where SME judgments on job relatedness were evaluated. Second, the
criteria represent a ―clear majority.‖ Third, 65% is a ―natural break‖ that works well for SME
panels of various sizes. For example, in a 3-5 member SME panel, the 65% criteria allows
for one dissenting SME; in a 6-8 member panel, two can dissent; in a 9-11 member panel,

Copyright © 2010 Biddle Consulting Group, Inc. 7
three can dissent; and in a 12 member panel, 4 can dissent. The >86% criteria (used for the
―correct key‖ and ―fair‖ survey questions) require perfect agreement among SMEs with
panels with six or fewer members, and allows for one dissenting SME with panels of 7-12
members.
Please note that conservative standards have been used for the ―Accept‖ and ―Reject‖
values produced by the Program. The type of test, nature of the position, and the extent to
which other tests are used should be some of the factors considered when using the summary
data from this Sheet.
Step 3: Export the Angoff Ratings from the Test Analysis Export Sheet and Import
to the Test Analysis Workbook
Using the ―Export‖ button in the Test Analysis Export Sheet in the Test Validation
Workbook, export the Angoff ratings (the data in column 6 in the Question Analysis Sheet).
This will ready the data for importing into the Test Analysis Workbook.
Analyze the Test Results and Establish Cutoff Score Options Using the Test
Analysis Workbook
Step 1: Rater Input: Import Angoff Ratings and Keep only Ratings for Items that
Survived the Question Analysis Review
Click the ―Import Rater Data‖ button under the ―Tools‖ Menu to import the Angoff
ratings for the test items. This will import the Angoff ratings from SMEs that were developed
using the Test Validation Workbook. After importing these ratings, go to the Rater Input
Worksheet and delete the ratings for the items that did not survive the criteria based on the
Question Analysis Sheet (in the Test Validation Workbook). This is necessary because the
Question Analysis Sheet in the Test Validation Workbook will preserve and record the
process used for choosing the items to include on the final test; whereas only the Angoff
ratings for the final items will be retained for test administration and analysis purposes. The
Angoff ratings for each unused test item should be deleted from the Rater Input Worksheet
by placing the cursor in the appropriate test item row, holding down the shift key, and using
the right arrow key to highlight all raters in that row (be careful to stop at the last rater) and
then pressing the delete key. Important: after removing the ratings for the unused items,
square the data by moving row data so there are no empty rows.
Step 2: Rater Analysis: Evaluate Rater Reliability and Remove Outlier Raters
This section of the Program provides six (6) useful Outputs for analyzing the raters
who participated in the Angoff process. Outputs 1-5 can be interpreted prior to administering
the test; however, Output 6 can only be computed and viewed after the test has been
administered.
After the data has been imported into the Rater Input Sheet, the first five Outputs on
the Rater Analysis Sheet are automatically calculated and the outlier raters (raters whose
ratings were outside of the ―normal range‖ of ratings provided by other raters) are
automatically removed from the calculation of the Critical Score. The Critical Score is the
raw score attained when the average of the SME item ratings are multiplied by the number of
test items. A cutoff score, in contrast, is the final score selected as a pass/fail point for the
test, and is determined after reducing the Critical Score by one, two, or three Conditional

Copyright © Biddle Consulting Group, Inc. 8
Standard Errors of Measurement (CSEMs) (see discussion below, and in Attachment B). The
six Outputs on the Rater Analysis Sheet are described below.
Output 1: Reliability Matrix
This matrix displays the correlations between raters on the item ratings. Correlation
values range between -1 and 1. Positive numbers indicate various levels of ―agreement‖
between raters. Negative numbers indicate ―disagreement.‖ Low correlations are .10 or
lower, medium correlations are between .10 and .30; high correlations are .30 to .50; and
very high correlations exceed .50. Raters that are not highly correlated (or even possibly
negatively correlated) should be closely evaluated.
Output 2: Overall Reliability by Rater
This Output shows the correlations for each rater indicating how consistent their
ratings were relative to all other raters on the panel. Raters who are not statistically
significantly correlated with the average rating of all other raters (with p-values greater
than .05, indicated in yellow) are automatically removed by the program from the
calculation of the overall Critical Score at this step. Raters who are not statistically
significantly correlated with the average rating of other raters either did not understand
the directions sufficiently, purposefully rated items at random, tried expressing a
particular high or low bias in their ratings, or simply had very different opinions than the
other raters (or possibly a combination of several of these reasons).
Output 3: Overall Rater Panel Reliability
This Output shows the overall reliability of all raters using the ―intraclass
correlation coefficient‖ (ICC), which shows the average reliability of the entire panel as a
whole. While it is desirable to have a panel with an ICC value that exceeds .50, lower
values may be acceptable. The ICC provided in this Output only includes raters that
survived Outputs 2 and 4.
Output 4: Outlier Raters (Raters With Overall Averages That are Significantly High or Low
Compared to the Average of the Panel)
This Output highlights raters who, on average, rated items significantly higher or
lower than other raters (using a rule of +/- 1.645 standard deviations from the average of
the overall panel). Note that a rater can be statistically significantly correlated with other
raters (based on Outputs 1 and 2 above), but still consistently provide higher or lower
ratings when compared to other raters. Raters who are significantly higher or lower than
other raters may be attempting to raise or lower the Critical Score for reasons that may
not be job related. The process of omitting these ―outlier‖ raters is known as ―trimming,‖
and is useful for eliminating atypical data reported by SMEs and brings the average
values more within ―normal ranges‖ rather than skewing the average based on extreme
data points.
Output 5: Overall Critical Score
This Output represents the final, unmodified Critical Score for the test that will
later be reduced by one, two, or three CSEMs to establish the final cutoff for the test. The
results are shown with all raters included and with the unreliable and outlier raters
removed (which only includes raters not highlighted in Outputs 2 and 4).

Copyright © 2010 Biddle Consulting Group, Inc. 9
Output 6: Compare Critical Score to Actual Test Results
This Output provides important insight into how the rating panels‘ recommended
cutoff score related to the scores of the test takers who scored in the region of the
recommended cutoff score. Specifically, this Output evaluates whether the SMEs who set
the recommended cutoff score had an upward bias when compared to the test takers who
scored within the score range surrounding the Critical Score. The Output provides the
means for making an adjustment to the Critical Score recommended by the rater panel if
the statistical analysis results justify making such adjustment. This Output has been
provided because it has been our experience that most rater panels have a tendency to
overshoot the Critical Score level actually required for the test. See Attachment D
(Upward Rating Bias in Angoff Panels) for a full discussion on this topic.
Important: This Output can only be interpreted after the Item Analysis, Test
Analysis, and the Rater Bias Evaluation Programs have been run (by clicking their
respective buttons in this order). In addition, for this part of the program to work
correctly, there must be a lock-step connection between the item numbers in the Rater
Input and the Item Data Input sheets (e.g., item #1 must refer to the same item in both
sheets).
Interpreting these Outputs requires making the assumption that (overall) the test
taker pool was in fact at least minimally qualified. However, because the Program
extracts only the test takers who are within a statistically similar score range of the
Critical Score (using a confidence interval of +/- 1.645 Standard Errors of Difference, or
―SEDs‖), and further only recommends making a correction if a significant pattern of
overestimation is observed (rather than a balanced mix of underestimates and
overestimates), making downward adjustments to the cutoff score recommended by the
SME panel is justified if the warnings setup in the program are triggered. Further, the two
adjustments suggested by the program are scaled based upon the severity of the potential
bias levels observed, and are only adjusted within a statistically similar range of the
original ratings provided by the SME panel.
Even with these constraints, we recommend following the guidelines below
before using these Outputs to adjust the Critical Score:
Be sure that the test taker pool was (overall) qualified (relative to the minimum
requirements necessary for applying to the position).
The sample size of the test takers should be relatively large (e.g., >200).
Consider whether the SMEs who provided item ratings were properly calibrated
(see helpful criteria in Attachments A and D).
Carefully evaluate each of the Outputs, in succession, and be sure that the proper
adjustment is used (either Option 1 or Option 2).
After following these guidelines and selecting one of the two optional Critical Scores is
selected (if the Statistical Test exceeded 2.0), simply substitute this value in the Cutoff
Score % field in the CSEM Specification Menu that displays when running either the
―Test Analysis‖ or ―Cutoff Analysis‖ programs. Each section of Output 6 is described
below.
Correlation Between Angoff Ratings and Item Difficulty Values: This column provides
the correlation between the minimum passing score estimates (Angoff ratings) provided
by the SMEs and the Item Difficulty Values (also called ―item p-values,‖ or the

Copyright © Biddle Consulting Group, Inc. 10
percentage of test takers who answered the item correctly) from the test takers. Stronger
correlations suggest a tighter connection between the competency levels judged by the
SMEs who rated the items and the test taker pool taking the test. We typically experience
correlations in the .20s, with the range being about .15 to as high as .55.
Difference Between Critical Score and Test Difficulty: This column provides the average
difference between the Angoff ratings (from SME raters) and the Item Difficulty Values
(from test takers). Positive values in this column indicate that the Angoff ratings were
higher than the Item Difficulty Values. The opposite is of course true for negative values.
For example, if an item had an Angoff rating of 80% and 75% of the test takers answered
the item correctly, a 5% difference would be displayed for this item. This column shows
the average of these differences (for all items on the test).
Skew of Difference Values: Skew is a statistical indicator that reflects whether the
distribution of the data is symmetrical (i.e., uniformly distributed with an equal number
of values above and below the average of the distribution). If the skewness statistic is
zero (0), the data are perfectly symmetrical. As a general guideline, if the skewness
statistic is less than −1 or greater than +1, the distribution is highly skewed. If skewness
is between −1 and −½ or between +½ and +1, the distribution is moderately skewed. If
skewness is between −½ and +½, the distribution is approximately symmetric. This
skewness statistic is applied to the difference values computed by obtaining the
difference between Angoff ratings and the Item Difficulty Values. Positive skew values
reveal that there is a disproportionately high number of test items with positive values
(i.e., items that were potentially over-rated by the raters). Negative skew values indicate
the opposite.
St. Error of Skew: This column provides the standard error of the skew.
St. Error of Skew Threshold (2X St. Error of Skew): This column provides 2X the
Standard Error of the Skew (used below).
Skewness Test Result (Skew/St. Error of Skew): This column provides the results of a
statistical test to indicate whether the skewness is significant (Tabachnick & Fidell,
1996). Tests with unusually high differences between Angoff ratings and Item Difficult
Values (indicated when the Skewness Test exceeds 2.0) should be carefully evaluated. If
the Skewness Test exceeds 2.0, consider using OPT Critical Score #1, which is
computed by reducing each over-rated item‘s Angoff rating to the outer lower limit (1.96
X SE Mean of the SME ratings for each over-rated item). If the Skewness Test results
exceed 3.0, consider using the OPT Critical Score #2, which is computed by reducing
the Critical Score to the outer lower limit of the raters (1.96 Standard Errors of Difference
from the Critical Score, using the average rater reliability and SD of the raters‘ average
ratings). The OPT Critical Score #2 provides a greater correction than OPT Critical Score
#1.
Step 3: Finalize and Administer the Test and Announce the Critical Score
After the test has been assembled using items that have been screened using the
Question Analysis Sheet (and the ratings from only the final items incorporated in the test
have been included in the Critical Score calculation—based on Output 5 or Output 6 in the
Rater Analysis Sheet), the cutoff for the test can be pre-announced with the caveat that the
final cutoff will be determined after making adjustments for measurement error (as reflected
by the CSEM). The applicant pool should be informed that because tests are ―less than
perfectly reliable instruments‖ that the Critical Score will be adjusted after taking several

Copyright © 2010 Biddle Consulting Group, Inc. 11
factors into consideration (e.g., the number of applicants that can feasibly be processed at the
next selection step, the degree of adverse impact of the various cutoff score choices, etc.).
See additional guidelines under Step 7 below.
Step 4: Complete Item Analyses
Input the applicant scores from the test (e.g., preferably by copying and pasting from
a separate worksheet), using 0s (zeros) to indicate incorrectly answered items and 1s to
indicate correctly answered items, into the Item Data Input Sheet. Then run the Item Analysis
program by clicking on this button from the Main Screen. Then evaluate the Outputs
provided by the Program using the guidelines provided below.
Important Note! Most HR/testing software packages will output score data in
text format. The most practical way to input data in the Item Data Input
Sheet in the Program is to configure the data on a separate worksheet
(aligning the columns with those on the Item Data Input sheet) and then
using the copy/paste commands to transfer the data. Be sure that Men
and Women are coded as 1s and 2s and Whites, Blacks, Hispanics,
Asians, Native Americans, and “others” are coded 1, 2, 3, 4, 5, and 6
respectively.
Output 1: Point Biserials
Point biserials provide values for each item that shows how correlated the item is
to the overall test score. Negative values (shown in red) indicate that the item is most
likely mis-keyed or has some other significant flaw. Values between 0.0 and 0.2 (shown
in yellow) indicate that the item is functioning somewhat effectively, but is not
contributing to the overall reliability of the test in a meaningful way. Values of 0.2 and
higher indicate that the item is functioning in an effective way, and is contributing to the
overall reliability of the test.
Note: The overall reliability of the test can be increased by removing the
items with low or negative point biserials.
Output 2: Item Difficulty
This Output shows the percentage of applicants who answered the question
correctly. Items that are excessively ―easy‖ (where more than 90% of the test takers
answered correctly) are shown in red and items that were excessively difficult (where less
than 30% of the test takers answered correctly) are shown in yellow. Typically, items that
provide the highest contribution to the overall reliability of the test are in the mid-range
of difficulty (e.g., 40% to 60%).
Output 3: Differential Item Functioning (DIF)
DIF analyses detect items that are not functioning in similar ways between the
indicated group and whites, or between women and men. Unlike simply comparing the
simple average difference in item performance between groups, DIF statistically controls
for overall group performance on the test, so any DIF items could indicate that the items
are functioning differently even when differences in overall group ability levels are
controlled.

Copyright © Biddle Consulting Group, Inc. 12
TVAP implements the same DIF categorization rules by the Educational Testing
Service (ETS) where test items are classified into three groups (see Zeiky, 1993; and
Dorans and Holland, 1993):
A - The item has negligible or nonsignificant DIF;
B - The item has statistically significant and moderate DIF; or
C - The item has statistically significant and moderate to large DIF.
Cells that display numeric values (e.g., 79, 89, etc.), do not have computable DIF
statistics (e.g., one or more groups had either all correct or incorrect values for the item of
interest). Items with ―B‖ DIF values have some level of DIF; items with ―C‖ DIF values
should be checked for possible content that could unnecessarily favor the majority group
(see the guidelines provided below). DIF statistically controls for overall group
performance on the test, so any DIF items could possibly indicate that the items are
functioning differently even when differences in overall group ability levels are
controlled.
To complete the DIF analysis, TVAP breaks the test score distribution into seven
(7) groups to divide the examinees into similar ability levels for the DIF analysis. The
number of strata used to break up the test score distribution can be changed by selecting
the ―Options‖ button beneath the Item Analysis Program and changing the value.1 The
maximum value is limited to the total number of items in the test.
Before evaluating the results from a DIF analysis, a few conceptual issues should
be explained. First, there is a significant difference between deleting a test item because
one group is scoring lower than another and deleting an item based on DIF analyses. As
defined by the Standards (1999), DIF ―…occurs when different groups of examinees with
similar overall ability, or similar status on an appropriate criterion, have, on average,
systematically different responses to a particular item.‖ The DIF analyses used in TVAP
only flag possible items for removal after controlling for differences in overall group
ability levels. This means, for example, that if only 20% of minority group members
answered a particular item correctly and 70% of the whites answered the item correctly (a
large, 50% score gap between the two groups), the item could still escape a ―DIF
designation.‖ A DIF designation, however, could occur if the minority group and whites
scored very close as overall groups (for example, 55% and 60% respectively), but
systematically performed differently on a certain item.
Second, DIF analyses provide the most accurate results on tests that measure
highly related KSAPCs. For example, if a 50-item test contains a 25-item math scale and
a 25-item interpersonal skills scale, and the test has low reliability because these skills are
unrelated, a DIF analysis conducted on the overall test may produce unreliable and
inaccurate results. In these circumstances, it would be best to separate the two test scales
and conduct separate DIF analyses on each.
Interpreting DIF results should always be done with caution—particularly when
decisions are being made regarding whether to keep items on a test based on DIF results.
For example, the SIOP Principles approach the DIF topic with a certain degree of caution
1 Unless the test includes >1,000 applicants, we recommend using no fewer than 1 strata per 5-10 items to maximize
the statistical power of the DIF analysis. For example, consider using 7 strata for a test with 50 items that was
administered to 500 examinees.

Copyright © 2010 Biddle Consulting Group, Inc. 13
(Principles, 2003, pp. 33-34). Because DIF results can be limited for a variety of reasons
and the validity and reliability of the test should be the dominant concern when making
personnel decisions, we recommend making DIF a secondary consideration behind test
validity and reliability. To this end, we advise removing DIF items from a test based on
the results of a five-step evaluation process, considered in the order provided below.
Factor 1: The first evaluation factor that should be considered is the sample size
of the DIF study. Because DIF analyses rely heavily on inferential statistics, they are very
dependent on sample size. As such, items flagged as DIF based on large sample sizes
(e.g., more than 500 applicants) are more reliable than those based on small sample sizes
(e.g., less than 100 or so). While the testing literature provides various suggestions and
guidelines for sample size requirements when using these types of analyses, a baseline
number of test takers for accurate statistical analysis is more than 200 applicants in the
reference group (whites or men) and at least 30 in the focal group (i.e., the minority
group of interest). More attention should be given to DIF results that are based on larger
sample sizes.
Factor 2: Is there a qualitative reason why the item could be flagged as DIF?
Items that are sometimes flagged as DIF contain certain words, phrases, or comparisons
that require culturally- or gender-loaded content, knowledge, or context to provide an
adequate response. For example, using a football situation for a test measuring math
skills could include content biased against females. On the flipside, if the item measures a
very neutral skill (e.g., 2 + 2 = 4) and has no apparent reason to exhibit DIF, there is no
qualitative evidence to combine with the quantitative indicator (i.e., the item‘s DIF level,
A, B, or C) to form an overall conclusion that the item should be eligible for removal for
possible bias reasons. When evaluating this factor, sometimes it helps to evaluate the
item alternative that the DIF group selected over the non-DIF group
Factor 3: The third evaluation factor pertains to the consistency and directionality
of the DIF results. For example, are there consistent DIF against both minorities and
females? Items with DIF values of ―B‖ or ―C‖ are considered as ―potentially DIF‖ and
should be ―flagged‖ if they are directionally consistent for both minorities and females.
For example, one should proceed cautiously before pulling an item off a test that
exhibited DIF against minorities (i.e., it was lowering the pass rate of minorities), yet had
positive DIF against women (e.g., with an opposite DIF result, showing that women were
advantaged). Thus, with all other things being equal, such a ―flip-flop‖ between
minorities and females can be considered as a ―self-canceling‖ concern.
Factor 4: If the conditions described above are met, the psychometric qualities of
the item should be evaluated, starting first with the specific item validity. With this step,
the question is asked, ―What happens to the validity of the test if this item is removed?‖
For example, if there is specific evidence that the particular item is statistically correlated
with job performance, this must be carefully weighed into the decision process. If there is
specific content validity for the item, this should be carefully evaluated next. For
example, the item under review may be specifically measuring key KSAPCs that have
been identified as crucial for job success. However, if there are several items measuring
such a key KSAPCs, and only one of the items exhibits DIF and the others do not, this

Copyright © Biddle Consulting Group, Inc. 14
may be a specific situation where the DIF item can be removed (with other factors also
being evaluated).2
Factor 5: After evaluating the validity of the item, the fifth and final step should
be completed: reviewing item reliability. This step is last but not least, because item
reliability is typically interwoven with the item‘s validity. For this step, the key statistic
under consideration is the point biserial correlation. This statistic is used to determine the
extent to which the item can discern between the ―high ability‖ and ―low ability‖ test
takers. Items with point biserial values that are exceptionally high (e.g., above .30) have a
high degree of power to distinguish the test takers who have high levels of the KSAPCs
being tested, as well as those who have low ability levels. On the other hand, items with
low point biserials (e.g., below .15) should be carefully evaluated. Items with point
biserial values that are not statistically significantly correlated with the total test score
(typically those with values less than .15, varying with sample size) should be more
closely scrutinized (if the samples sizes are sufficient). Another factor that should be
considered in this step of the process is the item difficulty value. Items that have
exceptionally high pass rates (e.g., >90%, indicating they are easy for the majority of test
takers) should be more readily justified to leave on the test than items that are found more
difficult by the majority of test takers.
In summary, all of these decision criteria should be evaluated carefully, and the
reasons for pulling an item off a test should be clearly outweigh the justification for
leaving an item on a test. More detailed decision rules are discussed in various texts (e.g.,
Biddle, 2005; Principles, 2003, pp. 33-34).
Step 5: Remove Test Items Based on Item Analyses
If items need to be removed from the test based on the results from the Item
Analyses, three steps need to be completed for the Program to adjust the scoring and analysis
procedures appropriately:
1. The item‘s Angoff ratings on the Rater Input Sheet need to be removed (remove the
data in the entire row, and re-square the data by removing empty rows).
2. Delete the item data (the 0s and 1s) contained in the Item Data Input Sheet. Do not
delete the entire column. Only delete the 0s and 1s corresponding to the item data
beginning in row 3 and ending with the last applicant (then re-square the data by
removing empty columns).
3. After removing the item data, re-compute the Item Analysis by clicking on this button
on the Main Sheet.
These steps are necessary for the various other calculations in the Workbook to operate correctly
(including the cutoff calculations).
Step 6: Complete Overall Test Analyses
The Test Analysis Sheet in the Test Analysis Workbook includes several outputs that
can be used to evaluate the overall quality of the test. These are described below.
2 This analysis can be made by evaluating the Question Analysis Sheet in the Test Validation Workbook. Was this
item ―clear‖ on the various ratings provided by SMEs? If the item had an unusual number of red flags when
compared to the other items that were included on the test, it may be a candidate for removal.

Copyright © 2010 Biddle Consulting Group, Inc. 15
Descriptive Statistics
This Output provides the Mean, Standard Deviation, and Minimum/Maximum
scores for the test. While the Mean can be a useful statistic for evaluating the overall test
results, it should be given less consideration when evaluating mastery-based or
certification tests (because certain score levels are needed for passing the test,
irrespective of the fluctuation in score averages based on various applicant groups). The
Standard Deviation is a statistical unit showing the average score dispersion of the overall
test scores. Typically, 68% of applicant scores will be contained within one standard
deviation above and below the test mean, 95% will be contained within two, and 99%
within three.
Reliability
Three reliability estimates are provided in this Output: Cronbach‘s Alpha,
Guttman‘s Split Half, and KR-21. Cronbach‘s Alpha is a widely accepted method for
determining the internal consistency of a written test. The reliability using this method is
shown, along with interpretive guidelines of ―Excellent,‖ ―Good,‖ ―Adequate,‖ and
―Limited,‖ which are taken from the U.S. Department of Labor‘s guidelines (DOL,
2000). The Guttman split-half reliability coefficient is an adaptation of the Spearman-
Brown coefficient, but one which does not require equal variances between the two split
forms. The KR-21 formula is another method for evaluating the overall consistency of the
test. It is typically more conservative than Cronbach‘s Alpha, and is calculated by
considering only each applicant‘s total score (whereas the Cronbach‘s Alpha method
takes item-level data into consideration).
Standard Error of Measurement (SEM) and Conditional Standard Error of Measurement (CSEM)
This Output provides the classical SEM of the test (using the formula: standard
deviation multiplied by the square root of 1 minus the reliability). The formula on this
Sheet uses Cronbach‘s Alpha for the calculation. The SEM provides a confidence interval
of an applicant‘s ―true score‖ around his or her ―obtained score.‖ An applicant‘s true
score represents his or her true, actual ability level on the overall test; whereas an
applicant‘s obtained score represents where he/she ―just happened to score on that given
test day.‖ For example, if the test‘s SEM is 3.0 and an applicant obtained a raw score of
60, his or her true score (with 68% likelihood) is between 57 and 63, between 54 and 66
(with 95% likelihood), and between 51 and 69 (with 99% likelihood).
The Conditional SEM (CSEM) is computed using the method described in
Attachment B and is provided for each score in the distribution. The CSEM provides an
estimate of the SEM for each score in the distribution, allowing the user to focus on the
CSEM in the range of scores around the Critical Score (the classical SEM provides
only an average that considers all scores in the distribution). The CSEM is typically
smaller than the SEM, since it is only taking the scores around each score into
consideration.
Note: This Program is designed for a test measuring a single trait, or a set of
highly related traits. If the user inputs applicant test score data for a test
measuring divergent traits or KSAPCs, it is likely that the reliability (and
other related statistics will be low). Call for assistance when using the
program for multi-trait or multi-scaled tests.

Copyright © Biddle Consulting Group, Inc. 16
Step 7: Calculate Three Cutoff Score Options and Set the Final Cutoff Score
TVAP uses the modified Angoff process (see Biddle, 2006 for a complete
description of this process) to establish job-related cutoff scores. This process is useful for
determining the critical point in the score distribution that delineates ―qualified‖ from
―unqualified‖ based on SME ratings, the measurement properties of the test, and the
consistency and accuracy of SMEs. This process can effectively address Section 5H of the
Uniform Guidelines that requires pass/fail cutoffs to be ―. . . set so as to be reasonable and
consistent with the normal expectations of acceptable proficiency in the workforce.‖
The modified Angoff process involves two steps. The first step is to have a panel of
SMEs determine the Critical Score, which is the average of their Angoff ratings for all of
the items included on the test. The second step is to reduce the Critical Score using one, two,
or three CSEMs (to account for the measurement error of the test), which provides three
cutoff score options for the test. The following steps can be completed to generate the three
cutoff score options.
After loading and analyzing the test item data, the three cutoff options can be
calculated by clicking on either the ―Test Analysis‖ or ―Cutoff Analysis‖ buttons. Doing so
reveals the following CSEM Specification program menu:
This Program computes the CSEMs (using the Mollenkopf-Feldt procedure described in
Attachment B) that are used for adjusting the Critical Score set by SMEs. To run this
Program, complete the fields using the guidelines below:
1. Enter Max Score: This field will automatically populate using the number of test
items detected in the Item Data Input Sheet.
2. Polynomial Power: This option allows the user to choose either a second-order
equation (using the quadratic equation) or a third-order equation (using the cubic
Copyright © 2010 Biddle Consulting Group, Inc. 17
equation) for computing the smoothed CSEM. While a second-order equation
typically gathers the necessary information to provide an adequately smoothed
CSEM, we typically recommend leaving the default option (3) for this field.
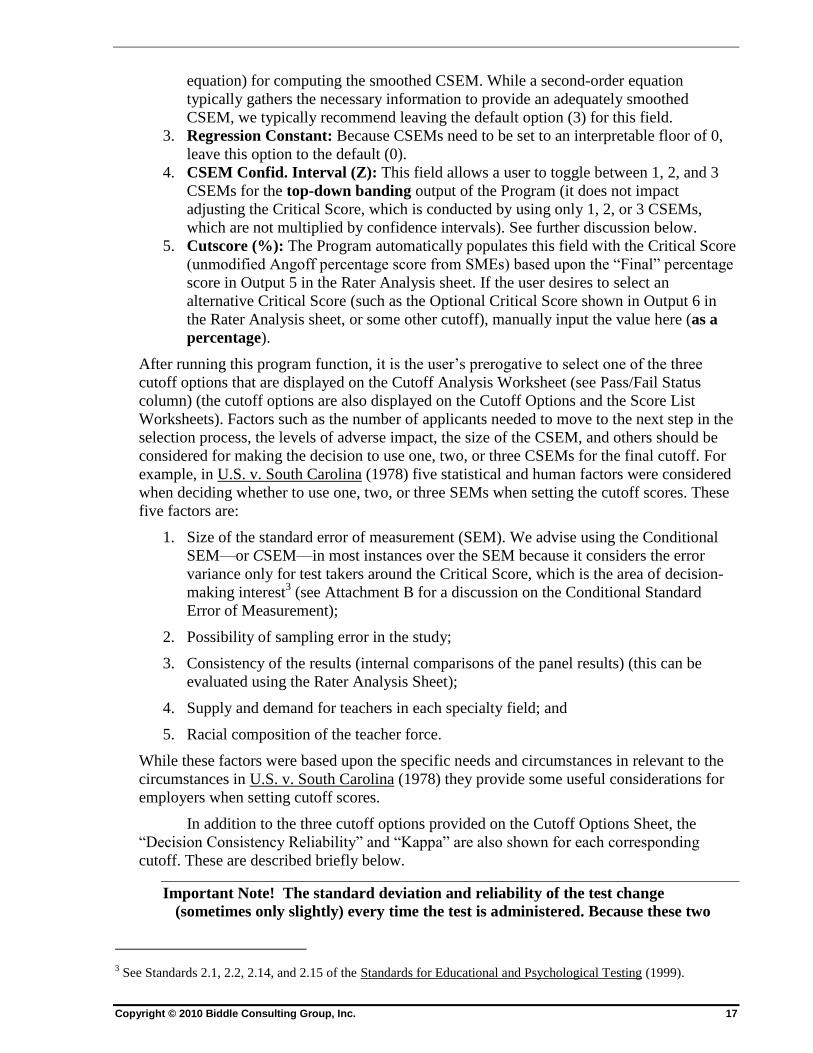
3. Regression Constant: Because CSEMs need to be set to an interpretable floor of 0,
leave this option to the default (0).
4. CSEM Confid. Interval (Z): This field allows a user to toggle between 1, 2, and 3
CSEMs for the top-down banding output of the Program (it does not impact
adjusting the Critical Score, which is conducted by using only 1, 2, or 3 CSEMs,
which are not multiplied by confidence intervals). See further discussion below.
5. Cutscore (%): The Program automatically populates this field with the Critical Score
(unmodified Angoff percentage score from SMEs) based upon the ―Final‖ percentage
score in Output 5 in the Rater Analysis sheet. If the user desires to select an
alternative Critical Score (such as the Optional Critical Score shown in Output 6 in
the Rater Analysis sheet, or some other cutoff), manually input the value here (as a
percentage).
After running this program function, it is the user‘s prerogative to select one of the three
cutoff options that are displayed on the Cutoff Analysis Worksheet (see Pass/Fail Status
column) (the cutoff options are also displayed on the Cutoff Options and the Score List
Worksheets). Factors such as the number of applicants needed to move to the next step in the
selection process, the levels of adverse impact, the size of the CSEM, and others should be
considered for making the decision to use one, two, or three CSEMs for the final cutoff. For
example, in U.S. v. South Carolina (1978) five statistical and human factors were considered
when deciding whether to use one, two, or three SEMs when setting the cutoff scores. These
five factors are:
1. Size of the standard error of measurement (SEM). We advise using the Conditional
SEM—or CSEM—in most instances over the SEM because it considers the error
variance only for test takers around the Critical Score, which is the area of decision-
making interest3 (see Attachment B for a discussion on the Conditional Standard
Error of Measurement);
2. Possibility of sampling error in the study;
3. Consistency of the results (internal comparisons of the panel results) (this can be
evaluated using the Rater Analysis Sheet);
4. Supply and demand for teachers in each specialty field; and
5. Racial composition of the teacher force.
While these factors were based upon the specific needs and circumstances in relevant to the
circumstances in U.S. v. South Carolina (1978) they provide some useful considerations for
employers when setting cutoff scores.
In addition to the three cutoff options provided on the Cutoff Options Sheet, the
―Decision Consistency Reliability‖ and ―Kappa‖ are also shown for each corresponding
cutoff. These are described briefly below.
Important Note! The standard deviation and reliability of the test change
(sometimes only slightly) every time the test is administered. Because these two
3 See Standards 2.1, 2.2, 2.14, and 2.15 of the Standards for Educational and Psychological Testing (1999).

Copyright © Biddle Consulting Group, Inc. 18
statistics are involved in the calculation of the SEM and CSEM, they will also
change each time the test is given. Research has shown, however, that the SEM is
likely to be relatively stable across applicant populations which differ in
variability (i.e., high or low test means or small or large standard deviations)
because the resulting changes in the reliability coefficient and standard deviation
partially offset each other (see Nunnally & Bernstein, 1994, p. 262). Therefore, if
cutoff scores need to be pre-announced prior to administering the test to
applicants, the SEM from a previous administration can be used to set a pre-
established cutoff (using one, two, or three SEMs).
Decision Consistency Reliability (DCR)
DCR is the appropriate type of reliability to consider when interpreting reliability and
cutoff score effectiveness for mastery-based tests. Mastery-based tests are tests used to
classify examinees as ―masters‖ or ―non-masters‖ or ―having enough competency‖ or ―not
having enough competency‖ with respect to the KSAPC set being measured by the test. See
Chapter 2 (pages 29-30) and Standard 14.15 of the Standards (1999).
DCR attempts to answer the following question regarding a mastery-level cutoff on a
test: If the test was hypothetically administered to the same group of examinees a second
time, how consistently would the test pass the examinees (i.e., classify them as ―masters‖)
who passed the first administration again on a second administration? Similarly, DCR
answers: ―How consistently would examinees who were classified by the test as ‗non-
masters‘ (failing) fail the test the second time?‖ This type of reliability is different than
internal consistency reliability (e.g., Cronbach‘s Alpha and KR-21), which considers the
consistency of the test internally, without respect to the consistency with which the test‘s
cutoff classifies examinees as masters and non-masters.
Important Note! Because DCR is a different type of reliability estimation (which
estimates the overall test’s ability to classify test takers) it cannot be used in the
classical SEM formula (SEM = 2/1)1( xxx r where x is the standard deviation
and rxx is the reliability of the test).
The Program outputs both estimated (using the procedure outlined in Subkoviak, 1988) and
calculated (using the procedure recommended in Peng & Subkoviak, 1980) values for this
reliability, along with interpretive guidelines derived from Subkoviak (1988). The calculated
values are typically more accurate than the estimated values.
Kappa Coefficients
―Kappa‖ coefficients are also provided in this Sheet, along with interpretive guidelines. A
Kappa coefficient explains how consistently the test classifies ―masters‖ and ―non-masters‖
beyond what could be expected by chance. This is essentially a measure of utility for the test.
Kappa coefficients exceeding .31 indicate adequate levels of effectiveness and levels of .42
and higher are good.
Top-Down Banding
Top-down bands are displayed in a column in the Cutoff Analysis Sheet in the section
labeled, ―Conditional Standard Error of Measurement.‖

Copyright © 2010 Biddle Consulting Group, Inc. 19
Using top-down bands for hiring applicants in groups is useful in situations where the
employer cannot feasibly process all applicants who pass the chosen cutoff score.4 TVAP sets
top-down bands by establishing score bands using the process described in Attachment B. While
the entire score list is banded by the Program, the banding process should stop at where the
minimum cutoff has been set (even if the cutoff score stops in the middle of a band).
While using this option may be effective for obtaining a smaller group of applicants who
pass the cutoff score and are substantially equally qualified, a second option is strict rank
ordering (i.e., hiring the applicants top-down in strict score order). Strict rank ordering is not
typically advised on written tests for three reasons: (1) the reliability (and related C/SEM) of any
written test demonstrates that the precise score order of applicants is not highly stable (i.e.,
applicants would likely change order if the same test was re-administered), (2) the actual
qualification levels of closely-scoring applicants is insignificant (compared to applicants who are
grouped using a broader score band), and (3) strict ranking will almost always exhibit higher
levels of adverse impact than other techniques, and is typically very difficult to defend in
litigation settings.
At a minimum, be careful to insure that at least the following three criteria are met if
ranking will be used:
1. The test should measure KSAPCs that are performance differentiating. Performance
differentiating KSAPCs distinguish between acceptable and above-acceptable
performance on the job. A strict rank ordering process should not be used on a test that
measures KSAPCs that are only needed at minimum, baseline levels on the job and do
not distinguish between acceptable and above-acceptable job performance. See Questions
& Answers #62 and Section 14C(9) of the Uniform Guidelines;
2. The reliability of the test should be sufficiently high (tests with low levels of reliability
do not adequately distinguish between test scores at a level that justifies making selection
decisions based on very small score differences). We recommend using a reliability
coefficient of .85 as a minimum threshold; and
3. The test results should show an adequate dispersion of scores (i.e., score variance as
represented by the standard deviation or standard error of measurement) within the range
of interest (i.e., the range where the selection decisions are being made). One way to
evaluate the dispersion of scores is to use the CSEM values provided by this Program.
Using the CSEM, the employer can evaluate whether the score dispersion is adequate
within the relevant range of scores when compared to other parts of the score distribution.
For example, if the CSEM is very small (e.g., 2.0) in the range of scores where the strict
rank ordering will occur (e.g., 95-100), but is very broad throughout the other parts of the
score distribution (e.g., double or triple the size), the score dispersion in the relevant
range of interest (e.g., 95-100) may not be sufficiently high to justify this criteria.
With these options provided, it is recommended that employers use the pass/fail cutoff options
provided by this Program as much as possible, and use other valid devices (such as structured
interviews) for banding or strict rank ordering applicants.
4 While the Guidelines are clear that this is a justifiable process, the degree of adverse impact should also be
considered (see Section 5H of the Guidelines).

Copyright © Biddle Consulting Group, Inc. 20
Step 8: Cutoff Results by Gender/Ethnicity & Adverse Impact Analyses
This Output provides the results of the three cutoff options (A, B, and C) for each group.
In addition to the number passing and passing rate percentage for each group, adverse impact
analyses are also provided, including the results of the 80% Test and Statistical Significance
Tests. These are described below.
80% Test
The 80% Test is an analysis that compares the passing rate of one group to the passing
rate of another group (e.g., Men vs. Women). An 80% test ―violation‖ would occur if one
group‘s passing rate is less than 80% of the group with the highest rate. For example, if the male
pass rate on a test was 90% and the female pass rate was 70% (77.7% of the male pass rate), an
80% Test violation would occur. The 80% Test is described by the Uniform Guidelines as:
―. . . a ‗rule of thumb‘ as a practical means for determining adverse impact for use in
enforcement proceedings . . . It is not a legal definition of discrimination, rather it is a
practical device to keep the attention of enforcement agencies on serious discrepancies in
hire or promotion rates or other employment decisions.‖ (Uniform Guidelines Overview,
Section ii).
―. . . a selection rate for any race, sex, or ethnic group which is less than four-fifths (4/5)
(or eighty percent) of the rate for the group with the highest rate will generally be
regarded by the Federal enforcement agencies as evidence of adverse impact, while a
greater than four-fifths rate will generally not be regarded by Federal enforcement
agencies as evidence of adverse impact. Smaller differences in selection rate may
nevertheless constitute adverse impact, where they are significant in both statistical and
practical terms . . .‖ (Uniform Guidelines, Section 4D).
The 80% Test has been scrutinized in Title VII litigation because it is greatly impacted by small
numbers and does not consider the ―statistical significance‖ of the passing rate disparity between
the two groups (see, for example, Bouman v. Block, 940 F.2d 1211, C.A.9 [Cal., 1991]; and
Clady v. County of Los Angeles, 770 F.2d 1421, 1428 [9th Cir., 1985]). More typically, courts
consider the statistical significance of the passing rate disparity between groups:
―Rather than using the 80 percent rule as a touchstone, we look more generally to
whether the statistical disparity is ‗substantial‘ or ‗significant‘ in a given case.‖ (Bouman
v. Block (citing Contreras, 656 F.2d at 1274-75).
―There is no consensus on a threshold mathematical showing of variance to constitute
substantial disproportionate impact. Some courts have looked to Castaneda v. Partida,
430 U.S. 482, 496-97 n. 17, 97 S.Ct. 1272, 1281-82 n. 17 n. 17, 51 L.Ed.2d 498 (1977),
which found adverse impact where the selection rate for the protected group was ‗greater
than two or three standard deviations‘ from the selection rate of their counterparts. See,
e.g., Rivera, 665 F.2d at 536-37 n. 7; Guardians Association of the New York City Police
Dept. v. Civil Service Commission, 630 F.2d 79, 88 (2d Cir. 1980), cert. denied, 452
U.S. 940, 101 S.Ct. 3083, 69 L.Ed.2d 954 (1981)‖ (emphasis added). Clady v. Los
Angeles County, 770 F.2d 1421, C.A.9 (Cal., 1985).
Note above the adoption of the ―greater than two or three standard deviation‖ rule. While the
courts have ruled that statistical significance occurs when the standard deviation representing the
difference in passing rates is ―two or three standard deviations . . .‖ the actual threshold
statistically speaking is 1.96 (which equates to a 5% significance level).

Copyright © 2010 Biddle Consulting Group, Inc. 21
Statistical Significance Tests
The statistical significance test conducted by the program is a two-tail Fisher Exact Test
probability statistic for 2 X 2 contingency tables.5 Any values that are less than .05 are
statistically significant and indicate a difference in passing rates between two groups that is not
likely occurring by chance.
Charts
The Program provides two charts to evaluate each group‘s passing rate:
The Passing Percentage of Each Group By Cutoff Score chart displays the total
percentage of each group that passes the test at each of the three cutoff choices (A, B, or C). So,
if there was a total of 100 Hispanics who took the test and 10, 15, and 20 Hispanics passed
cutoffs A, B, and C respectively, the chart would show 10%, 15%, and 20%. So, this chart shows
the passing rate of each group compared to the total test takers in each group.
The chart Passing Rates Compared to Men or Whites displays the percentage of each
group passing when compared to the men (for the women bar) and when compared to whites (for
each of the ethnic groups). For example, if 60% of all of the men passed Cutoff A and 40% of
the women passed, 66.6% would show for Cutoff A in the chart (40% / 60% = 66.6%).
5 The widely-endorsed Lancaster (1961) correction has been included as a sensible compromise that mitigates the
effects of conservatism of exact methods while continuing to use the exact probabilities from the small-sample
distribution being analyzed.

Copyright © Biddle Consulting Group, Inc. 22
Glossary
Adverse Impact—A substantially different rate of selection in hiring, promotion, or other
employment decision that works to the disadvantage of members of a race, sex, or ethnic group.
Angoff Ratings—Ratings that are provided by SMEs on the percentage of minimally qualified
applicants they expect to answer the test item correctly. These ratings are averaged into a score
called the ―unmodified Angoff score‖ (also referred to as a ―Critical Score‖).
Critical Score—The score level of the test that was set by averaging the Angoff ratings that are
provided by SMEs on the percentage of minimally qualified applicants they expect to answer the
test items correctly.
Cutoff Score—The final pass/fail score set for the test (set by reducing the Critical Score by 1,
2, or 3 CSEMs).
CSEM—Conditional Standard Error of Measurement. The SEM at a particular score level in the
score distribution (see SEM definition below).
DCR—Decision Consistency Reliability. A type of test reliability that estimates how
consistently the test classifies ―masters‖ and ―non-masters‖ or those who pass the test versus fail.
DIF—Differential Item Functioning. A statistical analysis that identifies test items where a focal
group (usually a minority group or women) scores lower than the majority group (usually whites
or men), after matching the two groups on overall test score. DIF items are therefore potentially
bias or unfair.
ETS—A person‘s true score is defined as the expected number-correct score over an infinite
number of independent administrations of the test
Item Difficulty Values—The percentage of all test takers who answered the item correctly.
Job Analysis—A document created by surveying SMEs that includes job duties (with relevant
ratings such as frequency, importance, and performance differentiating), KSAPCs (with ratings
such as frequency, importance, performance differentiating, and duty linkages), and other
relevant information about the job (such as supervisory characteristics, licensing and certification
requirements, etc.).
Job Duties—Statements of ―tasks‖ or ―work behaviors‖ that describe discreet aspects of work
performance. Job duties typically start with an action word (e.g., drive, collate, complete,
analyze, etc.) and include relevant ―work products‖ or outcomes.
KSAPCs—Knowledges, skills, abilities, and personal characteristics. Job knowledges refer to
bodies of information applied directly to the performance of a work function; skills refer to an
observable competence to perform a learned psychomotor act (e.g., keyboarding is a skill
because it can be observed and requires a learned process to perform); abilities refer to a present
competence to perform an observable behavior or a behavior which results in an observable
product (see the Uniform Guidelines, Definitions). Personal characteristics typically refer to
traits or characteristics that may be more abstract in nature, but include ―operational definitions‖
that specifically tie them into observable aspects of the job. For example, dependability is a
personal characteristic (not a knowledge, skill, or ability), but can be included in a job analysis if

Copyright © 2010 Biddle Consulting Group, Inc. 23
it is defined in terms of observable aspects of job behavior. For example: ―Dependability
sufficient to show up for work on time, complete tasks in a timely manner, notify supervisory
staff is delays are expected, and regularly complete critical work functions.‖
Outlier—A statistical term used to define a rating, score, or some other measure that is outside
the normal range of other similar ratings or scores. Several techniques are available for
identifying outliers.
Point Biserial—A statistical correlation between a test item (in the form of a 0 for incorrect and
1 for correct) and the overall test score (in raw points). Items with negative point biserials are
inversely related to higher test scores, which indicates that they are negatively impacting test
reliability; positive point biserials are contributing to test reliability in various levels.
Reliability—The consistency of the test as a whole. Tests that have high reliability are consistent
internally because the items are measuring a similar trait in a way that holds together between
items. Tests that have low reliability include items that are pulling away statistically from other
items either because they are poor items for the trait of interest, or they are good items that are
measuring a different trait.
SEM—Standard Error of Measurement. A statistic that represents the likely range of a test
taker‘s ―true score‖ (or speculated ―real ability level‖) from any given score. For example, if the
test‘s SEM is 3 and an applicant obtained a raw score of 60, his or her true score (with 68%
likelihood) is between 57 and 63, between 54 and 66 (with 95% likelihood), and between 51 and
69 (with 99% likelihood). Because test takers have ―good days‖ and ―bad days‖ when taking
tests, this statistic is useful for adjusting the test cutoff to account for such differences that may
be unrelated to a test taker‘s actual ability level.
SME—Subject-matter expert. A job incumbent who has been selected for providing input on the
job analysis or test validation process. SMEs should have at least one-year on-the-job experience
and not be on probationary or ―light/modified duty‖ status. Supervisors and trainers can also
serve as SMEs, provided that they know how to perform the target job.

Copyright © Biddle Consulting Group, Inc. 24
References
American Educational Research Association, the American Psychological Association,
and the National Council on Measurement in Education (1999). Standards for educational and
psychological testing. Washington DC: American Educational Research Association.
Angoff, W.H. (1971). Scales, norms, and equivalent scores. In Thorndike, R.L.,
Educational Measurement, pp. 508-600. Washington, DC: American Council on Education.
Biddle, D. (2006). Adverse impact and test validation: A practitioner’s guide to valid and
defensible employment testing (2nd
ed). Burlington, VT: Gower.
Contreras v. City of Los Angeles, 656 F.2d 1267 (9th Cir. 1981).
Dorans, N.J. & Holland, P.W. DIF detection and description: Mantel Haenszel and
standardization. In Holland P.W, Wainer, H. (Eds.). Differential Item Functioning. Hillsdale, NJ:
Lawrence Erlbaum Associates; 1993, 35-66.
Lancaster (1961). Significance tests in discrete distributions. Journal of the American
Statistical Association, 56, 223-234.
Nunnally, J.C. & Bernstein, I.R. (1994). Psychometric theory (3rd
ed.). New York:
McGraw Hill.
Peng, C.J. & Subkoviak, M. (1980). A note on Huynh‘s normal approximation procedure
for estimating criterion-referenced reliability. Journal of Educational Measurement, 17 (4), 359-
368.
SIOP (Society for Industrial and Organizational Psychology, Inc.) (1987, 2003),
Principles for the Validation and Use of Personnel Selection Procedures (3rd and 4th eds).
College Park, MD: SIOP.
Subkoviak, M. (1988). A practitioner‘s guide to computation and interpretation of
reliability indices for mastery tests. Journal of Educational Measurement, 25 (1), 47-55.
Tabachnick, B. G., & Fidell, L. S. (1996). Using multivariate statistics (3rd ed.). New
York: Harper Collins.

Copyright © 2010 Biddle Consulting Group, Inc. 25
Thorndike, R. L. (1951). Reliability. In E. F. Lindquist (Ed.). Educational measurement
(pp. 560-620). Washington DC: American Council on Education.
U.S. Department of Labor: employment and training administration (2000). Testing and
assessment: an employer‘s guide to good practices.
U.S. v. South Carolina, 434 US 1026 (1978).
Zieky, M. (1993). Practical questions in the use of DIF statistics in item development. In
P. W. Holland & H. Wainer (Eds.), Differential item functioning (pp. 337–364). Hillsdale, NJ:
Lawrence Erlbaum.


27
Attachment A - Instructions for
Completing the Test Item Survey
Introduction
This document provides instructions on how to use the Test Item Survey. To access and
print the Test Item Survey, go to the Test Item Survey Sheet in the Test Validation Workbook.
Based on the specific needs of the employer, survey questions 1-5 on the Test Item Survey may
be answered by qualified SMEs or by qualified test development personnel, based upon their
level of familiarity with the relevant position for which the test is being developed.
Administering the Test Item Survey
The following steps are recommended for administering the Test Item Survey:
1. Convene between 4 and 12 qualified SMEs with a gender and race/ethnic balance. The
SMEs selected for the panel should consist mostly of incumbents for the target position,
along with a limited representation of supervisors (perhaps 1 for every 3-4 SMEs). The
SMEs selected for the panel should have at least one year of on-the-job experience and
not be on probationary or ―light/modified duty‖ status. We also recommend having SMEs
who are ―not too far removed‖ from the actual requirements of the target position
involved in the process. While there is no hard-and-fast guideline for the number of years
experience a SME should have for serving on a panel (other than the one year
recommendation), we find that SMEs with 1-5 years experience in the target position are
best.
2. Reproduce the Job Analysis and make a copy for each SME. Be sure that the Job
Analysis itemizes the various job duties and knowledge, skills, abilities, and personal
characteristics (KSAPCs) that are important or critical to the job.
3. Make a copy of the test and key for each SME and stamp all tests and keys with a
numbered control stamp (so that each SME is assigned a numbered test and key).
4. Explain the confidential nature of the workshop, the overall goals and outcomes, and ask
the SMEs to sign confidentiality agreements.
5. Explain the mechanics of a test item with the SME panel, including the item ―stem‖ (the
part of the item that asks the question), alternates (all choices including the key),
distractors (incorrect alternatives), and answer key. Also review any source linkage
documentation for the items (i.e., where the correct answers are located in a book or
manual).
6. Review each question on the Test Item Survey with the SME panel. After going through
(and reading) each question, go through one of the test items as a group, answering the
questions for the test item collectively and having discussion about each question as
necessary. This step should also include reviewing the Job Analysis and the job duty and

28
KSAPC6 numbering system. Be sure to insert only numbers when listing duties and
KSAPCs. Use the Instructions for Providing Ratings sections in this Manual to answer
any questions.
7. Provide the Test Item Comment Form to the SMEs and ask them to use this form to
record any ―No‖ ratings so their responses can be evaluated.
8. Facilitate a discussion with the SME panel to clarify and define the concept of a
―minimally qualified applicant‖ (for the relevant question on the Test Item Survey). The
definition should be limited to one who possesses the necessary, baseline levels of the
KSAPC measured by the test item to successfully perform the first day (before
training) on the job. It is sometimes useful to ask the SMEs to imagine 100 minimally
qualified applicants in the room (in the various states that an applicant can be) and ask,
―How many of the 100 do you believe will answer the item correctly?‖ Be sure to warn
the SMEs against providing ratings below a chance score (50% for true/false items; 25%
for a multiple choice item with four alternatives; 20% for an item with five). In addition,
SMEs should not assign ratings of 100%, because this assumes that every minimally
qualified applicant was having a ―perfect day‖ on the testing day, and allows no room for
error.
9. Allow the SMEs to continue rating the first five test items and then stop.
10. Select one of the first five test items as a ―group discussion‖ item. Ask each of the SMEs
to share their ratings for the item by going through the survey questions one at a time.
Allow the SMEs to debate over ratings—especially the Angoff rating. This will help
centralize the panel and reign in any extreme outliers before they rate the remaining
items. It is acceptable to stimulate the SMEs by discussing and contrasting their ratings,
however, the facilitator should not require or coerce the SME to make any changes. The
facilitator and the SMEs can prod, argue, discuss, and challenge any individual SME
rating during the items that are reviewed during group discussion. However, each SME
should be encouraged to ―cast their own vote‖ after discussion.
11. Allow the SMEs to continue completing the Survey for the remaining test items.
12. After all SMEs have rated all test items, go through the test one item at a time and solicit
feedback. If items are mis-keyed or can be improved by making minor changes, allow for
group discussion and make changes to the item. For any changes made, be sure to ask the
SMEs to record the same changes on their hard copy version of the test, and to re-rate any
questions on the Test Item Survey based on the changes to the item.
13. Input all ratings and have the data entry independently verified until perfect.
Instructions for Providing Ratings on Checklist (Questions 1-10)
Question 1
The item ―stem‖ is the part of the test item that asks the question and solicits response from
the test taker.
Part A asks if the item stem reads well. The test item should not be unnecessarily wordy or
complex. In addition, it should not oversimplify complex concepts.
A ―Yes‖ or ―No‖ response should be provided to this question.
6 For test items measuring only work behaviors (duties), only linkages between the test item and job duties are
necessary. For items measuring knowledges or abilities, it is helpful but not necessary to link to both.

29
Part B asks if sufficient information is provided within the item for the test taker to provide
an accurate response. The item should be ―complete‖ and contain all the relevant information
the test taker will need to provide an accurate response.
A ―Yes‖ or ―No‖ response should be provided to this question.
Question 2
This section asks five questions about the item‘s distractors. Distractors are the response
alternates that are incorrect and misleading.
Part A asks if the distractors are similar in difficulty. Although distractors will vary to the
extent that they are ―tempting,‖ the test taker should not be able to easily eliminate the
distractors.
A ―Yes‖ or ―No‖ response should be provided to this question.
Part B asks if the distractors are distinct. Distractors should not be too similar; each one
should represent a unique, plausible (but incorrect) response.
A ―Yes‖ or ―No‖ response should be provided to this question.
Part C asks if the distractors are incorrect, yet plausible. Each distractor should be
―tempting‖ to the test takers, but should be incorrect under any likely circumstance on the
job. If a distractor could possibly be correct under circumstances on the job that are likely to
occur, it is not an appropriate distractor.
A ―Yes‖ or ―No‖ response should be provided to this question.
Part D asks if the distractors are similar in length. It is acceptable for distractors to be
different lengths, but not excessively different. For example, it would not be acceptable for
one or more distractors to be one or two sentences in length if the key or other distractors are
just a few words in length.
A ―Yes‖ or ―No‖ response should be provided to this question.
Part E asks if the distractors are correctly matched to the stem. All distractors should
smoothly flow from the question stem. Each distractor should complete the sentence or
question posed by the stem.
A ―Yes‖ or ―No‖ response should be provided to this question.
Question 3
This question asks if the key is correct in all circumstances. The key should be clearly correct
under any likely circumstance of the job. If the key could possibly be incorrect under
circumstances on the job that are likely to occur, it is not an appropriate key.
A ―Yes‖ or ―No‖ response should be provided to this question.
Question 4
This question asks if the test item is free of providing clues to other items on the test.
Consider the item stem, distractors, and the key when providing this rating. It is not
uncommon to find test item keys that provide clues to other items, or eliminate the
plausibility of distractors on other test items.
A ―Yes‖ or ―No‖ response should be provided to this question.

30
Question 5
This question asks if the test item is free from unnecessary complexities. The difficulty of a
test item should be related only to the difficulty or complexity of the concept it is testing. An
item‘s difficulty should not be attributed to it being overly complex, tricky, or excessively
wordy.
A ―Yes‖ or ―No‖ response should be provided to this question.
Question 6
This question asks SMEs to provide an estimate on the percentage of minimally qualified
applicants they would expect to answer the item correct. If SMEs believe that the item is
extremely difficult and they would expect a low percentage of minimally qualified applicants
to answer it correctly, their rating should be low. If the test item is extremely easy and they
would expect most minimally qualified applicants to answer it correctly, their rating should
be high.
When considering what makes up a ―minimally-qualified applicant,‖ SMEs should consider
an applicant who has the minimum level of the knowledge, skill, or ability being tested by
the item that is needed to satisfactorily perform the essential duties of the position on the first
day of the job (before training). They should not consider ―above average‖ or ―above
satisfactory‖ performance—they should consider only applicants who have the minimum
levels needed to satisfactorily perform the essential duties of the position.
Ratings to this question should be:
51% - 99% for true/false items
26% - 99% for multiple-choice items with four alternatives
21% - 99% for multiple-choice items with five alternatives
Question 7
This question asks if the test item is fair to all groups of people. Are there any parts of the
question, key, or distractors that would be better understood by some groups than others? For
example, a question testing for math ability that uses football examples may be unfairly
biased toward men.
A ―Yes‖ or ―No‖ response should be provided to this question.
Question 8
This question requires SMEs to identify the job duty(s) that is represented by the test
question. Using the Job Analysis, write the number(s) of the job duty(s) that is related to the
item.
Question 9
This question requires SMEs to identify the knowledge, skill, ability, and/or personal
characteristic (KSAPC) that is measured by the test item. Using the Job Analysis, SMEs
should write the number(s) of the KSAPC that is being measured by the item.
Question 10
This question asks if the knowledge being measured by the item is necessary the first day on
the job. Some KSAPCs are only acquired through training or experience gained while on the
job, while others are not acquired through job training or experience, but are expected to be
possessed by candidates on the first day of hire.

31
A ―Yes‖ or ―No‖ response should be provided to this question.
Instructions for Rating Job Knowledge Tests (Questions 11-14)
Question 11
This question asks whether the test item is based on current information. The knowledge
being measured by this test item should be linked to current, job-relevant information.
A ―Yes‖ or ―No‖ response should be provided to this question.
Question 12
This question asks how important it is that the knowledge being tested be memorized.
If it is not necessary that the knowledge area(s) measured by this item is memorized and it
can be looked up without impacting job performance, a ―0‖ should be recorded.
If it is important that the knowledge area(s) measured by this question is memorized and
having to look it up is likely to have a negative impact on the job, a ―1‖ should be recorded.
If it is essential that the knowledge area(s) measured by this question is memorized and
having to look it up is most likely to have a negative impact on the job, a ―2‖ should be
recorded.
If the SMEs believe that having to look up the knowledge area(s) measured by the item is
halfway between ―likely‖ and ―most likely‖ to negatively impact job performance, ―1.5‖
should be recorded (or any range between 1.0 and 2.0). Any value between 0 and 2.0 may
also be used.
Question 13
This question asks about the level of difficulty of the item. Test items designed to measure
job knowledge should be written at a level of difficulty that is similar to how the job
knowledge will actually be applied on the job. For example, if the job requires a basic level
of knowledge about a particular knowledge domain, test items should not measure the area at
an ―advanced‖ or ―overly complex‖ level.
A ―Yes‖ or ―No‖ response should be provided to this question.
Question 14
This question asks about the seriousness of the consequences that are likely to occur if the
applicant does not possess the knowledge required to answer the item correctly.
If little or no consequences are likely to occur if the applicant does not possess the
knowledge required to answer the item correctly, a ―0‖ should be recorded.
If moderate consequences are likely to occur if the applicant does not possess the knowledge
required to answer the item correctly, a ―1‖ should be recorded.
If severe consequences are likely to occur if the applicant does not possess the knowledge
required to answer the item correctly, a ―2‖ should be recorded.
If SMEs believe that the consequences that are likely to occur if the applicant does not
possess the knowledge required to answer the question correctly are halfway between
―moderate‖ and ―severe,‖ ―1.5‖ should be recorded (or any range between 1.0 and 2.0). Any
value between 0 and 2.0 may also be used.

32
Test Item Comment Form
Instructions: Use this form to explain any ―No‖ ratings given to items when using the Test Item
Survey.
Name: _______________Test: _____________________ Date: _______________________
Survey Question #
Test Item # (from Survey) Explanation
_____________ _____________ ___________________________________________
_____________ _____________ ___________________________________________
_____________ _____________ ___________________________________________
_____________ _____________ ___________________________________________
_____________ _____________ ___________________________________________
_____________ _____________ ___________________________________________
_____________ _____________ ___________________________________________
_____________ _____________ ___________________________________________
_____________ _____________ ___________________________________________
_____________ _____________ ___________________________________________
_____________ _____________ ___________________________________________
_____________ _____________ ___________________________________________
_____________ _____________ ___________________________________________
_____________ _____________ ___________________________________________
_____________ _____________ ___________________________________________
_____________ _____________ ___________________________________________
_____________ _____________ ___________________________________________
_____________ _____________ ___________________________________________
_____________ _____________ ___________________________________________
_____________ _____________ ___________________________________________
_____________ _____________ ___________________________________________
_____________ _____________ ___________________________________________
_____________ _____________ ___________________________________________

33
Attachment B - The Conditional
Standard Error of Measurement
(CSEM)
The Standards (1999) require the consideration of the Conditional Standard Error of
Measurement (or ―CSEM‖)7 when setting cutoff scores (as opposed to the traditional Standard
Error of Measurement, or ―SEM‖). The traditional SEM represents the standard deviation of an
individual examinee‘s true score (the score that best represents the applicant‘s actual ability
level) around his or her obtained (or actual) score. The traditional SEM considers the entire range
of test scores when calculated. Because the traditional SEM considers the entire range of scores,
its accuracy and relevance is limited when evaluating the reliability and consistency of test
scores within a certain range of the score distribution.
Most test score distributions have scores bunched in the middle and spread out through
the low and high range of the distribution. Those examinees who score in the lowest range of the
distribution lower the overall test reliability (hence effecting the size of the SEM) by adding
chance variance by means of guessing and not possessing levels of the measured KSAPC that are
high enough to contribute to the true score variance of the test. High scorers can also lower the
overall reliability (and similarly effect the size of the SEM) by means of examinees possessing
exceedingly high level of the KSAPC being measured, which can also reduce the variance
included in the test score range. The chart below shows how the SEM is not constant throughout
a score distribution (regardless of which method is used to estimate the SEM).8
7 See pages 27, 29, 30 and Standard 2.2, 2.14, and 2.15 of the Standards (1999).
8 Chart derived from data provided in Lord (1984).

34
Because the SEM considers the average reliability of scores throughout the entire range
of scores, it is less precise when considering the scores of a particular section of the score
distribution. When tests are used for making personnel decisions, the entire score range is almost
never the central concern. Typically in personnel settings, only a certain range of scores are
considered (i.e., those scores at or near the Critical Score, or the scores that will be included in a
banding or ranking procedure).
The CSEM avoid the limitations of the SEM by considering only the range of scores of
interest (i.e., the CSEM associated with any given score). By interpreting the CSEM at the
Critical Score, the most accurate reliability estimate can be evaluated at the point in the
distribution that matters the most (at least when making pass/fail determinations).
For these reasons, the traditional SEM9 should not be used in practice unless the
researcher is confident that measurement error is consistent throughout the score range—a
circumstance that is rare indeed.10
Rather, the conditional SEM should be used because it
accurately reflects the variation of measurement precision throughout the range of scores.
More than a dozen various CSEM techniques have accumulated since the first mention of
the concept over 60 years ago.11
Some techniques are original; others are ―improved‖ techniques
that include minor adjustments to the original author‘s work. Some techniques are based on
―strong true score models,‖ which are tied to strong statistical and theoretical (i.e., parametric)
assumptions. Binomial error models and Item Response Theory (IRT) models for computing
CSEMs generally fall into this category. Other CSEM models are categorized as ―weak true
score models‖ and encompass the ―difference methods‖ that were used by the original CSEM
authors. Such methods are referred to as the ―difference‖ methods because they compute the
CSEM based on the variance between two split halves of the same test. These methods are
referred to as the ―weak‖ methods because they are not fundamentally tied to theoretical or
parametric distributional assumptions.
While the techniques for computing CSEMs are widely varied, they are fortunately rather
close in their outputs. For example, Qualls-Payne (1992) showed that the average CSEM
produced by the difference method (across 13 different score levels) produced CSEM values that
were very close to five other methods (including binomial and IRT methods). Further, a study
conducted by Feldt, Steffen, & Gupta (1985) shows that, while the difference methods are less
complicated than some other methods (i.e., those based on ANOVA, IRT, or binomial methods),
it is ―integrally related‖ and generally produces very similar results.
IRT-based CSEM methods typically require a large sample size for calibrating accurate
parameter estimates (e.g., Tsutakawa & Johnson, 1990, recommend a minimum sample size of
approximately 500 for accurate parameter estimates) and the use of sophisticated software (e.g.,
BILOG). Further, they can only be used for tests that meet certain psychometric assumptions
(e.g., uni-dimensionality). The binomial error methods are generally less computationally
intensive, and require only KR-21 reliability, the mean and standard deviation of test scores, and
9 SEM =
2/1)1( xxx r where x is the standard deviation and rxx is the reliability of the test.
10 The SEM is only constant in symmetrical, mesokurtic score distributions (see Mollenkopf, 1949).
11 Ten years prior to this ―discovery‖ made by Mollenkopf, Rulon (1939) showed that the SEM is equal to the
standard deviation of the differences between the two half-test scores (which could be calculated at any score
interval and thus resulting in the SEM at various levels). However, Rulon‘s emphasis was not placed on the
conditional nature of SEMs; the same was only a focus of the later work first conducted by Mollenkopf.

35
the number of items on the test. As ―strong‖ methods, both of these techniques are tied to
distributional assumptions.
The ―difference‖ method used in TVAP adopts the Mollenkopf-Feldt (M-F) method,
which uses polynomial regression to ―smooth‖ the CSEM values that are calculated using the
variance between scores on two split test halves. Specifically, the M-F CSEM method can be
executed by following the steps outlined in the section below.
After computing CSEMs, score bands can be created by centering confidence intervals
around classically computed Estimated True Scores (ETS), using the formula: ETS = ((X-M)* rxx
+ M (where X is the examinee‘s obtained score, M is the average test score of all examinees, and
rxx is the reliability of the test) and the desired Confidence Interval (e.g., 1.96 for 95% confidence
when considering 2 CSEMs). This personnel score banding approach used in TVAP is based on
the original M-F method and was modified for the personnel score banding (as originally defined
in Biddle et al., 2007) and will be outlined in further detail in a forthcoming work by Biddle &
Feldt (2010).
As a ―weak‖ model, it is not tied to assumptions inherent to other models (e.g., IRT or the
binomial methods). It has the added value of being tolerant of various item types (e.g., binary or
polytomous items) and having sample size requirements similar to those of most multiple
regression situations. One of the additional advantages of the M-F method is that it is based on
the actual item responses and characteristics of each data set (binomial models can be computed
without item-level data because they are based on the binomial probability distribution). The
method allows data from each test administration to form varying CSEM values at each score
interval. Some of our research has shown that the M-F method is highly correlated (r = .88) to
the CSEM models based on binomial methods.
The implications of using CSEMs are wide and substantial for the HR professional.
Classical SEMs are widely used by HR professionals in two ways—both of which have
substantial impact on countless applicants that are ranked on various score lists: (1) score
banding, and (2) adjusting Critical Scores to derive Cutoff Scores.
Test score banding is commonly practiced by I-O professionals as a way of preserving
utility (over just using cutoffs) while minimizing adverse impact (over top-down ranking).
Banding procedures typically use the Standard Error of Difference (or ―SED,‖ which is
calculated by multiplying the SEM by the square root of 2), along with a confidence interval
multiplier (e.g., 95% using a 1.96 multiplier) to categorize groups of ―substantially equally
qualified‖ applicants. The conditional nature of the SEMs, however, demands the use of CSEMs
when creating bands rather than using this traditional method.
Adjusting minimum competency cutoffs (i.e., Critical Scores), as in the case of the
modified Angoff technique, is another area where CSEMs are commonly applied. In this
situation, the Critical Score for the test is lowered using 1, 2, or 3 CSEMs (also centered on the
ETS associated with the Critical Score—see MacCann, 2008) to account for measurement error
in the test (and thereby giving the ―benefit of the doubt‖ to the applicant). Most CSEM
techniques typically produce smaller values than classical SEM calculations in the upper range
of the score distribution, which translates to smaller groups of applicants being categorized
because of the added precision of the conditional measurement precision (compared to the
classical SEM, which simply averages measurement error across the entire score range).

36
Steps for Developing Personnel Score Bands Using the M-F Procedure Centered on ETS2
The steps below provide a systematic process (and the same process used in TVAP) for
computing M-F CSEMs and subsequent score bands.
Step 1. Divide the test into two halves that are approximately equal in difficulty and
variance, and have the same number of items. Because the M-F method is a ―difference‖ CSEM
method, it is important that the test halves are balanced by having the same number of items
contributing variance to the equation. If the test has an odd number of items, one of the items can
be removed from the test. It is also important that all of the items on the test have the same point
values, as the M-F method cannot be used on a test that includes mixed binary and polytomous
(multi-point) items. Fortunately, the method can be used for tests with polytomous items,
however, all items on the test need to be the same type (i.e., either binary or polytomous).
In addition to have the same number and type of items, the two test halves should be
psychometrically parallel. While a number of sophisticated techniques are available for
assembling and evaluating the comparability between tests (referred to as tau equivalency—see
Haertel, 2006), we encourage at least some minimal uniform procedure is developed and
followed. In many cases, simply dividing the test using an even/odd split (with the same number
of items on each half) will do the job. However, if such a split results in two test halves that have
substantially different means or standard deviations, we recommend using a more intensive
splitting method.
Because the M-F CSEM approach already takes the mean difference between test halves
into account (by subtracting them out of the equation), the SD of each test should receive
attention. With this in mind, we suggest the following steps be taken to insure the test haves are
parallel:
1. Calculate the Item Difficulty Value for each item (i.e., the average passing rate for each
item).
2. Sort the items by Item Difficulty Value.
3. Split the test items (using odd/even) into two forms with the same number of items (if the
test has an odd number of items, remove one). The two forms should have fairly
equivalent means, which is one component of establishing parallel forms.
4. Compute the SD for each test half.
5. Use a pre-specified criteria/threshold for the difference between both forms. If the
difference exceeds a criteria/threshold, then swap items from hardest to easiest until they
are within the threshold.12
Step 2. Calculate an ―adjusted difference score‖ for each applicant by subtracting their score on
test half 1 from their score on test half 2 and the mean from test half 1 from the mean from test
half 2, noted as: Y = 22121 )()( XXXX where X1 and X2 are the two test halves and 1X
and 2X are the means for each test half. This process results in calculating an ―adjusted
difference score‖ for each applicant that will be used as a dependant variable, Y in the subsequent
regression equation.
12
These steps are automated in TVAP. Such a complicated process is not necessary; however, some steps should be
taken to ensure the forms are approximately similar.

37
For example, for a test with two halves that have means of 26.28 and 26.45 respectively
and a first examinee who scored 60 on the test, 28 on half 1 and 32 on test half 2, the formula
would be displayed as: Y = 226.45)-(26.28-32)-(28 which computes to a value of 14.67. This
calculation is repeated for each examinee in the data set to create Y values that will be used as
the dependent variable in the multiple regression analysis, described next.
Step 3. Conduct a multiple regression analysis using the dependent variable Y from the
step above and the total test score (X1), total test score squared (X
2), and total test score cubed
(X3) as the independent variables. Set the constant in the regression to 0 because this is the
theoretical floor of CSEM values.
Step 4. Use the resulting three beta coefficients to compute CSEM values for each score
in the distribution using the formula: )*()*()*( 3
3
2
2
1
1 XXX . For example, to
calculate the CSEM for the raw score of 70, the three predictors 80 (X1), 640 (X2), and 512000
(X3) are multiplied with their three corresponding beta coefficients 1 (1.5597) 2 (-0.01914)
and 3 (0.000006) as demonstrated here
)000006.0*343000()01914.0*490()5597.1*70( . This results in a CSEM of 2.667 for
the score of 70.
By way of technical thoroughness, a clarification should be made at this point. The
dependent variable, Y, must be defined as the square of the difference score—not the square root
of it. Thus, Y = 22121 )()( XXXX . This squared quantity for an examinee is not equal to
Y2. In effect, the regression analysis must be carried out as a process of developing smoother
estimates of the conditional error variance. Only after the curve is fitted to the data for
smoothing the variances are the square roots of the predicted Y values taken to obtain the CSEM
for various score values. At first blush, this may seem identical to defining the squared deviation
as Y2. It is not. The square root of the average of a set of values is not equal to the average of the
square roots of the values. This can be illustrated as follows:
2/)14425( = 9.19 vs. (5 + 12)/2 = 8.50.
When the values are closer together, the difference is not so great. Consider these values:
2/)169( = 3.53 vs. (3 + 4)/2 = 3.50.
The CSEM must be taken as the square root of the mean of the predicted Y, as defined above.
The process cannot be abbreviated by defining Y as the positive square root of the squared
deviation and then smoothing these predicted Y values.
Step 5. Multiply each CSEM by the desired Confidence Interval (e.g., 1.96 for 95%
confidence intervals). This creates the width of the bands to be used in Step 7.
Step 6. Calculate Estimated True Scores (ETS) for each score in the distribution, using
the formula: ETS = ((X-M)* rxx + M) where X is the score, M is the average test score of all
examinees, and rxx is the reliability of the test. This will result in fraction scores for each
observed score, which is fine because these are estimations of true scores.
Step 7. Create score bands by centering confidence intervals around the ETS values so
that the lower boundary and upper boundary of the bands do not overlap. See Table 1 for an
example.

38
Table 1. Score Bands Using the M-F CSEM Method
Obs. Score ETS
M-F
CSEM
95% Lower
Conf. Int.
95% Upper
Conf. Int.
CSEM
Band
Classic
Band
80 77.68 0.00 77.68 77.68 1 1
79 76.77 0.77 75.26 78.28 1 1
78 75.85 1.17 73.57 78.14 1 1
77 74.94 1.46 72.08 77.80 1 1
76 74.02 1.69 70.70 77.35 1 1
75 73.11 1.90 69.39 76.83 1 1
74 72.19 2.08 68.11 76.28 1 1
73 71.28 2.25 66.87 75.68 1 1
72 70.36 2.40 65.66 75.06 2 1
71 69.45 2.54 64.48 74.42 2 1
70 68.53 2.67 63.31 73.76 2 1
69 67.62 2.79 62.15 73.08 2 2
68 66.70 2.90 61.02 72.39 2 2
67 65.79 3.01 59.89 71.69 2 2
66 64.87 3.11 58.78 70.97 2 2
65 63.96 3.20 57.68 70.24 2 2
64 63.04 3.29 56.59 69.50 2 2
63 62.13 3.38 55.50 68.75 2 2
62 61.21 3.46 54.43 68.00 2 2
61 60.30 3.54 53.36 67.23 2 2
60 59.38 3.61 52.31 66.46 2 2
59 58.47 3.68 51.26 65.68 2 2
58 57.55 3.74 50.21 64.89 3 3
Table 1 demonstrates that creating bands is a bi-directional process. Because CSEMs vary in
size (typically being smaller towards the upper end of the distribution and largest near the mean)
and the ETS adjustment centers the CSEM bands slightly below each observed score at the
higher range, the upper and lower confidence intervals of each CSEM need to be simultaneously
evaluated to determine where they touch. For example, Bands 1 and 2 divide at the score of 72
because the upper confidence interval limit at the CSEM at 72 (2.40 *1.96 = 4.70 plus 70.36 [the
ETS at the observed score of 72] is 75.06, which touches the lower confidence interval of the
highest possible score with a non-zero CSEM [79]).
Classic bands are also displayed in Table 1 for comparative purposes. Using the
conventional SED formula (SEM * 2 ) based on the reliability of the test (0.9151) and SD
(12.76) the SED 10.31 can be calculated and centered on observed scores. This process produces
39
wider bands in general, particularly in the upper part of the distribution, when compared to M-F
CSEM banding. In this dataset, the classic band procedure starts the second band 4 points lower
than the M-F CSEM method.
Given a sufficiently large sample size (starting generally at 100+ subjects), the process
described above should produce stable CSEMs and related score bands. However, in situations
where fewer than 100 subjects are involved, and particularly in situations with less than 50
subjects, the classical SEM should be used instead of the CSEM if the CSEM produces higher
overall values. This is because the regression-based estimates will tend to overestimate CSEMs
when smaller samples are involved. In addition, sometimes negative CSEM values will
occasionally occur with small datasets are analyzed. These values should be set to the theoretical
minimum value of 0.

40
References
Angoff, W.H. (1971). Scales, norms, and equivalent scores. In Thorndike RL,
Educational measurement, pp. 508-600. Washington, DC: American Council on Education.
Biddle, D. (2005). Adverse impact and test validation. Ashgate Publishing: Burlington,
VT.
Biddle, D., Kuang, D.C.Y., & Higgins, J. (2007, March). Test use: ranking, banding,
cutoffs, and weighting. Paper presented at the Personnel Testing Council of Northern California,
Sacramento.
Biddle, D. & Feldt, L. (2010). A new method for personnel score banding using the
conditional standard error of measurement. Unpublished manuscript.
Feldt, L. S., Steffen, M., & Gupta, N. C. (1985, December). A comparison of five
methods for estimating the standard error of measurement at specific score levels. Applied
Psychological Measurement, 9 (4), 351-361.
Haertel, E. H. (2006). Reliability. In R. L. Brennan (Ed.), Educational measurement (4th
ed., p. 83). Westport, CT: Praeger Publishers.
Lord, F. M. (1984). Standard errors of measurement at different ability levels. Journal of
Educational Measurement, 21 (3), 239-243.
MacCann, R. G. (2008, April). A modification to Angoff and bookmarking cut scores to
account for the imperfect reliability of test scores. Educational and Psychological Measurement,
68 (2), 197-214.
Mollenkopf, W. G. (1949), Variation of the standard error of measurement of scores.
Psychometrika, (l4) 3, 189-229.
Qualls-Payne, A. L. (1992). A comparison of score level estimates of the standard error
of measurement, Journal of Educational Measurement, 29 (3), 213–225.
Rulon, P. J. (1939). A simplified procedure for determining the reliability of a test by
split-halves. Harvard Educational Review, 9, 99-103.

41
Standards—American Educational Research Association, the American Psychological
Association, and the National Council on Measurement in Education (1999), Standards for
educational and psychological testing. Washington DC: American Educational Research
Association.
Thorndike, R. L. (1951). Reliability. In E. F. Lindquist (Ed.). Educational measurement
(pp. 560-620). Washington DC: American Council on Education.
Tsutakawa, R. K. & Johnson, J. C. (1990). The effect of uncertainty of item parameter
estimation on ability estimates. Psychometrika, 55, 371-390.

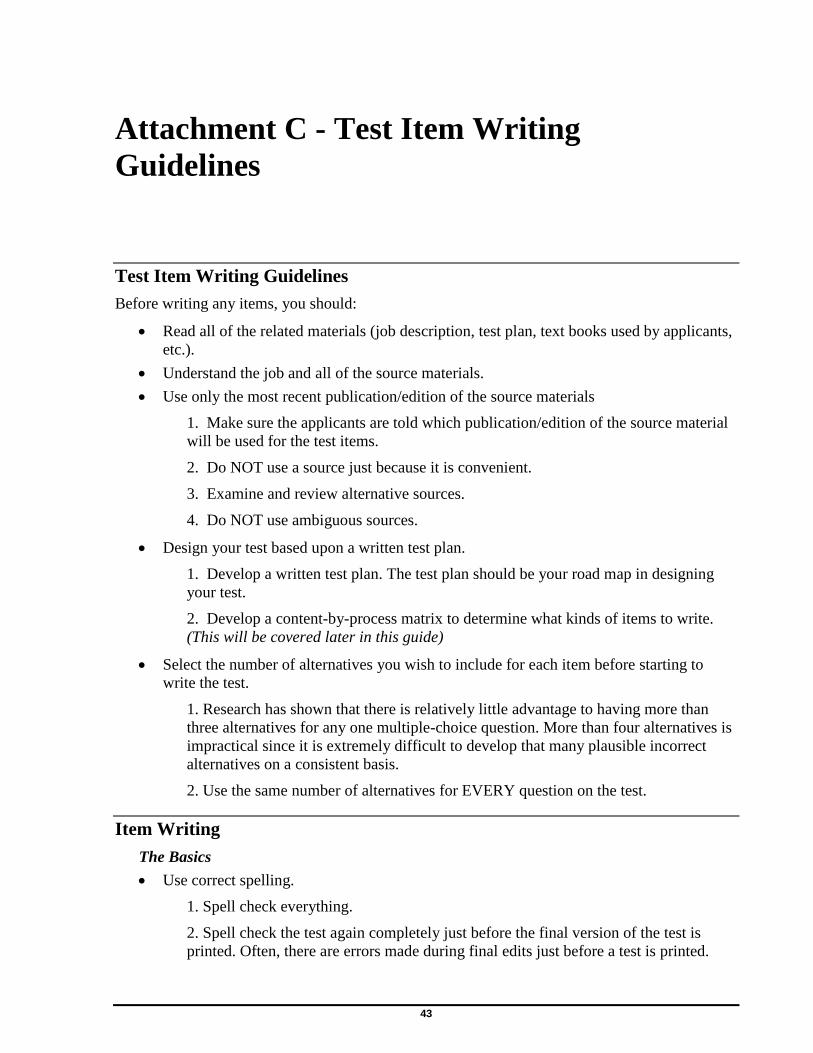
43
Attachment C - Test Item Writing
Guidelines
Test Item Writing Guidelines
Before writing any items, you should:
Read all of the related materials (job description, test plan, text books used by applicants,
etc.).
Understand the job and all of the source materials.
Use only the most recent publication/edition of the source materials
1. Make sure the applicants are told which publication/edition of the source material
will be used for the test items.
2. Do NOT use a source just because it is convenient.
3. Examine and review alternative sources.
4. Do NOT use ambiguous sources.
Design your test based upon a written test plan.
1. Develop a written test plan. The test plan should be your road map in designing
your test.
2. Develop a content-by-process matrix to determine what kinds of items to write.
(This will be covered later in this guide)
Select the number of alternatives you wish to include for each item before starting to
write the test.
1. Research has shown that there is relatively little advantage to having more than
three alternatives for any one multiple-choice question. More than four alternatives is
impractical since it is extremely difficult to develop that many plausible incorrect
alternatives on a consistent basis.
2. Use the same number of alternatives for EVERY question on the test.
Item Writing
The Basics
Use correct spelling.
1. Spell check everything.
2. Spell check the test again completely just before the final version of the test is
printed. Often, there are errors made during final edits just before a test is printed.

44
3. Have another person (other than yourself) check over the completed test for
spelling errors. Do NOT rely solely on your computer word-processing program's
―spell check‖ function - it has serious limitations such as not catching the word
―form‖ being spelled as ―from.‖
Use correct grammar.
1. Do NOT rely on your computer‘s grammar checking function. Have your grammar
checked over by another person before releasing the test to be printed.
2. Use all punctuation correctly, including commas and hyphens.
3. Do NOT use contractions. For example, use ―do not‖ instead of ―don't.‖
4. Check your grammar at the later stages of test development. Do not allow any test
to be administered without checking for proper grammar and usage. Check the test
again completely just before the final version of the test is to be printed.
Avoid negatively worded items, if possible.
Constantly check for typographical errors.
Capitalize ALL limiting or directive words.
1. Capitalize the word NOT and other negative words.
2. Capitalize key limiting and directive words that are vital for choosing the correct
alternative such as REQUIRED, PROHIBITED, ALLOWED, ALL, MUST, etc.
Avoid using slang, ambiguous, and obsolete (or archaic) words.
Break up long sentences into shorter sentences.
1. Avoid run-on sentences that are difficult to follow.
2. Keep the verb and subject word close together to avoid ambiguity. For example, do
NOT say: ―In California, a person has committed the offense of simple battery, a
gross misdemeanor, if he/she has:‖
Make sure all alternatives are parallel and similar in form. For example, make sure they
are all the same tense.
Use acronyms correctly. If the source material uses an acronym to describe something,
the test-writer should use both the acronym and the full title. For example, the test should
read: ―The Central Intelligence Agency (CIA) is a part of the United States government.‖
Setting an item in an applied situation, when appropriate, can enhance the item.
The Stem of an Item
The part of a test item that leads up to (but does not include) the choice of answers is called the
stem of the item.
Use incomplete statements as stems whenever possible instead of fill-in-the-blanks. ―The
capital of Pennsylvania is‖ is preferred to ―__________ is the capital of Pennsylvania.‖
1. If using blanks, try to put the blank as close as possible to the end of the last
sentence in the stem.
2. Avoid using double alternatives. For example, you should not write an item that
states: ―The two longest rivers in the United States are __________ and
__________.‖

45
Include all qualifying information in the stem.
Avoid using or ―all of the above,‖ ―NONE of the above,‖ or ―all of the above… except‖
in the item stem.
Eliminate irrelevant words and ideas from the stem and alternatives. Be clear and
concise.
Use active voice rather than passive voice, if possible. Most computer word-processing
programs have a grammar-checking program that identifies passive voice, but not always
reliably or accurately.
When an incomplete statement is used as a stem, use ―a/an‖ if some of the alternatives in
that item begin with vowels and some begin with consonants.
State only one idea or central problem in each item
Include as much of the item in the stem as possible.
Use objective ideas that can be referenced to the source. Do not ask for personal
opinions.
Avoid using absolute terms such as ―always‖ and ―never.‖
Keep items as simple as possible. If the stem must be read more than once to be
understood, you should rewrite the stem.
The Alternatives of an Item
The choices for answers given to the test-taker are called alternatives. Incorrect alternatives are
called distracters. The correct choice is called the correct alternative.
Have only ONE correct alternative for each item.
1. Eliminate overlapping alternatives. For example, do NOT use the following:
a) 5 to 10 days.
b) 5 to 20 days.
c) 15 to 25 days.
2. Use only plausible distracters. Do not try to be funny or cute. If you become stuck,
work on another item and come back to the original item later on. Many item writers
think of effective distracters for previous items when working on other items.
Place periods at the end of each alternative when the item stem ends in an incomplete
statement. Do not place periods at the end of each alternative where the stem either
contained a blank or ended with a question mark.
Numbers.
1. Write out the numbers one to ten. Use the numeric form for numbers over ten (e.g.,
11, 12, 27, 53). However, if you have an item where the alternatives are both less than
ten and greater than ten, use the numeric form for ALL alternatives in that item.
2. Use ascending order for alternatives containing numbers. For example 1, 4, 8, 10;
or 25, 30, 35, 40.
3. Be consistent when using units of measurement. Do not mix and match units within
a single item. For example, if you use minutes in one alternative, use minutes for
ALL of the alternatives in that item.

46
4. Use exclusionary terms such as ―What is the MAXIMUM number of days‖ to
make numeric questions unambiguous.
Do not use both categories and sub-categories as your alternatives. If you do, then test-
takers who know only the headings of sections in the reference source will be able to
answer the item on this basis alone. For example, you would not want to use the
alternatives of ―vertebrate,‖ ―mammal,‖ and ―human‖ as choices in the same item.
Be as clear and concise as possible. Eliminate any possible misinterpretations.
1. Do NOT reword one of the other alternatives to create a new alternative.
2. Do NOT use synonyms of other alternatives as an alternative.
3. If you CANNOT come up with a sufficient number of distracters, then reword the
item or do not use it.
Each alternative should be independent. Avoid using ―all of the above,‖ ―none of the
above,‖ ―A and C,‖ or other such alternatives.
FOR LAW ENFORCEMENT TESTS ONLY: Avoid using lesser and included offenses
or duties as your alternatives. For example, simple assault is usually a lesser and included
offense of aggravated assault - therefore, do not use both as alternatives in the same item.
Do not make the correct alternative significantly different in form from the other
distracters.
1. Alternatives within the same item should be of similar length if possible.
2. Alternatives within the same item should be parallel (e.g., same tense, form,
structure, etc.).
3. All alternatives should be grammatically consistent with the stem.
4. Avoid using words that sound or look alike as alternatives.
General Rules
Do not allow the stem and alternatives of one item to help a test-taker answer any other
item in the test.
1. If possible, avoid using identical alternatives for different items. This may give the
test-taker a clue as to how to answer another item.
2. If you CANNOT avoid using identical alternatives for more than one item, put the
alternatives in the same order for both items.
Make certain the complete stem and all alternatives associated with that stem are on the
same page when the test is printed
Use gender-neutral and race/ethnic-neutral terms and pronouns in your items, unless this
information is vital to the item.
1. Use he/she, him/her, or his/hers whenever possible.
2. If the item has several actors try using gender-neutral names, such as Pat or Chris.
3. Use titles to eliminate gender. For example, ―officer‖ and ―supervisor‖ do not
denote any particular gender.
4. Be consistent. If you make Chris Johnson a female in one item, make sure Chris
Johnson is a female in all items.
47
Avoid abbreviations whenever possible.
1. Use only those abbreviations that are commonly used by the test-taker. If in doubt,
do not use the abbreviated version.
2. Use the time and date structure that is common to the agency or group for whom
you are writing. For example, many police and fire departments use military time
(e.g., 1800 hours instead of 6:00 p.m.) If in doubt, check with the agency for which
you are writing.
3. Do not mix words and abbreviations. For example, if you use the abbreviation ―ft‖
in one part of the item, do not use the word ―feet‖ in another.
Avoid negatively worded items.
Randomize the order of alternatives and location of the correct answer.
1. Be sure the final version of the test has a similar number of As, Bs, Cs, and Ds as
correct alternatives for a four-alternative test.
2. The pattern for the answers should be random. Make certain there is no discernible
pattern in the location of the correct answers on the test.
Other Considerations
Item Difficulty. Do NOT make the items either too easy/obvious or too difficult/trivial.
Make the level of item difficulty for the test appropriate to the job.
Job Related. Make sure the items are job related. Do not become immersed in the
reference source and forget the job analysis.
1. Does each item match something in the job content according to the job
description?
2. Does each item tap into a relevant aspect of the job? Just because information is in
a reference source does not automatically mean it should be tested. It is up to you, the
item writer, to determine what information is relevant.
3. Make sure each item is applicable to the agency or group you are testing. For
example, it would be inappropriate to ask items about railroad crossings if there are
no railroad tracks in the municipality for which you are testing.
Complexity.
1. Match the test items to the complexity of the job. If the job requires a high school
diploma, then maintain the appropriate vocabulary and reading level.
2. Check the reading level with a computerized word-processing program. List the
desired reading level in the test plan and the test reading level in the test development
guide.
Do not go outside of the reference source for the alternatives or rationale for
answering the alternatives. For example, do not use a recent Supreme Court decision to
justify your choice of a correct alternative if that Supreme Court decision is not
mentioned in the reference source.
Direct and indirect clue errors structure of the item. Avoid providing clues to the
correct answer in the stem.
1. Do not make distracters significantly different from the correct answer in form.

48
2. Make distracters equally plausible to the uninformed candidate
a) Avoid using distracters that are opposites of the correct answer.
b) Avoid using the same/similar words (or synonyms) in both the stem and the
correct alternative. This provides a clue to the correct answer.
c) Avoid using stereotyped phraseology or stating the correct alternative in
more detail than the distracters.
d) Avoid using absolute terms in distracters. Words such as ―all,‖ ―always,‖
―none,‖ ―never,‖ and ―only‖ are often associated with incorrect responses to
test questions.
e) Avoid creating a sub-set of alternatives that is all-inclusive. If two of the
alternatives cover all possibilities, then the other distracters are eliminated
from consideration as correct by the test-wise candidate.
f) Avoid writing two distracters with the same meaning. The test-wise
candidate can eliminate these alternatives if only one answer is to be selected.
One correct alternative for each item. Search for possible conflicts with other resource
materials or other sections of the reference material from which you are working. For
example, criminal codes and vehicle codes are notorious for having the same actions
constitute more than one offense. To illustrate, in one state the same car theft could be a
misdemeanor (according to the vehicle code) or a felony (according to the criminal code).
Process-by-content matrix. Three types of items should be included (see the ―Item
Examples‖ section for examples of each type):
1. Knowledge of terms/definitions
2. Knowledge of principles and concepts,
3. Application of principles and concepts.
Know when to admit defeat. Do NOT be afraid to throw out or set aside items that
CANNOT be saved. Sometimes there is just nothing you can do to save an item. It is
better to discard or set aside a bad item than to slip it into the test or to spend too much
time working on any one item.
Item Format When Developing Tests
Sample Item and Answer Documentation Example:
QUESTION: According to the CRIMINAL INVESTIGATION workbook, testimony given by
an accomplice or participant in a crime which tends to convict others is _________ evidence.
A. state
B. police
C. defense
D. dissent
Answer: A
(Source: Criminal Investigation workbook, 3rd Edition, p. 47. )

49
Note:
• Develop four (4) alternatives per item, lettered A, B, C, and D.
• Write the letter of the correct alternative at the end of the item.
• Write a source at the end of each item, describing the source and page
number or section (e.g., Merit System Manual, IX-3).
• Place the name of the source within the text of the item stem in capital
letters. (e.g., “According to the MERIT SYSTEM MANUAL....”)
• Avoid negative items.
• Capitalize limiting, directional, or negative words.
• Randomize the order of distracters and the correct alternative.
Examples of Test Items
I. If the stem is a question.....
What color are polar bears in the Artic?
A. Black
B. Yellow
C. White
D. Brown
......then
• The stem must be a grammatically complete sentence.
• Put a question mark at the end of the question.
• The question must be the last sentence in the stem.
• Capitalize the first letter of each alternative, even if it is not a proper noun.
• Do not put a period at the end of each alternative.
II. If the correct alternative completes the stem....
A person who burns his/her own car and reports it stolen in order to obtain the insurance money
is guilty of
A. insurance fraud.
B. theft.
C. arson for profit.
D. burglary.
.....then
• Use no punctuation at the end of the stem. Do not use a blank line or colon.
• The sentence leading to the alternatives should be the last sentence in the stem.
• Place a period at the end of each alternative.

50
• Capitalize the first letter of the alternative only if it is grammatically correct to do so.
III. If the alternative is embedded in the stem....
A robbery is an example of a __________ offense.
A. traffic
B. criminal
C. civil
D. zoning
....then
• Do not put a period or other punctuation at the end of these alternatives. If punctuation is
required, put it in the stem.
• Capitalize the first letter of the alternative only if it is grammatically correct to do so.
• Make all blanks ten spaces long, regardless of the length of the alternatives.
Examples of Item Types
I. Knowledge of Definitions/Terms
The proceeding whereby one party to an action may be informed as to the facts known to other
parties or witnesses is a
A. discovery.
B. garnishment.
C. indictment.
D. tort.
Note: This item taps the test-taker's knowledge of the definition of the
word/term “discovery.”
II. Knowledge of Principles and Concepts
The changing phases of the moon are caused by
A. the tilt of the earth's axis.
B. the rotation of the moon on its axis.
C. the tidal patterns of the earth‘s oceans.
D. the orbit of the moon around the earth.
Note: The concept/principle being tapped here is the understanding that the
cause of the changes in the phases of the moon is the orbit of the moon
around the earth. These type of items include those that tap the test-
taker's knowledge of facts.
III. Application of Principles and Concepts

51
On hot sunny days, parked cars with the hottest interiors are those that are __________ in color.
A. white
B. red
C. black
D. green
Note: This item taps into the application of the principle (concept/fact) that
black surfaces absorb heat (and light) more efficiently than other colors
and thus will be relatively hotter.
Test Plan Example
The following is an example of a Test Plan for a test for the promotion of police officers to the
position of sergeant.
The length of the Police Sergeant exam will be 150 items. The number of items drawn from each
document will be based on the following:
A. The importance and frequency of behaviors associated with the knowledge contained in
that document.
B. The priority assigned to each document by the advisory committee
C. The nature of the content and the relative length of the document. Some documents are
very short. For this reason, the number of items drawn from a document is partially
determined by how feasible it is to write items from that source. Some content areas are less
amenable to testing than others.
The reading level for this exam will be that of a college sophomore.
Following the determination of the length of the test and the number of items to be derived from
each source, a test plan was developed. The use of a process-by-content matrix ensures adequate
sampling of job knowledge content areas and problem-solving processes. Problem-solving areas
involve the following
A. Knowledge of terminology.
B. Understanding of principles.
C. Application of knowledge to new situations
While knowledge of terminology is important, the understanding and application of principles
are considered to be of primary importance. This is reflected in the recommendation that a
majority of the items should involve the application of knowledge and understanding of
principles. Furthermore, not all documents are equally well suited for each of the three problem-
solving processes. Therefore, the manner in which each is sampled takes this into consideration.
PROPOSED PROCESS-BY-CONTENT MATRIX

52
POLICE SERGEANT
SOURCE DEF PRINC APP TOTAL
1. Essentials of Modern Police Work 3 8 17 28
2. Community Policing 0 7 13 20
3. Rules of Evidence 3 10 15 28
4. Department Rules & Regulations 0 4 6 10
5. State Criminal Code 2 5 11 18
6. State Vehicle Code 2 4 14 20
7. City Ordinances 0 2 10 12
8. Performance Appraisal Guidelines/ 0 3 4 7
Employee Ratings
9. Labor Agreement with the city 0 3 4 7
Total 10 46 94 150
Note: The document above was the goal the test writers set themselves to
follow. Turn to the next page to see the final Process-by-Content Matrix
that shows what really occurred during the test’s development. Notice
how it is slightly different from the test plan.

53
PROCESS-BY-CONTENT MATRIX
POLICE SERGEANT
SOURCE DEF PRINC APP TOTAL
1. Essentials of Modern Police Work 4 10 20 34
2. Community Policing 3 7 13 23
3. Rules of Evidence 3 10 17 30
4. Department Rules & Regulations 1 3 6 10
5. State Criminal Code 4 5 9 18
6. State Vehicle Code 4 6 10 20
7. City Ordinances 2 2 6 10
8. Performance Appraisal Guidelines/ 0 1 1 2
Employee Ratings
9. Labor Agreement with the city 0 1 2 3
Total 21 45 84 150
Note: This is an example of the Process-by-Content Matrix for a completed
test. Not all documents were equally well suited for each of the three
problem-solving processes. While the item writers attempted to conform
to the test plan some sources did not yield the required number of items.
So, the number of items actually developed from each source was
different from the preliminary test plan in some respects. This is because
sometimes the source materials do not supply sufficient information to
write appropriate test items. Alternatively, when the item writers
examined the source materials more closely, they identified additional
areas in the source materials that should be covered during the test that
were not identified when they originally made up the proposed Process-
by-Content Matrix. From this, you can see that test writing is a dynamic
process where the reality of writing test items is frequently dictated by
the quality of the source materials.

54
Attachment D - Upward Rating Bias
on Angoff Panels
In some situations, SME panels responsible for setting the Critical Score level for test set
the bar too high. For example, we have experienced situations where only 50% of credentialed
applicants in a given area of expertise taking a pre-employment test (measuring the same
competency areas in which they are credentialed) would pass a recommended cutoff score set by
the rater panel. In highly-regulated fields where credentialing programs are oftentimes very
rigorous, a situation where a pre-employment test fails 50% of the credentialed applicants could
have two possible explanations: (1) the credentialing program is setting the bar much too low
(and unqualified candidates are being credentialed), or (2) the rating panel that established the
Critical Score for the pre-employment test set the bar too high. While there is a range of other
plausible explanations between these two extremes, it has been our experience that the latter
explanation is oftentimes the case.
This ―upward bias‖ tendency that is sometimes observed does not (of course) rule out the
opposite, where a rater panel underestimates the idea minimum competency level. However, it
has been our experience that rating biases of the overestimation type are more common than
those of the underestimation nature.
While there are several viable theories that may explain why this phenomenon may occur
with rating panels, one particular theory seems to provide a practical explanation. The conscious
competence theory (which is sometimes also called the ―Four Stages of Learning‖ theory) was
originally posited by psychologist Abraham Maslow in the 1940s. This theory provides an
explanation of how people learn in four progressive stages:
1. Unconscious Incompetence (where you don‘t know that you don‘t know something),
to
2. Conscious Incompetence (you are now aware that you are incompetent at
something), to
3. Conscious Competence (you develop a skill in that area but have to think about it),
to the final stage
4. Unconscious Competence (you are good at it and it now comes naturally).
These four ―learning stages‖—ranging from unconsciously unskilled, consciously unskilled,
consciously skilled, to unconsciously skilled—have been widely adopted in both theory and
practice in educational, psychology, and organizational behavior fields since their inception. It is
the fourth stage (unconsciously skilled) that may cause some of the upward bias sometimes
observed in rating panels. This is because individuals who have had so much practice with a
particular skill—to the point where it becomes ―second nature‖ and can be performed easily
without intense concentration—can sometimes underestimate their level of competency when
they first started in the position (i.e., how long it took them to master the skill), which may cause

55
them to overestimate the percentage of qualified applicants who may be able to answer the test
question on the first day of the job.
Common examples of skills that can be attained at this ―fourth level‖ include driving,
sports activities, typing, manual dexterity tasks, listening, and communicating. For example,
performing a ―Y turn‖ is second nature to most people who have been driving for several years.
In fact, many experienced drivers may not even recall ever having to acquire this skill, but in
actuality many experienced drivers had to work hard at this skill repeatedly until mastered.
This issue can create an upward bias when applying minimum passing score
recommendations. Some raters might now be able to teach others in the target skill, although
after some time of being unconsciously competent, the person might actually have difficulty in
explaining exactly how they perform a particular skill because the skill has become largely
instinctual. This arguably gives rise to the need for long-standing unconscious competence to be
checked periodically against new standards. Fortunately, the extent to which this possible bias
may exist can be evaluated (after the test administration) by interpreting Output 6 in the Rater
Analysis Sheet.
Below are four suggestions that can be followed to help alleviate this potential problem:
1. Select SMEs who have between 1 and 5 years experience to serve on the rating panel,
2. Have the SMEs reveal and discuss their ratings on the first few test items so the
outliers in either direction can be reined in by the workshop proctor,
3. Conduct rigorous discussions with the SMEs regarding the ―true‖ minimum
qualification level relevant to the test, and
4. In some situations, masking the answer key from the SMEs can help reduce the
potential for upward rating bias.