test report on flexible coupling in laboratory -...
TRANSCRIPT
Deliverable D4.2
Test report on Flexible Coupling in laboratory
Grant agreement no. 654497
Duration 01.02.2016 – 31.01.2019
Work package WP4 – Flexible Coupling and casing materials
Type R - document, report
Dissemination level PU - public
Due date 31.08.2017
Actual submission date 30.11.2017
Lead author Hans Iver Lange (SINTEF)
Giovanni Perillo (SINTEF)
Contributors
Version 1.0
Report no.
Document status
Change history Version Date Changes
This publication was completed with the support of the European
Commission and European Union funding under Horizon 2020 research
and innovation programme. The contents of this publication do not
necessarily reflect the Commission's own position. The document reflects
only the author's views and the European Union and its institutions are
not liable for any use that may be made of the information contained here.
Innovative materials and designs for long-life high-temperature geothermal wells


SINTEF Materials and Chemistry
Materials Integrity and Welding 2017-10-16
2017:00254- Restricted
Report
Full scale testing of Flexible Coupling for geothermal casings
Mechanical integrity and leakage
Author(s) Hans Iver Lange
Giovanni Perillo


PROJECT NO. 102014946
REPORT NO. 2017:00254
VERSION 04
2 of 27
Document history
VERSION DATE VERSION DESCRIPTION
00 2017-07-14 Issue of report for client review
01 2017-08-18 Including corrections based on comments from Statoil. Issue of report
02 2017-08-23 Including corrections based on comments from ISOR
03 2017-10-11 Including Test 3
04 2017-10-16 Corrections after review from the client
PROJECT NO. 102014946
REPORT NO. 2017:00254
VERSION 04
3 of 27
Table of contents 1 INTRODUCTION ............................................................................................................................. 4
2 OBJECTIVE ..................................................................................................................................... 4
3 TEST DESCRIPTION AND SETUP ...................................................................................................... 5
3.1 Simplified Test Procedure .............................................................................................................. 5
3.2 Test rig ............................................................................................................................................ 7
3.3 Instrumentation ............................................................................................................................. 8
3.4 Assembly and torque ................................................................................................................... 10
4 TEST RESULTS .............................................................................................................................. 11
4.1 Test 1 ............................................................................................................................................ 12
4.2 Test 2 ............................................................................................................................................ 16
4.3 Test 3 ............................................................................................................................................ 21
5 DISCUSSION ................................................................................................................................ 25
5.1 Limitations of leakage rate........................................................................................................... 25
5.2 Leakage rate measurement ......................................................................................................... 25
5.3 Comparisons of the final rupture loading .................................................................................... 26
6 CONCLUSIONS ............................................................................................................................. 27
7 REFERENCES ................................................................................................................................ 27
APPENDICES
Appendix A: SINTEFs practical interpretation of the Test Procedure
Appendix B: Details of the instrumentation and calibrations
Appendix C: Geometry, dimensions and fabrication of the test specimen and fixtures
Appendix D: Receipt of test material
Appendix E: Detailed results of the strain gauges

PROJECT NO. 102014946
REPORT NO. 2017:00254
VERSION 04
4 of 27
1 INTRODUCTION
High temperature variations during operation of a geothermal well, and especially during start up and cool
down, introduces significant axial thermomechanical loadings to the casing. A method to relax the
thermomechanical loadings is to introduce an element of axial displacement in the casing. The intension of
this prototype of flexible coupling is to open for 20 mm stroke inside the coupling, and still hold the
requirements regarding mechanical integrity and leakage according to the standard ISO/PAS 12835:2013(E).
However, this standard is for none-sliding couplings, so some modifications had to be done in the Test
Procedure.
ISOR has developed the present flexible coupling, which is a prototype, and a request was received from
Statoil to perform a full-scale test program. A test procedure was developed by Statoil, based on the test
facilities at SINTEF combined with relevant parts of the referred test standard. Finally it was agreed on a
instrumentation plan and that water was used for pressurization instead of gas. The latter was a HSE
prerequisite from SINTEF, to be able to perform the tests inside the facilities of the test laboratory.
Larger leakage, compared to the threads of the coupling, were identified from the safety pins and
circumferential transition of the coupling of Test 1 and Test 2. This made it impossible to reach the required
pressure for some of the tensile test conditions due to the unsatisfactory flow rate of the pump. The leakage
rates from the threads on the sliding side of the coupling were monitored during the tests. These are close to
the maximum requirement of the referred test standard, and the leakage is expected to be even higher if water
is exchanged with vapour/gas. The test program was therefore stopped after two tests. The third test was
performed on a modified version of the coupling, and a pump with larger flow rate was used. Significantly
higher leakage was experienced from the circumferential transition of the coupling. Therefore it was decided
to reduce the content of the Test Procedure for this tests.
2 OBJECTIVE
Three full scale tests are performed on a prototype for a flexible coupling, used on 9⅝" casings. The
objective is to verify the mechanical integrity and leakage of the coupling at room temperature. The loadings
consist of tension, compression and bending combined with internal pressure, following a specific Test
Procedure, see ref. /2/.
Figure 1. Principle sketch of the test setup (see also photo in Figure 3).
PROJECT NO. 102014946
REPORT NO. 2017:00254
VERSION 04
5 of 27
3 TEST DESCRIPTION AND SETUP
Three similar flexible couplings, developed and produced by ISOR, were received at the premises of the test
laboratory, together with threaded 9⅝" casings (1 meter long, L80 grade steel). In addition, two 12 meter
long pipes were received for extension piping to the test machine (P110 grade steel). More details of the
coupling are given in ref. /2/ and /3/. The third test was performed on a modified coupling. The intension of
the modification was to reduce the leakage from the safety pins and transition seam of the coupling.
The OD of the casing is 245mm and the WT is 12.3mm (ID 220.4mm). The OD of the extension piping is
253mm and the WT is 16mm (ID 221mm).
The intension of the test setup is to have stiffer and stronger pipes towards the flanges. This prevents plastic
deformations in the extension pipe during testing. A sketch is shown in Figure 1.
3.1 Simplified Test Procedure
The test consisted of application of axial load (tension and compression) to the coupling, with and without
bending. During the test, the sealing capability of the coupling was evaluated by internally pressurizing the
entire test specimen with water up to 165 bar. The tests were performed at room temperature.
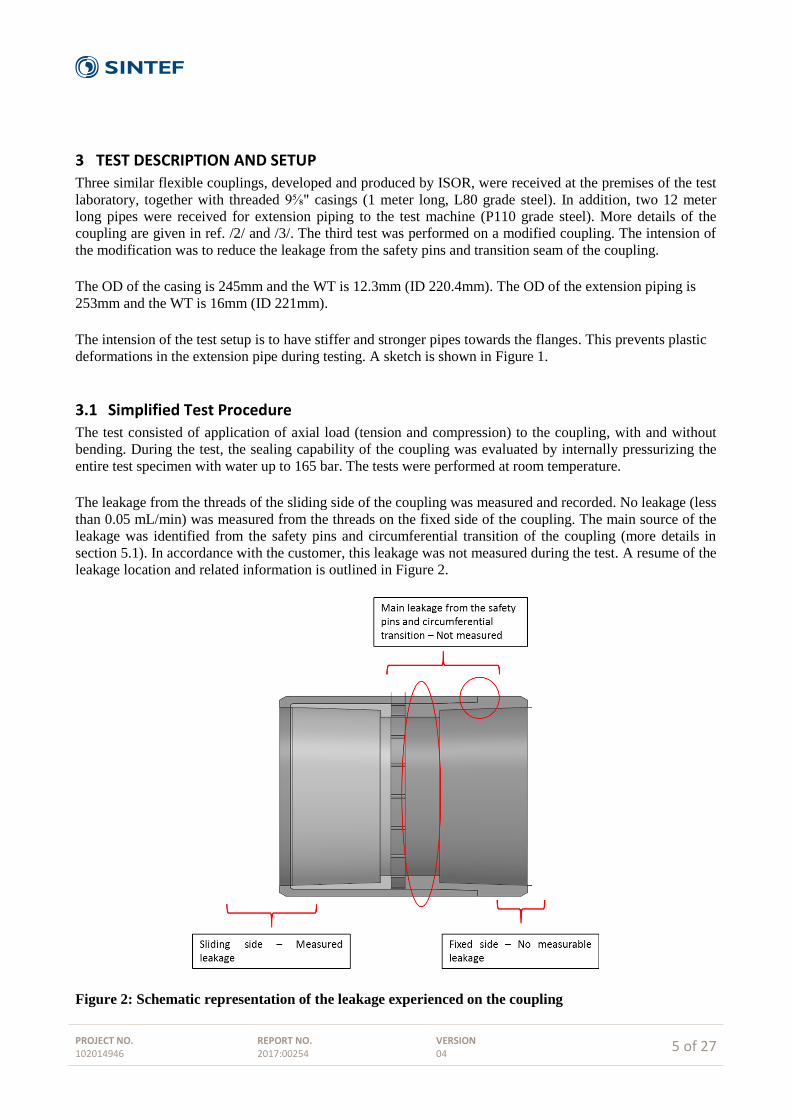
The leakage from the threads of the sliding side of the coupling was measured and recorded. No leakage (less
than 0.05 mL/min) was measured from the threads on the fixed side of the coupling. The main source of the
leakage was identified from the safety pins and circumferential transition of the coupling (more details in
section 5.1). In accordance with the customer, this leakage was not measured during the test. A resume of the
leakage location and related information is outlined in Figure 2.
Figure 2: Schematic representation of the leakage experienced on the coupling
PROJECT NO. 102014946
REPORT NO. 2017:00254
VERSION 04
6 of 27
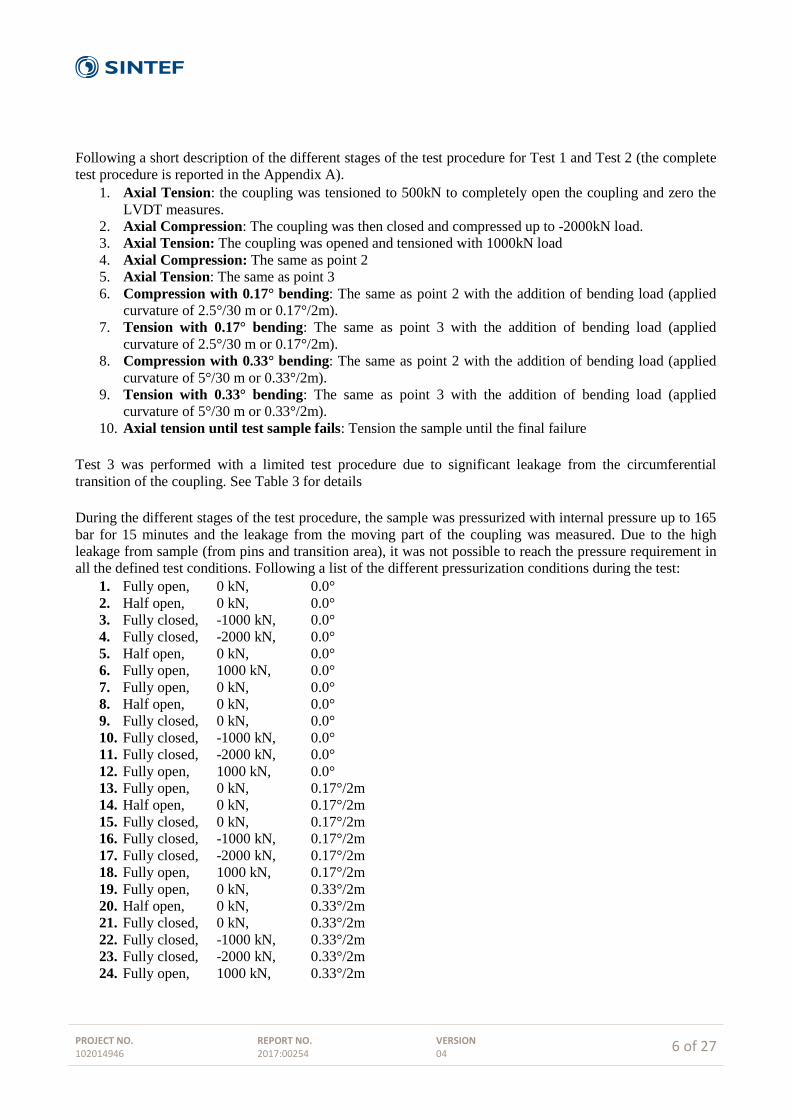
Following a short description of the different stages of the test procedure for Test 1 and Test 2 (the complete
test procedure is reported in the Appendix A).
1. Axial Tension: the coupling was tensioned to 500kN to completely open the coupling and zero the
LVDT measures.
2. Axial Compression: The coupling was then closed and compressed up to -2000kN load.
3. Axial Tension: The coupling was opened and tensioned with 1000kN load
4. Axial Compression: The same as point 2
5. Axial Tension: The same as point 3
6. Compression with 0.17° bending: The same as point 2 with the addition of bending load (applied
curvature of 2.5°/30 m or 0.17°/2m).
7. Tension with 0.17° bending: The same as point 3 with the addition of bending load (applied
curvature of 2.5°/30 m or 0.17°/2m).
8. Compression with 0.33° bending: The same as point 2 with the addition of bending load (applied
curvature of 5°/30 m or 0.33°/2m).
9. Tension with 0.33° bending: The same as point 3 with the addition of bending load (applied
curvature of 5°/30 m or 0.33°/2m).
10. Axial tension until test sample fails: Tension the sample until the final failure
Test 3 was performed with a limited test procedure due to significant leakage from the circumferential
transition of the coupling. See Table 3 for details
During the different stages of the test procedure, the sample was pressurized with internal pressure up to 165
bar for 15 minutes and the leakage from the moving part of the coupling was measured. Due to the high
leakage from sample (from pins and transition area), it was not possible to reach the pressure requirement in
all the defined test conditions. Following a list of the different pressurization conditions during the test:
1. Fully open, 0 kN, 0.0°
2. Half open, 0 kN, 0.0°
3. Fully closed, -1000 kN, 0.0°
4. Fully closed, -2000 kN, 0.0°
5. Half open, 0 kN, 0.0°
6. Fully open, 1000 kN, 0.0°
7. Fully open, 0 kN, 0.0°
8. Half open, 0 kN, 0.0°
9. Fully closed, 0 kN, 0.0°
10. Fully closed, -1000 kN, 0.0°
11. Fully closed, -2000 kN, 0.0°
12. Fully open, 1000 kN, 0.0°
13. Fully open, 0 kN, 0.17°/2m
14. Half open, 0 kN, 0.17°/2m
15. Fully closed, 0 kN, 0.17°/2m
16. Fully closed, -1000 kN, 0.17°/2m
17. Fully closed, -2000 kN, 0.17°/2m
18. Fully open, 1000 kN, 0.17°/2m
19. Fully open, 0 kN, 0.33°/2m
20. Half open, 0 kN, 0.33°/2m
21. Fully closed, 0 kN, 0.33°/2m
22. Fully closed, -1000 kN, 0.33°/2m
23. Fully closed, -2000 kN, 0.33°/2m
24. Fully open, 1000 kN, 0.33°/2m

PROJECT NO. 102014946
REPORT NO. 2017:00254
VERSION 04
7 of 27
Where:
Fully open: Coupling completely open - LVDT coupling measuring 0mm
Half open: LVDT coupling measuring ≈10mm
Fully closed: LVDT coupling measuring ≈20mm
3.2 Test rig
The tests were carried out in a specific test rig located at Sintef's laboratory in Trondheim. The test rig
consists of two side plates connected by three high load hydraulic cylinders (two on the top and one on the
bottom). Both side plates are allowed to rotate around their middle axes while only one is allowed to slide
horizontally (see Figure 1 and Figure 3). The test sample is connected to both plates by using custom-made
flange fixed in place by sixteen M20 bolts. The rig design allows the simultaneous application of axial and
bending load, up to a total force of ≈8000kN. Photos of the test setup is shown in Figure 3 and Figure 4.
In addition, for the specific test requirement, an air operated pump (Hydratron AZ-1-425) was used to apply
the providing the hydraulic internal pressure to the sample during the test.
Figure 3. Test rig with test specimen installed

PROJECT NO. 102014946
REPORT NO. 2017:00254
VERSION 04
8 of 27
Figure 4. Coupling and instrumentation
3.3 Instrumentation
The sample and the test rig were equipped with several sensors and measuring devices according to the client
specifications:
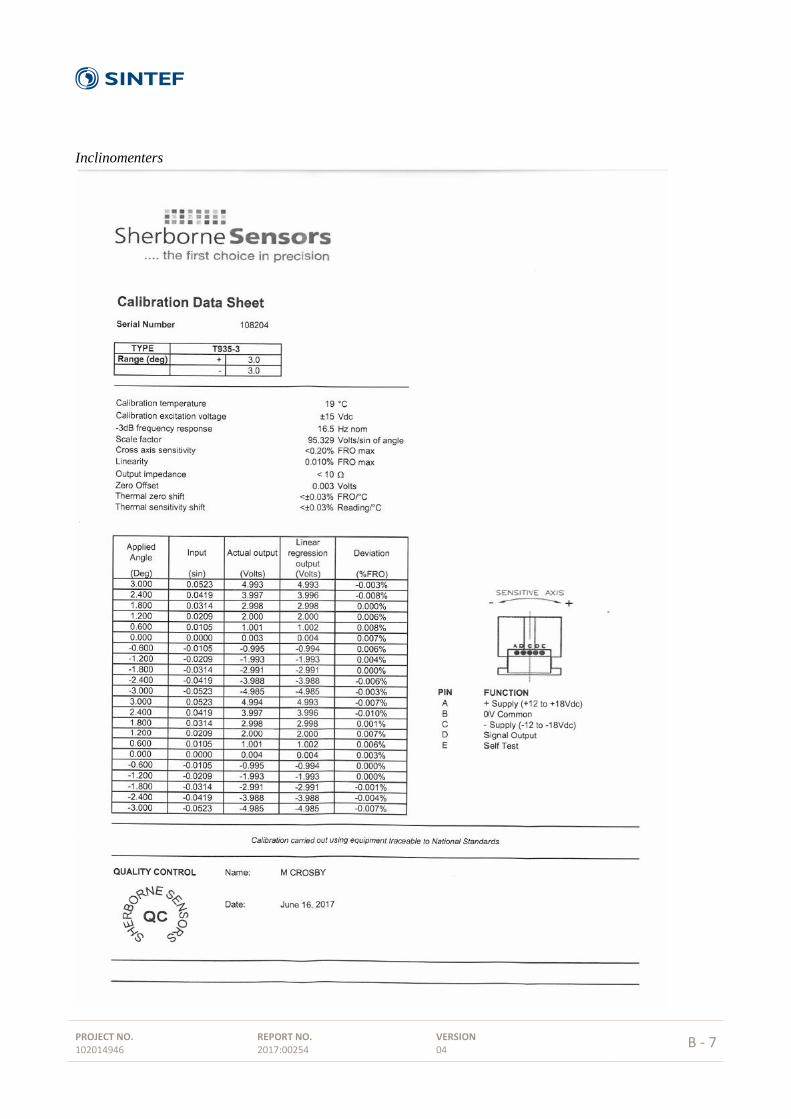
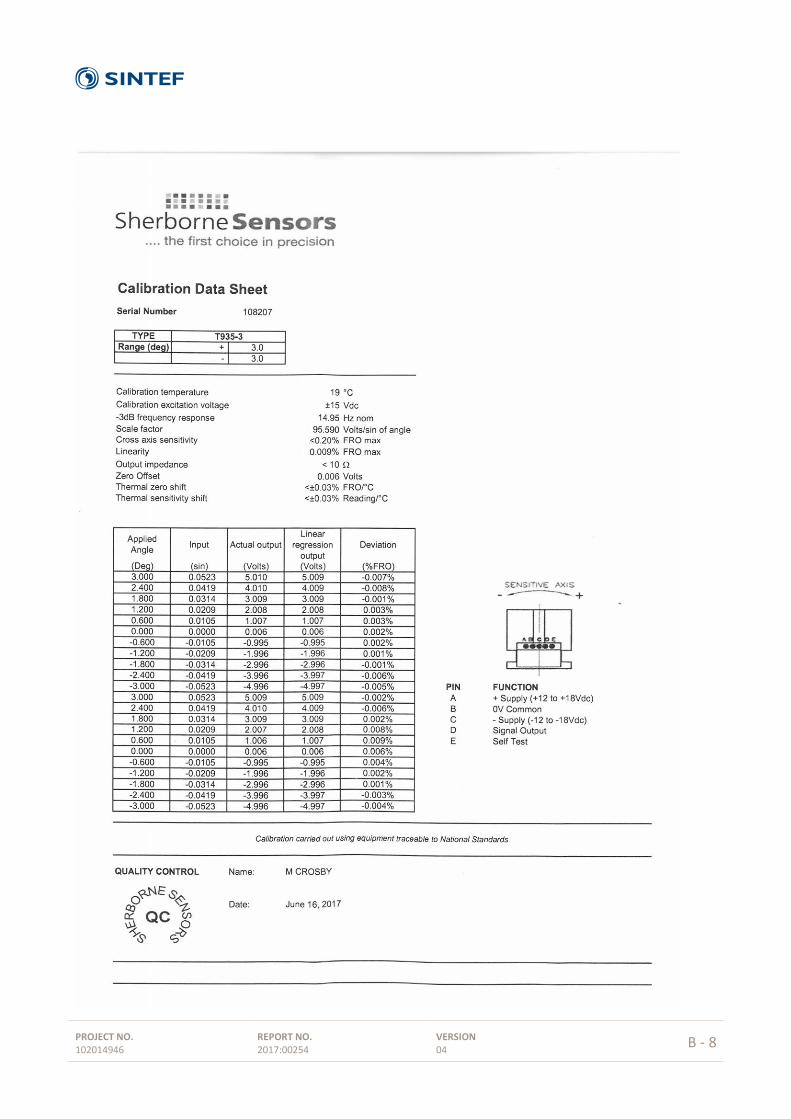
Inclinometer x 2: High accuracy T935-3 (Sherborne Sensors) inclinometers with ±3 deg range (±5V
linear output) were used during the test for recording the applied bending/angle on the sample. Two
inclinometers were placed on the pipe neutral axis close to the welding location, on the side of the
extension pipes. These were placed at 1m distance from the coupling centre position (see Figure 5 for
more details) – total distance 2m.
The total applied angle was measured as:
Total_Angle=ABS(Angle_Right)+ABS(Angle_Left)
LVDT x 2: LVDTs were placed across the coupling to evaluate its opening/closing during the test. Two
LVDTs were positioned at 12- and 6 o'clock. Note that for the first test, 4 LVDTs were used.
Unfortunately the measures at the neutral plane were unusable due their unclamping because of
movements during the test. The average value of the LVDT measures was used for defining the
coupling position.
Strain Gauge x 12: Strain gauges (SG) were placed on the extension pipes and coupling to evaluate the
applied strain induced by the applied load. Three axial locations were selected, see Figure 5 and Figure
6. For each location, four SGs were glued to the sample with 90deg spacing (12-, 3-, 6- and 9 o'clock
circumferential positions). A total of 12 SGs were used for each test, all measuring the strain in the axial
direction. SG type FLA-5-11-1L from Tokyo Sokki Kenkyujo was used for all the tests.
Internal Pressure sensor: The internal pressure in the pipe was measured by an HBM P3 high accuracy
pressure sensor (range 1 to 500Bar) placed in the extension pipe.
Total applied load: the internal cylinder pressures (in all three cylinders) and the relative positions were
measured with the 6 HBM P3IC pressure sensors (range 1 to 1000Bar) and LVDTs available in the test
machine. The pressure values in the cylinders were used to evaluate the applied load during the test.
More details about the calculation is found in Appendix B.

PROJECT NO. 102014946
REPORT NO. 2017:00254
VERSION 04
9 of 27
Acquisition system:
An ad hoc acquisition system was developed in the HBM Catman Easy software for the monitoring and
recording of the measurements. The different measurements were sampled with a frequency of 2 Hz. HBM
MGC Plus amplifiers were used, except for the two LVDTs, where the signal were amplified by using a
HBM Scout 55 amplifier.
All the sensors and acquisition channels were verified and calibrated before the test. The calibration
documents are reported in Appendix B.
In addition to the previous reported instrumentation, during the different pressurization phases of the test, the
leakage on the moving part of the coupling was also measured. A bucket was placed under the connection to
collect the leakage water during the holding time. This was then manually weighted and recorded.
Figure 5. Positions of the instrumentation on the test specimen
Figure 6: Detailed position for SGs location in position 2 (SG2)
PROJECT NO. 102014946
REPORT NO. 2017:00254
VERSION 04
10 of 27
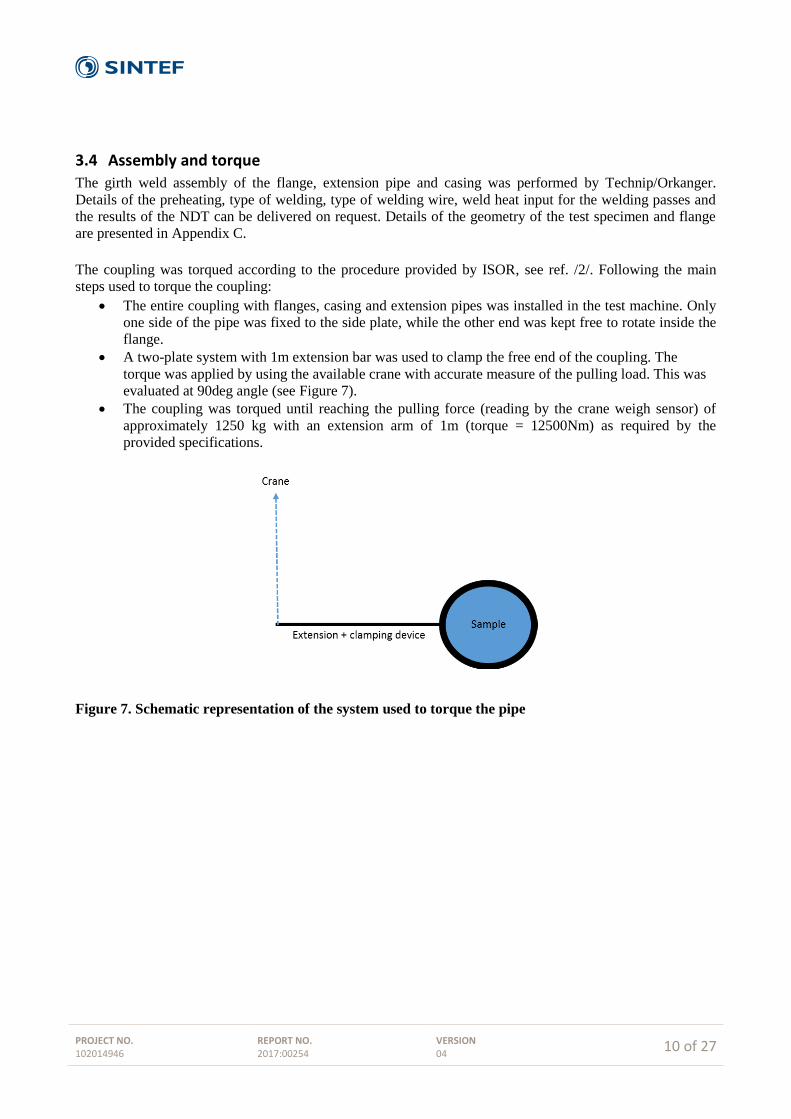
3.4 Assembly and torque
The girth weld assembly of the flange, extension pipe and casing was performed by Technip/Orkanger.
Details of the preheating, type of welding, type of welding wire, weld heat input for the welding passes and
the results of the NDT can be delivered on request. Details of the geometry of the test specimen and flange
are presented in Appendix C.
The coupling was torqued according to the procedure provided by ISOR, see ref. /2/. Following the main
steps used to torque the coupling:
The entire coupling with flanges, casing and extension pipes was installed in the test machine. Only
one side of the pipe was fixed to the side plate, while the other end was kept free to rotate inside the
flange.
A two-plate system with 1m extension bar was used to clamp the free end of the coupling. The
torque was applied by using the available crane with accurate measure of the pulling load. This was
evaluated at 90deg angle (see Figure 7).
The coupling was torqued until reaching the pulling force (reading by the crane weigh sensor) of
approximately 1250 kg with an extension arm of 1m (torque = 12500Nm) as required by the
provided specifications.
Figure 7. Schematic representation of the system used to torque the pipe
PROJECT NO. 102014946
REPORT NO. 2017:00254
VERSION 04
11 of 27
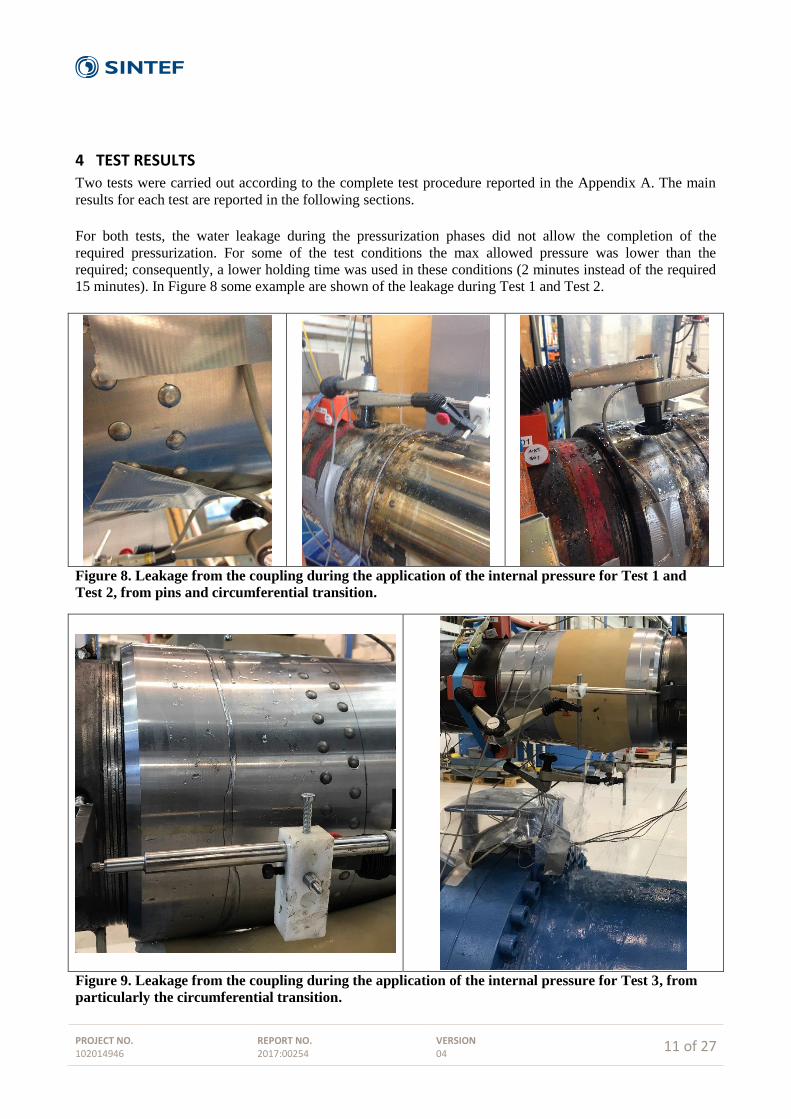
4 TEST RESULTS
Two tests were carried out according to the complete test procedure reported in the Appendix A. The main
results for each test are reported in the following sections.
For both tests, the water leakage during the pressurization phases did not allow the completion of the
required pressurization. For some of the test conditions the max allowed pressure was lower than the
required; consequently, a lower holding time was used in these conditions (2 minutes instead of the required
15 minutes). In Figure 8 some example are shown of the leakage during Test 1 and Test 2.
Figure 8. Leakage from the coupling during the application of the internal pressure for Test 1 and
Test 2, from pins and circumferential transition.
Figure 9. Leakage from the coupling during the application of the internal pressure for Test 3, from
particularly the circumferential transition.
PROJECT NO. 102014946
REPORT NO. 2017:00254
VERSION 04
12 of 27
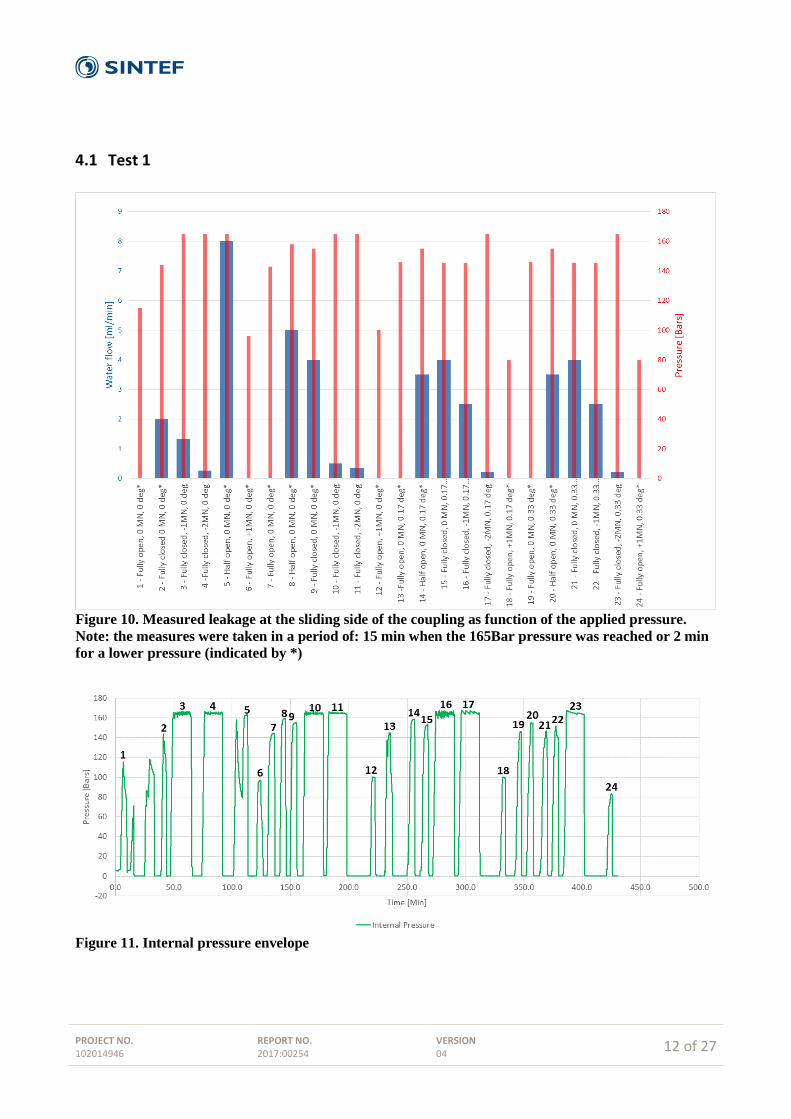
4.1 Test 1
Figure 10. Measured leakage at the sliding side of the coupling as function of the applied pressure.
Note: the measures were taken in a period of: 15 min when the 165Bar pressure was reached or 2 min
for a lower pressure (indicated by *)
Figure 11. Internal pressure envelope
PROJECT NO. 102014946
REPORT NO. 2017:00254
VERSION 04
13 of 27
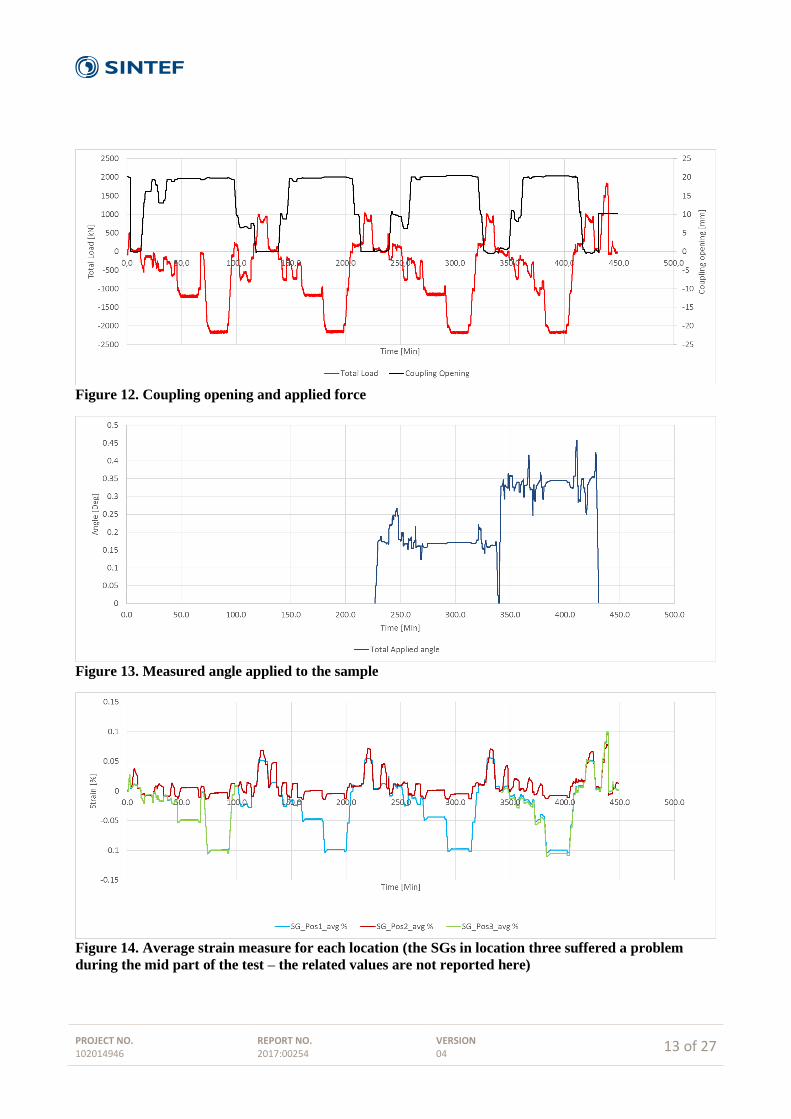
Figure 12. Coupling opening and applied force
Figure 13. Measured angle applied to the sample
Figure 14. Average strain measure for each location (the SGs in location three suffered a problem
during the mid part of the test – the related values are not reported here)

PROJECT NO. 102014946
REPORT NO. 2017:00254
VERSION 04
14 of 27
Figure 15. Zoom on the final part of the test with the complete failure
Figure 16. Failure area

PROJECT NO. 102014946
REPORT NO. 2017:00254
VERSION 04
15 of 27
Table 1: Leakage measurements
Measuring
point
Position
[mm]
Force
[kN]
Angle
[°/2m]*
Pressure
[Bar]
Time
[min]
Leakage
[mL/min]
1 - Fully open 0 0 0 115 0 0
2 - Fully closed 20 0 0 144 0 2
3 - Fully closed 20 -1000 0 165 15 1.3
4 - Fully closed 20 -2000 0 165 15 0.3
5 - Half open 10 0 0 165 2 8
6 - Fully open 0 1000 0 96 2 0
7 - Fully open 0 0 0 143 2 0
8 - Half open 10 0 0 158 2 5
9 - Fully closed 20 0 0 155 2 4
10 - Fully closed 20 -1000 0 165 15 0.5
11 - Fully closed 20 -2000 0 165 15 0.4
12 - Fully open 0 1000 0 100 2 0
13 - Fully open 0 0 0.17 146 2 0
14 - Half open 10 0 0.17 155 2 3.5
15 - Fully closed 20 0 0.17 145 2 4
16 - Fully closed 20 -1000 0.17 145 2 2.5
17 - Fully closed 20 -2000 0.17 165 15 0.2
18 - Fully open 0 1000 0.17 80 2 0
19 - Fully open 0 0 0.33 146 2 0
20 - Half open 10 0 0.33 155 2 3.5
21 - Fully closed 20 0 0.33 145 2 4
22 - Fully closed 20 -1000 0.33 145 2 2.5
23 - Fully closed 20 -2000 0.33 165 15 0.2
24 - Fully open 0 1000 0.33 80 2 0
*: Angle per 2m, coupling in the centre.
Comment, Test 1
During the execution of test one, it was noticed that the coupling was sliding (within the sliding part
of the test) when reaching a force of approximately 200kN. The obtained sliding force did not
present any variation even when bending was applied to the coupling.
The final failure happened at a total tensile load of 1837kN. The failure was initiated by shear of the
pins.
The detailed results from the SG measurements are presented in Appendix E.
PROJECT NO. 102014946
REPORT NO. 2017:00254
VERSION 04
16 of 27
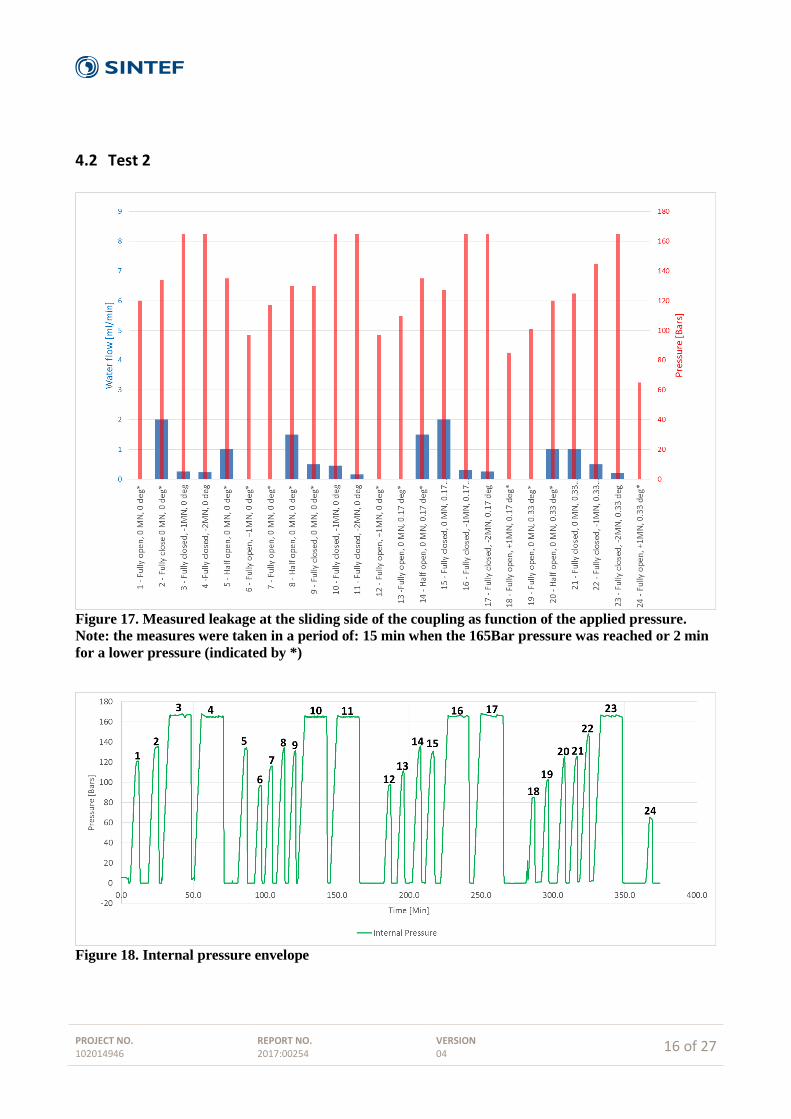
4.2 Test 2
Figure 17. Measured leakage at the sliding side of the coupling as function of the applied pressure.
Note: the measures were taken in a period of: 15 min when the 165Bar pressure was reached or 2 min
for a lower pressure (indicated by *)
Figure 18. Internal pressure envelope

PROJECT NO. 102014946
REPORT NO. 2017:00254
VERSION 04
17 of 27
Figure 19. Coupling opening and applied force
Figure 20: Measured angle applied to the sample
Figure 21. Average strain measure for each location

PROJECT NO. 102014946
REPORT NO. 2017:00254
VERSION 04
18 of 27
Figure 22. Zoom on the final part of the test with the complete failure
Figure 23. Failure area
PROJECT NO. 102014946
REPORT NO. 2017:00254
VERSION 04
19 of 27
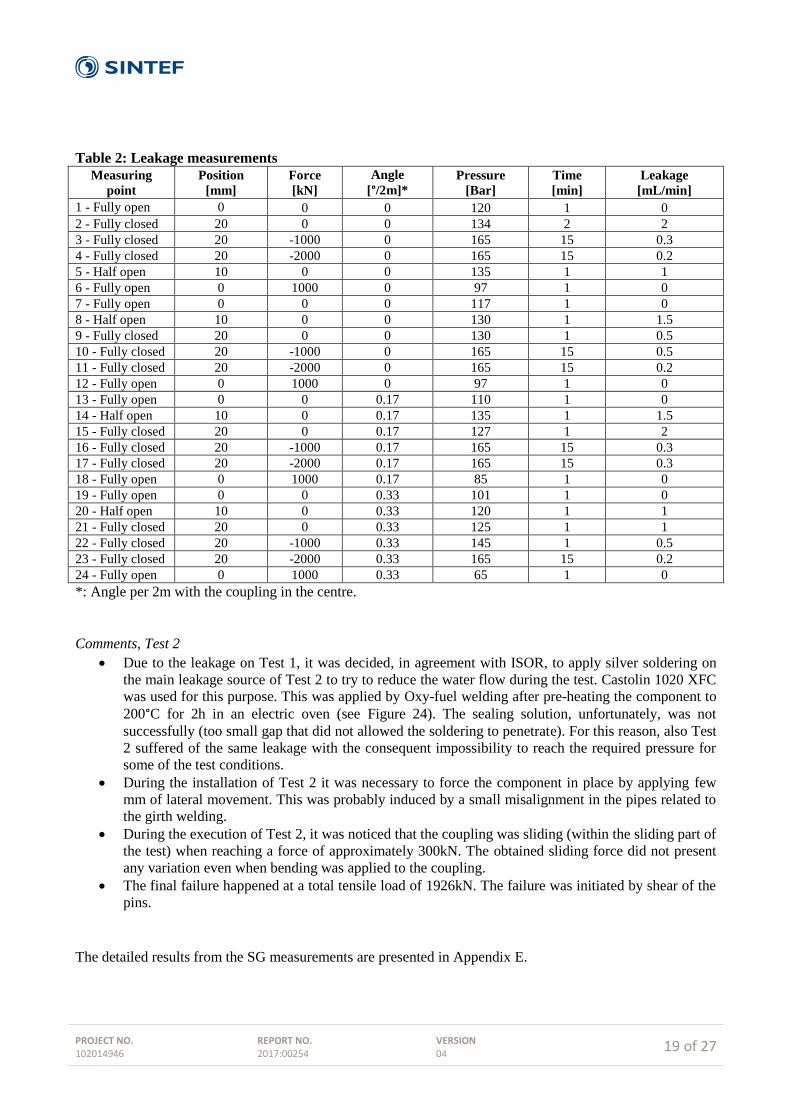
Table 2: Leakage measurements
Measuring
point
Position
[mm]
Force
[kN]
Angle
[°/2m]*
Pressure
[Bar]
Time
[min]
Leakage
[mL/min]
1 - Fully open 0 0 0 120 1 0
2 - Fully closed 20 0 0 134 2 2
3 - Fully closed 20 -1000 0 165 15 0.3
4 - Fully closed 20 -2000 0 165 15 0.2
5 - Half open 10 0 0 135 1 1
6 - Fully open 0 1000 0 97 1 0
7 - Fully open 0 0 0 117 1 0
8 - Half open 10 0 0 130 1 1.5
9 - Fully closed 20 0 0 130 1 0.5
10 - Fully closed 20 -1000 0 165 15 0.5
11 - Fully closed 20 -2000 0 165 15 0.2
12 - Fully open 0 1000 0 97 1 0
13 - Fully open 0 0 0.17 110 1 0
14 - Half open 10 0 0.17 135 1 1.5
15 - Fully closed 20 0 0.17 127 1 2
16 - Fully closed 20 -1000 0.17 165 15 0.3
17 - Fully closed 20 -2000 0.17 165 15 0.3
18 - Fully open 0 1000 0.17 85 1 0
19 - Fully open 0 0 0.33 101 1 0
20 - Half open 10 0 0.33 120 1 1
21 - Fully closed 20 0 0.33 125 1 1
22 - Fully closed 20 -1000 0.33 145 1 0.5
23 - Fully closed 20 -2000 0.33 165 15 0.2
24 - Fully open 0 1000 0.33 65 1 0
*: Angle per 2m with the coupling in the centre.
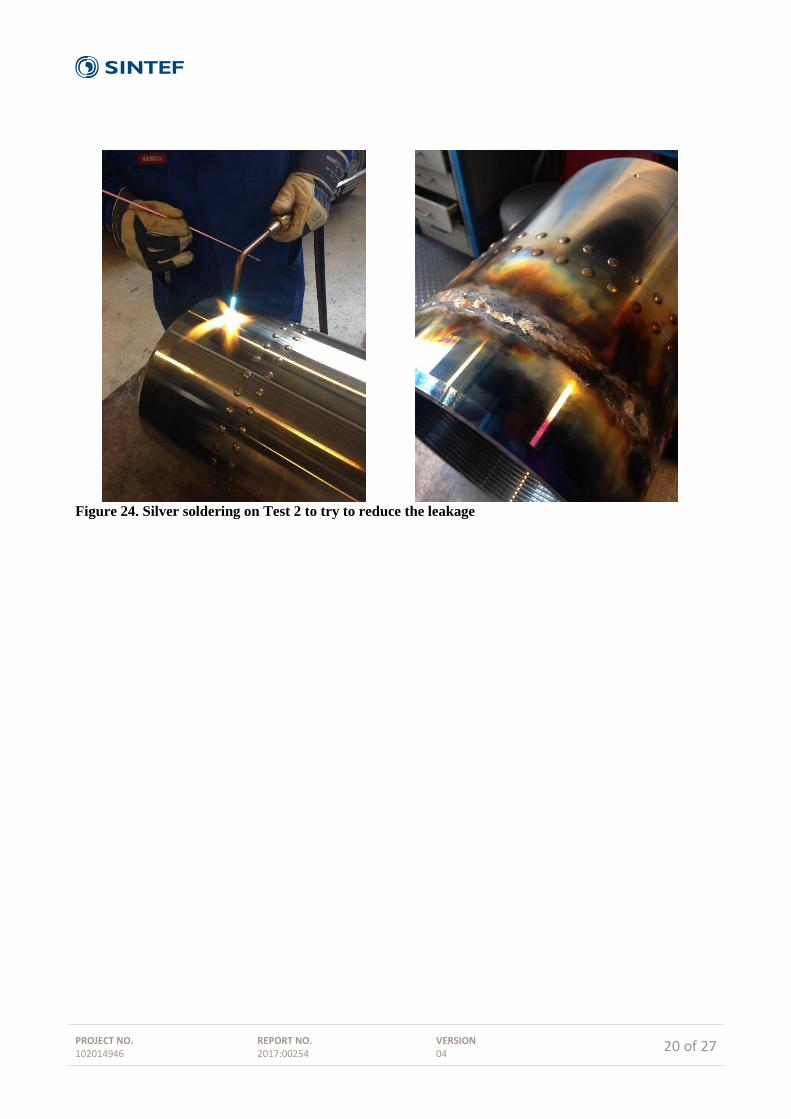
Comments, Test 2
Due to the leakage on Test 1, it was decided, in agreement with ISOR, to apply silver soldering on
the main leakage source of Test 2 to try to reduce the water flow during the test. Castolin 1020 XFC
was used for this purpose. This was applied by Oxy-fuel welding after pre-heating the component to
200°C for 2h in an electric oven (see Figure 24). The sealing solution, unfortunately, was not
successfully (too small gap that did not allowed the soldering to penetrate). For this reason, also Test
2 suffered of the same leakage with the consequent impossibility to reach the required pressure for
some of the test conditions.
During the installation of Test 2 it was necessary to force the component in place by applying few
mm of lateral movement. This was probably induced by a small misalignment in the pipes related to
the girth welding.
During the execution of Test 2, it was noticed that the coupling was sliding (within the sliding part of
the test) when reaching a force of approximately 300kN. The obtained sliding force did not present
any variation even when bending was applied to the coupling.
The final failure happened at a total tensile load of 1926kN. The failure was initiated by shear of the
pins.
The detailed results from the SG measurements are presented in Appendix E.
PROJECT NO. 102014946
REPORT NO. 2017:00254
VERSION 04
20 of 27
Figure 24. Silver soldering on Test 2 to try to reduce the leakage
PROJECT NO. 102014946
REPORT NO. 2017:00254
VERSION 04
21 of 27
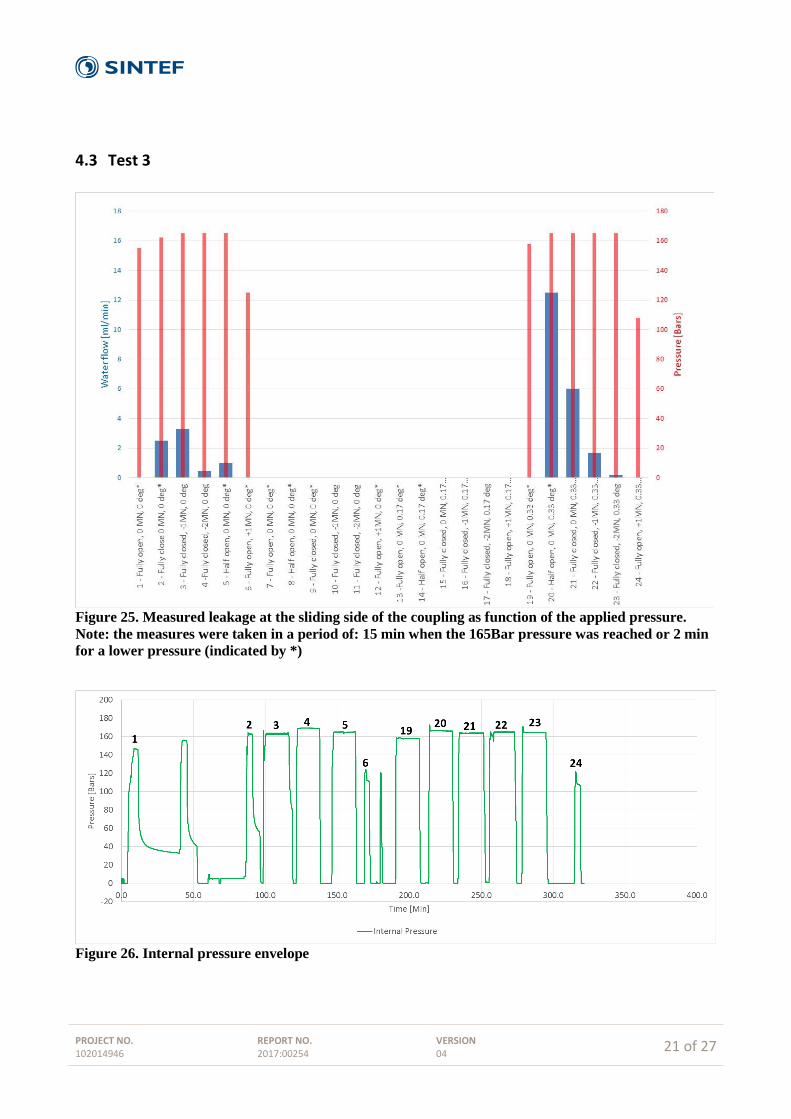
4.3 Test 3
Figure 25. Measured leakage at the sliding side of the coupling as function of the applied pressure.
Note: the measures were taken in a period of: 15 min when the 165Bar pressure was reached or 2 min
for a lower pressure (indicated by *)
Figure 26. Internal pressure envelope

PROJECT NO. 102014946
REPORT NO. 2017:00254
VERSION 04
22 of 27
Figure 27. Coupling opening and applied force
Figure 28: Measured angle applied to the sample
+
Figure 29. Average strain measure for each location
-25
-15
-5
5
15
25
35
-3000
-2000
-1000
0
1000
2000
3000
4000
0.0 50.0 100.0 150.0 200.0 250.0 300.0 350.0 400.0
Co
up
ling
op
enin
g [m
m]
Tota
l Lo
ad [
kN]
Time [Min]
Total Load Coupling Opening
PROJECT NO. 102014946
REPORT NO. 2017:00254
VERSION 04
23 of 27
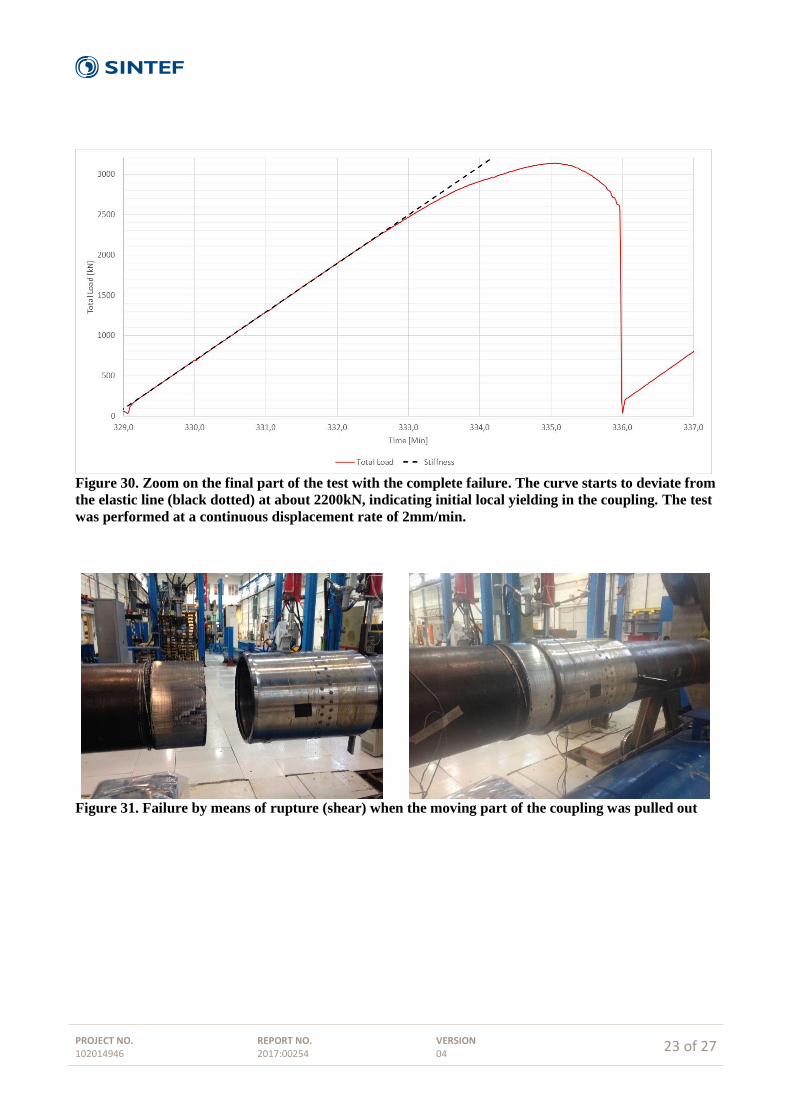
Figure 30. Zoom on the final part of the test with the complete failure. The curve starts to deviate from
the elastic line (black dotted) at about 2200kN, indicating initial local yielding in the coupling. The test
was performed at a continuous displacement rate of 2mm/min.
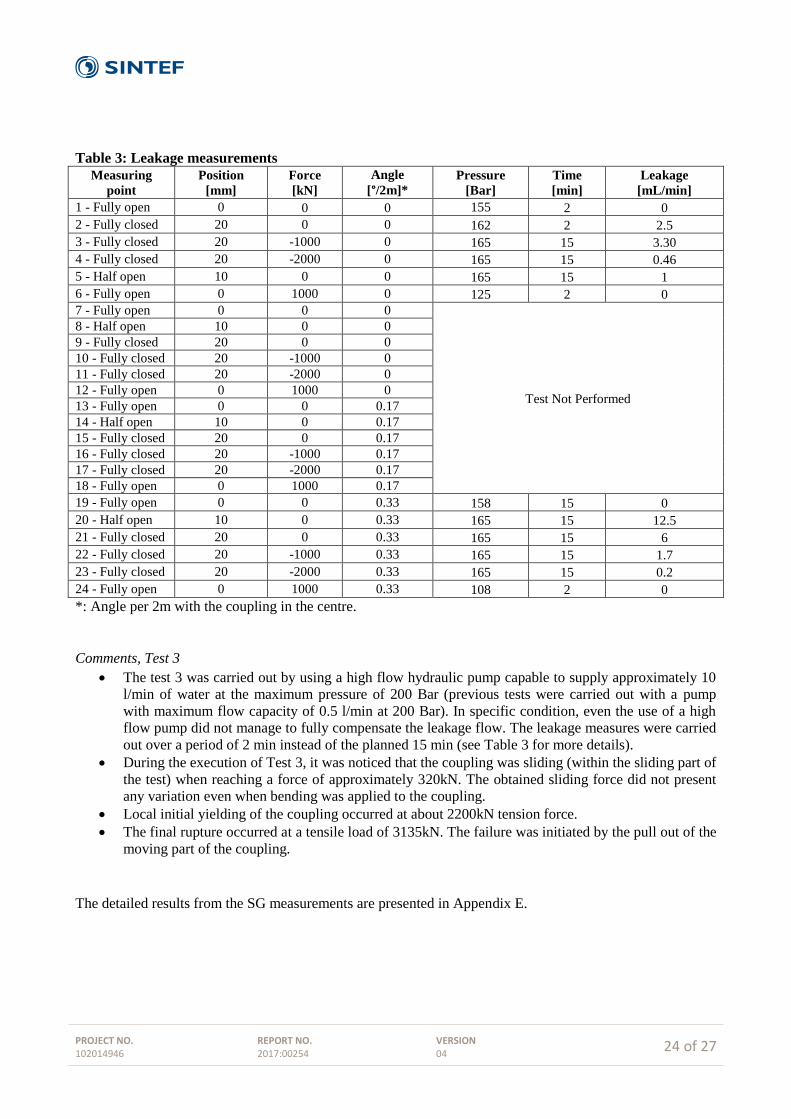
Figure 31. Failure by means of rupture (shear) when the moving part of the coupling was pulled out
PROJECT NO. 102014946
REPORT NO. 2017:00254
VERSION 04
24 of 27
Table 3: Leakage measurements
Measuring
point
Position
[mm]
Force
[kN]
Angle
[°/2m]*
Pressure
[Bar]
Time
[min]
Leakage
[mL/min]
1 - Fully open 0 0 0 155 2 0
2 - Fully closed 20 0 0 162 2 2.5
3 - Fully closed 20 -1000 0 165 15 3.30
4 - Fully closed 20 -2000 0 165 15 0.46
5 - Half open 10 0 0 165 15 1
6 - Fully open 0 1000 0 125 2 0
7 - Fully open 0 0 0
Test Not Performed
8 - Half open 10 0 0
9 - Fully closed 20 0 0
10 - Fully closed 20 -1000 0
11 - Fully closed 20 -2000 0
12 - Fully open 0 1000 0
13 - Fully open 0 0 0.17
14 - Half open 10 0 0.17
15 - Fully closed 20 0 0.17
16 - Fully closed 20 -1000 0.17
17 - Fully closed 20 -2000 0.17
18 - Fully open 0 1000 0.17
19 - Fully open 0 0 0.33 158 15 0
20 - Half open 10 0 0.33 165 15 12.5
21 - Fully closed 20 0 0.33 165 15 6
22 - Fully closed 20 -1000 0.33 165 15 1.7
23 - Fully closed 20 -2000 0.33 165 15 0.2
24 - Fully open 0 1000 0.33 108 2 0
*: Angle per 2m with the coupling in the centre.
Comments, Test 3
The test 3 was carried out by using a high flow hydraulic pump capable to supply approximately 10
l/min of water at the maximum pressure of 200 Bar (previous tests were carried out with a pump
with maximum flow capacity of 0.5 l/min at 200 Bar). In specific condition, even the use of a high
flow pump did not manage to fully compensate the leakage flow. The leakage measures were carried
out over a period of 2 min instead of the planned 15 min (see Table 3 for more details).
During the execution of Test 3, it was noticed that the coupling was sliding (within the sliding part of
the test) when reaching a force of approximately 320kN. The obtained sliding force did not present
any variation even when bending was applied to the coupling.
Local initial yielding of the coupling occurred at about 2200kN tension force.
The final rupture occurred at a tensile load of 3135kN. The failure was initiated by the pull out of the
moving part of the coupling.
The detailed results from the SG measurements are presented in Appendix E.

PROJECT NO. 102014946
REPORT NO. 2017:00254
VERSION 04
25 of 27
5 DISCUSSION
5.1 Limitations of leakage rate
Due to the high leakage rates found during the testing for both Test 1 and Test 2, it was not possible to
complete the requirements of the Test Procedure regarding pressure and holding time. The provided test
description required to hold the internal pressure of 165 bar for 15 minutes. Due to the flow limitations of the
available pressure system (maximum flow of ≈0.5 L/min), it was not possible to reach the required pressures
for some cases (leakage rate higher than the maximum flow of the pump). In these cases, a shorter holding
time of 2 minutes was used. Distinctly higher leakage rate was identified for Test 3, located to the
circumferential transition of the coupling. For this test a pump with a maximum flow of about 10 L/min was
used.
Figure 32. Leakage areas of the coupling in red
5.2 Leakage rate measurement
During the test, the leakage rate from the sliding side of the coupling was measured by placing a bucket
under the related side of the coupling. These measures, however, could have been affected by the main
leakage on the coupling (not measured). Water spills coming from the central side of the coupling (safety
pins and circumferential transition), could have reached the measuring bucket and, to a minor extent,
affected the measured value. A conveyor to canalize the water leakage and reduce the possibility of
disturbing the measured values was used for Test 3.
PROJECT NO. 102014946
REPORT NO. 2017:00254
VERSION 04
26 of 27
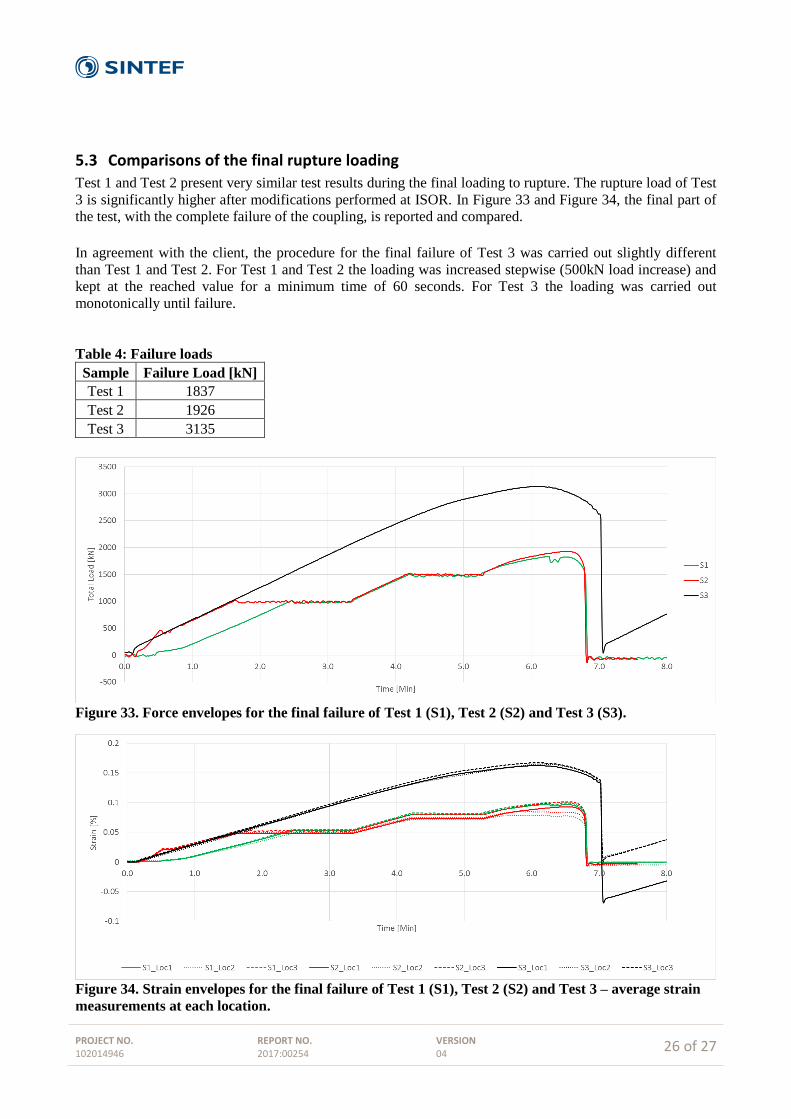
5.3 Comparisons of the final rupture loading
Test 1 and Test 2 present very similar test results during the final loading to rupture. The rupture load of Test
3 is significantly higher after modifications performed at ISOR. In Figure 33 and Figure 34, the final part of
the test, with the complete failure of the coupling, is reported and compared.
In agreement with the client, the procedure for the final failure of Test 3 was carried out slightly different
than Test 1 and Test 2. For Test 1 and Test 2 the loading was increased stepwise (500kN load increase) and
kept at the reached value for a minimum time of 60 seconds. For Test 3 the loading was carried out
monotonically until failure.
Table 4: Failure loads
Sample Failure Load [kN]
Test 1 1837
Test 2 1926
Test 3 3135
Figure 33. Force envelopes for the final failure of Test 1 (S1), Test 2 (S2) and Test 3 (S3).
Figure 34. Strain envelopes for the final failure of Test 1 (S1), Test 2 (S2) and Test 3 – average strain
measurements at each location.

PROJECT NO. 102014946
REPORT NO. 2017:00254
VERSION 04
27 of 27
6 CONCLUSIONS
A prototype for flexible coupling is tested regarding mechanical integrity and leakage. The flexible coupling
is made for a 9⅝" casing.
A Test Procedure, partly based on the standard ISO/PAS 12835:2013(E), was followed. Tension-,
compression- and bending loadings were applied, in combination with internal pressure. The ranges were
1000 kN tension, 2000 kN compression, 0.33° bending over 2m (coupling in the centre) and 165 bars
pressure (water filled). Finally the coupling was tensioned until rupture. The tests were performed at room
temperature.
Three parallel tests were performed, and the obtained results are consistent. The mechanical integrity is
considered acceptable by means of:
The 20mm of axial sliding of the coupling worked well throughout the Test Procedure for the tests.
o The force for sliding was about 200kN for Test 1 and about 300kN for Test 2 and Test 3.
The obtained sliding forces did not present any variation even when bending was applied to
the coupling.
No damage or plastic deformations was identified during the tests before the final rupture test.
The rupture type of Test 1 and Test 2 are shear fractures of the safety pins, occurring at tension
forces 1837kN and 1926kN respectively
The rupture force of Test 3 was 3135kN when the moving part of the coupling was pulled out. Initial
local yielding inside the coupling started at about 2200kN
A small leakage rate (<0.05 mL/min) was found from the threads on the fixed side of the coupling. Higher
leakage rates was found from the threads on the moving side of the coupling, ranging from 0 up to 12.5
mL/min. The maximum recommended limits of the referred test standard are 1 mL/min under compression
loads and 10 mL/min under tension- or bending loads. However, the requirements for high
temperature geothermal applications still remain to be defined.
Leakages from the safety pins and the circumferential transition of the coupling were significantly higher
than the standard requirement. For Test 3 the flow rate through the circumferential transition was several
litres per minute.
7 REFERENCES
/1/ Test standard ISO/PAS 12835:2013(E).
/2/ Geowell, Technical Report. Gunnar Skúlason Kaldal, Bjarni Steinar Gunnarsson "Guidelines for
Make-up Torque and Testing Procedure for Flexible Couplings", version 2.0, March 2017.
/3/ Geowell, Deliverable D4.1. Gunnar Skúlason Kaldal "Prototype design of Flexible Coupling",
version 1.0, November 2016.
/4/ ISOR Report. Bjarni Steinar Gunnarsson, Ingólfur Þorbjörnsson, Gunnar Skúlason Kaldal "Testing
of the Flexible Coupling", ISOR Report No ÍSOR-2016/059, September 2016.
PROJECT NO. 102014946
REPORT NO. 2017:00254
VERSION 04
A - 1
Appendix A
SINTEFs practical interpretation of the Test Procedure

PROJECT NO. 102014946
REPORT NO. 2017:00254
VERSION 04
A - 2
Phase Action Details
1
Axia
l
ten
sio
n 1.1 In open position:
1.1.1 Pull with a machine displacement rate of 2mm/min
1.1.2 Stop when the load has reached +500±50 kN
2
Axia
l co
mp
res
sio
n
2.1 In open position: 2.1.1 Release tension with a machine
displacement rate of 2mm/min 2.1.2 Stop when the load has reached 0±50 kN;
compensate to keep the load constant (every minute)
2.1.3 Zero Coupling LVDT measure (reference zero position for the coupling)
2.1.4 Pressurize with water to 16.5±0.25 MPa and hold for 15 min
2.1.5 Depressurize in open water channel 2.2 While closing:
2.2.1 Compress at machine displacement rate of 2 mm/min
2.2.2 Stop when reach 20 mm displacement measured at the coupling LDVT
2.2.3 Pressurize with water to 16.5±0.25 MPa and hold for 15 min
2.2.4 Depressurize in open water channel 2.3 In closed position:
2.3.1 Compress with a machine displacement rate of 2mm/min
2.3.2 Stop when the load has reached -1000±50 kN - compensate to keep the load constant (every minute)
2.3.3 Pressurize with water to 16.5±0.25 MPa and hold for 15 min 1
2.3.4 Depressurize in open water channel 2.3.5 Compress with a machine displacement rate of
2mm/min 2.3.6 Stop when the load has reached -2000±50 kN2 -
compensate to keep the load constant (every minute) – Check the average level of strain is approximately 0.11%
2.3.7 Pressurize with water to 16.5±0.25 MPa
and hold for 15 min. 3
2.3.8 Depressurize and open water channel
1 If no leakage is detected in 2.2.3 then 2.3.3 and 2.3.4 can be skipped and compression can be continued, according to 2.3.5, after 1 min. stop.
3 If no leakage is detected in 2.3.3 (or if it was skipped) then 2.3.7 and 2.3.8 can be skipped and compression can be released, according to
PROJECT NO. 102014946
REPORT NO. 2017:00254
VERSION 04
A - 3
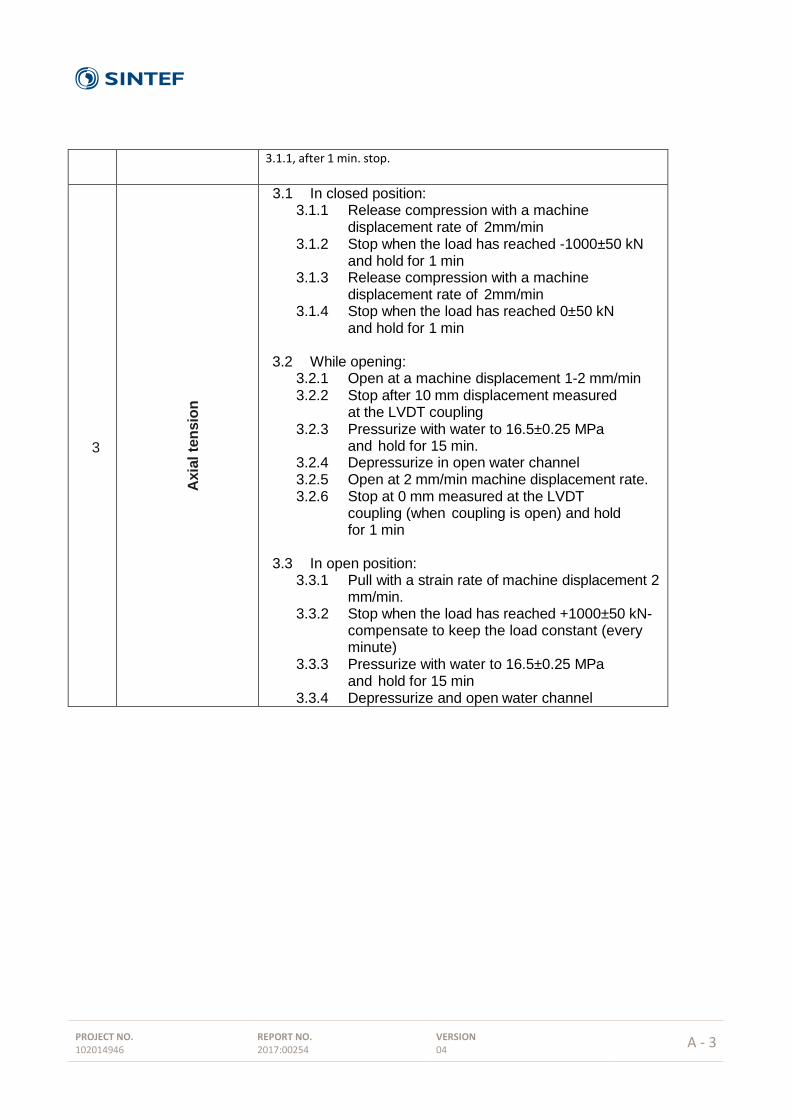
3.1.1, after 1 min. stop.
3
Axia
l te
nsio
n
3.1 In closed position: 3.1.1 Release compression with a machine
displacement rate of 2mm/min 3.1.2 Stop when the load has reached -1000±50 kN
and hold for 1 min 3.1.3 Release compression with a machine
displacement rate of 2mm/min 3.1.4 Stop when the load has reached 0±50 kN
and hold for 1 min
3.2 While opening: 3.2.1 Open at a machine displacement 1-2 mm/min 3.2.2 Stop after 10 mm displacement measured
at the LVDT coupling 3.2.3 Pressurize with water to 16.5±0.25 MPa
and hold for 15 min. 3.2.4 Depressurize in open water channel 3.2.5 Open at 2 mm/min machine displacement rate. 3.2.6 Stop at 0 mm measured at the LVDT
coupling (when coupling is open) and hold for 1 min
3.3 In open position: 3.3.1 Pull with a strain rate of machine displacement 2
mm/min. 3.3.2 Stop when the load has reached +1000±50 kN-
compensate to keep the load constant (every minute)
3.3.3 Pressurize with water to 16.5±0.25 MPa and hold for 15 min
3.3.4 Depressurize and open water channel

PROJECT NO. 102014946
REPORT NO. 2017:00254
VERSION 04
A - 4
4
Axia
l c
om
pre
ssio
n
4.1 In open position:
4.1.1 Release tension with a machine displacement rate of 2mm/min
4.1.2 Stop when the load has reached 0±50 kN; compensate to keep the load constant (every minute)
4.1.3 Pressurize with water to 16.5±0.25 MPa and hold for 15 min
4.1.4 Depressurize in open water channel
4.2 While closing:
4.2.1 Compress at machine displacement rate of 2 mm/min
4.2.2 Stop when reach 10 mm displacement measured at the coupling LDVT
4.2.3 Pressurize with water to 16.5±0.25 MPa and hold for 15 min
4.2.4 Depressurize in open water channel
4.2.5 Compress at machine displacement rate of 2 mm/min
4.2.6 Stop when reach 20 mm displacement measured at the coupling LDVT
4.2.7 Pressurize with water to 16.5±0.25 MPa and hold for 15 min
4.2.8 Depressurize in open water channel
4.3 In closed position: 4.3.1 Compress with a machine displacement rate of 2mm/min
4.3.2 Stop when the load has reached -1000±50 kN - compensate to keep the load constant (every minute) 4.3.3 Pressurize with water to 16.5±0.25 MPa and hold for 15 min 4
4.3.4 Depressurize in open water channel
4.3.4 Compress with a machine displacement rate of 2mm/min 4.3.5 Stop when the load has reached -2000±50 kN- compensate to keep the load constant (every minute) 4.3.6 Pressurize with water to 16.5±0.25 MPa and hold for 15 min 5
4.3.7 Depressurize and open water channel
4 If no leakage is detected in 4.2.7 then 4.3.3 and 4.3.4 can be skipped and compression can be continued, according to 4.3.5, after 1 min. stop. 5 If no leakage is detected in 4.3.3 (or if it was skipped) then 4.3.7 and 4.3.8 can be skipped and compression can be released, according to 5.1.1, after 1 min. stop.

PROJECT NO. 102014946
REPORT NO. 2017:00254
VERSION 04
A - 5
5 A
xia
l te
nsio
n
5.1 In closed position: 5.1.1 Release compression with a machine
displacement rate of 2mm/min 5.1.2 Stop when the load has reached -1000±50 kN
and hold for 1 min 5.1.3 Release compression with a machine
displacement rate of 2mm/min 5.1.4 Stop when the load has reached 0±50 kN
and hold for 1 min
5.2 While opening: 5.2.1 Open with a machine displacement rate of
2mm/min 5.2.2 Stop at 10 mm displacement measured at the
coupling LDVT and hold for 1 min 5.2.3 Open with a machine displacement rate of
2mm/min 5.2.4 Stop at 0 mm with a machine displacement rate
of 2mm/min (when coupling is open) and hold for 1 min
5.3 In open position: 5.3.1 Pull with a machine displacement rate of
2mm/min 5.3.2 Stop when the load has reached +1000±50 kN-
compensate to keep the load constant (every minute)
5.3.3 Pressurize with water to 16.5±0.25 MPa and hold for 15 min
5.3.4 Depressurize and open water channel
PROJECT NO. 102014946
REPORT NO. 2017:00254
VERSION 04
A - 6
6
Co
mp
res
sio
n w
ith
ben
din
g
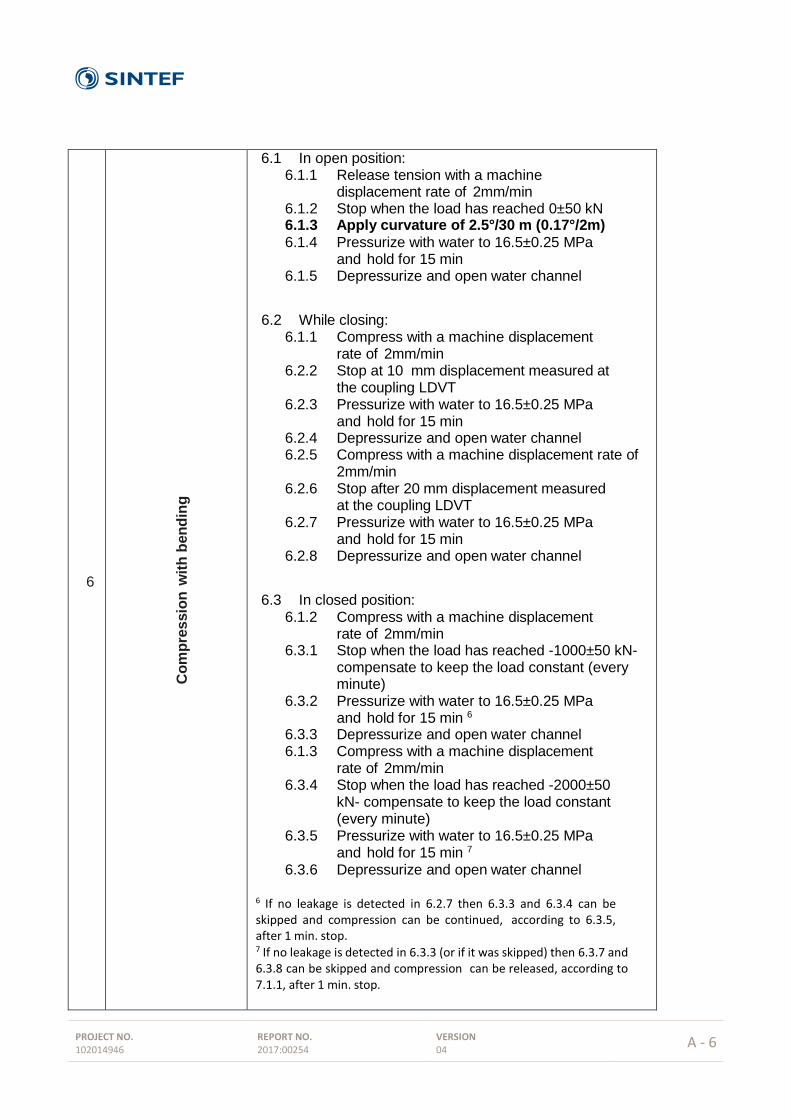
6.1 In open position: 6.1.1 Release tension with a machine
displacement rate of 2mm/min 6.1.2 Stop when the load has reached 0±50 kN 6.1.3 Apply curvature of 2.5°/30 m (0.17°/2m)
6.1.4 Pressurize with water to 16.5±0.25 MPa and hold for 15 min
6.1.5 Depressurize and open water channel
6.2 While closing: 6.1.1 Compress with a machine displacement
rate of 2mm/min 6.2.2 Stop at 10 mm displacement measured at
the coupling LDVT 6.2.3 Pressurize with water to 16.5±0.25 MPa
and hold for 15 min 6.2.4 Depressurize and open water channel 6.2.5 Compress with a machine displacement rate of
2mm/min 6.2.6 Stop after 20 mm displacement measured
at the coupling LDVT 6.2.7 Pressurize with water to 16.5±0.25 MPa
and hold for 15 min 6.2.8 Depressurize and open water channel
6.3 In closed position: 6.1.2 Compress with a machine displacement
rate of 2mm/min 6.3.1 Stop when the load has reached -1000±50 kN-
compensate to keep the load constant (every minute)
6.3.2 Pressurize with water to 16.5±0.25 MPa and hold for 15 min 6
6.3.3 Depressurize and open water channel 6.1.3 Compress with a machine displacement
rate of 2mm/min 6.3.4 Stop when the load has reached -2000±50
kN- compensate to keep the load constant (every minute)
6.3.5 Pressurize with water to 16.5±0.25 MPa and hold for 15 min 7
6.3.6 Depressurize and open water channel 6 If no leakage is detected in 6.2.7 then 6.3.3 and 6.3.4 can be skipped and compression can be continued, according to 6.3.5, after 1 min. stop. 7 If no leakage is detected in 6.3.3 (or if it was skipped) then 6.3.7 and 6.3.8 can be skipped and compression can be released, according to 7.1.1, after 1 min. stop.

PROJECT NO. 102014946
REPORT NO. 2017:00254
VERSION 04
A - 7
7
Ten
sio
n w
ith
be
nd
ing
7.1 In closed position: 7.1.1 Release compression with a machine
displacement rate of 2mm/min 7.1.2 Stop when the load has reached -1000±50 kN
and hold for 1 min 7.1.3 Release compression with a machine
displacement rate of 2mm/min 7.1.4 Stop when the load has reached 0±50 kN
and hold for 1 min
7.2 While opening: 7.2.1 Open with a machine displacement rate of
2mm/min 7.2.2 Stop at 10 mm displacement measured at the
coupling LDVT and hold for 1 min 7.2.3 Open with a machine displacement rate of
2mm/min 7.2.4 Stop at 0 mm with a machine displacement rate
of 2mm/min (when coupling is open) and hold for 1 min
7.3 In open position: 7.3.1 Pull with a machine displacement rate of
2mm/min 7.3.2 Stop when the load has reached +1000±50 kN-
compensate to keep the load constant (every minute)
7.3.3 Pressurize with water to 16.5±0.25 MPa and hold for 15 min
7.3.4 Depressurize and open water channel
PROJECT NO. 102014946
REPORT NO. 2017:00254
VERSION 04
A - 8
8
Co
mp
res
sio
n w
ith
ben
din
g
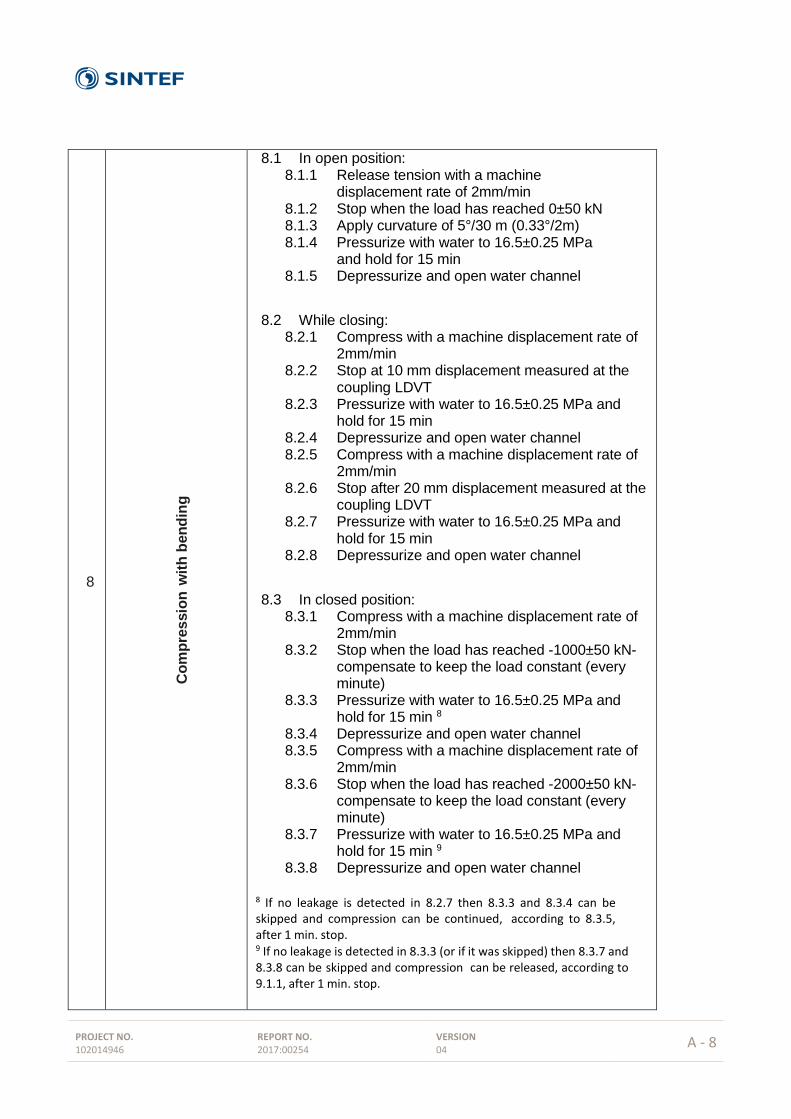
8.1 In open position: 8.1.1 Release tension with a machine
displacement rate of 2mm/min 8.1.2 Stop when the load has reached 0±50 kN 8.1.3 Apply curvature of 5°/30 m (0.33°/2m) 8.1.4 Pressurize with water to 16.5±0.25 MPa
and hold for 15 min 8.1.5 Depressurize and open water channel
8.2 While closing: 8.2.1 Compress with a machine displacement rate of
2mm/min 8.2.2 Stop at 10 mm displacement measured at the
coupling LDVT 8.2.3 Pressurize with water to 16.5±0.25 MPa and
hold for 15 min 8.2.4 Depressurize and open water channel 8.2.5 Compress with a machine displacement rate of
2mm/min 8.2.6 Stop after 20 mm displacement measured at the
coupling LDVT 8.2.7 Pressurize with water to 16.5±0.25 MPa and
hold for 15 min 8.2.8 Depressurize and open water channel
8.3 In closed position: 8.3.1 Compress with a machine displacement rate of
2mm/min 8.3.2 Stop when the load has reached -1000±50 kN-
compensate to keep the load constant (every minute)
8.3.3 Pressurize with water to 16.5±0.25 MPa and hold for 15 min 8
8.3.4 Depressurize and open water channel 8.3.5 Compress with a machine displacement rate of
2mm/min 8.3.6 Stop when the load has reached -2000±50 kN-
compensate to keep the load constant (every minute)
8.3.7 Pressurize with water to 16.5±0.25 MPa and hold for 15 min 9
8.3.8 Depressurize and open water channel
8 If no leakage is detected in 8.2.7 then 8.3.3 and 8.3.4 can be skipped and compression can be continued, according to 8.3.5, after 1 min. stop. 9 If no leakage is detected in 8.3.3 (or if it was skipped) then 8.3.7 and 8.3.8 can be skipped and compression can be released, according to 9.1.1, after 1 min. stop.
PROJECT NO. 102014946
REPORT NO. 2017:00254
VERSION 04
A - 9
9
Ten
sio
n w
ith
be
nd
ing
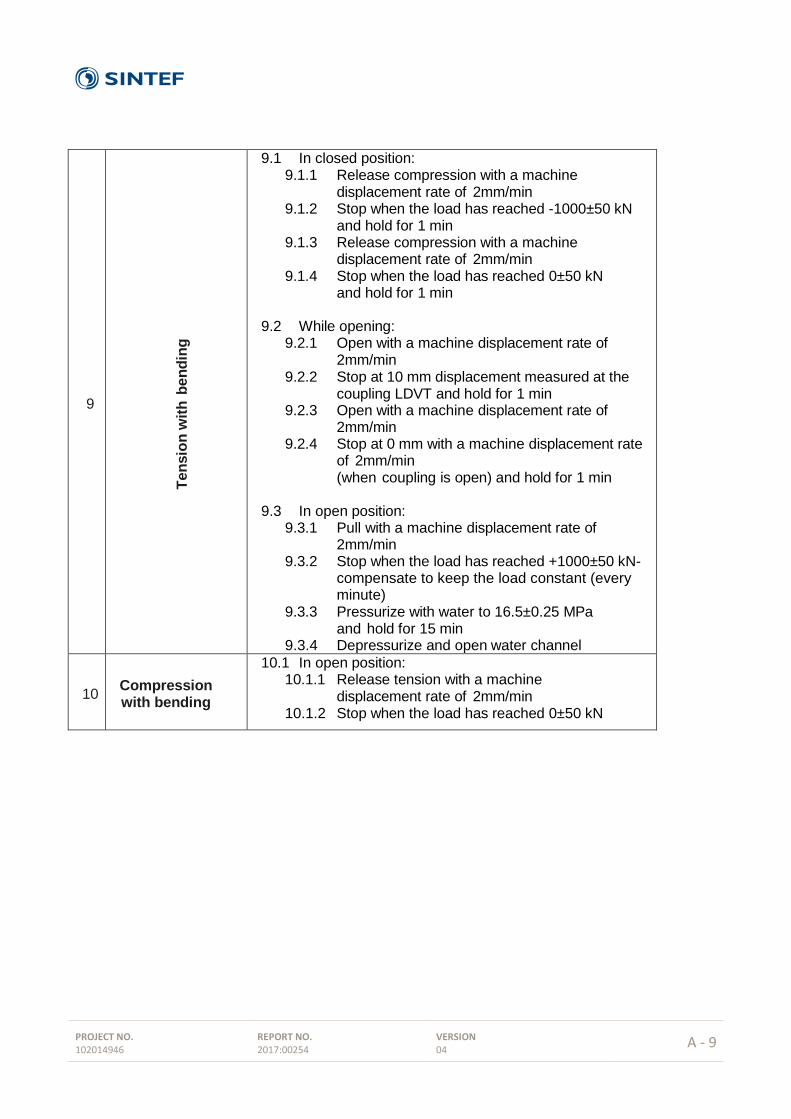
9.1 In closed position: 9.1.1 Release compression with a machine
displacement rate of 2mm/min 9.1.2 Stop when the load has reached -1000±50 kN
and hold for 1 min 9.1.3 Release compression with a machine
displacement rate of 2mm/min 9.1.4 Stop when the load has reached 0±50 kN
and hold for 1 min
9.2 While opening: 9.2.1 Open with a machine displacement rate of
2mm/min 9.2.2 Stop at 10 mm displacement measured at the
coupling LDVT and hold for 1 min 9.2.3 Open with a machine displacement rate of
2mm/min 9.2.4 Stop at 0 mm with a machine displacement rate
of 2mm/min (when coupling is open) and hold for 1 min
9.3 In open position: 9.3.1 Pull with a machine displacement rate of
2mm/min 9.3.2 Stop when the load has reached +1000±50 kN-
compensate to keep the load constant (every minute)
9.3.3 Pressurize with water to 16.5±0.25 MPa and hold for 15 min
9.3.4 Depressurize and open water channel
10 Compression with bending
10.1 In open position: 10.1.1 Release tension with a machine
displacement rate of 2mm/min 10.1.2 Stop when the load has reached 0±50 kN
PROJECT NO. 102014946
REPORT NO. 2017:00254
VERSION 04
A - 10
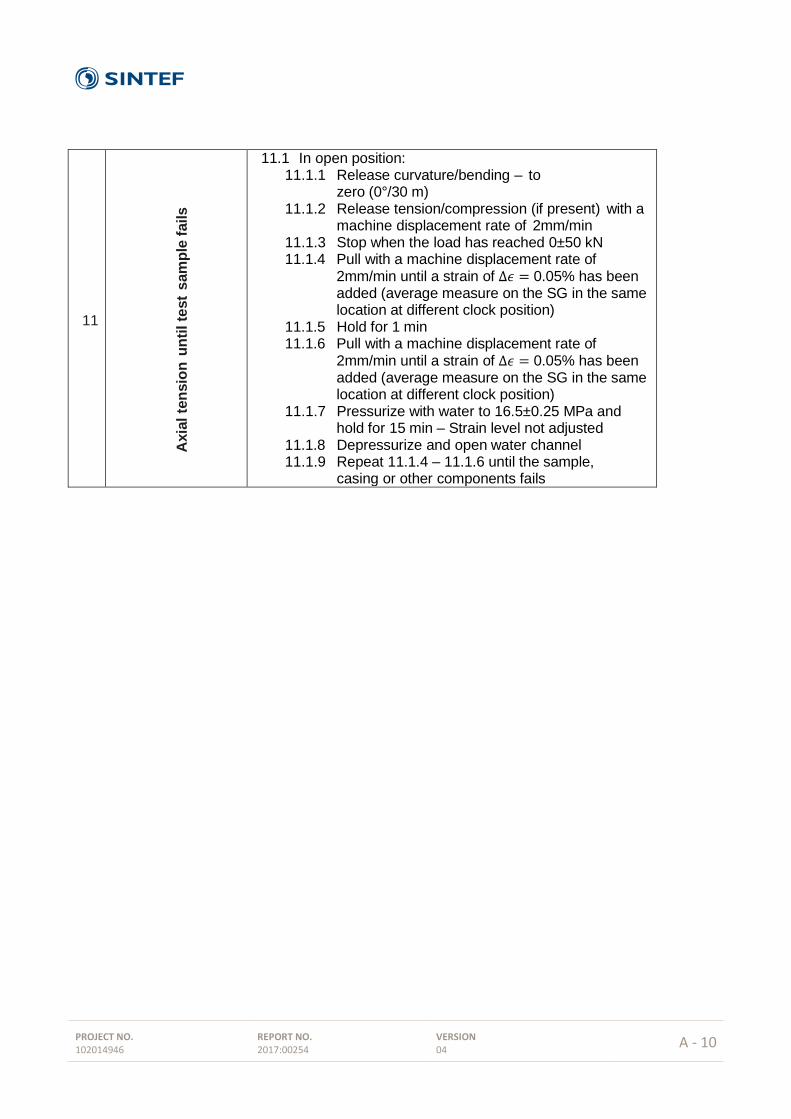
11
Axia
l te
nsio
n u
nti
l te
st
sam
ple
fails
11.1 In open position: 11.1.1 Release curvature/bending – to
zero (0°/30 m) 11.1.2 Release tension/compression (if present) with a
machine displacement rate of 2mm/min 11.1.3 Stop when the load has reached 0±50 kN 11.1.4 Pull with a machine displacement rate of
2mm/min until a strain of Δ𝜖 = 0.05% has been added (average measure on the SG in the same location at different clock position)
11.1.5 Hold for 1 min 11.1.6 Pull with a machine displacement rate of
2mm/min until a strain of Δ𝜖 = 0.05% has been added (average measure on the SG in the same location at different clock position)
11.1.7 Pressurize with water to 16.5±0.25 MPa and hold for 15 min – Strain level not adjusted
11.1.8 Depressurize and open water channel 11.1.9 Repeat 11.1.4 – 11.1.6 until the sample,
casing or other components fails

PROJECT NO. 102014946
REPORT NO. 2017:00254
VERSION 04
B - 1
Appendix B
Details of the instrumentation and calibrations

PROJECT NO. 102014946
REPORT NO. 2017:00254
VERSION 04
B - 2
Total applied load calculation
The test rig is not equipped for direct measurement of the applied tensile force; the load is calculated by
measuring the oil pressure in the three double acting cylinders of the test rig (two in the top and one in the
bottom of the test rig).
The pressure values are measure on both faces of each piston by using two separate HBM pressure sensors.
The calibration data for each of the pressure sensors is reported in the attached appendix.
The test rig presents in total three hydraulic cylinders:
Top side: two identical cylinders with piston radius of Rpt=180mm and rod radius of Rrt=90mm
More details in the appendix.
Bottom side: single cylinder with internal diameters of Rpb =280mm and Rrb =120mm. More
details in the appendix
Top Cylinders (for single cylinder)
Area of the piston side 𝐴1𝑡 = 𝜋 × 𝑅𝑝𝑡2 = 𝜋 × 1802 = 101787 𝑚𝑚2
Area of the rod side 𝐴2𝑡 = 𝐴2𝑡 − [𝜋 × 𝑅𝑟𝑡2] = 101787 − [𝜋 × 902] = 76340 𝑚𝑚2
Force (considering P1t and P2t the pressure value) 𝐹𝑡𝑜𝑝 = (𝐴1𝑡 × 𝑃1𝑡) − (𝐴2𝑡 × 𝑃2𝑡)
Bottom Cylinder
Area of the piston side 𝐴1𝑏 = 𝜋 × 𝑅𝑝𝑏2 = 𝜋 × 2802 = 246300 𝑚𝑚2
Area of the rod side 𝐴2𝑏 = 𝐴2𝑏 − [𝜋 × 𝑅𝑟𝑏2] = 246300 − [𝜋 × 1202] = 201061 𝑚𝑚2
Force (considering P1b and P2b the pressure value) 𝐹𝑏𝑜𝑡𝑡𝑜𝑚 = (𝐴1𝑏 × 𝑃1𝑏) − (𝐴2𝑏 × 𝑃2𝑏)
Total force
𝐹 = (2 × 𝐹𝑡𝑜𝑝) + 𝐹𝑏𝑜𝑡𝑡𝑜𝑚
PROJECT NO. 102014946
REPORT NO. 2017:00254
VERSION 04
B - 3

PROJECT NO. 102014946
REPORT NO. 2017:00254
VERSION 04
B - 4

PROJECT NO. 102014946
REPORT NO. 2017:00254
VERSION 04
B - 5
Calibration certificate
Machine pressure sensors

PROJECT NO. 102014946
REPORT NO. 2017:00254
VERSION 04
B - 6
PROJECT NO. 102014946
REPORT NO. 2017:00254
VERSION 04
B - 7
Inclinomenters
PROJECT NO. 102014946
REPORT NO. 2017:00254
VERSION 04
B - 8

PROJECT NO. 102014946
REPORT NO. 2017:00254
VERSION 04
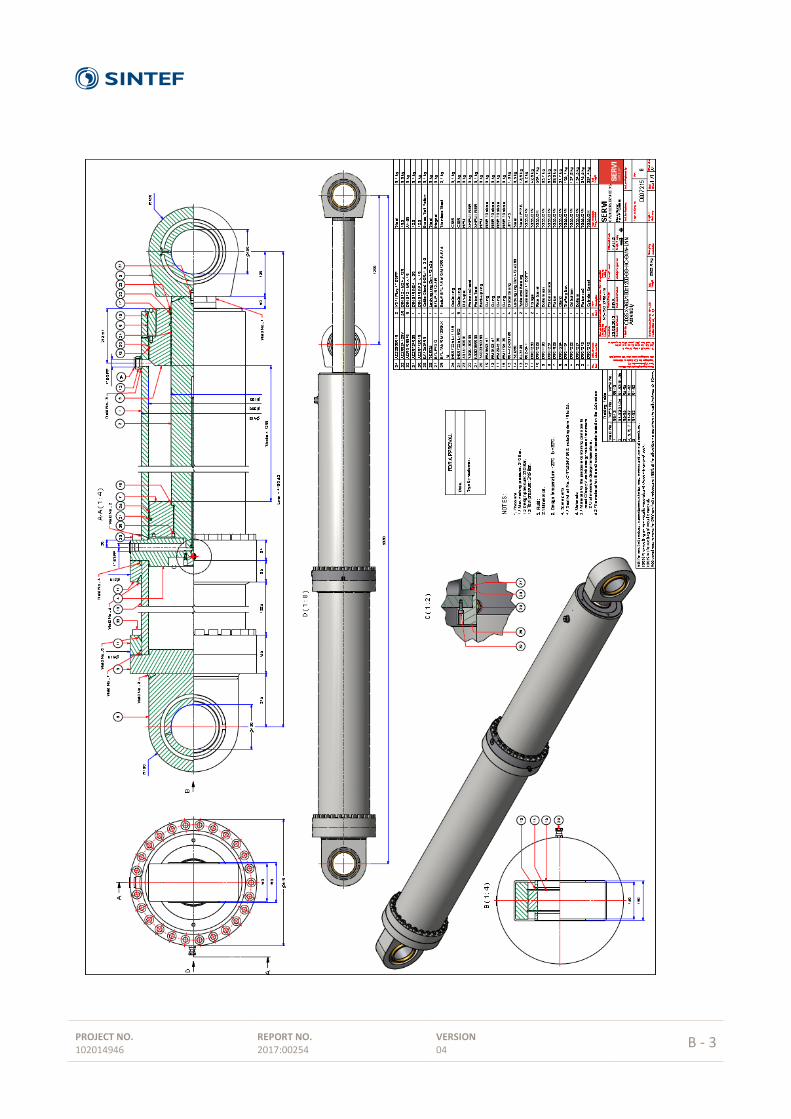
C - 1
Appendix C
Geometry, dimensions and fabrication of test specimens and fixtures
PROJECT NO. 102014946
REPORT NO. 2017:00254
VERSION 04
C - 2
PROJECT NO. 102014946
REPORT NO. 2017:00254
VERSION 04
C - 3
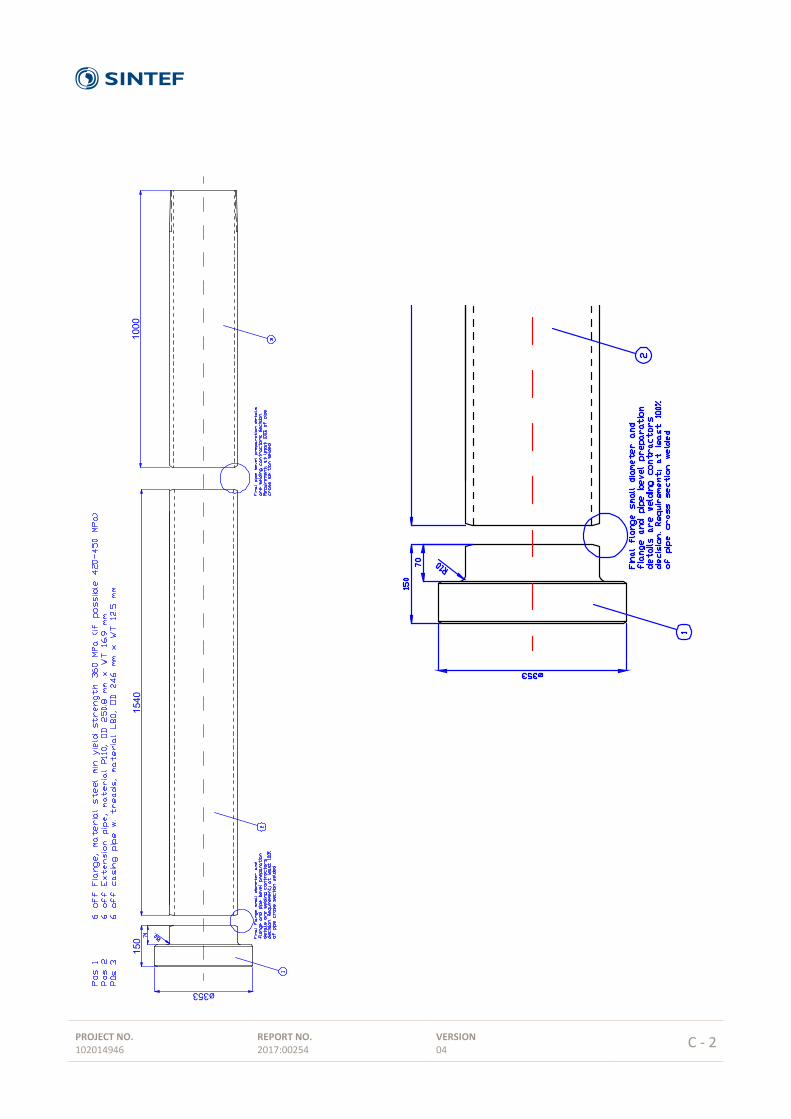
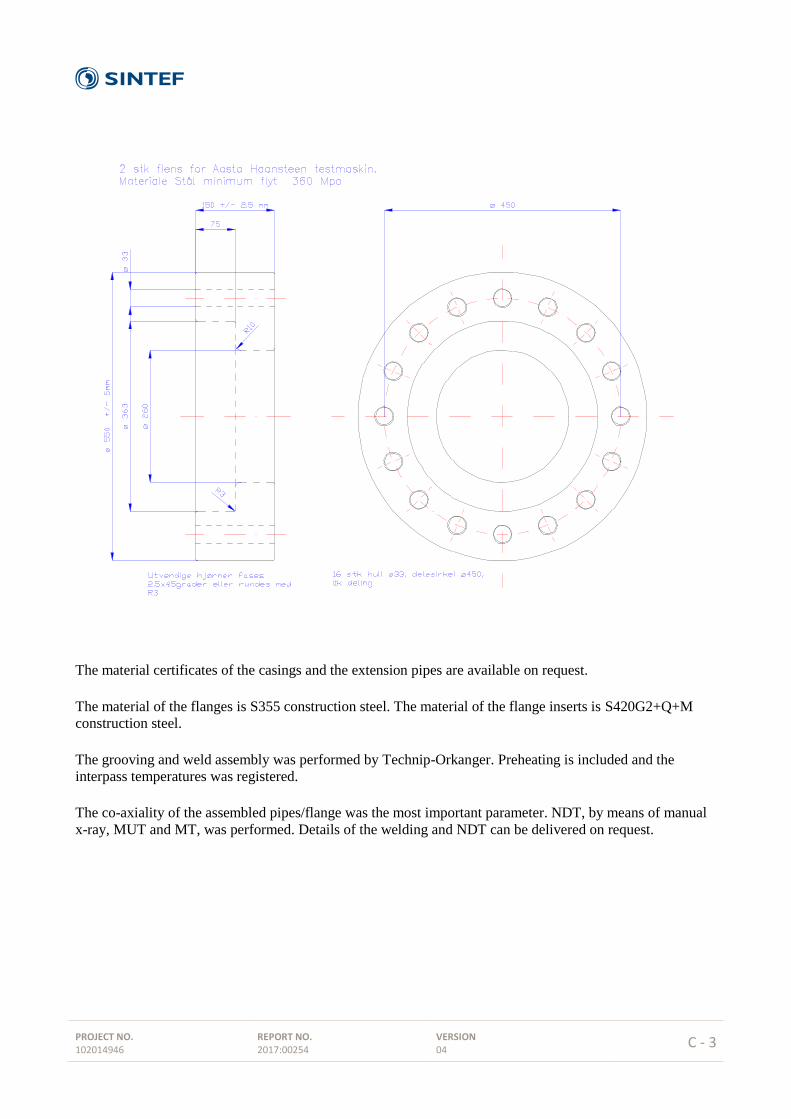
The material certificates of the casings and the extension pipes are available on request.
The material of the flanges is S355 construction steel. The material of the flange inserts is S420G2+Q+M
construction steel.
The grooving and weld assembly was performed by Technip-Orkanger. Preheating is included and the
interpass temperatures was registered.
The co-axiality of the assembled pipes/flange was the most important parameter. NDT, by means of manual
x-ray, MUT and MT, was performed. Details of the welding and NDT can be delivered on request.
PROJECT NO. 102014946
REPORT NO. 2017:00254
VERSION 04
D - 1
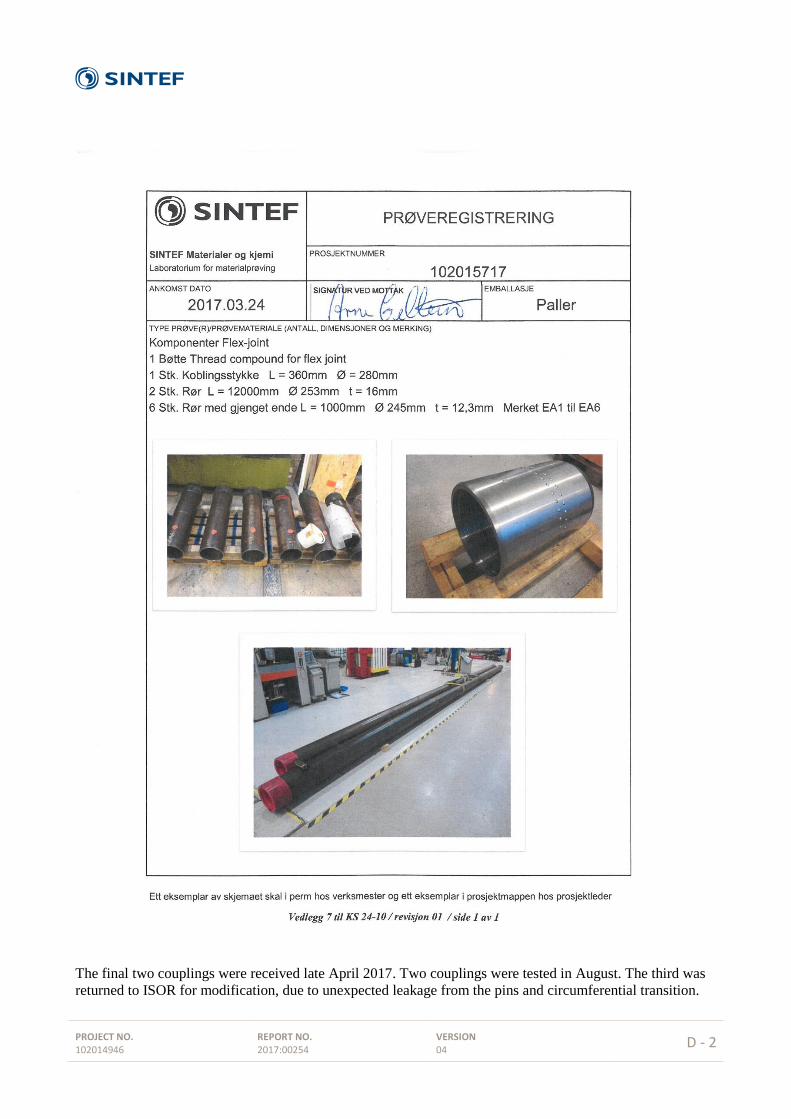
Appendix D
Receipt of testing material
PROJECT NO. 102014946
REPORT NO. 2017:00254
VERSION 04
D - 2
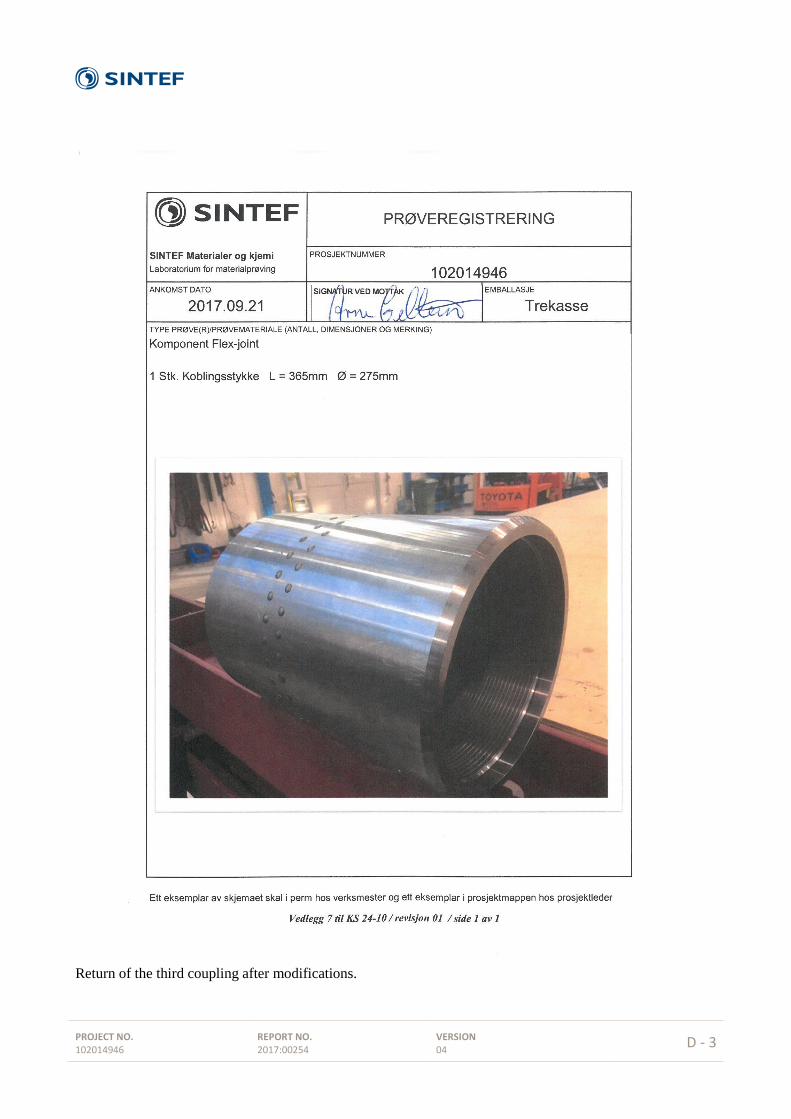
The final two couplings were received late April 2017. Two couplings were tested in August. The third was
returned to ISOR for modification, due to unexpected leakage from the pins and circumferential transition.
PROJECT NO. 102014946
REPORT NO. 2017:00254
VERSION 04
D - 3
Return of the third coupling after modifications.

PROJECT NO. 102014946
REPORT NO. 2017:00254
VERSION 04
E - 1
Appendix E
Detailed results of the Strain Gauges
PROJECT NO. 102014946
REPORT NO. 2017:00254
VERSION 04
E - 2
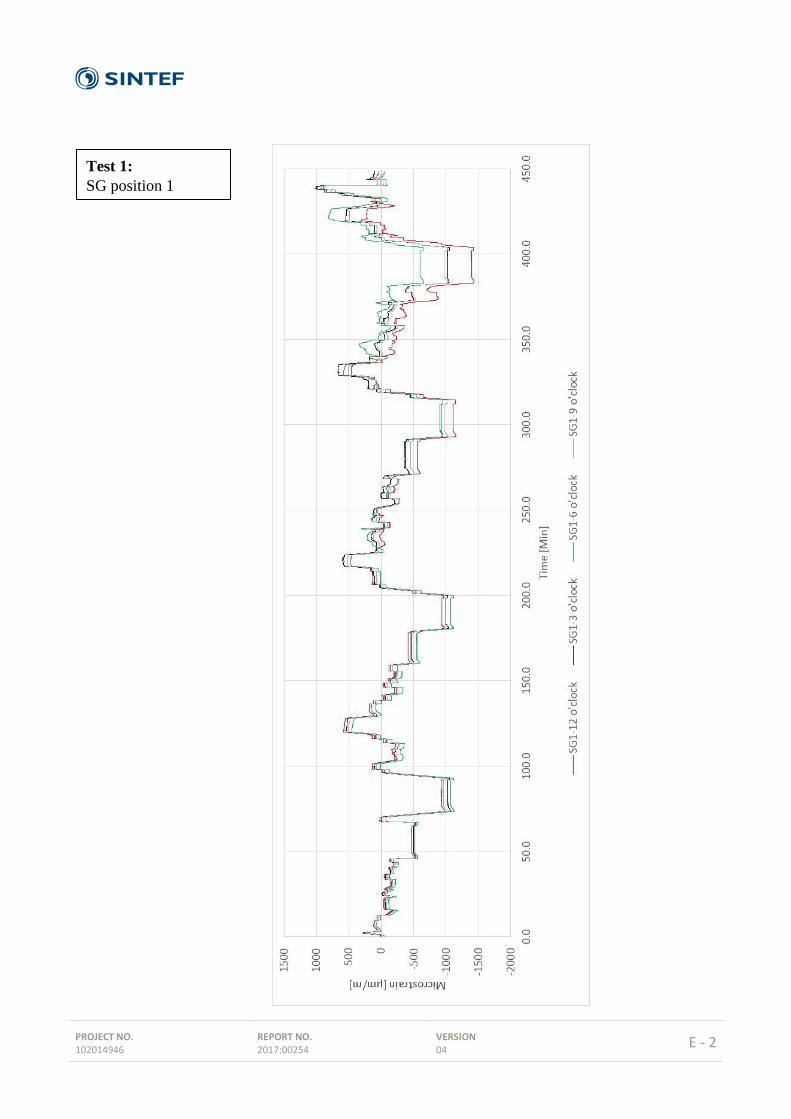
Test 1:
SG position 1
PROJECT NO. 102014946
REPORT NO. 2017:00254
VERSION 04
E - 3
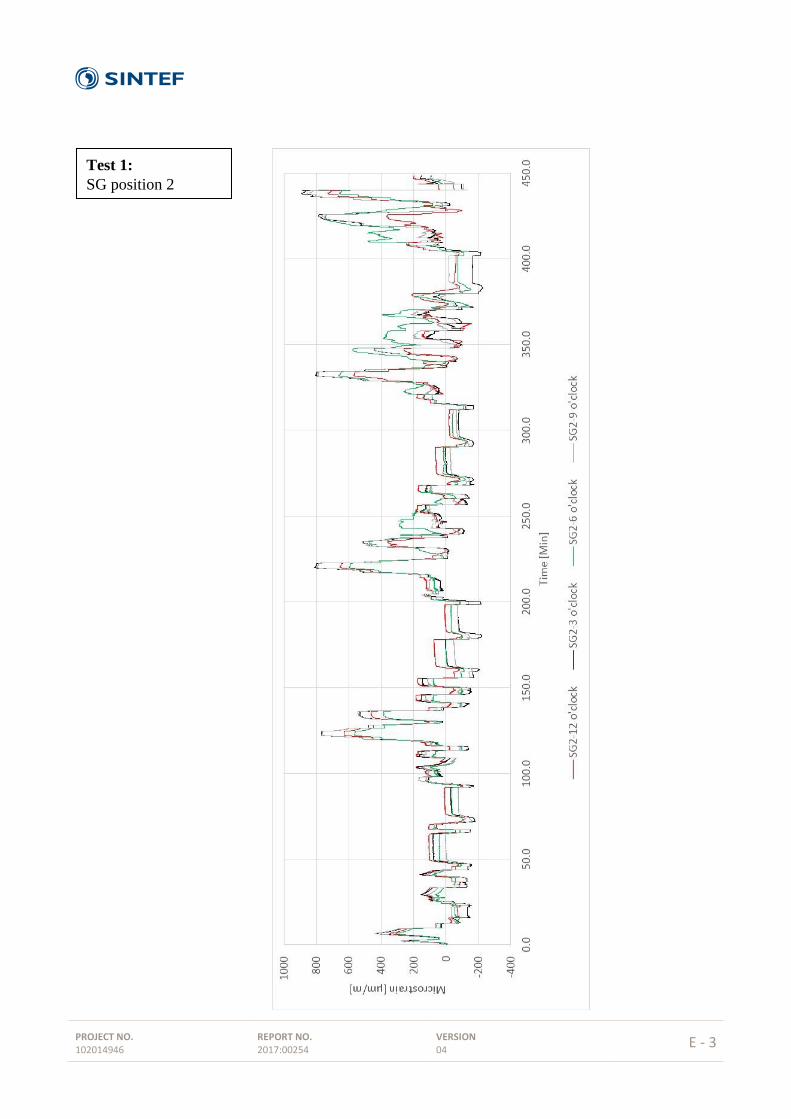
Test 1:
SG position 2
PROJECT NO. 102014946
REPORT NO. 2017:00254
VERSION 04
E - 4
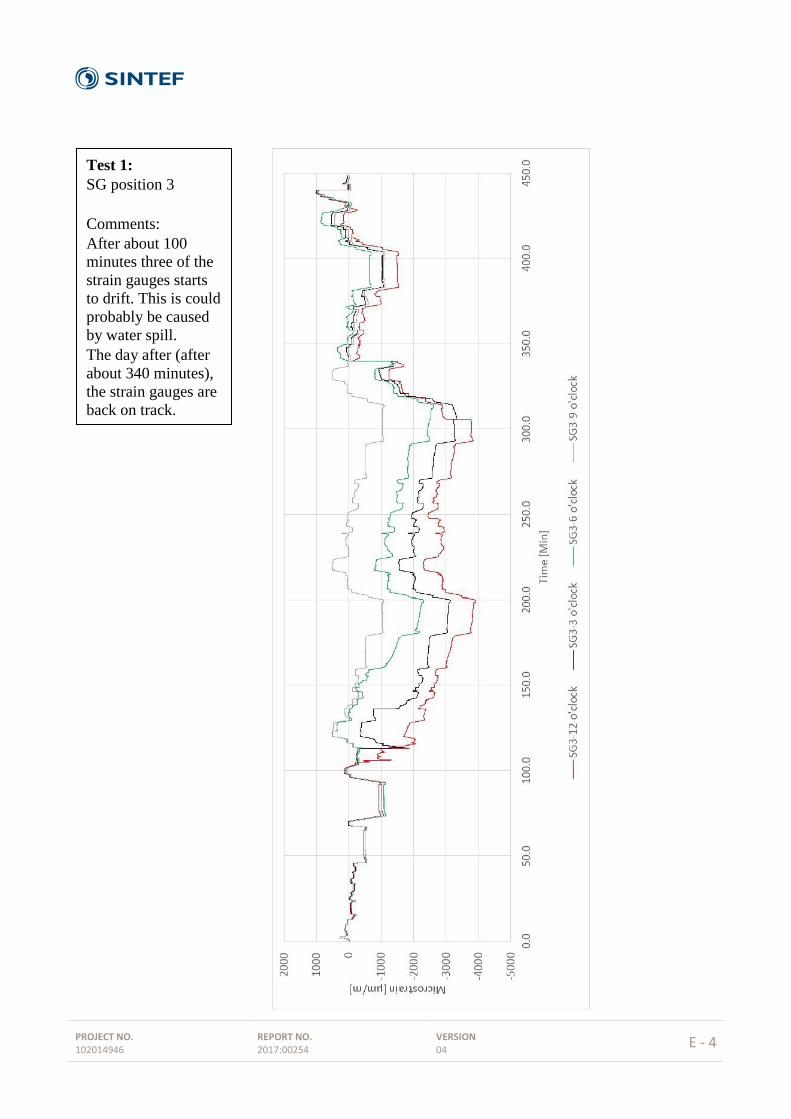
Test 1:
SG position 3
Comments:
After about 100
minutes three of the
strain gauges starts
to drift. This is could
probably be caused
by water spill.
The day after (after
about 340 minutes),
the strain gauges are
back on track.

PROJECT NO. 102014946
REPORT NO. 2017:00254
VERSION 04
E - 5
Test 2:
SG position 1
Comments:
The 3 o'clock strain
gauge seems to have
wrong amplification.
However, this has
been checked out,
and it is other
unknown error has
occurred.
PROJECT NO. 102014946
REPORT NO. 2017:00254
VERSION 04
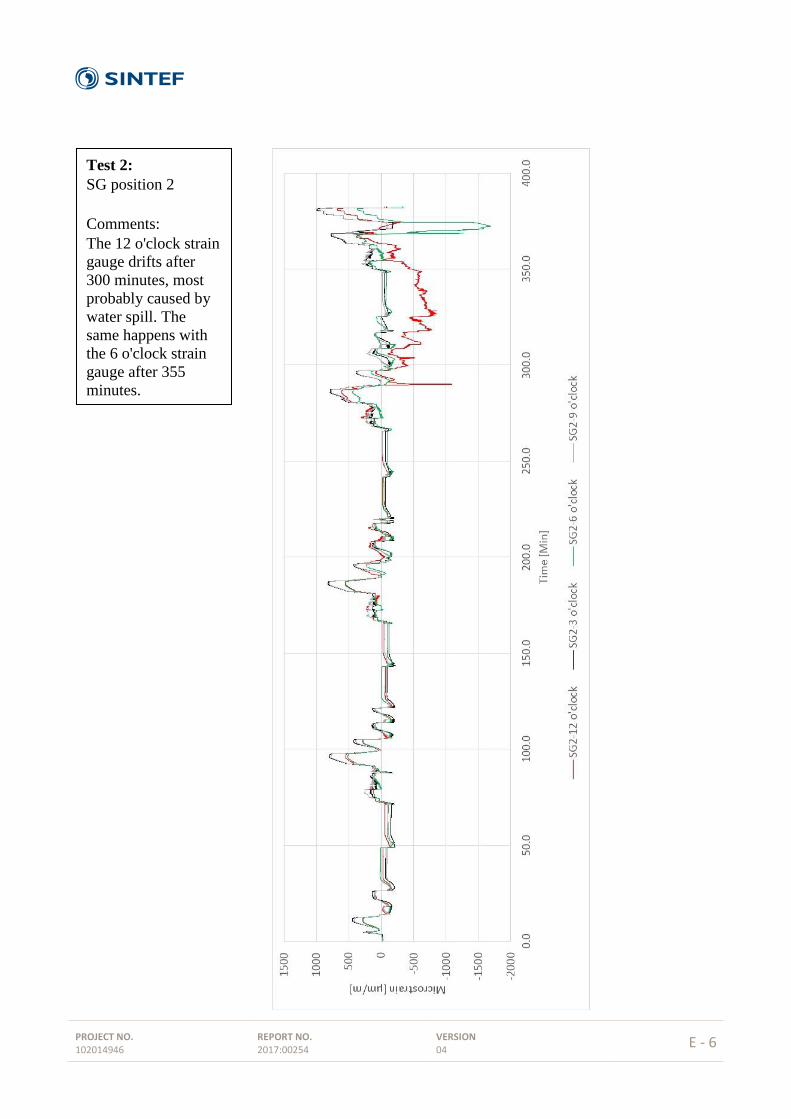
E - 6
Test 2:
SG position 2
Comments:
The 12 o'clock strain
gauge drifts after
300 minutes, most
probably caused by
water spill. The
same happens with
the 6 o'clock strain
gauge after 355
minutes.

PROJECT NO. 102014946
REPORT NO. 2017:00254
VERSION 04
E - 7
Test 2:
SG position 3
Comments:
Unknown
error/deviation on
the 3 o'clock strain
gauge between 340
and 355 minutes.

PROJECT NO. 102014946
REPORT NO. 2017:00254
VERSION 04
E - 8
Test 3:
SG position 1
Comments:
Spikes on SG1 6
o'clock due to water
leakage.

PROJECT NO. 102014946
REPORT NO. 2017:00254
VERSION 04
E - 9
Test 3:
SG position 2
PROJECT NO. 102014946
REPORT NO. 2017:00254
VERSION 04
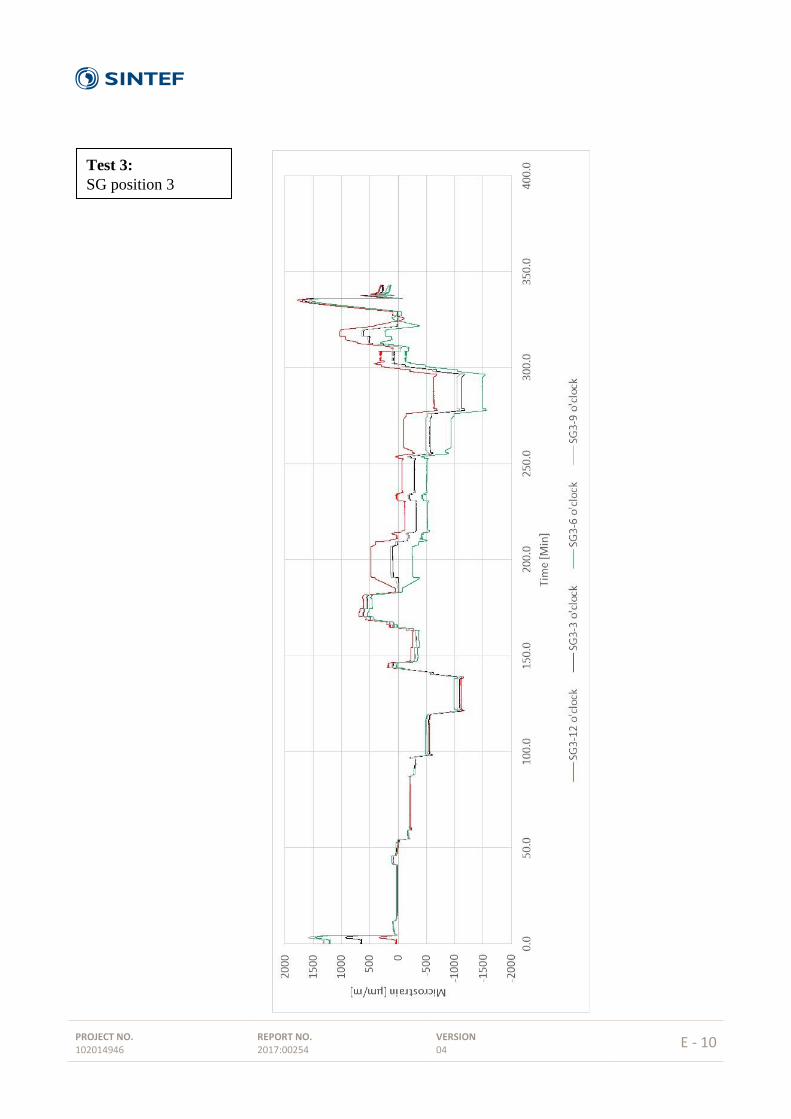
E - 10
Test 3:
SG position 3

Technology for a better society
www.sintef.no