test item analysis: i have it…. now what do i … analysis: what is it? numerical method for...
TRANSCRIPT

TEST ITEM ANALYSIS:I HAVE IT…. NOW WHAT DO I DO WITH IT???
PNEG 2013Carol J Green, PhD, CNS, MN, CNEGraceland University, Independence, [email protected]

Objectives
By the end of this presentation, participants will be able to: Interpret test analysis results to determine
overall test performance. Interpret test analysis results to determine test
item level of difficulty (p) and discrimination (D).
Use test analysis results to determine the need for test item revision.
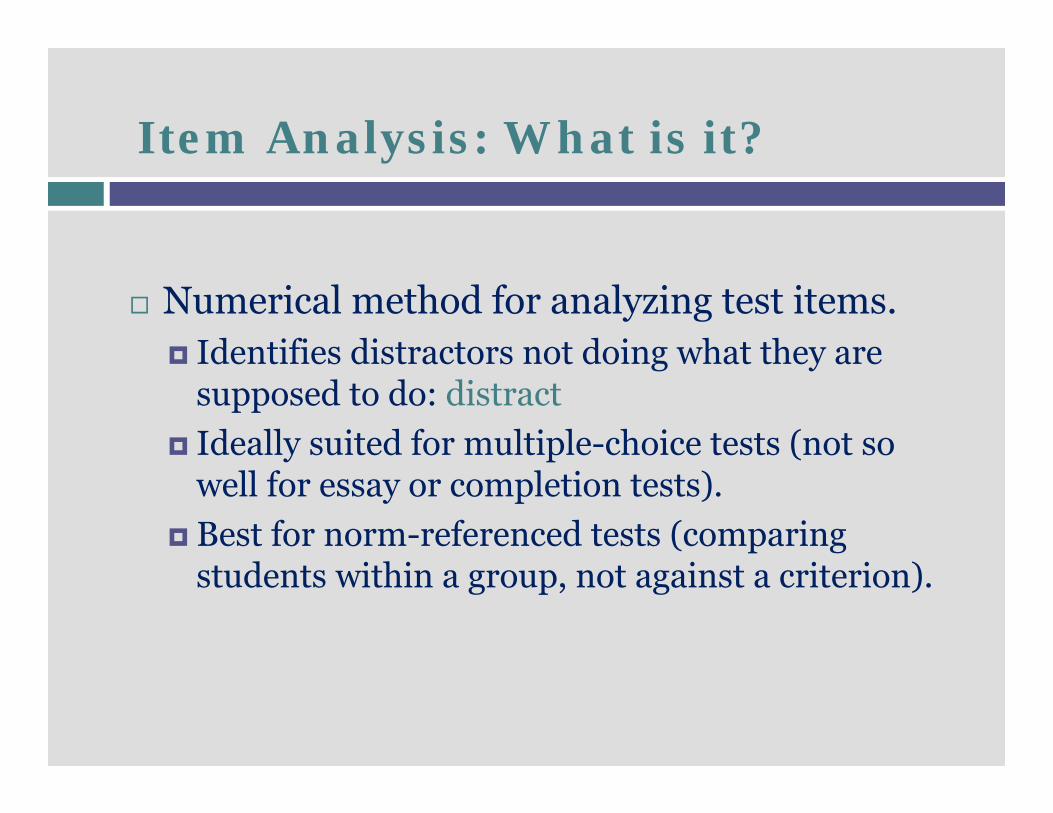
Item Analysis: What is it?
Numerical method for analyzing test items. Identifies distractors not doing what they are
supposed to do: distract Ideally suited for multiple-choice tests (not so
well for essay or completion tests). Best for norm-referenced tests (comparing
students within a group, not against a criterion).
Item Analysis: Purpose
Test student comprehension/knowledge of material as accurately as possible
Improve the overall test Identify deficient test items to:Improve themEliminate them

Test Reliability: Kuder-Richardson
Estimate of test internal consistency Would the same items test the same on
different forms of the test? Would the test yield the same or similar
scores consistently (all things being equal).
Reliability differs from validity. Validity refers to: the test measuring what it is supposed to measure (Does it address instructional objectives?)

Kuder-Richardson
KR-20 formula considers:Number of items on the testStudent performance on each test itemVariance between/among test items

Test Reliability:
Chronbach’s alphaAlso known as coefficient alphaBest measures surveys or attitude data
(no right/wrong answer)

Step One: the test
Analyze the test as a whole
Review the KR-20 How reliable was the test?
Look at the mean score How high did the class score as a whole?
Look to see how many questions everyone got right (100%)! Was the test too easy? (More on that later).

KR-20: (need to know)
• KR-20 range: 0.00 – 1.00
• Values near 0.00 – measure many unknown factors, but not what you wanted to measure: score consistency.
• Values near 1.00 – closely measure a single factor –score consistency.
• Take-Away: A high KR-20 indicates reliable (consistent) student scores. A KR-20 score of 0.60 or higher is desirable.
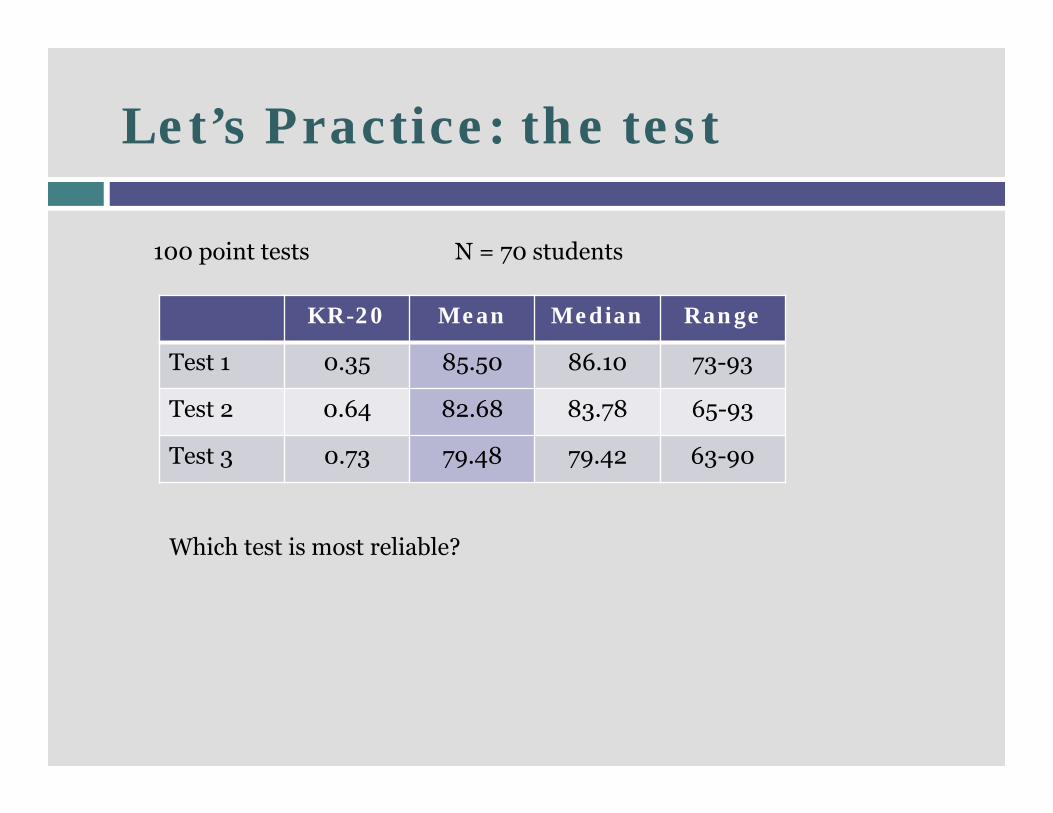
Let’s Practice: the test
KR-20 Mean Median Range
Test 1 0.35 85.50 86.10 73-93
Test 2 0.64 82.68 83.78 65-93
Test 3 0.73 79.48 79.42 63-90
100 point tests N = 70 students
Which test is most reliable?

Step 2: Analyze test items
Now that you’ve analyzed the test as a whole, you need to review individual test items.
Two very important item analysis components: Difficulty Index (p-value) Discrimination Index (D) also known as point biserial

Item Analysis: Difficulty Index (p-value)
p = total number of students selecting correct answer (24) total number of students who answered the item (30)
Item #1 A B C* D2 0 24 4
p = 24 = 0.80 (rule: the higher the p value, the 30 easier the test item)
What do you observe about this test item?
Moderately easy (80% of students got it right) “B” needs to be modified or replaced “A” is suspect.
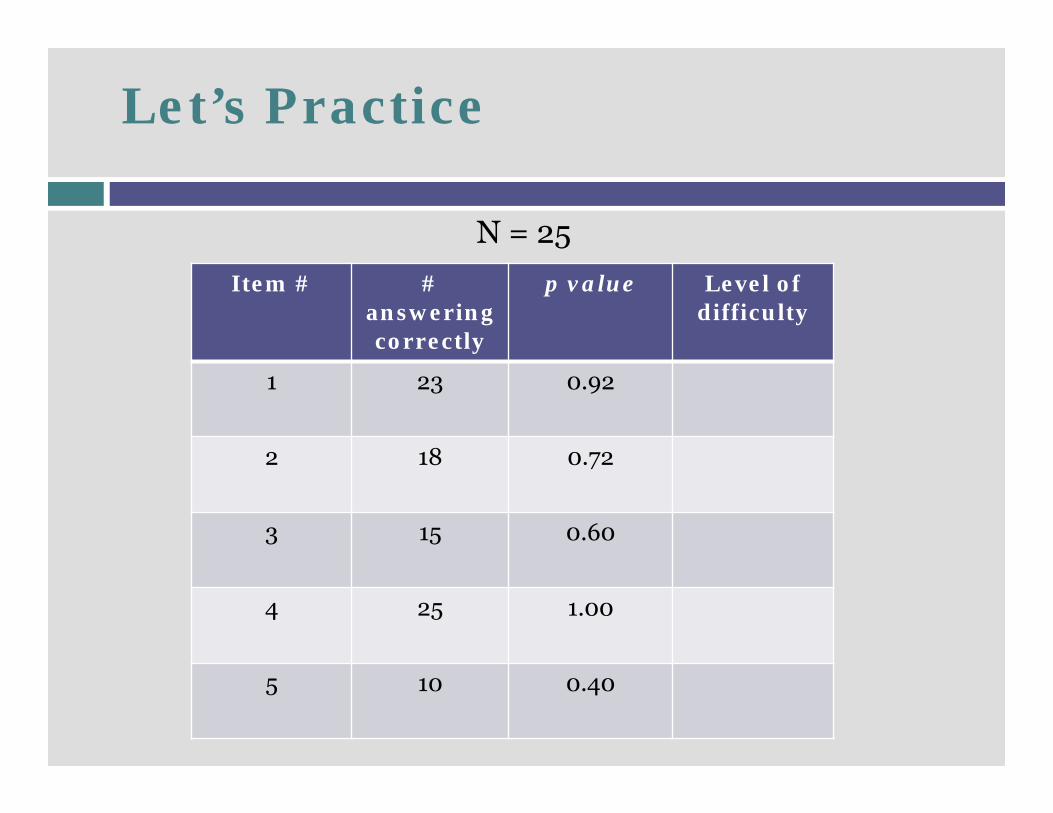
Let’s Practice
Item # # answering correctly
p value Level of difficulty
1 23 0.92
2 18 0.72
3 15 0.60
4 25 1.00
5 10 0.40
N = 25

Item Difficulty: p-value (need to know)
Range: 0.00 – 1.00
Values near 0.00 (0.10 or 10%): difficult test item; more students answered the item incorrectly than correctly.
Values near 1.00 (0.90 or 90%): easy test item; more students answered the item correctly than incorrectly.
Take-Away: Ideally, items should have p-values that range between 0.4 (40%) -0.6 (60%) (relatively difficult). Note: Oermann & Gaberson: 0.3 (30%) -0.7 (0.70%) for norm-referenced exams
Note: Very difficult and very easy items affect discrimination values (D) because they do not discriminate well (e.g. everyone gets the item correct or incorrect).
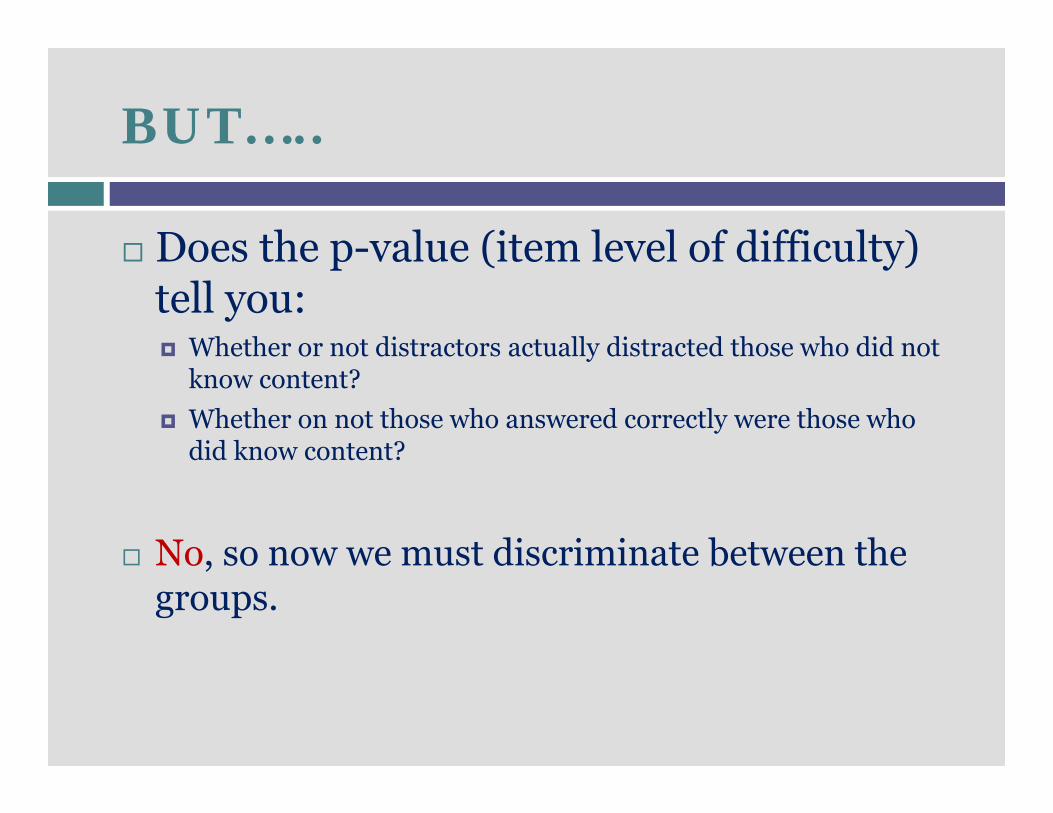
BUT…..
Does the p-value (item level of difficulty) tell you: Whether or not distractors actually distracted those who did not
know content? Whether on not those who answered correctly were those who
did know content?
No, so now we must discriminate between the groups.

Item Discrimination: Point Biserial (D)
The point biserial (D) measures the relationship between the student’s score (right/wrong) and the aggregate assessment score.
Correlates with item difficulty (p-value): Very easy/difficult items do not discriminate well. Moderately difficulty items (p-values 0.4-0.6/0.3-0.7)
generally discriminate very well.

Discrimination Index (D) (point biserial)
(1) Arrange scores from highest to lowest(2) Divide into upper and lower groups (quartiles work) N=80; Q=20(3) Calculate the number in each group (upper, lower)
Options A* B C D
Upper 15 0 2 3 N=20
Lower 6 2 5 7 N =20
(4) Compute D value:
D = Number correct (upper group) – number correct (lower group)
Number in ether group (larger group number if unequal)
D = 15 – 6 = 9/20 (D) = 0.4520
What does this mean??? The D value is positive, which means more students who did well on the test overall also answered the item correctly. The higher the D value, the better the discrimination.
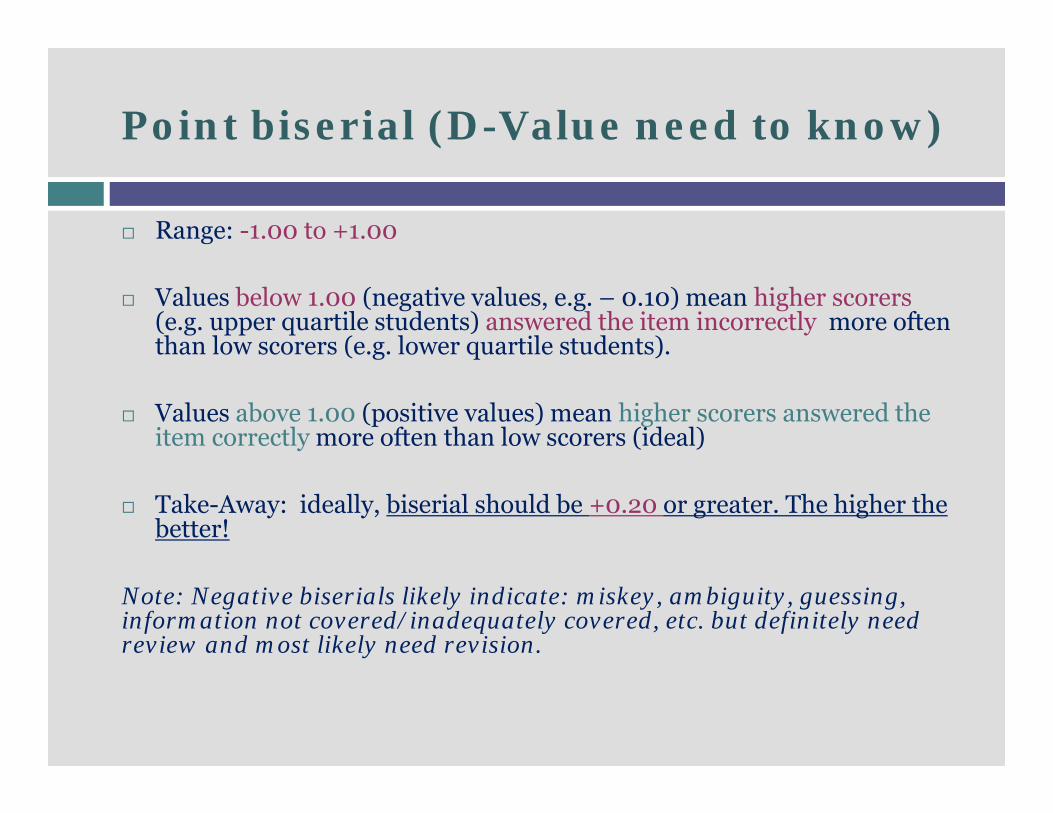
Point biserial (D-Value need to know)
Range: -1.00 to +1.00
Values below 1.00 (negative values, e.g. – 0.10) mean higher scorers (e.g. upper quartile students) answered the item incorrectly more often than low scorers (e.g. lower quartile students).
Values above 1.00 (positive values) mean higher scorers answered the item correctly more often than low scorers (ideal)
Take-Away: ideally, biserial should be +0.20 or greater. The higher the better!
Note: Negative biserials likely indicate: miskey, ambiguity, guessing, information not covered/inadequately covered, etc. but definitely need review and most likely need revision.

Let’s practice!
Item TotalN= 70
Upper27%
N=19
Lower27%
N=19
Point Biserial (D)
P-value A B C D
1 71.43% 94.74%(18)
52.63%(10)
18-10/19=0.42
0.71 15 2 3 50*
2 41.43% 68.42%(13)
21.05%(4)
13-4/19=0.47
0.41 15 25 1 29*
3 100% 100% 100% 19-19/19=
01.0 0 70* 0 0
4 44.29% 57.89%(11)
52.63%(10)
11-10/19=
0.050.44 39 0 31* 0
5 91.43% 89.74%(17)
94.74%(18)
17-18/19=
-0.05
0.91 0 1 5 64*
D = #correct (upper) - #correct (lower)/ number in either group (N=19)

How do you correct tests & test items?
Increase test reliability: Increase the length of the test, e.g. 75 or 100 items vs. 25 or 50
items
Manage item difficulty (increase/decrease item difficulty if your items are consistently above p-value >.70 (too easy) or < 0.30 (too difficult)
Manage item discrimination (eliminate or revise p-value 1.0 items = 100% correct items); eliminate or revise negative point biserial items.

How do you correct tests & test items?
Improve your test-writing skills! (That’s another workshop!)
Not so easy but definitely possible Revise non-distractors Remove distracting content from the stem (e.g. long
cases not relevant to the question) Proof for spelling and grammar
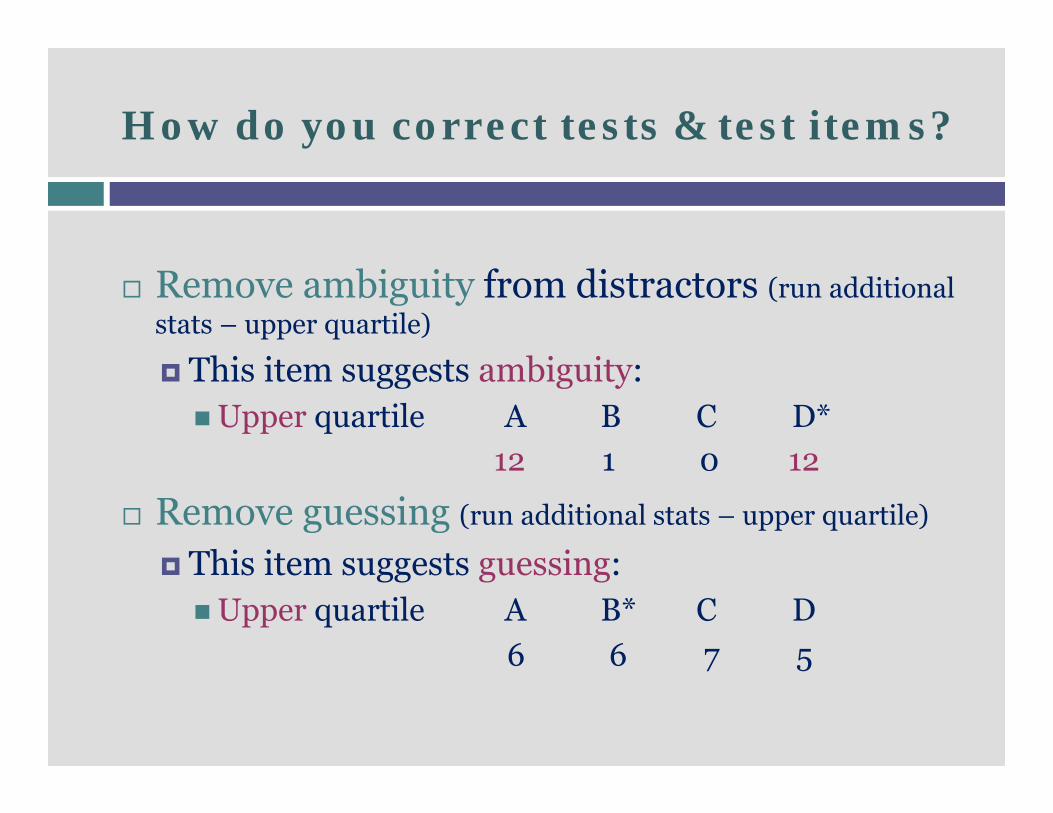
How do you correct tests & test items?
Remove ambiguity from distractors (run additional stats – upper quartile)
This item suggests ambiguity:Upper quartile A B C D*
12 1 0 12
Remove guessing (run additional stats – upper quartile)
This item suggests guessing:Upper quartile A B* C D
6 6 7 5

Now that you know all this, let’s analyze a test!
Sample Test #1 Test Items = 100N = 67 students KR-20 = 0.70 Mean = 79.48 p-Value Range = 0.16-0.70
Item Upper 25%N=17
Lower25%N=17
P-Value
Point Biserial
(D)
A B C D
168.66%
88.89% 55.56% 0.68 0.35 0 21 0 46*
216.42%
27.78 22.22% 0.16 0.05 11* 32 14 10
368.66%
77.78% 50.00% 0.68 0.29 13 46* 4 4
470.15%
66.67% 83.33% 0.70 -0.17 47* 8 5 7
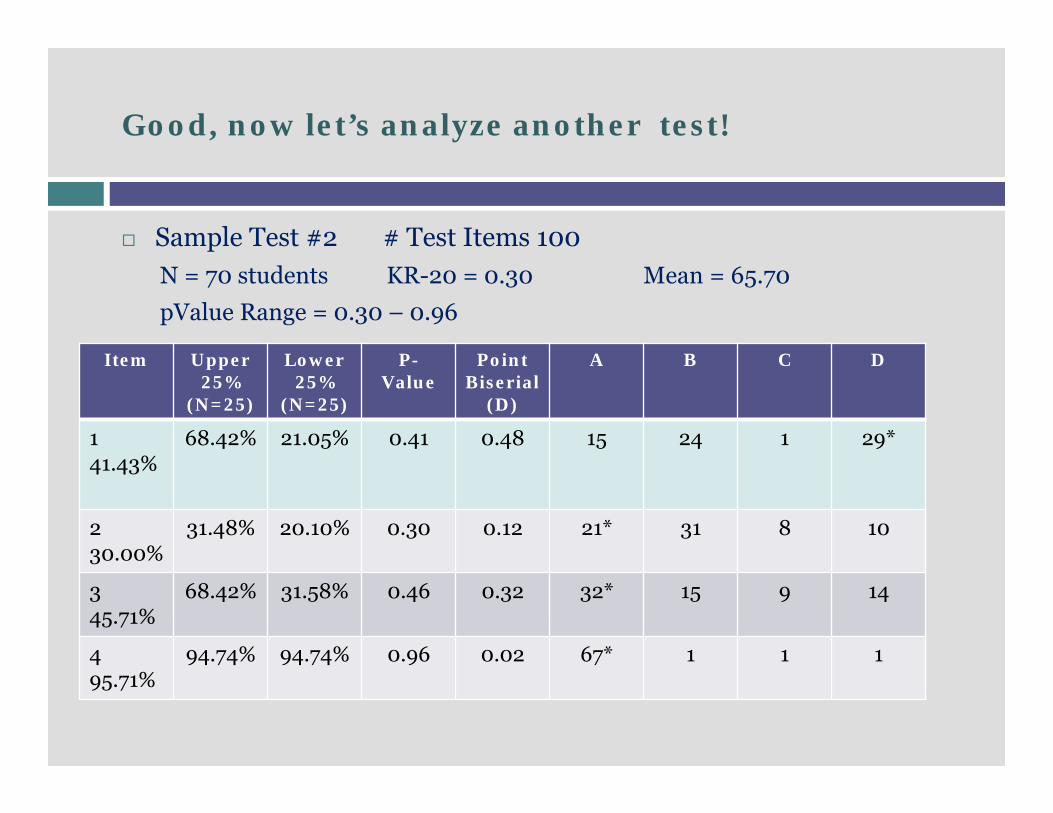
Good, now let’s analyze another test!
Sample Test #2 # Test Items 100N = 70 students KR-20 = 0.30 Mean = 65.70pValue Range = 0.30 – 0.96
Item Upper 25%
(N=25)
Lower25%
(N=25)
P-Value
Point Biserial
(D)
A B C D
141.43%
68.42% 21.05% 0.41 0.48 15 24 1 29*
230.00%
31.48% 20.10% 0.30 0.12 21* 31 8 10
345.71%
68.42% 31.58% 0.46 0.32 32* 15 9 14
495.71%
94.74% 94.74% 0.96 0.02 67* 1 1 1

Cheat sheet! P-value (item difficulty
Point biserial (Item Discrimination, D-value)
D = neg value (e.g.- 0.20)
D = 0.00 to < +0.20 D = > +0.20
≥ 0.70 (easy) Requires review & revision (easy item;
does not discriminate)
Consider Review (easy item; BUT it
does it discriminate at 0.01 or 0.19??? )
Keep & Use (easy item; high
discrimination)
0.30-0.70(moderate)
Requires review & revision (moderate
item; does not discriminate)
Consider Review (moderate item;
BUT it does it discriminate at 0.01
or 0.19??? )
Keep & Use (moderate item;
high discrimination)
≤ 0.30 (difficult) Requires review & revision (difficulty
item; does not discriminate)
Consider Review (difficult item; BUT
it does it discriminate at 0.01
or 0.19??? )
Keep & Use (difficult item; high
discrimination)
Objectives:
Hopefully, you can now: Interpret test analysis results to determine
overall test performance. Interpret test analysis results to determine test
item level of difficulty (p) and discrimination (D).
Use test analysis results to determine the need for test item revision.


References
Kubiszyn, T. & Borich, G.D. (2013). Educational testing & measurement classroom application & practice (10th ed). New Jersey: John Wiley & Sons Publishing.
Miller, M.D., Linn, L.R. & Gronlund, N.E. (2009). Measurement and assessment in teaching (10th ed). Upper Saddle River, NJ: Prentice Hall.
Oermann, M.H. & Gaberson, K.B. (2014). Evaluation and testing in nursing education (4th ed). New York: Springer Publishing.