tenniseye: tennis ball speed estimation using a racket...
TRANSCRIPT

TennisEye: Tennis Ball Speed Estimation using aRacket-mounted Motion Sensor
Hongyang ZhaoCollege of William and Mary
Williamsburg, [email protected]
Shuangquan WangCollege of William and Mary
Williamsburg, [email protected]
Gang ZhouCollege of William and Mary
Williamsburg, [email protected]
Woosub JungCollege of William and Mary
Williamsburg, [email protected]
ABSTRACTAggressive tennis shots with high ball speed are the key factor inwinning a tennis match. Today’s tennis players are increasinglyfocused on improving ball speed. As a result, in recent tennis tour-naments, records of tennis shot speeds are broken again and again.The traditional method for calculating the tennis ball speed usesmultiple high-speed cameras and computer vision technology. Thismethod is very expensive and hard to set up. Another way to cal-culate the tennis ball speed is to use motion sensors, which arelower cost and easier to set up. In this paper, we propose an ap-proach for tennis ball speed estimation based on a racket-mountedmotion sensor. We divide the tennis strokes into three categories:serve, groundstroke, and volley. For a serve, a regression model isproposed to estimate the ball speed. For a groundstroke or volley,two models are proposed: a regression model and a physical model.We use the physical model to estimate the ball speed for advancedplayers and the regression model for beginner players. Under theleave-one-subject-out cross-validation test, evaluation results showthat TennisEye is 10.8% more accurate than the state-of-the-artwork.
CCS CONCEPTS•Human-centered computing→Ubiquitous computing;Mo-bile computing; Mobile devices;
KEYWORDStennis ball speed estimation, motion sensor, regression model, phys-ical model
ACM Reference Format:Hongyang Zhao, Shuangquan Wang, Gang Zhou, and Woosub Jung. 2019.TennisEye: Tennis Ball Speed Estimation using a Racket-mounted MotionSensor. In Proceedings of the 18th ACM/IEEE Conference on InformationProcessing in Sensor Networks (IPSN’19). ACM, New York, NY, USA, 13 pages.https://doi.org/10.1145/nnnnnnn.nnnnnnn
Permission to make digital or hard copies of part or all of this work for personal orclassroom use is granted without fee provided that copies are not made or distributedfor profit or commercial advantage and that copies bear this notice and the full citationon the first page. Copyrights for third-party components of this work must be honored.For all other uses, contact the owner/author(s).IPSN’19, April 2019, Montreal, Canada© 2019 Copyright held by the owner/author(s).ACM ISBN 978-x-xxxx-xxxx-x/YY/MM.https://doi.org/10.1145/nnnnnnn.nnnnnnn
1 INTRODUCTIONWith the advance of ubiquitous computing, cyber physical systems,and human computer interaction, wearable devices are becomingmore and more popular nowadays [18] [9]. Applications of wear-able devices have been widely extended to the field of sports. Forexample, Hao et al. propose a running rhythm monitoring systembased on the sound of breathing through smartphone embeddedsensors [12]. Kranz et al. propose an automated assessment systemfor balance board training called Gymskill, which provides feedbackon training quality to the user based on smartphone integrated sen-sors [19]. In addition, there are several studies in other sports likerunning [1], skiing [10], climbing [15], cricket [14], football [44],and table tennis [3]. In addition to these research publications, theindustrial wearable devices market is also evolving at a rapid pace.The global industrial wearable devices market has reached a valueof 1.5 billion dollars in 2017, and is expected to have a compoundannual growth rate (CAGR) of 9.6% [16]. The wearable devicesmarket in sports is expected to register a CAGR of 9.8%, during theforecast period (2018 - 2023) [13].
There are also applications of wearable devices in tennis training.Several commercial tennis assistant systems are available on themarket that aim to improve players’ performance [41] [32] [24] [7].These products either integrate themotion sensors inside the racket [7],or require users to attach themotion sensors to the racket [41] [32] [24].They analyze the motion sensor data and compute the key perfor-mance metrics for each swing, such as stroke type, ball speed, ballspin, and ball impact location. In addition to these commercial prod-ucts, there are also several existing research works on analyzing theperformance of tennis shots. For instance, Srivastava et al. analyzethe consistency of the tennis shots [31]. The authors provide recom-mendation on wrist rotation based on the shots from professionalplayers. Sharma et al. analyze the tennis serve [28]. By comparingthe serve phases of a user to those of professionals, the systemprovide the user with corrective feedback and insights into theirplaying styles.
Tennis ball speed is an important metric in assessing the skilllevel of a tennis player. There are two main ways to calculate thetennis ball speed. One way is to use multiple high-speed camerasto capture ball movement and calculate speed, such as Hawk-eyetechnology [8] [21] and PlaySight [25]. These systems use advanced
This work is supported by U.S. National Science Foundation under grants CNS-1253506(CAREER).

IPSN’19, April 2019, Montreal, Canada Hongyang Zhao, Shuangquan Wang, Gang Zhou, and Woosub Jung
image processing and analytical algorithms to capture ball move-ment and calculate speed. However, high-speed cameras are veryexpensive and hard to set up. Therefore, most players cannot getaccess to these systems, which limits their popularity. Another wayis to use motion sensors. Compared with camera-based method, themotion sensors-based method is lower cost, more energy efficient,not influenced by lighting environment, and easier to set up. Thereare some commercial products on the market that assess the perfor-mance of the players and estimate the ball speed [41] [32] [24] [7].However, none of these commercial products open their algorithmsto the public. In addition, to our knowledge, no previous publicationhas used motion sensors to calculate the tennis ball speed. There-fore, we are motivated to explore how to use a motion sensor tocalculate the tennis ball speed.
There are several research publications and commercial prod-ucts that use motion sensors to analyze tennis shots. However,none of them open their source codes and datasets to the public.Source codes and tennis dataset sharing are valuable as they allowresearchers to build their works upon others rather than repeatalready existing research work. In addition, they encourage moreconnection and collaboration between researchers, which promotesthe tennis research. Therefore, we are motivated to open our sourcecodes and tennis dataset to the public1.
We present TennisEye, a tennis ball speed calculation systemusing a racket-mountedmotion sensor.We apply a simple threshold-based method to detect if there is a tennis stroke. Once a tennisstroke is detected, we use a time window to extract stroke data andinterpolate the sensor readings if the true value exceeds the mea-surement limit. We apply the Random Forest classifier to classifyeach tennis stroke into one of three stroke types: serve, ground-stroke, and volley. A serve is a shot to start a point. A groundstrokeis a shot that is executed after the ball bounces once on the ground,while a volley is a shot that is executed before the ball bounces onthe ground. If the tennis stroke is a serve, we apply a regressionmodel to calculate serve speed. If the tennis stroke is a groundstrokeor volley, we propose twomodels: a physical model and a regressionmodel. For advanced players, they have correct and constant strokegestures. We use the physical model to calculate the ball speed forthem. For beginner players, they have incorrect and varying strokegestures. We use the regression model to calculate the ball speed.
We summarize our contributions as follows:
(1) We propose a tennis ball speed calculation system, Tennis-Eye. It is the first research publication to calculate the serve,groundstroke and volley speed of a tennis ball using a racket-mounted motion sensor.
(2) We propose two models to calculate the groundstroke orvolley speed: a physical model and a regression model. Weapply the physical model to calculate the ball speed for ad-vanced players, and the regression model to calculate theball speed for beginner players.
(3) We evaluate the proposed system using the tennis shot datafrom players of different levels. Our experiment results showthat TennisEye is 10.8% more accurate than the state-of-the-art work.
1https://hongyang-zhao.github.io/TennisEye/
Stroke Detection
Regression Model
Physical Model
AccelerometerReadings
GyroscopeReadings
Serve Speed Calculation
Groundstroke/Volley Speed Calculation
ball speed
BLESensor
Groundstroke/Volley
Serve
Stroke
Data Segmentation
DataInterpolation
Stroke Classification
Beginner?Yes
No
Strokedata
Figure 1: Data Processing of TennisEye
(4) We collect an accurate and high-quality tennis dataset. Weopen our source codes and tennis dataset to the public.
The remainder of this paper is organized as follows. First, weintroduce the system design in Section 2. In Section 3, we evaluatethe system performance. We discuss the system and future workin Section 4. We summarize the related works in Section 5. Finally,we draw our conclusion in Section 6.
2 TENNISEYE DESIGNWe introduce the system design of TennisEye in this section. First,we introduce the data processing in Section 2.1. Then, we introducethe sensor deployment and data collection in Section 2.2. Followingthat, modules in the data processing are introduced from Section 2.3to Section 2.8.
2.1 Overview of TennisEyeThe data processing of TennisEye is shown in Fig. 1. A motionsensor is deployed on a racket handle to collect the accelerometerand gyroscope readings, which are real-time transmitted to a smartphone through Bluetooth Low Energy (BLE). Based on the collectedmotion data, a threshold-based method is proposed to detect tennisstrokes. Once a tennis stroke is detected, we apply a peak detectionalgorithm to find the impact time when a ball hits the racket. Oncethe impact time is found, we use a sliding window with a length of2 seconds to extract the stroke data. For the stroke data, we applya cubic spline interpolation to compensate the sensor readings ifthe sensor saturates. Then, we use the Random Forest classifier toclassify each tennis stroke into one of three stroke types: serve,groundstroke, and volley. If the tennis stroke is a serve, we proposea serve speed estimation method to calculate serve speed. If thetennis stroke is a groundstroke or volley, we propose two models, aregression model and a physical model, to calculate the ball speedfor the beginner player and the advanced player, respectively. Wetrain the models and evaluate the performance of the system usinga laptop.
TennisEye: Tennis Ball Speed Estimation using a Racket-mounted Motion Sensor IPSN’19, April 2019, Montreal, Canada
Side A
Side B
YX
Y
XZ
Z
Y
XZ
0.31m 0.21m
Side A
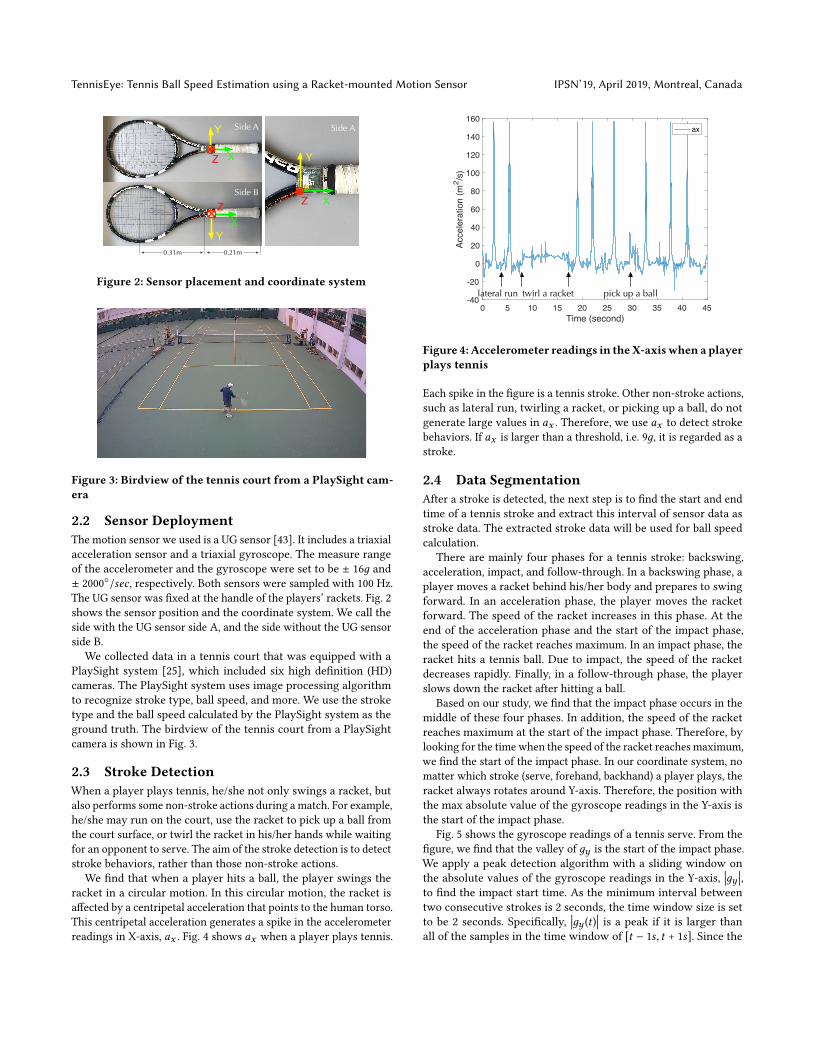
Figure 2: Sensor placement and coordinate system
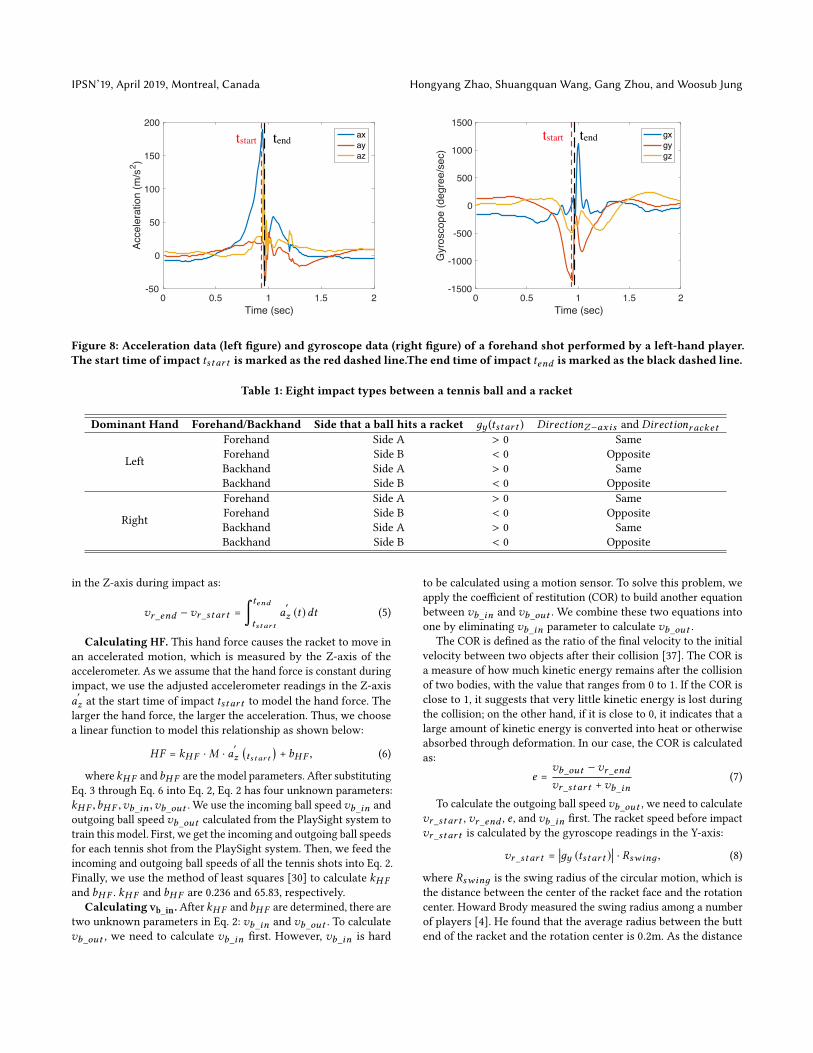
Figure 3: Birdview of the tennis court from a PlaySight cam-era
2.2 Sensor DeploymentThe motion sensor we used is a UG sensor [43]. It includes a triaxialacceleration sensor and a triaxial gyroscope. The measure rangeof the accelerometer and the gyroscope were set to be ± 16д and± 2000◦/sec , respectively. Both sensors were sampled with 100 Hz.The UG sensor was fixed at the handle of the players’ rackets. Fig. 2shows the sensor position and the coordinate system. We call theside with the UG sensor side A, and the side without the UG sensorside B.
We collected data in a tennis court that was equipped with aPlaySight system [25], which included six high definition (HD)cameras. The PlaySight system uses image processing algorithmto recognize stroke type, ball speed, and more. We use the stroketype and the ball speed calculated by the PlaySight system as theground truth. The birdview of the tennis court from a PlaySightcamera is shown in Fig. 3.
2.3 Stroke DetectionWhen a player plays tennis, he/she not only swings a racket, butalso performs some non-stroke actions during a match. For example,he/she may run on the court, use the racket to pick up a ball fromthe court surface, or twirl the racket in his/her hands while waitingfor an opponent to serve. The aim of the stroke detection is to detectstroke behaviors, rather than those non-stroke actions.
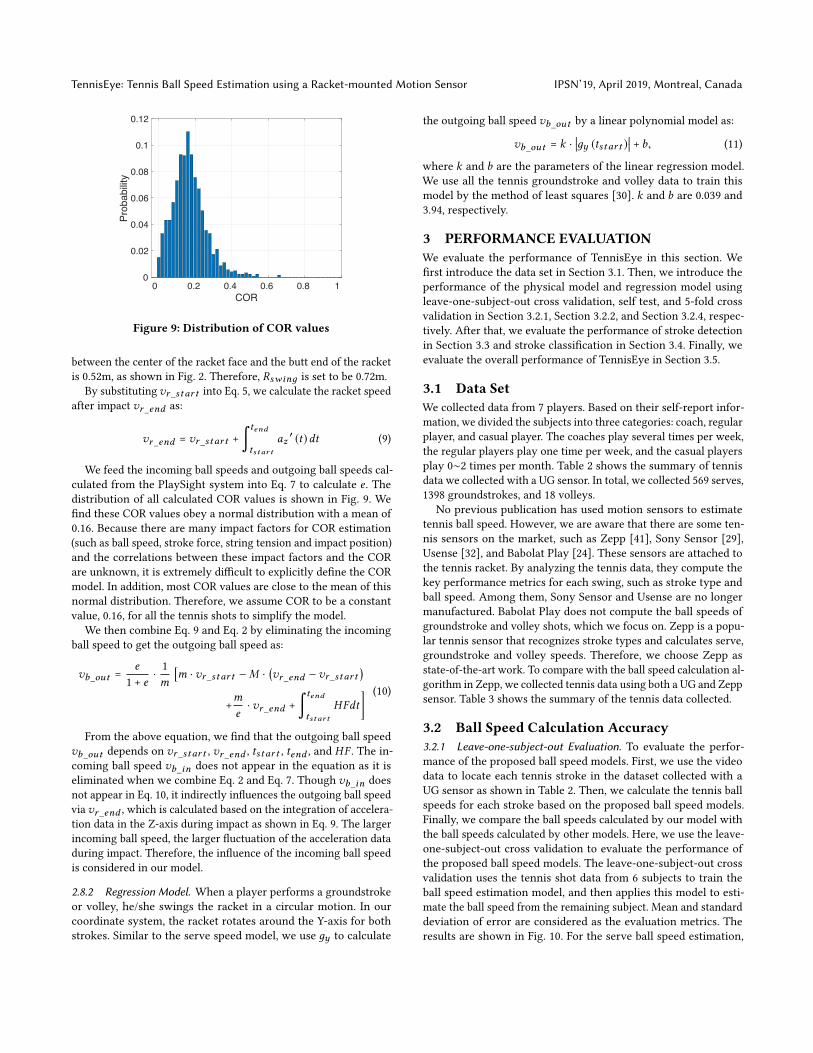
We find that when a player hits a ball, the player swings theracket in a circular motion. In this circular motion, the racket isaffected by a centripetal acceleration that points to the human torso.This centripetal acceleration generates a spike in the accelerometerreadings in X-axis, ax . Fig. 4 shows ax when a player plays tennis.
0 5 10 15 20 25 30 35 40 45Time (second)
-40
-20
0
20
40
60
80
100
120
140
160
Acce
lera
tion
(m2 /s
)
ax
twirl a racketlateral run pick up a ball
Figure 4: Accelerometer readings in theX-axiswhen a playerplays tennis
Each spike in the figure is a tennis stroke. Other non-stroke actions,such as lateral run, twirling a racket, or picking up a ball, do notgenerate large values in ax . Therefore, we use ax to detect strokebehaviors. If ax is larger than a threshold, i.e. 9д, it is regarded as astroke.
2.4 Data SegmentationAfter a stroke is detected, the next step is to find the start and endtime of a tennis stroke and extract this interval of sensor data asstroke data. The extracted stroke data will be used for ball speedcalculation.
There are mainly four phases for a tennis stroke: backswing,acceleration, impact, and follow-through. In a backswing phase, aplayer moves a racket behind his/her body and prepares to swingforward. In an acceleration phase, the player moves the racketforward. The speed of the racket increases in this phase. At theend of the acceleration phase and the start of the impact phase,the speed of the racket reaches maximum. In an impact phase, theracket hits a tennis ball. Due to impact, the speed of the racketdecreases rapidly. Finally, in a follow-through phase, the playerslows down the racket after hitting a ball.
Based on our study, we find that the impact phase occurs in themiddle of these four phases. In addition, the speed of the racketreaches maximum at the start of the impact phase. Therefore, bylooking for the time when the speed of the racket reaches maximum,we find the start of the impact phase. In our coordinate system, nomatter which stroke (serve, forehand, backhand) a player plays, theracket always rotates around Y-axis. Therefore, the position withthe max absolute value of the gyroscope readings in the Y-axis isthe start of the impact phase.
Fig. 5 shows the gyroscope readings of a tennis serve. From thefigure, we find that the valley of дy is the start of the impact phase.We apply a peak detection algorithm with a sliding window onthe absolute values of the gyroscope readings in the Y-axis,
��дy ��,to find the impact start time. As the minimum interval betweentwo consecutive strokes is 2 seconds, the time window size is setto be 2 seconds. Specifically,
��дy (t )�� is a peak if it is larger thanall of the samples in the time window of [t − 1s, t + 1s]. Since the

IPSN’19, April 2019, Montreal, Canada Hongyang Zhao, Shuangquan Wang, Gang Zhou, and Woosub Jung
0 0.5 1 1.5 2Time (sec)
-1500
-1000
-500
0
500
1000
Gyr
osco
pe (d
egre
e/se
c)
gxgygz
1 1.05 1.1 1.15-1500
-1000
-500
0
500
1000
tstart
Backswing Acceleration Follow-through
Impact
tendtstart tend
Impact
Figure 5: Gyroscope readings of a serve
minimum of��дy �� for a stroke in our dataset is 814.5 degree/sec, the
detected peak of��дy �� should be larger than 814.5 degree/sec. After
the impact start time tstar t is detected, we use a time window of[tstar t − 1s, tstar t + 1s] to extract the stroke data.
2.5 Data InterpolationIn our dataset, we find that the gyroscope readings in the Y-axissometimes saturate when a player serves with a high speed. Thissaturation happens when a sensor measures a value that is largerthan its measurement range, ± 2000◦/sec . The blue line in Fig. 6shows an example of the sensor saturation. In the figure, we findthat the raw gyroscope readings in the Y-axis saturate from 0.52seconds to 0.54 seconds. To deal with this problem, we apply thecubic spline interpolation [6] to interpolate the saturated gyroscopereadings in the Y-axis. Specifically, we use the gyroscope readingsin the Y-axis within the range of
[tsat_star t − tw, tsat_star t
)and(
tsat_end , tsat_end + tw]to construct new data points within the
range of[tsat_star t , tsat_end
]. tsat_star t and tsat_end are the start
and end times of the saturation, which are 0.52 seconds and 0.54seconds in this case. tw is empirically set to be 100ms. The gyro-scope readings in the Y-axis after interpolation are shown as thered dashed line in the figure.
2.6 Stroke ClassificationAfter data interpolation, the next step is to classify the stroke typefor each stroke data segment. First, we extract a series of featuresfrom each data segment. The features include mean, standard devi-ation, skewness, kurtosis, minimum, and maximum of each axis ofaccelerometer and gyroscope readings. The amplitude of accelerom-eter and gyroscope readings are also computed. In total, 38 featuresfor each data segment are calculated and normalized between [0, 1].Second, we apply a machine learning classifier to classify eachdata segment into one of three stroke types: serve, groundstroke,and volley. We compare the performance of five classifiers: NaiveBayes, AdaBoost, Support Vector Machine (SVM), Decision Tree,and Random Forest. Since the Random Forest performs best asshown in Section 3.4, we choose the Random Forest classifier forstroke classification.
0 0.25 0.5 0.75 1Time (second)
-3000
-2500
-2000
-1500
-1000
-500
0
500
1000
Gyr
osco
pe (d
egre
e/se
c)
raw gygy after interpolation
Figure 6: Interpolation of the gyroscope readings in the Y-axis
2.7 Serve Speed CalculationFor a tennis serve, the initial speed of a ball is quite small andmainly depends on the racket speed. The larger the racket speed,the higher the ball speed. This motivates us to use the racket speedto calculate the serve speed. When a player serves a tennis ball,the racket swings in a circular motion with the human shoulderas the center. Because the racket rotates around the Y-axis in ourcoordinate system, дy measures the angular speed of the racket.We use дy at the impact start time to model the ball serve speedvb_serve by a linear regression model as:
vb_serve = k ·��дy (tstar t )�� + b, (1)
where k and b are the parameters of the linear regression model.All of the tennis serve data are used to train the serve model. k andb are calculated by using the method of least squares [30]. k and bare 0.025 and 20.06, respectively.
2.8 Groundstroke/Volley Speed CalculationWe propose two models to calculate the ball speed: a physical modeland a regression model. The physical model is built based on thephysical impact between a racket and a ball, while the regressionmodel applies a linear regression model to estimate the ball speed.For advanced players, they have correct stroke gestures, and similargestures for the same type of the stroke. We propose a physicalmodel to calculate the ball speed for them. For beginner players, itis hard to build the physical model due to two reasons. First, theirstroke gestures are incorrect. With incorrect stroke gestures andterrible tennis skills, they often swing the racket in an awkwardway,which is hard to build the physical model. Second, for the same typeof the stroke, they may perform different gestures and swing theracket in different ways. The big variance in their stroke gesturesreduces the accuracy of the physical model. Therefore, instead ofbuilding a physical model, we propose a simple regression modelto calculate the ball speed for the beginner players.
2.8.1 Physical Model. The impact between a racket and a tennisball is governed by some physical laws and mechanical principles.By applying these laws and principles, we propose a physical model

TennisEye: Tennis Ball Speed Estimation using a Racket-mounted Motion Sensor IPSN’19, April 2019, Montreal, Canada
X
Y
Z
!"_$%&"% !"_$%&!"_$%&
!"#$&'()*(!&) !"#$&'()*(!&)
Before impact After impact
X
Y
Z
!"_$%
Figure 7: Physical impact process between a tennis racketand a tennis ball
to estimate ball speed. The outgoing ball speed is mainly influencedby two factors: the racket speed and the incoming ball speed. Theracket speed can be calculated using motion sensors, while theincoming ball speed is unknown. Without the incoming ball speed,the outgoing ball speed cannot be calculated by a physical model.To solve this problem, we apply a physical law (conservation oflinear momentum [20]) and a mechanical principle (Coefficientof Restitution [37]). Both the physical law and the mechanicalprinciple contain the incoming ball speed parameter. We combinethese into one by eliminating the incoming ball speed parameter toget the outgoing ball speed.
Because of the difficulty in characterizing the physical impactprocess using only one racket-mounted motion sensor, we makeseveral assumptions to simplify the physical model.
(1) The tennis ball horizontally hits and bounces off the racket.(2) The ball impacts at the center of the racket face.(3) During impact, there is a constant hand force on the racket.There are four reasons to these three assumptions. (1) The physi-
cal impact process between a racket and a tennis ball is very compli-cated. Without these assumptions, it is extremely difficult to builda physical model only using motion sensors. (2) Even if we builda model without these simplified assumptions, this model will bevery complicated. A complicated model may require much morecomputation and energy cost than the simplified model. This is notfeasible for the small-size device embedded into the racket. (3) Asshown in Section 3, the evaluation results demonstrate that ourproposed models perform quite well already. A complicated modelmay only increase the accuracy a little. (4) These assumptions aremade based on our observations on tennis matches. We find thatthe angle between a ball and the normal to the racket string plane istypically quite small. Otherwise, the ball will either move towardsthe ground or move towards the sky. Accordingly, we assume thatthe ball horizontally hits and bounces off the racket. In addition,we find that tennis balls usually hit at the center of the rackets foradvanced players. Therefore, we assume that the ball impacts at thecenter of the racket face. Finally, we find that the duration of theimpact is roughly 20ms, as shown in Fig. 5. Thus, it is reasonableto assume a constant hand force during this short period of time.
Based on these assumptions, the physical impact process isshown in Fig. 7. Before impact, there is a hand force HF exerted ona racket. Under the influence of the hand force, the racket of massM is moving at velocity vr_star t towards a tennis ball. At the sametime, this tennis ball of massm is moving at velocity vb_in towardsthe racket. After impact, the tennis ball bounces off the racket atvelocity vb_out , reducing the velocity of the racket to vr_end .
By conservation of linear momentum, we get:∫ tend
tstar tHFdt = M ·
(vr_end −vr_star t
)+m ·
(vb_out +vb_in
), (2)
where tstar t and tend are the start and end times of impact. Inthis equation, tstar t , M , andm are known. tstar t is calculated indata segmentation module, as shown in Section 2.4.M andm are300д and 50д. To calculate vb_out , we need to calculate the otherunknown parameters first. They are tend , vr_end − vr_star t , HF ,and vb_in .
Calculating tend. The impact starts when a ball hits a racket,and ends when the ball leaves the racket. During the impact, due tothe momentum lost by the ball, the speed of the racket decreasesrapidly. After the ball leaves the racket, the speed of the racketincreases again. By searching for the change of the racket speed,we find the end time of impact as shown in Fig. 8. More specifically,by searching from tstar t , tend is calculated as:
tend = t i f��дy (t)�� < ��дy (t + 1)
�� (3)
Calculating vr_end − vr_start. vr_end − vr_star t can be calcu-lated as the integration of the accelerometer readings in the Z-axis.However, as there are two sides of the rackets, the accelerometerreadings in the Z-axis will have opposite values when the tennisball hits on the different sides. The motion sensor is attached onthe side A of the racket, as shown in Fig. 2. When the side A of theracket hits the tennis ball, the movement direction of the racketis the same as the positive direction of the Z-axis of the sensor.vr_end −vr_star t is calculated as the integration of the accelerom-eter readings in the Z-axis. However, when the side B of the rackethits the tennis ball, the movement direction of the racket is oppo-site to the positive direction of the Z-axis of the sensor, as shownin Fig. 7. vr_end − vr_star t is calculated as the integration of theinverse of the accelerometer readings in the Z-axis. Therefore, tocalculate the ball speed, we need to reorientate the motion sensorso that the positive direction of the Z-axis of the sensor is the sameas the movement direction of the racket.
There are eight possible impact types between a tennis ball anda racket, which are summarized in Table 1. From the table, we findthat when the дy (tstar t ) is larger than 0, the positive direction ofthe Z-axis of the sensor is the same as the movement direction of theracket. When the дy (tstar t ) is smaller than 0, the positive directionof the Z-axis of the sensor is opposite to the movement directionof the racket. This motivates us to use дy (tstar t ) to reorientate thesensor readings in Z-axis. The reoriented accelerometer readingsin the Z-axis a
′
z is calculated as:
a′
z ={az дy (tstar t ) > 0−az дy (tstar t ) < 0 (4)
The change of the racket speed vr_end − vr_star t in Eq. 2 iscalculated as the integration of the reoriented acceleration readings
IPSN’19, April 2019, Montreal, Canada Hongyang Zhao, Shuangquan Wang, Gang Zhou, and Woosub Jung
0 0.5 1 1.5 2Time (sec)
-1500
-1000
-500
0
500
1000
1500
Gyr
osco
pe (d
egre
e/se
c)
gxgygz
tstart tend
0 0.5 1 1.5 2Time (sec)
-50
0
50
100
150
200Ac
cele
ratio
n (m
/s2 )
axayaz
tstart tend
Figure 8: Acceleration data (left figure) and gyroscope data (right figure) of a forehand shot performed by a left-hand player.The start time of impact tstar t is marked as the red dashed line.The end time of impact tend is marked as the black dashed line.
Table 1: Eight impact types between a tennis ball and a racket
Dominant Hand Forehand/Backhand Side that a ball hits a racket дy (tstar t ) DirectionZ−axis and Directionracket
Left
Forehand Side A > 0 SameForehand Side B < 0 OppositeBackhand Side A > 0 SameBackhand Side B < 0 Opposite
Right
Forehand Side A > 0 SameForehand Side B < 0 OppositeBackhand Side A > 0 SameBackhand Side B < 0 Opposite
in the Z-axis during impact as:
vr_end −vr_star t =∫ tend
tstar ta′
z (t)dt (5)
Calculating HF. This hand force causes the racket to move inan accelerated motion, which is measured by the Z-axis of theaccelerometer. As we assume that the hand force is constant duringimpact, we use the adjusted accelerometer readings in the Z-axisa′
z at the start time of impact tstar t to model the hand force. Thelarger the hand force, the larger the acceleration. Thus, we choosea linear function to model this relationship as shown below:
HF = kHF ·M · a′
z(tstar t
)+ bHF , (6)
wherekHF andbHF are the model parameters. After substitutingEq. 3 through Eq. 6 into Eq. 2, Eq. 2 has four unknown parameters:kHF ,bHF ,vb_in ,vb_out . We use the incoming ball speedvb_in andoutgoing ball speed vb_out calculated from the PlaySight system totrain this model. First, we get the incoming and outgoing ball speedsfor each tennis shot from the PlaySight system. Then, we feed theincoming and outgoing ball speeds of all the tennis shots into Eq. 2.Finally, we use the method of least squares [30] to calculate kHFand bHF . kHF and bHF are 0.236 and 65.83, respectively.
Calculating vb_in.After kHF andbHF are determined, there aretwo unknown parameters in Eq. 2: vb_in and vb_out . To calculatevb_out , we need to calculate vb_in first. However, vb_in is hard
to be calculated using a motion sensor. To solve this problem, weapply the coefficient of restitution (COR) to build another equationbetween vb_in and vb_out . We combine these two equations intoone by eliminating vb_in parameter to calculate vb_out .
The COR is defined as the ratio of the final velocity to the initialvelocity between two objects after their collision [37]. The COR isa measure of how much kinetic energy remains after the collisionof two bodies, with the value that ranges from 0 to 1. If the COR isclose to 1, it suggests that very little kinetic energy is lost duringthe collision; on the other hand, if it is close to 0, it indicates that alarge amount of kinetic energy is converted into heat or otherwiseabsorbed through deformation. In our case, the COR is calculatedas:
e =vb_out −vr_endvr_star t +vb_in
(7)
To calculate the outgoing ball speedvb_out , we need to calculatevr_star t , vr_end , e , and vb_in first. The racket speed before impactvr_star t is calculated by the gyroscope readings in the Y-axis:
vr_star t =��дy (tstar t )�� · Rswinд , (8)
where Rswinд is the swing radius of the circular motion, which isthe distance between the center of the racket face and the rotationcenter. Howard Brody measured the swing radius among a numberof players [4]. He found that the average radius between the buttend of the racket and the rotation center is 0.2m. As the distance
TennisEye: Tennis Ball Speed Estimation using a Racket-mounted Motion Sensor IPSN’19, April 2019, Montreal, Canada
0 0.2 0.4 0.6 0.8 1 COR
0
0.02
0.04
0.06
0.08
0.1
0.12Pr
obab
ility
Figure 9: Distribution of COR values
between the center of the racket face and the butt end of the racketis 0.52m, as shown in Fig. 2. Therefore, Rswinд is set to be 0.72m.
By substitutingvr_star t into Eq. 5, we calculate the racket speedafter impact vr_end as:
vr_end = vr_star t +∫ tend
tstar taz
′ (t)dt (9)
We feed the incoming ball speeds and outgoing ball speeds cal-culated from the PlaySight system into Eq. 7 to calculate e . Thedistribution of all calculated COR values is shown in Fig. 9. Wefind these COR values obey a normal distribution with a mean of0.16. Because there are many impact factors for COR estimation(such as ball speed, stroke force, string tension and impact position)and the correlations between these impact factors and the CORare unknown, it is extremely difficult to explicitly define the CORmodel. In addition, most COR values are close to the mean of thisnormal distribution. Therefore, we assume COR to be a constantvalue, 0.16, for all the tennis shots to simplify the model.
We then combine Eq. 9 and Eq. 2 by eliminating the incomingball speed to get the outgoing ball speed as:
vb_out =e
1 + e·1m
[m · vr_star t −M ·
(vr_end −vr_star t
)+m
e· vr_end +
∫ tend
tstar tHFdt
] (10)
From the above equation, we find that the outgoing ball speedvb_out depends on vr_star t , vr_end , tstar t , tend , and HF . The in-coming ball speed vb_in does not appear in the equation as it iseliminated when we combine Eq. 2 and Eq. 7. Though vb_in doesnot appear in Eq. 10, it indirectly influences the outgoing ball speedvia vr_end , which is calculated based on the integration of accelera-tion data in the Z-axis during impact as shown in Eq. 9. The largerincoming ball speed, the larger fluctuation of the acceleration dataduring impact. Therefore, the influence of the incoming ball speedis considered in our model.
2.8.2 Regression Model. When a player performs a groundstrokeor volley, he/she swings the racket in a circular motion. In ourcoordinate system, the racket rotates around the Y-axis for bothstrokes. Similar to the serve speed model, we use дy to calculate
the outgoing ball speed vb_out by a linear polynomial model as:
vb_out = k ·��дy (tstar t )�� + b, (11)
where k and b are the parameters of the linear regression model.We use all the tennis groundstroke and volley data to train thismodel by the method of least squares [30]. k and b are 0.039 and3.94, respectively.
3 PERFORMANCE EVALUATIONWe evaluate the performance of TennisEye in this section. Wefirst introduce the data set in Section 3.1. Then, we introduce theperformance of the physical model and regression model usingleave-one-subject-out cross validation, self test, and 5-fold crossvalidation in Section 3.2.1, Section 3.2.2, and Section 3.2.4, respec-tively. After that, we evaluate the performance of stroke detectionin Section 3.3 and stroke classification in Section 3.4. Finally, weevaluate the overall performance of TennisEye in Section 3.5.
3.1 Data SetWe collected data from 7 players. Based on their self-report infor-mation, we divided the subjects into three categories: coach, regularplayer, and casual player. The coaches play several times per week,the regular players play one time per week, and the casual playersplay 0∼2 times per month. Table 2 shows the summary of tennisdata we collected with a UG sensor. In total, we collected 569 serves,1398 groundstrokes, and 18 volleys.
No previous publication has used motion sensors to estimatetennis ball speed. However, we are aware that there are some ten-nis sensors on the market, such as Zepp [41], Sony Sensor [29],Usense [32], and Babolat Play [24]. These sensors are attached tothe tennis racket. By analyzing the tennis data, they compute thekey performance metrics for each swing, such as stroke type andball speed. Among them, Sony Sensor and Usense are no longermanufactured. Babolat Play does not compute the ball speeds ofgroundstroke and volley shots, which we focus on. Zepp is a popu-lar tennis sensor that recognizes stroke types and calculates serve,groundstroke and volley speeds. Therefore, we choose Zepp asstate-of-the-art work. To compare with the ball speed calculation al-gorithm in Zepp, we collected tennis data using both a UG and Zeppsensor. Table 3 shows the summary of the tennis data collected.
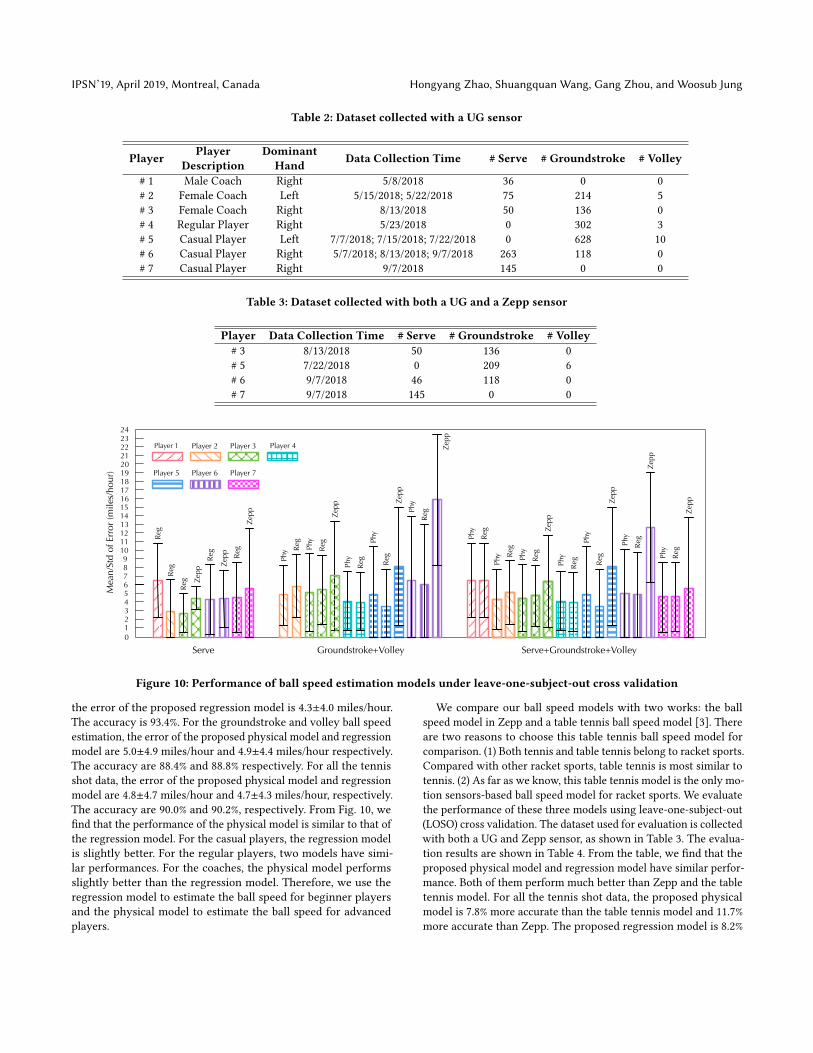
3.2 Ball Speed Calculation Accuracy3.2.1 Leave-one-subject-out Evaluation. To evaluate the perfor-mance of the proposed ball speed models. First, we use the videodata to locate each tennis stroke in the dataset collected with aUG sensor as shown in Table 2. Then, we calculate the tennis ballspeeds for each stroke based on the proposed ball speed models.Finally, we compare the ball speeds calculated by our model withthe ball speeds calculated by other models. Here, we use the leave-one-subject-out cross validation to evaluate the performance ofthe proposed ball speed models. The leave-one-subject-out crossvalidation uses the tennis shot data from 6 subjects to train theball speed estimation model, and then applies this model to esti-mate the ball speed from the remaining subject. Mean and standarddeviation of error are considered as the evaluation metrics. Theresults are shown in Fig. 10. For the serve ball speed estimation,
IPSN’19, April 2019, Montreal, Canada Hongyang Zhao, Shuangquan Wang, Gang Zhou, and Woosub Jung
Table 2: Dataset collected with a UG sensor
Player Player Dominant Data Collection Time # Serve # Groundstroke # VolleyDescription Hand# 1 Male Coach Right 5/8/2018 36 0 0# 2 Female Coach Left 5/15/2018; 5/22/2018 75 214 5# 3 Female Coach Right 8/13/2018 50 136 0# 4 Regular Player Right 5/23/2018 0 302 3# 5 Casual Player Left 7/7/2018; 7/15/2018; 7/22/2018 0 628 10# 6 Casual Player Right 5/7/2018; 8/13/2018; 9/7/2018 263 118 0# 7 Casual Player Right 9/7/2018 145 0 0
Table 3: Dataset collected with both a UG and a Zepp sensor
Player Data Collection Time # Serve # Groundstroke # Volley# 3 8/13/2018 50 136 0# 5 7/22/2018 0 209 6# 6 9/7/2018 46 118 0# 7 9/7/2018 145 0 0
Serve Groundstroke+Volley Serve+Groundstroke+Volley
Mea
n/S
td o
f Er
ror
(mil
es/h
ou
r)
12
0
3456789
101112
24232221201918171615
1314
Phy P
hy
Phy
Phy
Reg
Reg
Reg Reg
Reg
Reg
Reg
Reg
Reg Reg
Phy
Phy Phy
Phy
Phy
Phy
Phy
Reg
Reg
Reg
Reg Reg
Reg
Reg
Zep
p Zep
p
Zep
p
Zep
p Zep
p
Phy
Zep
p
Zep
p
Zep
p
Zep
p
Zep
p
Player 1 Player 2 Player 3 Player 4
Player 5 Player 6 Player 7
Figure 10: Performance of ball speed estimation models under leave-one-subject-out cross validation
the error of the proposed regression model is 4.3±4.0 miles/hour.The accuracy is 93.4%. For the groundstroke and volley ball speedestimation, the error of the proposed physical model and regressionmodel are 5.0±4.9 miles/hour and 4.9±4.4 miles/hour respectively.The accuracy are 88.4% and 88.8% respectively. For all the tennisshot data, the error of the proposed physical model and regressionmodel are 4.8±4.7 miles/hour and 4.7±4.3 miles/hour, respectively.The accuracy are 90.0% and 90.2%, respectively. From Fig. 10, wefind that the performance of the physical model is similar to that ofthe regression model. For the casual players, the regression modelis slightly better. For the regular players, two models have simi-lar performances. For the coaches, the physical model performsslightly better than the regression model. Therefore, we use theregression model to estimate the ball speed for beginner playersand the physical model to estimate the ball speed for advancedplayers.
We compare our ball speed models with two works: the ballspeed model in Zepp and a table tennis ball speed model [3]. Thereare two reasons to choose this table tennis ball speed model forcomparison. (1) Both tennis and table tennis belong to racket sports.Compared with other racket sports, table tennis is most similar totennis. (2) As far as we know, this table tennis model is the only mo-tion sensors-based ball speed model for racket sports. We evaluatethe performance of these three models using leave-one-subject-out(LOSO) cross validation. The dataset used for evaluation is collectedwith both a UG and Zepp sensor, as shown in Table 3. The evalua-tion results are shown in Table 4. From the table, we find that theproposed physical model and regression model have similar perfor-mance. Both of them perform much better than Zepp and the tabletennis model. For all the tennis shot data, the proposed physicalmodel is 7.8% more accurate than the table tennis model and 11.7%more accurate than Zepp. The proposed regression model is 8.2%
TennisEye: Tennis Ball Speed Estimation using a Racket-mounted Motion Sensor IPSN’19, April 2019, Montreal, Canada
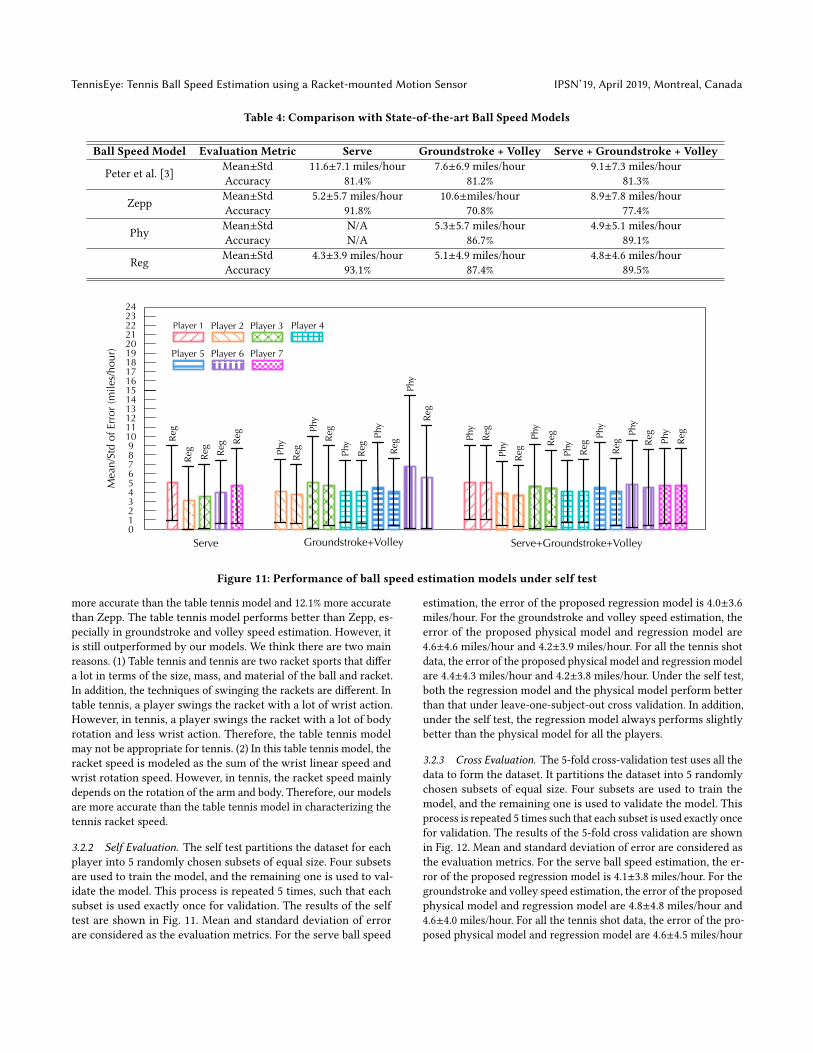
Table 4: Comparison with State-of-the-art Ball Speed Models
Ball Speed Model Evaluation Metric Serve Groundstroke + Volley Serve + Groundstroke + Volley
Peter et al. [3] Mean±Std 11.6±7.1 miles/hour 7.6±6.9 miles/hour 9.1±7.3 miles/hourAccuracy 81.4% 81.2% 81.3%
Zepp Mean±Std 5.2±5.7 miles/hour 10.6±miles/hour 8.9±7.8 miles/hourAccuracy 91.8% 70.8% 77.4%
Phy Mean±Std N/A 5.3±5.7 miles/hour 4.9±5.1 miles/hourAccuracy N/A 86.7% 89.1%
Reg Mean±Std 4.3±3.9 miles/hour 5.1±4.9 miles/hour 4.8±4.6 miles/hourAccuracy 93.1% 87.4% 89.5%
Serve Groundstroke+Volley Serve+Groundstroke+Volley
Mea
n/S
td o
f Er
ror
(miles
/hour)
Player 1 Player 2 Player 3 Player 4
Player 5 Player 6
01234567891011121314
Player 7
15
Phy
Phy
Phy
Phy
Phy
Reg
Reg
Reg Reg
Reg
Reg
Reg Reg Reg
Reg Phy
Phy
Phy
Phy
Phy
Phy
Phy
Reg
Reg
Reg
Reg Reg R
eg Reg
161718192021222324
Figure 11: Performance of ball speed estimation models under self test
more accurate than the table tennis model and 12.1% more accuratethan Zepp. The table tennis model performs better than Zepp, es-pecially in groundstroke and volley speed estimation. However, itis still outperformed by our models. We think there are two mainreasons. (1) Table tennis and tennis are two racket sports that differa lot in terms of the size, mass, and material of the ball and racket.In addition, the techniques of swinging the rackets are different. Intable tennis, a player swings the racket with a lot of wrist action.However, in tennis, a player swings the racket with a lot of bodyrotation and less wrist action. Therefore, the table tennis modelmay not be appropriate for tennis. (2) In this table tennis model, theracket speed is modeled as the sum of the wrist linear speed andwrist rotation speed. However, in tennis, the racket speed mainlydepends on the rotation of the arm and body. Therefore, our modelsare more accurate than the table tennis model in characterizing thetennis racket speed.
3.2.2 Self Evaluation. The self test partitions the dataset for eachplayer into 5 randomly chosen subsets of equal size. Four subsetsare used to train the model, and the remaining one is used to val-idate the model. This process is repeated 5 times, such that eachsubset is used exactly once for validation. The results of the selftest are shown in Fig. 11. Mean and standard deviation of errorare considered as the evaluation metrics. For the serve ball speed
estimation, the error of the proposed regression model is 4.0±3.6miles/hour. For the groundstroke and volley speed estimation, theerror of the proposed physical model and regression model are4.6±4.6 miles/hour and 4.2±3.9 miles/hour. For all the tennis shotdata, the error of the proposed physical model and regression modelare 4.4±4.3 miles/hour and 4.2±3.8 miles/hour. Under the self test,both the regression model and the physical model perform betterthan that under leave-one-subject-out cross validation. In addition,under the self test, the regression model always performs slightlybetter than the physical model for all the players.
3.2.3 Cross Evaluation. The 5-fold cross-validation test uses all thedata to form the dataset. It partitions the dataset into 5 randomlychosen subsets of equal size. Four subsets are used to train themodel, and the remaining one is used to validate the model. Thisprocess is repeated 5 times such that each subset is used exactly oncefor validation. The results of the 5-fold cross validation are shownin Fig. 12. Mean and standard deviation of error are considered asthe evaluation metrics. For the serve ball speed estimation, the er-ror of the proposed regression model is 4.1±3.8 miles/hour. For thegroundstroke and volley speed estimation, the error of the proposedphysical model and regression model are 4.8±4.8 miles/hour and4.6±4.0 miles/hour. For all the tennis shot data, the error of the pro-posed physical model and regression model are 4.6±4.5 miles/hour

IPSN’19, April 2019, Montreal, Canada Hongyang Zhao, Shuangquan Wang, Gang Zhou, and Woosub JungM
ean
/Std
of
Erro
r (m
iles
/ho
ur)
Serv
e
Serv
e
+Gro
unds
troke
+Volley
Gro
unds
troke
+Volley
012345678
RegPhy
Phy
Reg
Reg
Gro
unds
troke
+Volley Se
rve
+Gro
unds
troke
+Volley
9101112131415161718192021222324
Figure 12: Performance of ball speedestimation models under 5-fold crossvalidation
0~9
10~1
920
~29
30~3
940
~49
50~5
960
~69
70~7
980
~89
90~9
9
Incoming ball speed (miles/hour)
0
10
20
30
40
50
60
70
80
90
100
Accu
racy
(%)
Advanced playersBeginning players
Figure 13: Performance of the phys-ical model under different incomingball speeds
0~9
10~1
920
~29
30~3
940
~49
50~5
960
~69
70~7
980
~89
90~9
9
Racket speed (miles/hour)
0
10
20
30
40
50
60
70
80
90
100
Accu
racy
(%)
Advanced playersBeginning players
Figure 14: Performance of the phys-ical model under different racketspeeds
and 4.4±3.9 miles/hour. Under the 5-fold cross-validation test, boththe regression model and the physical model perform better thanthat under leave-one-subject-out cross validation, and worse thanthat under self test. In addition, under the 5-fold cross-validationtest, the regression model always performs slightly better than thephysical model.
3.2.4 Influence Factors on the Physical Model. We evaluate theperformance of the physical model under different incoming ballspeeds and racket speeds using the leave-one-subject-out crossvalidation. The results are shown in Fig. 13 and Fig. 14. From Fig. 13,we find that the physical model performs well for both advancedand beginner players under various incoming ball speeds. Therefore,the incoming ball speed factor does not have significant influenceon the accuracy of the physical model. From Fig. 14, we find that thephysical model performs well for advanced players under variousracket speeds. However, when the racket speed is too low (< 30miles/hour) or too high (≥ 60 miles/hour), the physical model doesnot performwell for beginner players. The reduction of the accuracyresults from the awkward and incorrect swing gestures performedby beginner players when they swing the racket too slow or toofast.
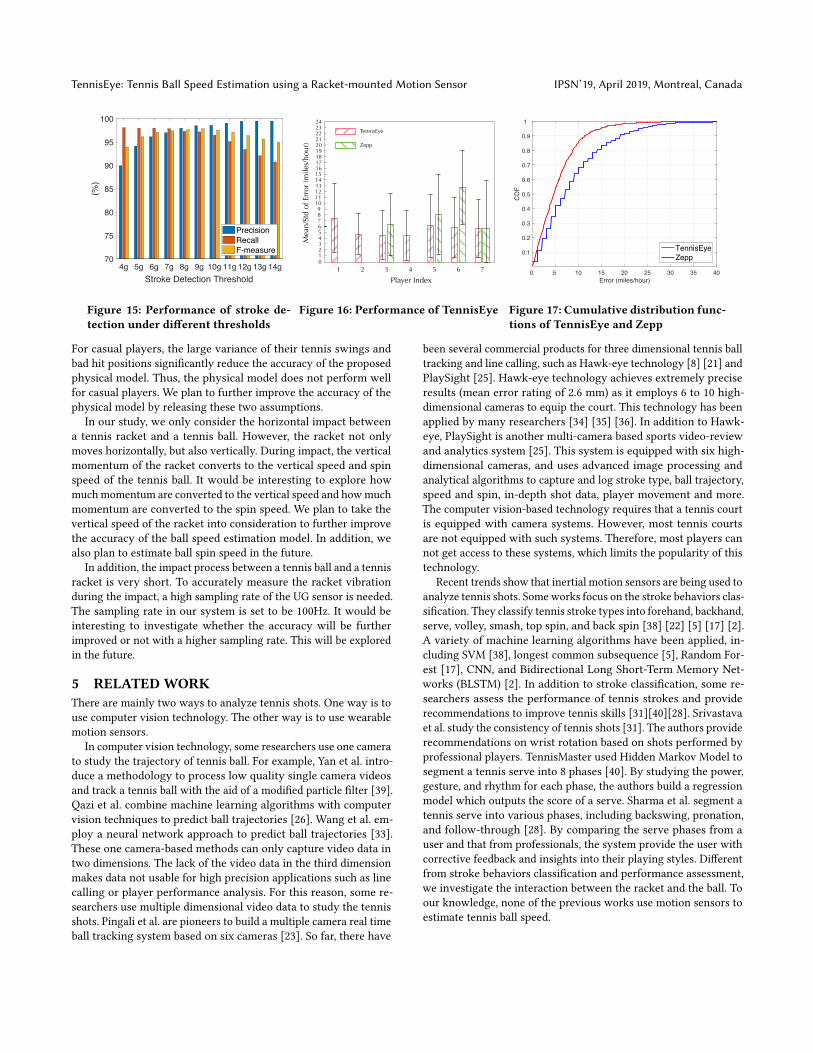
3.3 Stroke Detection AccuracyFig. 15 shows the performance of the stroke detection under differ-ent thresholds. Three evaluation metrics are considered: precision,recall, and F-measure. F-measure considers the balance betweenprecision and recall as described in Eq. 12:
F -measure = 2 ∗Precision ∗ Recall
Precision + Recall(12)
From the figure, we find that as the threshold increases, theprecision increases and the recall decreases. When the threshold is9д, the F-measure is at highest value: 97.8%. Therefore, we choose9д as the threshold for stroke detection. Under this threshold, theprecision and recall are 98.5% and 97.2%. The promising resultsshow the effectiveness of the proposed stroke detection method.
3.4 Stroke Classification AccuracyWe apply the WEKA machine-learning suite [11] to train five com-monly used classifiers. The classifiers include AdaBoost (run for 100
Table 5: Comparison of Machine Learning Algorithms forStroke Classification
Algorithm Precision Recall F-MeasureAdaBoost 92.1% 92.5% 92.3%
Naive Bayes 79.6% 71.6% 73.9%SVM 92.1% 94.2% 92.9%
Decision Tree 83.4% 85.3% 84.4%RandomForest 96.2% 98.2% 97.2%
iterations), Naive Bayes, SVM (with polynomial kernels), DecisionTree (equivalent to C4.5 [27]), and Random Forests (100 trees, 4random features each) [42]. Table 5 shows the performance of thesefive classifiers under 5-fold cross validation test. Same as strokedetection, precision, recall, and F-measure are considered as theevaluation metrics. From the table, we find that the Random Forestclassifier performs the best. The precision, recall, and F-measureare 96.2%, 98.2%, and 97.2%, respectively. Therefore, we choose theRandom Forest classifier for stroke classification.
3.5 TennisEye PerformanceFig. 16 shows the overall performance of TennisEye system andZepp using the leave-one-subject-out cross validation. Mean andstandard deviation of error are considered as the evaluation metrics.The cumulative distribution functions of TennisEye and Zepp areshown in Fig. 17. The error of TennisEye is 5.6±4.9 miles/hour,while that of Zepp is 8.9±7.8 miles/hour. The accuracy of TennisEyeis 88.2%, while that of Zepp is 77.4%. Therefore, TennisEye is 10.8%more accurate than Zepp in terms of the accuracy.
4 DISCUSSION AND FUTUREWORKIn our physical model, we make several assumptions. For example,we assume that the tennis ball horizontally hits and bounces off theracket. In addition, we assume that the ball impacts at the centerof the racket face. We make these two assumptions based on theobservations that coaches always swing the racket horizontally andhit the tennis ball at the sweet spot of the racket. However, we alsoobserve that the casual players often swing the racket at differentangles and hit the tennis ball at bad positions, i.e., racket frame.
TennisEye: Tennis Ball Speed Estimation using a Racket-mounted Motion Sensor IPSN’19, April 2019, Montreal, Canada
4g 5g 6g 7g 8g 9g 10g 11g 12g 13g 14gStroke Detection Threshold
70
75
80
85
90
95
100
(%)
PrecisionRecallF-measure
Figure 15: Performance of stroke de-tection under different thresholds
12
0
3456789
101112
24232221201918171615
1314
TennisEye
Zepp
1 2 3 4 5 6 7
Player Index
Mea
n/S
td o
f Er
ror
(miles
/hou
r)Figure 16: Performance of TennisEye
0 5 10 15 20 25 30 35 40Error (miles/hour)
0.1
0.2
0.3
0.4
0.5
0.6
0.7
0.8
0.9
1
CD
F
TennisEyeZepp
Figure 17: Cumulative distribution func-tions of TennisEye and Zepp
For casual players, the large variance of their tennis swings andbad hit positions significantly reduce the accuracy of the proposedphysical model. Thus, the physical model does not perform wellfor casual players. We plan to further improve the accuracy of thephysical model by releasing these two assumptions.
In our study, we only consider the horizontal impact betweena tennis racket and a tennis ball. However, the racket not onlymoves horizontally, but also vertically. During impact, the verticalmomentum of the racket converts to the vertical speed and spinspeed of the tennis ball. It would be interesting to explore howmuchmomentum are converted to the vertical speed and howmuchmomentum are converted to the spin speed. We plan to take thevertical speed of the racket into consideration to further improvethe accuracy of the ball speed estimation model. In addition, wealso plan to estimate ball spin speed in the future.
In addition, the impact process between a tennis ball and a tennisracket is very short. To accurately measure the racket vibrationduring the impact, a high sampling rate of the UG sensor is needed.The sampling rate in our system is set to be 100Hz. It would beinteresting to investigate whether the accuracy will be furtherimproved or not with a higher sampling rate. This will be exploredin the future.
5 RELATEDWORKThere are mainly two ways to analyze tennis shots. One way is touse computer vision technology. The other way is to use wearablemotion sensors.
In computer vision technology, some researchers use one camerato study the trajectory of tennis ball. For example, Yan et al. intro-duce a methodology to process low quality single camera videosand track a tennis ball with the aid of a modified particle filter [39].Qazi et al. combine machine learning algorithms with computervision techniques to predict ball trajectories [26]. Wang et al. em-ploy a neural network approach to predict ball trajectories [33].These one camera-based methods can only capture video data intwo dimensions. The lack of the video data in the third dimensionmakes data not usable for high precision applications such as linecalling or player performance analysis. For this reason, some re-searchers use multiple dimensional video data to study the tennisshots. Pingali et al. are pioneers to build a multiple camera real timeball tracking system based on six cameras [23]. So far, there have
been several commercial products for three dimensional tennis balltracking and line calling, such as Hawk-eye technology [8] [21] andPlaySight [25]. Hawk-eye technology achieves extremely preciseresults (mean error rating of 2.6 mm) as it employs 6 to 10 high-dimensional cameras to equip the court. This technology has beenapplied by many researchers [34] [35] [36]. In addition to Hawk-eye, PlaySight is another multi-camera based sports video-reviewand analytics system [25]. This system is equipped with six high-dimensional cameras, and uses advanced image processing andanalytical algorithms to capture and log stroke type, ball trajectory,speed and spin, in-depth shot data, player movement and more.The computer vision-based technology requires that a tennis courtis equipped with camera systems. However, most tennis courtsare not equipped with such systems. Therefore, most players cannot get access to these systems, which limits the popularity of thistechnology.
Recent trends show that inertial motion sensors are being used toanalyze tennis shots. Someworks focus on the stroke behaviors clas-sification. They classify tennis stroke types into forehand, backhand,serve, volley, smash, top spin, and back spin [38] [22] [5] [17] [2].A variety of machine learning algorithms have been applied, in-cluding SVM [38], longest common subsequence [5], Random For-est [17], CNN, and Bidirectional Long Short-Term Memory Net-works (BLSTM) [2]. In addition to stroke classification, some re-searchers assess the performance of tennis strokes and providerecommendations to improve tennis skills [31][40][28]. Srivastavaet al. study the consistency of tennis shots [31]. The authors providerecommendations on wrist rotation based on shots performed byprofessional players. TennisMaster used Hidden Markov Model tosegment a tennis serve into 8 phases [40]. By studying the power,gesture, and rhythm for each phase, the authors build a regressionmodel which outputs the score of a serve. Sharma et al. segment atennis serve into various phases, including backswing, pronation,and follow-through [28]. By comparing the serve phases from auser and that from professionals, the system provide the user withcorrective feedback and insights into their playing styles. Differentfrom stroke behaviors classification and performance assessment,we investigate the interaction between the racket and the ball. Toour knowledge, none of the previous works use motion sensors toestimate tennis ball speed.
IPSN’19, April 2019, Montreal, Canada Hongyang Zhao, Shuangquan Wang, Gang Zhou, and Woosub Jung
In addition to these research works, there are also some com-mercial products on the market that assess the performance ofthe players, such as Zepp [41], Usense [32], Babolat Play [24], andBabolat Pure Drive [7]. These products either integrate the motionsensors inside the racket [7], or require users to attach the motionsensors onto the racket [41] [32] [24]. They analyze the tennis dataand compute the key performance metrics for each swing, such asstroke type, ball speed, ball spin, and sweet spot. However, none ofthese commercial products opens their algorithms to the public. Inaddition, we compare our proposed ball speed calculation algorithmwith the ball speed calculation algorithm in Zepp. The evaluationresults show that our algorithm is more accurate than that in Zepp.
6 CONCLUSIONIn this paper, we propose TennisEye, a tennis ball speed calculationsystem using a racket-mounted sensor. It detects tennis strokes,recognizes stroke types, and calculates the ball speed. We proposea regression model to estimate the serve speed. In addition, wepropose two models, a regression model and a physical model,to estimate the groundstroke and volley ball speed for beginnerand advanced players, respectively. For the leave-one-subject-outcross-validation test, experiments with human subjects show thatthe TennisEye is 10.8% more accurate than the state-of-the-artwork. TennisEye is promising and has commercial potential as itis lightweight and more accurate than the existing commercialproduct.
REFERENCES[1] Amin Ahmadi, Edmond Mitchell, Francois Destelle, Marc Gowing, Noel E
O’Connor, Chris Richter, and Kieran Moran. 2014. Automatic activity classifica-tion and movement assessment during a sports training session using wearableinertial sensors. In Proceedings of the IEEE BSN. IEEE, 98–103.
[2] Akash Anand, Manish Sharma, Rupika Srivastava, Lakshmi Kaligounder, andDivya Prakash. 2017. Wearable Motion Sensor Based Analysis of Swing Sports.In Proceedings of the IEEE ICMLA. IEEE, 261–267.
[3] Peter Blank, Benjamin H Groh, and Bjoern M Eskofier. 2017. Ball speed and spinestimation in table tennis using a racket-mounted inertial sensor. In Proceedingsof the ACM ISWC. ACM, 2–9.
[4] Howard Brody. 1997. The physics of tennis. III. The ball–racket interaction.American Journal of Physics 65, 10 (1997), 981–987.
[5] Lars Büthe, Ulf Blanke, Haralds Capkevics, and Gerhard Tröster. 2016. A wearablesensing system for timing analysis in tennis. In Proceedings of the IEEE BSN. IEEE,43–48.
[6] Carl De Boor, Carl De Boor, Etats-Unis Mathématicien, Carl De Boor, and CarlDe Boor. 1978. A practical guide to splines. Vol. 27. Springer.
[7] Babolat Pure Drive. 2019. https://www.babolat.us/product/tennis/generic/pure-drive-play-102229.
[8] Hawk eye innovations. 2018. http://www.hawkeyeinnovations.co.uk/sports/tennis.
[9] Biyi Fang, Nicholas D Lane, Mi Zhang, and Fahim Kawsar. 2016. Headscan: Awearable system for radio-based sensing of head and mouth-related activities. InProceedings of the ACM/IEEE IPSN. IEEE, 1–12.
[10] Benjamin H Groh, Frank Warschun, Martin Deininger, Thomas Kautz, ChristineMartindale, and Bjoern M Eskofier. 2017. Automated ski velocity and jumplength determination in ski jumping based on unobtrusive and wearable sensors.Proceedings of the ACM IMWUT 1, 3 (2017), 53.
[11] Mark Hall, Eibe Frank, Geoffrey Holmes, Bernhard Pfahringer, Peter Reutemann,and Ian HWitten. 2009. The WEKA data mining software: an update. Proceedingsof the ACM SIGKDD 11, 1 (2009), 10–18.
[12] Tian Hao, Guoliang Xing, and Gang Zhou. 2015. RunBuddy: a smartphonesystem for running rhythm monitoring. In Proceedings of the ACM Ubicomp.ACM, 133–144.
[13] Global Wearable Devices in Sports Market. 2018. https://www.researchandmarkets.com/research/k8p2gz/global_wearable?w=4.
[14] Aftab Khan, James Nicholson, and Thomas Plötz. 2017. Activity Recognition forQuality Assessment of Batting Shots in Cricket using a Hierarchical Representa-tion. Proceedings of the ACM IMWUT 1, 3 (2017), 62.
[15] Cassim Ladha, Nils Y Hammerla, Patrick Olivier, and Thomas Plötz. 2013.ClimbAX: skill assessment for climbing enthusiasts. In Proceedings of the ACMUbicomp. ACM, 235–244.
[16] Industrial Wearable Devices Market. 2018. https://www.researchandmarkets.com/research/nrtbv9/global_industrial?w=4.
[17] Miha Mlakar and Mitja Luštrek. 2017. Analyzing tennis game through sensordata with machine learning and multi-objective optimization. In Proceedings ofthe ACM ISWC. ACM, 153–156.
[18] Frank Mokaya, Roland Lucas, Hae Young Noh, and Pei Zhang. 2016. Burnout: awearable system for unobtrusive skeletal muscle fatigue estimation. In Proceedingsof the ACM/IEEE IPSN. IEEE, 1–12.
[19] Andreas Möller, Luis Roalter, Stefan Diewald, Johannes Scherr, Matthias Kranz,Nils Hammerla, Patrick Olivier, and Thomas Plötz. 2012. Gymskill: A personaltrainer for physical exercises. In Proceedings of the IEEE PerCom. IEEE, 213–220.
[20] Conservation of Linear Momentum. 2018. https://en.wikipedia.org/wiki/Momentum.
[21] NEIL Owens, C Harris, and C Stennett. 2003. Hawk-eye tennis system. In Pro-ceedings of the IET VIE. IET, 182–185.
[22] Weiping Pei, Jun Wang, Xubin Xu, Zhengwei Wu, and Xiaorong Du. 2017. Anembedded 6-axis sensor based recognition for tennis stroke. In Proceedings of theIEEE ICCE. IEEE, 55–58.
[23] Gopal Pingali, Agata Opalach, and Yves Jean. 2000. Ball tracking and virtualreplays for innovative tennis broadcasts. In Proceedings of the IEEE Pattern Recog-nition, Vol. 4. IEEE, 152–156.
[24] Babolat Play. 2019. http://en.babolatplay.com/play.[25] PlaySight. 2018. http://playsight.com/.[26] Tayeba Qazi, Prerana Mukherjee, Siddharth Srivastava, Brejesh Lall, and
Nathi Ram Chauhan. 2015. Automated ball tracking in tennis videos. In Proceed-ings of the IEEE ICIIP. IEEE, 236–240.
[27] J Ross Quinlan. 2014. C4. 5: programs for machine learning. Elsevier.[28] Manish Sharma, Rupika Srivastava, Akash Anand, Divya Prakash, and Lakshmi
Kaligounder. 2017. Wearable motion sensor based phasic analysis of tennis servefor performance feedback. In Proceedings of the IEEE ICASSP. IEEE, 5945–5949.
[29] Sony. 2019. https://www.sony.com.au/microsite/tennis/.[30] Least squares. 2018. https://en.wikipedia.org/wiki/Least_squares.[31] Rupika Srivastava, Ayush Patwari, Sunil Kumar, Gaurav Mishra, Laksmi
Kaligounder, and Purnendu Sinha. 2015. Efficient characterization of tennisshots and game analysis using wearable sensors data. In Proceedings of the IEEESENSORS. IEEE, 1–4.
[32] Usense. 2018. http://www.ubc-tech.com/en/index.html.[33] Qizhi Wang, KangJie Zhang, and DengdianWang. 2014. The trajectory prediction
and analysis of spinning ball for a table tennis robot application. In Proceedingsof the IEEE CYBER. IEEE, 496–501.
[34] Xinyu Wei, Patrick Lucey, Stuart Morgan, and Sridha Sridharan. 2013. Predictingshot locations in tennis using spatiotemporal data. In Proceedings of the IEEEDICTA. IEEE, 1–8.
[35] XinyuWei, Patrick Lucey, Stuart Morgan, and Sridha Sridharan. 2013. Sweet-spot:Using spatiotemporal data to discover and predict shots in tennis. In Proceedingsof the Annual MIT Sloan Sports Analytics Conference.
[36] Xinyu Wei, Patrick Lucey, Stephen Vidas, Stuart Morgan, and Sridha Sridharan.2014. Forecasting events using an augmented hidden conditional random field.In Proceedings of the Springer ACCV. Springer, 569–582.
[37] Graham Weir and Peter McGavin. 2008. The coefficient of restitution for theidealized impact of a spherical, nano-scale particle on a rigid plane. In Proceedingsof the Royal Society of London A: Mathematical, Physical and Engineering Sciences,Vol. 464. The Royal Society, 1295–1307.
[38] DavidWhiteside, Olivia Cant, Molly Connolly, andMachar Reid. 2017. Monitoringhitting load in tennis using inertial sensors and machine learning. Internationaljournal of sports physiology and performance 12, 9 (2017), 1212–1217.
[39] Fei Yan, W Christmas, and Josef Kittler. 2005. A tennis ball tracking algorithmfor automatic annotation of tennis match. In Proceedings of the BMVC, Vol. 2.619–628.
[40] Disheng Yang, Jian Tang, Yang Huang, Chao Xu, Jinyang Li, Liang Hu, GuobinShen, Chieh-Jan Mike Liang, and Hengchang Liu. 2017. TennisMaster: an IMU-based online serve performance evaluation system. In Proceedings of the ACMAH. ACM, 17.
[41] Zepp. 2018. http://www.zepp.com/tennis/.[42] Shibo Zhang, William Stogin, and Nabil Alshurafa. 2018. I sense overeating:
Motif-based machine learning framework to detect overeating using wrist-wornsensing. Information Fusion 41 (2018), 37–47.
[43] Hongyang Zhao, Shuangquan Wang, Gang Zhou, and Daqing Zhang. 2018.Ultigesture: A Wristband-based Platform for Continuous Gesture Control inHealthcare. Smart Health (2018).
[44] Bo Zhou, Harald Koerger, Markus Wirth, Constantin Zwick, Christine Martin-dale, Heber Cruz, Bjoern Eskofier, and Paul Lukowicz. 2016. Smart soccer shoe:monitoring foot-ball interaction with shoe integrated textile pressure sensormatrix. In Proceedings of the ACM ISWC. ACM, 64–71.