tennessee department of financial institutions|43rd … · 2018-08-16 · insurance premium finance...
TRANSCRIPT

Tennessee Department of Financial Institutions|43rd Annual Report |

Dear Governor Haslam and Citizens of the State of
Tennessee:
I am pleased to present the 43rd Annual Report of the
Department of Financial Institutions.
The Department regulates banks, credit unions, trust
companies, business and industrial development
corporations, industrial loan and thrift companies,
insurance premium finance companies, mortgage lenders,
brokers, servicers and originators, title pledge lenders,
check cashers, deferred presentment services companies,
money transmitters and flexible credit act lenders.
We play a vital role in regulating and supporting the
financial services industry and ensuring that Tennessee
financial institutions remain fiscally strong and comply with
governing authority.
The Department’s mission is to ensure a safe and sound system of state-chartered institutions for
Tennessee citizens, while giving institutions the opportunity to contribute to economic progress. In
short, we seek to find balanced regulation. The condition of the Tennessee banking system
continues to improve from the economic downturn. Tennessee state-chartered depository
institutions remain well positioned to continue serving their communities.
Although continued consolidation within the banking industry is anticipated in 2018, total loans and
assets continue to increase and the complexity and breadth of operations continue to grow. The
first state banking charter since 2008 was approved and issued in 2017. The Department also
received a second application for a new Tennessee state bank in 2017.
The Department recommends legislation in 2018. We recommend legislation that allows family
private trust companies to serve up to 35 full-time employees of a family affiliate and that sets out
the Department’s process for modifying or revoking an exemption from the provisions of the
Tennessee Banking Act previously granted to a family private trust company. We also recommend
legislation amending the Financial Institutions Conversion Act that would authorize an out of state
financial institution to apply under the Act to convert to a Tennessee chartered financial institution.
The Department continues to develop and implement its Regulatory Balance mission for depository
institutions. Department examiners seek to right size regulation to the merits of each institution and
avoid a one size fits all approach in order to support the Governor’s economic goals for Tennessee.
The Tennessee banking system is critical to the state’s economic vitality and the Department’s
balanced regulatory approach supports economic progress.
With respect to non-deposit companies, the Department has established a risk focused examination
program that establishes a risk profile on licensed locations so that we can focus more resources on
companies that are high risk. The goal is to improve the operations of non-deposit companies by
sharing risk assessment information with each licensee.

In an effort to support the efficient and effective regulation of financial institutions, the Department
implemented Alternative Workplace Solutions to reduce the office space that the Department is
assigned by nearly 75%, avoiding over $400,000 in annual cost. Nearly 90% of Department staff are
either a mobile worker or working from home. The expectation is to better retain employees and
create more experience to further help us find regulatory balance.
Our experience indicates that financial literacy is one of the keys to dealing with the economic issues
facing us today. The Department has initiated a number of activities in recent years. Public service
announcements, workshops, consumer alerts, panel discussions and an effort to reach Tennessee
teachers and students were all a part of this effort. I serve on the board of the Tennessee Financial
Literacy Commission. The mission of the Tennessee Financial Literacy Commission is to equip
Tennesseans to make sound financial decisions when it comes to planning, saving and investing. A
financially literate public is a key factor in establishing a safe and sound system of financial
institutions.
Throughout this report you will find additional information related to the work of this agency, as well
as the condition of the entities the Department regulates. As you read this report, you will notice
that Tennessee remains a premier state for banking, trust and financial services companies. On
behalf of the employees of the Department, this report is respectfully submitted.
Sincerely,

Department Overview
Mission and Vision Statements 5
Commissioner Greg Gonzales Bio 6
Department Overview 7
TDFI/TEMA Cybersecurity Exercise 8
Administrative Division
Commissioner’s Office, Administrative Division Narrative and Personnel 9
Fiscal Review 10-11
Human Resources and Training Section Narrative 12-13
Legal Section Narrative 14
2016 Legislation and Rulemaking 14-17
Consumer Resources Section Narrative 18
Consumer Protection 18
Consumer Complaints 19-22
Consumer Education and Financial Outreach 23
Bank Division
Bank Division Narrative and Personnel 24-27
Application Activities 27-28
Information at a Glance 28
BIDCO Data and Additional Financial Information for State-Chartered Banks 28-38
Additional Financial Information for State-Chartered Trust Companies 39-40
Compliance Division
Compliance Division Narrative and Personnel 41-42
Regulatory Oversight 43
Fiscal Year Highlights 43-46
Check Cashing Companies 46
Deferred Presentment Services Providers 47-48
Flexible Credit Lenders 49-50
Home Equity Conversion Mortgage Lenders 51
Industrial Loan and Thrift Companies (TILT) 51-53
Insurance Premium Finance Companies 53
Money Transmitters 53-54
Residential Mortgage Lenders, Brokers and Servicers 54
Residential Mortgage Loan Originators 54-55
Title Pledge Lenders 55-57
Credit Union Division
Credit Union Narrative and Personnel 58-59
Transactions and Financial Information for State-Chartered Credit Unions 60-70

5 | P a g e
The primary statutory mission of the Department of Financial Institutions is to provide the people of
Tennessee with a safe and sound system of banks and other institutions by ensuring safety and
soundness and compliance with governing law, while giving institutions the opportunity to
contribute to the economic progress of Tennessee and the nation.
Our vision is the establishment of a regulatory program that provides for a sound state financial
services system within which institutions have the opportunity to succeed and serve their
communities by encouraging commerce while there is strong enforcement of laws and regulations
to protect citizens.

6 | P a g e
Greg Gonzales is the 18th commissioner of the Tennessee Department of Financial Institutions, who
began serving in this role in 2005, and was reappointed by Governor Bill Haslam. He has served in
the department since 1986. In this position, Gonzales serves as Tennessee’s chief regulatory officer
of all state-chartered depository and licensed non-depository financial institutions. Additionally, he
has served as assistant commissioner and general counsel for the department.
Gonzales is a past Chairman of the Conference of State Bank Supervisors (CSBS), which is the
professional organization of state banking commissioners in the United States. Commissioner
Gonzales, for a number of years, served as a member of the Board of Directors of the Money
Transmitter Regulators Association (MTRA), an organization of a majority of the states that regulate
funds transfer companies. He serves as Chairman of the State Liaison Committee that incorporates
the state supervisory perspective into the Federal Financial Institutions Examination Council. The
FFIEC affects regulatory guidance on all depository financial institutions in the United States. He
served on the U.S. Treasury’s Bank Secrecy Act Advisory Group. Commissioner Gonzales currently
serves on the Board of Directors of the Tennessee Financial Literacy Commission. Gonzales also
currently serves on a national task force studying how new technologies are affecting the U.S.
payment systems.
Commissioner Gonzales was born in Cookeville, Tennessee and graduated Cum Laude in Cursu
Honorum with a bachelor’s degree from Tennessee Technological University in 1980. Gonzales
served as a research assistant in 1980 to Sir Patrick Cormack, a Conservative Party member of the
British Parliament. He earned a law degree from the University of Tennessee in 1984.
Commissioner Gonzales is an avid baseball fan and has rooted for the Chicago Cubs since the 1960s,
which has taught him great life lessons in perseverance and that loyalty is eventually rewarded.

7 | P a g e
CHARTERS June 30, 2016 June 30, 2017
Commercial Banks/Savings Banks 145 138
Trust Companies 10 10
Credit Unions 87 85
TOTAL NUMBER OF CHARTERS 242 233
LICENSEES/REGISTRANTS June 30, 2016 June 30,2017
Business and Industrial Development Corporations (BIDCOS)
BIDCOs
1 1
Check Cashing Companies 563 550
Deferred Presentment Services Providers 1,052 961
Flexible Credit Lenders 463 568
Insurance Premium Finance Companies 54 50
Industrial Loan and Thrift Companies 1,410 1,102
Money Transmitters 102 114
Mortgage Companies 606 620
Mortgage Loan Originators 10,215 11,966
Title Pledge Lenders 960 830
TOTAL NUMBER OF LICENSEES/REGISTRANTS 15,426 16,762
LICENSEES / REGISTRANTS TOTAL
Check Cashing Companies $1,456.74
Deferred Presentment Services
Providers
$263,328.22
Flexible Credit Lenders $1,248,963.40
Mortgage Companies $976,934.50
Industrial Loan and Thrift Companies $38,346.70
Insurance Premium Finance Companies $64.09
Title Pledge Lenders $124,036.74
TOTAL REFUNDED $2,653,130.39

8 | P a g e
The Department of Financial Institutions (TDFI) conducted a 2017 Cybersecurity Exercise on June 14,
2017 at the Department of Labor & Work Force Development, 220 French Landing Way, Nashville,
Tennessee. The exercise was conducted in the Tennessee Room on the First Floor of the
Department of Labor & Work Force Development building which is TDFI’s alternative location in the
event the Tennessee Tower main office location is not available. This cybersecurity exercise
afforded executive staff the opportunity to familiarize themselves with the alternative location, as
well as, participate in the first ever internal cybersecurity exercise. The event included a
cybersecurity table-top exercise with assistance from the Federal Deposit Insurance Corporation
(FDIC), and speakers from the Federal Bureau of Investigation (FBI) and cybersecurity industry. This
provided insight to cybersecurity processes to protect our financial institution industries. All areas
of the department participated in the exercise consisting of the Commissioner, Deputy
Commissioner, Bank Division, Compliance Division, Credit Union Division, Legal Section, Consumer
Resources Section, Human Resources, Strategic Technology Solutions, and Public Information
Officer. The exercise acclimated personnel to aspects of responsibilities in the event a Tennessee
financial institution is successfully attacked by cyber operatives. The event objectives were:
The exercise was designed to facilitate the department’s readiness in the event a financial institution
is subjected to cybersecurity issues and our role to assist the financial institution to ensure minimal
impact to customers, personnel, and community. These sessions provided the exploration of the
aspects in identifying, measuring, monitoring, and controlling risk associated with cybersecurity.
Through lectures, cybersecurity test, and table top exercises, individuals were challenged to
participate in discussions and outline official standard operating procedures to ensure continued
operations in the event a financial institution is impacted.
The department’s cybersecurity training exercise was further utilized in building and completing a
Tennessee Financial Institution Cybersecurity Exercise in Nashville, Jackson, and Knoxville in
October, 2017, which was one of the first in the country sponsored by a financial institution
regulatory agency for banks, credit unions, and public trust companies. The exercise was attended
by ninety-three (93) Tennessee Financial Institutions with 144 participants. The exercise included
speakers from the FBI; U.S. Secret Service; US Department of Homeland Security; Tennessee
Emergency Management Agency (TEMA); the cybersecurity industry; and the TDFI. The department
continues to plan for future cybersecurity training events in 2018.
Determine department responsibilities and
actions in regards to a cyber-attack on a
financial institution.
Develop a standard operating procedure
for the department’s response to a cyber-
attack against a financial institution.
Identify department resources available to
financial institutions in regards to
cybersecurity attacks.

9 | P a g e
The Administrative Division manages the department’s budget
and oversees fiscal services, human resources, training and
development, legal, information systems, and consumer
resources. Therefore, the Administrative Division provides
support to the three regulatory divisions.
Greg Gonzales, Commissioner
Alica Owen, Executive Assistant/Public Information Officer
Herb Kraycirik, CPA, CGFM, Audit Director
Tina G. Miller, Deputy Commissioner
Christy Adams, Administrative Services Manager
Joyce Simmons, Chief Regulatory Accountant
CONSUMER RESOURCES SECTION
Alan Smith, Consumer Resources Director
Alicia Gay, Administrative Services Assistant
Bettye Osborne, Administrative Services Assistant
HUMAN RESOURCES SECTION
Leslie Yanez, M.S., SPHR, SHRM-SCP, HR & Training
Director
Teri Crow, HR Analyst
Carmen McCreedy, Administrative Services
Assistant
Kelley Murray, HR Assistant
FISCAL SECTION
Michelle Berry, CPA, Budget/Fiscal Director
James Stack, Budget Analyst
LEGAL SECTION
Marsha Anderson, General Counsel
Sarah Branch, Assistant General Counsel
Paula Cagle, Executive Administrative Assistant
Denise Cole, Deputy General Counsel
Daniel Espensen, Assistant General Counsel
Mark Kilpatrick, Assistant General Counsel
Troy McPeak, Assistant General Counsel
Eric Rogers, Chief Legal Counsel-Compliance
Division
Todd Staley, Legislative Liaison/Assistant General
Counsel
Personnel Designation: M.S., Master’s Degree, SPHR, Senior Professional of Human Resources, SHRM-SCP, Society of Human
Resource Management-Senior Certified Professional, CPA, Certified Public Accountant, CGFM, Certified Government Financial
Manager

10 | P a g e
The Department of Financial
Institutions receives no federal
or state taxpayer funds and is
fully funded by the fees assessed
to the financial institutions
regulated and supervised by the
department.
In addition to the 2017 revenue
source chart, in late FY 2012, the
department received one time
settlement funds totaling
$1,000,000 from a nationwide
settlement. At June 30, 2016, the remaining balance of these funds totaled $672,600 and was
carried forward to FY 2017.
State-Chartered Banks
State-Chartered Credit Unions
Business and Industrial Development
Corporations (BIDCOS)
Trust Companies
Check Cashing Companies
Deferred Presentment Services Providers
Flexible Credit Lenders
Industrial Loan and Thrift Companies
Insurance Premium Finance Companies
Money Transmitters
Residential Mortgage Lenders, Brokers and
Servicers
Mortgage Loan Originators
Title Pledge Lenders
$10,533,800
$2,203,200
$5,937,000
REVENUE SOURCES
AMOUNT
(ROUNDED TO
NEAREST HUNDRED
DOLLARS)
PERCENT OF
TOTAL
REVENUE
COLLECTED
Bank Division Fees $10,533,800 56%
Credit Union Division
Fees $2,203,200 12%
Compliance Division
Fees $5,937,000 32%
TOTAL REVENUES $18,674,000 100%
Bank Division Fees
Credit Union Division Fees
Compliance Division Fees

11 | P a g e
EXPENDITURE
CATEGORY
AMOUNT (ROUNDED TO
NEAREST HUNDRED
DOLLARS)
PERCENT OF TOTAL
EXPENDITURES
Regular Salaries $10,127,800 59%
Benefits $3,703,700 22%
Professional Services State
Agencies $1,932,400 11%
Travel $638,000 4%
Data Processing $260,800 2%
Professional Services Third
Party $231,100 1%
Other $173,200 1%
TOTAL EXPENDITURES $17,067,300 100%
59% 22%
11%
4% 2%
1%
1%
EXPENDITURES
Regular Salaries
Benefits
Professional ServicesState Agencies
Travel
Data Processing
Professional ServicesThird Party
Other

12 | P a g e
The Human Resources and Training Section in the TDFI Administrative Division coordinates and
provides customer service to employees on issues/matters related to benefits, time and labor
processing, policy clarification, personnel file management, recruitment and hiring, performance
management, employee relations, worker’s compensation, Family Medical Leave, ADAAA
Accommodations and other matters related to an employee’s welfare and/or job performance. We
also provide Edison support by ensuring employee’s personnel records and training records are
updated in Edison. In addition to supporting our employees, the Human Resources and Training
Section staff works collectively with department management and leadership to provide reports and
data related to turnover, demographics, staffing, leave accruals and other information related to
personnel and staffing. We also work collectively with management to establish position
classifications to ensure we maintain a qualified, experienced staff able to carry out the
department’s regulatory responsibilities.
Over the past few years, the State of Tennessee has
worked to develop and improve a performance
management system that directs employee
performance through SMART work outcomes.
Department management has worked diligently to
ensure that Individual Performance Plans have
work outcomes that meet the SMART format
criteria. Following an audit conducted by the
Department of Human Resources, TDFI was ranked
as the number one state agency for the highest
percentage of work outcomes compliant with the
SMART format. Department management have
also participated in training on the State of
Tennessee Talent Management process to further
support our efforts to develop a qualified workforce and assist us in our succession planning efforts.
During this past year, greater emphasis has been placed on employee development. As a Certified
Learning Facilitator, the Human Resources Director facilitates training for staff and management
related to state and department policies as well as Department of Human Resources curricula.
Having our own certified Learning Facilitator has afforded the department greater flexibility to
ensure staff and management are able to participate in required and requested training in a
manner that can accommodate their regulatory and examination responsibilities. TDFI is dedicated
to developing a competent leadership team and has embraced the mindset of continuous learning.
In that effort, department management have been working to complete the learning modules in the
State of Tennessee Management and Leadership Learning Pyramid. As of June 30, 2017, 97% of the
department’s management staff completed level one and 90% have completed level two of the
learning pyramid.

13 | P a g e
In addition to the examiner training that many of our staff participates in each year, leadership
development has become increasingly important to TDFI. During this past year, we had one
employee participate in and graduated from Tennessee Government Executive Institute; one
employee participated in and graduated from Tennessee Government Management Institute; two
employees participated in and graduated from LEAD Tennessee; one employee participated in and
graduated from Accelerated Leadership Institute and fifteen employees participated in and
graduated from our own Commissioner’s Leadership Academy, developed in consultation with the
Department of Human Resources. The Commissioner’s philosophy that all employees have the
opportunity to be a leader in their current position has resulted in staff from all position
classifications being afforded the chance to participate in the Commissioner’s Leadership Academy.
The department’s efforts to participate in the state’s Alternative Workforce Solutions program
continue to be successful and staff have worked to embrace available technology for meetings and
some training that can be accomplished outside of a classroom setting. As of June 30, 2017, only
sixteen (16) department employees are permanently assigned work on a daily basis in the Nashville
office. 90% of our department employees are classified as either mobile workers or work at home.
Mobile workers generally report on a daily basis to a financial institution to participate in an
examination. On days when they do not report to a financial institution, they work at home.
Employees classified as work at home, generally work at home a minimum of three (3) days per
week and work at the office on an average of two (2) days per week. Implementation of AWS has
reduced office expenses, employee travel and parking in the Nashville area as well as increased
productivity and improved morale. The ability to work at home has resulted in lower utilization of
sick leave as well as enabled staff to work at home in lieu of utilizing Administrative Leave with Pay
when inclement weather has resulted in the closing of state offices.
2016/2017 Commissioner’s Leadership Academy Graduates pictured above left to right: Gina Tarolli—Bank Division, Denise Cole—Administrative Division/Legal, Alan Smith—
Administrative Division/CRS, Sherri Cassetty—Bank Division, Chad Haney—Compliance Division, Paula Cagle—Administrative Division/Legal, Mark Herren—Bank Division, Teri
Crow—Administrative Division/HR, Daniel Espensen—Administrative Division/Legal, Jim Eller—Credit Union Division, Phil Stafford—Bank Division, Debra Grissom—Bank/Credit
Union Division, Robert Walker—Compliance Division. Not pictured: Robert Heisse—Credit Union Division and Joshua Evans—Credit Union Division.

14 | P a g e
The Legal Section provides legal advice and
representation for the department. It is
comprised of a general counsel, seven staff
attorneys and one legal assistant.
The Legal Section advises the Commissioner
and departmental personnel in all legal
matters affecting the department. They work
closely with regulated entities and the general
public in addressing legal issues. They also
work with the Governor’s Office and the
Tennessee General Assembly on legislative
issues affecting financial institutions.
The Legal Section also assists in the coordination of enforcement initiatives with other federal and
state regulators as well as with various law enforcement agencies. The Legal Section represents the
department in all administrative enforcement actions initiated by the various divisions in the
department.
The Legal Section was heavily involved in the 2017 legislative session by analyzing and tracking bills,
working closely with the Governor’s Office, the General Assembly, and other groups sponsoring
legislation which impacted the department. The Legal Section provided assistance to divisions on a
myriad of legal issues, ranging from issues pertaining to bank, trust company and credit union
applications and operations, consumer lenders, including industrial loan and thrift companies, title
pledge lenders, deferred presentment services providers, and flexible credit lenders, to issues
involving mortgage companies, mortgage loan originator registration, money transmitter licensing,
and check cashers, as well as other areas requiring legal expertise.
Public Chapter 122 amends the Industrial Loan and Thrift Companies Act (T.C.A. §§ 45-5-101 et seq.),
the Tennessee Title Pledge Act (T.C.A. §§ 45-15-101 et seq.), the Check Cashing Act of 1997 (T.C.A. §§
45-18-101 et seq.), and the Premium Finance Company Act of 1980 (T.C.A. §§ 56-37-101 et seq.) to
authorize the commissioner to require persons subject to these acts to be registered/licensed
through a multi-state automated licensing system (known as the NMLS). Because the NMLS requires
registration/licensing expiration dates to be set to December 31, Public Chapter 122 further changes
the annual registration/license expiration dates from March 31 to December 31 for industrial loan
and thrift companies (beginning in 2018), check cashers (beginning in 2018) and premium finance
companies (beginning in 2019) and provides for appropriate transition periods to such expiration
dates.

15 | P a g e
Public Chapter 122 also amends the Tennessee Residential Lending, Brokerage and Servicing Act,
specifically at T.C.A. § 45-13-208, by eliminating an annual reporting requirement for mortgage
licensees because the information is otherwise available to the department from other required
reports. (Effective July 1, 2017).
Public Chapter 164 amends the Industrial Loan and Thrift Companies Act, specifically at T.C.A. § 45-
5-301(2), by authorizing registrants under the Act to charge interest at any rate not in excess of a
maximum effective rate of thirty percent (30%) per annum on loans where the total amount of the
loan is one hundred dollars ($100) up to five thousand dollars ($5,000). Public Chapter 164 further
provides that, where the total amount of the loan is more than five thousand dollars ($5,000), the
maximum effective rate of interest remains at twenty four percent (24%) per annum.
Public Chapter 190 amends T.C.A. Title 45, Chapter 4, Part 4, specifically § 45-4-405(a), by increasing
from ten thousand dollars ($10,000) to fifteen thousand dollars ($15,000), the aggregate amount
that a credit union may disburse from a decedent’s account or safe deposit box in cases where no
executor or administrator has qualified and provided notice to the credit union.
Public Chapter 225 amends the provisions in the Tennessee Banking Act relating to credit card state
banks, specifically T.C.A. § 45-2-1904(a), by increasing the rate of interest that may be charged under
these provisions from twenty-one percent (21%) to an annual rate not exceeding thirty percent
(30%) per year or at an equivalent daily, weekly, monthly, or quarterly rate.
Public Chapter 264, in Section 1, enacts the “Elderly and Vulnerable Adult Financial Exploitation
Prevention Act.” In general, this Act, allows, but does not require, a “financial service provider” who
has reasonable cause to suspect that “financial exploitation” may have occurred, may have been
attempted, or is being attempted, to refuse or delay a “financial transaction” on an account of an
“elderly adult” or “vulnerable adult”, on an account of which the elderly adult or vulnerable adult is a
beneficiary or of an account of a person suspected of perpetrating financial exploitation. This Act
further sets out the time and circumstances in which the financial service provider’s refusal to
conduct or hold a financial transaction expires. Moreover, this Act allows, but does not require, a
financial service provider to offer an elderly or vulnerable adult the opportunity to submit a list of
persons to contact when the financial service provider has reasonable cause to suspect financial
exploitation and specifies others, in addition to those on the list, that the financial service provider
may notify when the financial service provider has reasonable cause to suspect financial
exploitation. This Act also allows a financial service provider to refuse to accept a power of attorney
when there is reasonable cause to suspect financial exploitation by the agent or person acting for or

16 | P a g e
with the agent. Additionally, this Act contains certain immunity provisions pertaining to actions
taken pursuant to the Act. On June 30, 2022, this Act shall be repealed.
Public Chapter 264, in Sections 2-4, makes amendments to the Financial Records Privacy Act (T.C.A.
§§ 45-10-101 et seq.). Specifically, Public Chapter 264 adds a new section, T.C.A. § 45-10-119, which,
among other things, requires financial institutions to provide access to or copies of records in
response to certain administrative subpoenas issued by the department of human services, adult
protective services. Further, Public Chapter 264 updates § 45-10-109, pertaining to charges for
producing records in response to a subpoena by replacing a reference to the internal revenue
service with a reference to a financial institution’s published fee schedule, and also makes changes
to § 45-10-103(8) regarding furnishing of information or records in response to certain subpoenas.
Public Chapter 264, Section 5, amends the Tennessee Banking Act at T.C.A. § 45-2-704(a)(5) to allow a
bank to recover costs, including attorneys’ fees, in interpleader actions involving deposit accounts
made in trust, whether the interpleader action is initiated by the bank or the bank joins in, is joined
into, or defends in any manner, the interpleader action.
Pursuant to Public Chapter 264, Section 6, the Department of Financial Institutions is encouraged to
consult with financial service providers, the Tennessee Commission on Aging and Disability and the
Department of Human Services to consider distributing public education and information to alert
the public to the dangers posed to elderly and vulnerable adults by financial exploitation.
Rule 0180-09-01-.01 provided that state chartered credit unions making certain borrowings disclose
that the borrowed obligation is not a deposit and is not insured by the National Credit Union
Administration or the State Credit Union Share Insurance Corporation (a now defunct private
insurer of certain credit union deposits) (emphasis added). Because the State Credit Union Share
Insurance Corporation is no longer in existence, the amendment to Rule 0180-09-01-.01 removed
the reference to this defunct entity.
Rule 0180-09-01-.02 provided that a state-chartered credit union may not, without the prior approval
of the Commissioner, purchase fixed assets if its investments in fixed assets will exceed five percent
(5%) of its total assets. A federal rule (at 12 C.F.R. § 701.36) previously contained a similar restriction
applicable to federal credit unions, but that rule was amended to remove the restriction. Under
Tennessee law at T.C.A. § 45-4-501(9), state-chartered credit unions are generally allowed to engage
in any activity that they could engage in if they were a federally chartered credit union, subject to the
Commissioner’s regulation for safety and soundness. Accordingly, the department no longer applies
the restrictions of Rule 0180-09-01-.02 to state-chartered credit unions and, therefore, the rule was
repealed.

17 | P a g e
Public Chapter 233 of the Acts of 2013, effective April 19, 2013, amended the Tennessee Banking Act,
specifically T.C.A. § 45-2-607(b)(2), by setting forth the procedures for state banks to dispose of real
property acquired in satisfaction of a loan. Rule 0180-14-.01 defines “other real estate owned” as
real property acquired by a bank in satisfaction of a loan and Rule 0180-15-4-.02 sets forth the
procedures for disposition of other real estate. Public Chapter 233 incorporated into T.C.A. § 45-2-
607(b)(2) certain language from Rule 0180-14-.02 pertaining to disposition of other real estate along
with substantive amendments. As a result, Public Chapter 233 rendered each provision of Chapter
0180-14, Rule 0180-14-.01 and Rule 0180-14-.02 ineffective and/or unnecessary. Accordingly,
Chapter 0180-14 was repealed.
The Home Equity Conversion Mortgage Act (T.C.A. §§ 47-30-101, et seq.) states that only authorized
lenders shall engage in the business of making reverse mortgages. The Tennessee housing
development agency, and any bank, savings institution, or credit union may be designated as
authorized lenders of reverse mortgage loans by providing notice to the Commissioner. See, T.C.A. §
47-30-103(b). All other persons, pursuant to T.C.A. § 47-30-103(c), shall submit an application for
authorization to make reverse mortgage loans containing the information required in T.C.A. § 47-30-
103(c) and Rule 0180-24-.04 of the Rules of the Department of Financial Institutions. Application
requirements for authorization to make reverse mortgage loans are found in T.C.A. § 47-30-103(c)
and in Chapter 0180-24 at Rule 0180-24-.04. Rule 0180-24-.04(2)(i) states that the application shall,
among other requirements, include “a copy of the most recent federal tax return for each of the
applicant’s executive officers”. This rule amendment deleted the application requirement of
submitting a copy of the most recent federal tax return for each of the applicant’s executive officers.
18 | P a g e
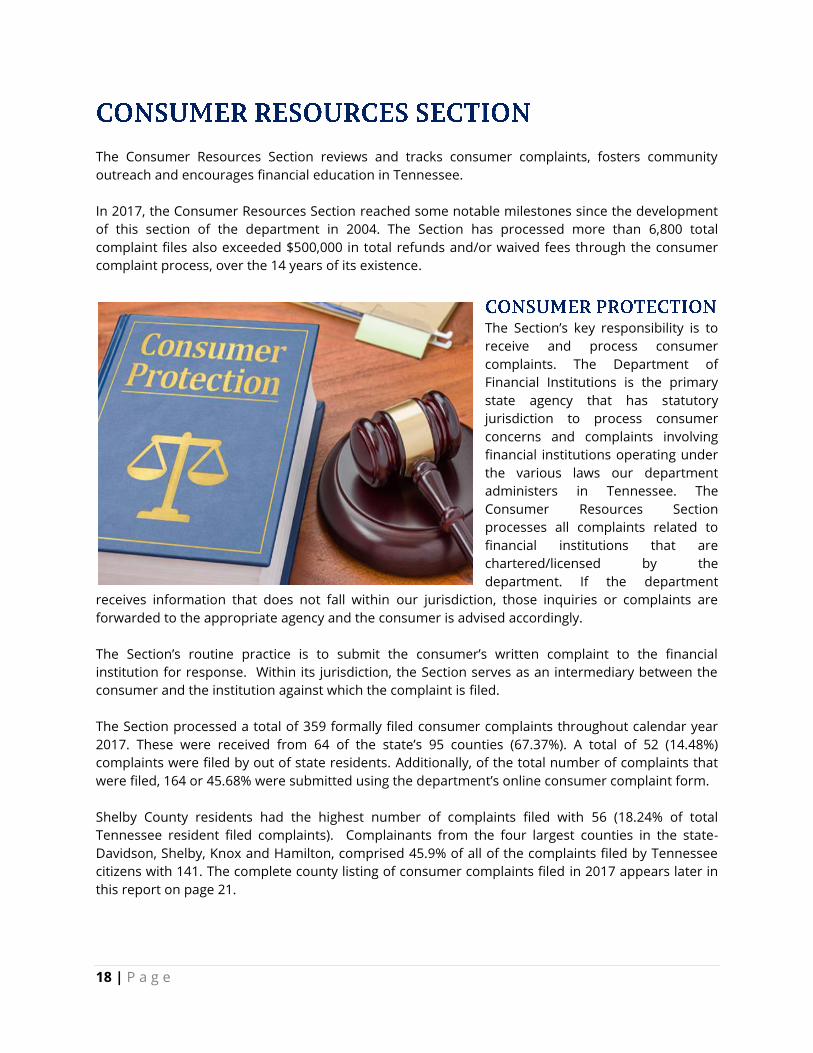
The Consumer Resources Section reviews and tracks consumer complaints, fosters community
outreach and encourages financial education in Tennessee.
In 2017, the Consumer Resources Section reached some notable milestones since the development
of this section of the department in 2004. The Section has processed more than 6,800 total
complaint files also exceeded $500,000 in total refunds and/or waived fees through the consumer
complaint process, over the 14 years of its existence.
The Section’s key responsibility is to
receive and process consumer
complaints. The Department of
Financial Institutions is the primary
state agency that has statutory
jurisdiction to process consumer
concerns and complaints involving
financial institutions operating under
the various laws our department
administers in Tennessee. The
Consumer Resources Section
processes all complaints related to
financial institutions that are
chartered/licensed by the
department. If the department
receives information that does not fall within our jurisdiction, those inquiries or complaints are
forwarded to the appropriate agency and the consumer is advised accordingly.
The Section’s routine practice is to submit the consumer’s written complaint to the financial
institution for response. Within its jurisdiction, the Section serves as an intermediary between the
consumer and the institution against which the complaint is filed.
The Section processed a total of 359 formally filed consumer complaints throughout calendar year
2017. These were received from 64 of the state’s 95 counties (67.37%). A total of 52 (14.48%)
complaints were filed by out of state residents. Additionally, of the total number of complaints that
were filed, 164 or 45.68% were submitted using the department’s online consumer complaint form.
Shelby County residents had the highest number of complaints filed with 56 (18.24% of total
Tennessee resident filed complaints). Complainants from the four largest counties in the state-
Davidson, Shelby, Knox and Hamilton, comprised 45.9% of all of the complaints filed by Tennessee
citizens with 141. The complete county listing of consumer complaints filed in 2017 appears later in
this report on page 21.

19 | P a g e
The following graphic shows the three-year (3 Year) trend for bank complaints the Section has
received, based on the specific charter type of the institution named in the complaint. Complaints
against federally-chartered and out-of-state banks have increased slightly during this time period,
while Tennessee chartered banks have trended lower the past two years.
The next graphic shows the three-year (3 Year) trend for the various credit union complaints the
Section has received. This is also based on whether the credit union is federally-chartered, out-of-
state, or a Tennessee chartered credit union. All three charter types have fluctuated over the past
three years.
TN Chartered
Out-of-State
Federally-Chartered
0
10
20
30
40
2015 2016
2017
Nu
mb
er
of
Co
mp
lain
ts
Three Year Trend of Bank Complaints
TN Chartered
Out-of-State
Federally-Chartered
0
20
40
60
20152016
2017
Nu
mb
er
of
Co
mp
lain
ts
Three Year Trend of Credit Union Complaints

20 | P a g e
The following graphic shows a listing of the complaints received against the various types of financial
institutions regulated by the TDFI.
*Calendar year ending December 31, 2017
*Bank and credit union data includes federally-chartered, out-of-state and Tennessee chartered institutions.
**DEFAULT category contains complaints against financial institutions and/or companies that were not subject to the department’s regulation
and the complaint was referred to the correct agency holding jurisdiction or regulatory authority.
***Tennessee Industrial Loan and Thrift Companies
**** Flexible Credit Loans became effective January 1, 2015

21 | P a g e
While some of the complaints received may have more than one allegation mentioned by the
consumer, the following listing contains the Top Ten most frequently alleged situations:
RANK ALLEGATION #
1 Customer Service Issues 34
2 Payment Processing-Payment History Dispute 30
3 Account Balance Discrepancy 23
4 Application Processing Issues 20
5 Unapproved Account Withdrawal 18
6 High Interest Rate 15
7 Scams 15
8 Foreclosure Issues 15
9 Credit Bureau Reporting Information 15
10 Loan Modification Issues 12
From the complaints reviewed and processed in 2017, consumers received $46,660.49 in the form of
direct credits, refunds to their accounts, physical checks made payable to the complainant or waived
fees on their account. There were also a number of accounts that resulted in some form of a
workout payment arrangement in an effort to assist the complainant in making their payments on
their loans, which may have been in dispute when they submitted their complaint. The complete
refunds by industry type are shown below:
REFUND/WAIVED FEE
AMOUNT
PROFESSION
CODE INDUSTRY
1 Default
100 TILT
$555.51 150 Flexible Credit
$5,031.53 200 Mortgage
$775.00 220 MLO
$52.92 300 Deferred
Presentment
$55.00 350 Title Pledge
400 Premium Finance
$760.00 500 Check Casher
600 Money Transmitter
$2,884.45 700 Credit Union
$27,447.70 800 Bank
$46,660.49 Total Refunds 2017

22 | P a g e
Out of State 52 14.48% Hamblen 3 0.84% Moore 0 0.00%
Anderson 5 1.39% Hamilton 20 5.57% Morgan 2 0.56%
Bedford 4 1.11% Hancock 0 0.00% Obion 1 0.28%
Benton 1 0.28% Hardeman 1 0.28% Overton 2 0.56%
Bledsoe 0 0.00% Hardin 1 0.28% Perry 0 0.00%
Blount 5 1.39% Hawkins 2 0.56% Pickett 0 0.00%
Bradley 4 1.11% Haywood 2 0.56% Polk 0 0.00%
Campbell 0 0.00% Henderson 0 0.00% Putnam 2 0.56%
Cannon 0 0.00% Henry 2 0.56% Rhea 1 0.28%
Carroll 1 0.28% Hickman 0 0.00% Roane 0 0.00%
Carter 4 1.11% Houston 0 0.00% Robertson 3 0.84%
Cheatham 2 0.56% Humphreys 2 0.56% Rutherford 12 3.34%
Chester 1 0.28% Jackson 0 0.00% Scott 0 0.00%
Claiborne 1 0.28% Jefferson 4 1.111% Sequatchie 2 0.56%
Clay 0 0.00% Johnson 1 0.28% Sevier 9 2.51%
Cocke 1 0.28% Knox 24 6.69% Shelby 56 15.60%
Coffee 3 0.84% Lake 0 0.00% Smith 0 0.00%
Crockett 2 0.56% Lauderdale 0 0.00% Stewart 0 0.00%
Cumberland 1 0.28% Lawrence 1 0.28% Sullivan 3 0.84%
Davidson 41 11.42%
%%
Lewis 0 0.00% Sumner 7 1.95%
Decatur 0 0.00% Lincoln 1 0.28% Tipton 4 1.11%
Dekalb 1 0.28% Loudon 1 0.28% Trousdale 0 0.00%
Dickson 2 0.56% McMinn 1 0.28% Unicoi 0 0.00%
Dyer 4 1.11% McNairy 0 0.00% Union 1 0.28%
Fayette 3 0.84% Macon 0 0.00% Van Buren 0 0.00%
Fentress 0 0.00% Madison 6 1.67
%
Warren 4 1.11%
Franklin 1 0.28% Marion 0 0.00% Washington 1 0.28%
Gibson 0 0.00% Marshall 2 0.56% Wayne 0 0.00%
Giles 1 0.28% Maury 4 1.11% Weakley 2 0.56%
Grainger 1 0.28% Meigs 0 0.00% White 1 0.28%
Greene 3 0.84% Monroe 1 0.28% Williamson 10 2.79%
Grundy 1 0.28% Montgomery 5 1.39% Wilson 7 1.95%
Total 359 100.0%
23 | P a g e
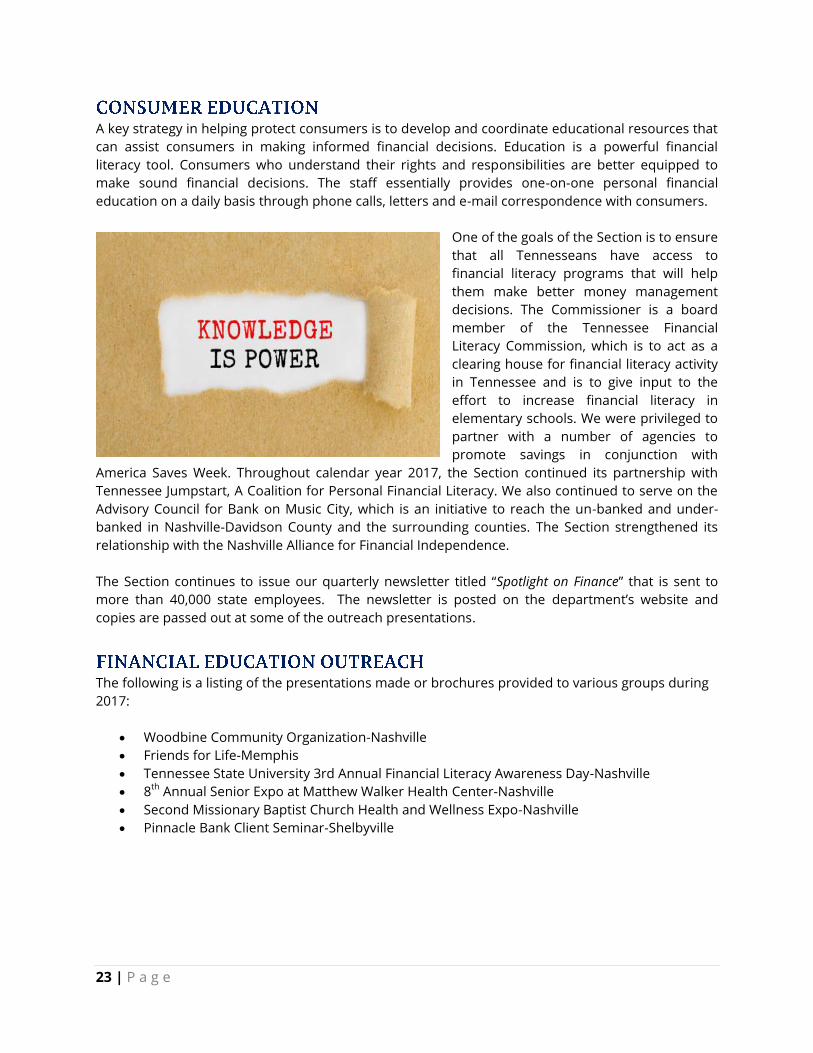
A key strategy in helping protect consumers is to develop and coordinate educational resources that
can assist consumers in making informed financial decisions. Education is a powerful financial
literacy tool. Consumers who understand their rights and responsibilities are better equipped to
make sound financial decisions. The staff essentially provides one-on-one personal financial
education on a daily basis through phone calls, letters and e-mail correspondence with consumers.
One of the goals of the Section is to ensure
that all Tennesseans have access to
financial literacy programs that will help
them make better money management
decisions. The Commissioner is a board
member of the Tennessee Financial
Literacy Commission, which is to act as a
clearing house for financial literacy activity
in Tennessee and is to give input to the
effort to increase financial literacy in
elementary schools. We were privileged to
partner with a number of agencies to
promote savings in conjunction with
America Saves Week. Throughout calendar year 2017, the Section continued its partnership with
Tennessee Jumpstart, A Coalition for Personal Financial Literacy. We also continued to serve on the
Advisory Council for Bank on Music City, which is an initiative to reach the un-banked and under-
banked in Nashville-Davidson County and the surrounding counties. The Section strengthened its
relationship with the Nashville Alliance for Financial Independence.
The Section continues to issue our quarterly newsletter titled “Spotlight on Finance” that is sent to
more than 40,000 state employees. The newsletter is posted on the department’s website and
copies are passed out at some of the outreach presentations.
The following is a listing of the presentations made or brochures provided to various groups during
2017:
Woodbine Community Organization-Nashville
Friends for Life-Memphis
Tennessee State University 3rd Annual Financial Literacy Awareness Day-Nashville
8th
Annual Senior Expo at Matthew Walker Health Center-Nashville
Second Missionary Baptist Church Health and Wellness Expo-Nashville
Pinnacle Bank Client Seminar-Shelbyville

24 | P a g e
The Bank Division has legal responsibility for ensuring that the Tennessee state-chartered banking
system runs on a safe and sound basis. The division’s risk-focused approach seeks to achieve the
department’s mission of balancing safety and soundness with affording institutions the opportunity
to contribute to economic development. In its supervisory role, the Bank Division periodically
examines the financial soundness of all state-chartered banks, savings banks and independent non-
depository trust companies.
The department met the statutory obligation of examining all institutions within a 12-month or an
18-month basis. This was accomplished through coordination with federal banking agencies.
Bank examiners perform evaluations of each institution’s assets, liabilities, income and expenses;
monitor compliance with governing laws and regulations; and rate the effectiveness of the
institution’s management. The adequacy of capital is assessed to ensure the protection of
depositors. In addition, examiners review the Information Technology (IT) functions of state-
chartered institutions for compliance with generally accepted IT practices and adherence to
departmental regulations.
Bank Division staff also examines Business and Industrial Development Companies (BIDCOs) for
compliance with governing statutes and evaluates applications for new institutions, branches,
expanded financial activities and corporate reorganizations.
The Bank Division is accredited by the Conference of State Bank Supervisors.

25 | P a g e
Tod Trulove, Assistant Commissioner, CEM
Todd Rice, Chief Administrator – Examinations, CEM
Debra Grissom, Chief Administrator – Applications
Wade McCullough, Chief Administrator – Trust, CEIC
Clyde McClaran, Division Training Director
James Dewhirst, Consumer Compliance Liaison
William Cook, Applications Analyst
Justin McClinton, Safety & Soundness Administrator
Philip Ruffin, Chief Administrator – Large Banks
Ekaette Udoumana, Safety & Soundness Administrator
Grant Casselberry, Program Administrator – Large
Banks
Memory Little, Executive Administrative Assistant
Gina Tarolli, Executive Administrative Assistant
WEST TENNESSEE DIVISION
Danny Nolen, Bank Division Manager, CEM
Timothy Runions, Bank Regional Supervisor, CEIC
Phillip Stafford, Bank Regional Supervisor, CEIC
Roxanne Taylor, FI Special Examiner Trust, CEIC
Vicki Ivey, Bank Off-Site Monitoring Coordinator, CEIC
Toniece Johnson, Bank Examiner 4, COE
Kenneth Oliver, Bank Examiner 4, CPA
Stephen Koffman, Bank Examiner 3
Teresa Curtis, Bank Examiner 3
Holly Ragan, Bank Examiner 3
Jeffrey Rial, Bank Examiner 3
Courtney Hopper, Bank Examiner 2
Cheena Keltner, Bank Examiner 2
Blake Mascolo, Bank Examiner 2
Angelyn Williams, Bank Examiner 2
Brittany Williams, Bank Examiner 2
Drew Jordan, Bank Examiner 1
MIDDLE TENNESSEE DIVISION
Mike Sisk, Bank Division Manager, CEIC
Storm Miller, Bank Regional Supervisor, CEM
Edward Black, Bank Regional Supervisor
Sherri Cassetty, Bank Off-Site Monitoring Coordinator,
CEIC, CFE
Gerald Proby, IT Bank Examiner
Mark Herren, Bank Examiner 3
John Tubb, Bank Examiner 4
Alan Kirkwood, Bank Examiner 3
Jordan Brown, Bank Examiner 2
Matthew Hogan, Bank Examiner 2
Michael Glaser, Bank Examiner 2, CFE
Darnell Tate, Bank Examiner 2
James Alley, Bank Examiner 1
Cody Durham, Bank Examiner 1
Anne Mauldin, Bank Examiner 1
Maggie Ragan, Bank Examiner 1
Zach Tarwater Bank Examiner 1
Kyle Wright, Bank Examiner 1
EAST TENNESSEE DIVISION
Jessica Huff, Bank Division Manager
Chad Holbert, FI Special Examiner Trust
Jonathan Piper, Bank Off-Site Monitoring Coordinator,
CEIC
Josh Robertson, IT Bank Examiner
Anthony Valentino, Bank Examiner 4
James Cody Jordan, Bank Examiner 4
Jamice Lane-Washburn, Bank Examiner 4
Joy Seaver, Bank Examiner 4
Michael Blair, Bank Examiner 2
Ashley McClellan, Bank Examiner 2
Madison McMahan, Bank Examiner 2
Penny Peterson, Bank Examiner 2
Corey Wright, Bank Examiner 2
Samuel England, Bank Examiner 2
Personnel Designation: ACISE, Associate Certified Information Systems Examiner; CEIC, Certified Examiner-in-Charge; CEM,
Certified Examinations Manager; CFE, Certified Fraud Examiner; COE, Certified Operations Examiner; CPA, Certified Public
Accountant

26 | P a g e
East Tennessee Bank Examiners
Middle Tennessee Bank Examiners
West Tennessee Bank Examiners

27 | P a g e
Nashville Office
NEW BANKS OPEN
There were no new bank openings in fiscal year 2016-17.
BANK MERGERS
Avenue Bank, Nashville, TN, merged with and into Pinnacle Bank, Nashville, TN, under the
title of Pinnacle Bank (July 2016)
Franklin County United Bank, Decherd, TN, merged with and into Citizens Tri-County Bank,
Dunlap, TN, under the title of Citizens Tri-County Bank (August 2016)
Southern Heritage Bank, Cleveland, TN, merged with and into First Citizens National Bank,
Dyersburg, TN under the title of First Citizens National Bank (September 2016)
American Trust Bank of East Tennessee, Knoxville, TN, merged with and into Citizens Bank,
Elizabethton, TN, under the title of Citizens Bank (December 2016)
American Patriot Bank, Greeneville, TN, merged with and into Apex Bank, Camden, TN,
under the title of Apex Bank (December 2016)
TriSummit Bank, Kingsport, TN, merged with and into HomeTrust Bank, Asheville, NC, under
the title of HomeTrust Bank (January 2017)
Reelfoot Bank, Union City, TN, merged with and into Security Bank and Trust Company, Paris,
TN, under the title of Security Bank and Trust Company (March 2017)
Bank of North Carolina, Thomasville, NC, merged with and into Pinnacle Bank, Nashville, TN,
under the title of Pinnacle Bank (June 2017)
BANK CONVERSIONS
There have been no bank conversions during fiscal year 2016-2017.
BANK CLOSURES
There have been no bank closures during fiscal year 2016-2017.
28 | P a g e
BIDCO TRANSACTIONS
There were no BIDCO application transactions in fiscal year 2016-17.
NEW TRUST COMPANIES OPEN
There have been no new trust companies opened in fiscal year 2016-2017.
BANK REGULATED INSTITUTIONS:
138 Banks
10 Independent non-depository public trust companies
1 BIDCO
BANK DATA CONSOLIDATED TOTAL ASSETS:
$74.4 billion, representing a $13.4 billion or 21.91 percent increase since June 30, 2016
CONSOLIDATED CAPITAL:
$9.6 billion, representing 12.91 percent of total assets
RETURN ON AVERAGE ASSETS (ROAA):
Median ROAA of 0.92 percent with a median Net Interest Margin of 4.06 percent (includes all banks)
ALLOWANCE FOR LOAN AND LEASE LOSSES (ALLL):
Median ALLL to total loans and leases ratio of 1.21 percent
PAST DUE RATIO:
Median past due ratio of 1.52 percent
TRUST COMPANY DATA TOTAL CONSOLIDATED CORPORATE ASSETS:
$96.2 million, representing a reduction of approximately 5 percent compared to the same period in
2016
AGGREGATED NET INCOME FOR TRUST COMPANIES:
$3.8 million, representing a 9.5 percent increase compared to the same period in 2016
TRUST ASSETS UNDER MANAGEMENT AND/OR CUSTODY:
Reflects an increase of 15 percent from $23 billion to $26.4 billion, inclusive of assets invested in
common/collective trust funds.
Tennessee Code Annotated, Section 45-8-225 (Report of Accomplishments) requires a report to be
published annually that summarizes the accomplishments of BIDCOs operating in Tennessee. The
one BIDCO licensed for the calendar year 2017 provided no financing to small businesses, minority
owned businesses, or businesses owned by female proprietors.

29 | P a g e
ASSETS June 30, 2017 June 30, 2016 $ CHANGE % CHANGE
Cash and Due From Banks 3,422 3,335 87 2.61%
Securities 12,271 10,847 1.424 13.13%
Federal Funds Sold and Securities 308 454 -146 -32.16%
Agreement to Resell
Loans and Leases Held for Sale 1,059 945 114 12.06%
Loans and Leases, Net of Unearned
Income
51,598 41,799 9,799 23.44%
Allowance for Loan and Lease Losses -492 -499 7 -1.40%
Assets Held in Trading Accounts 9 13 -4 -30.77%
Premises and Fixed Assets 1,316 1,120 196 17.50%
Other Real Estate Owned 219 276 -57 -20.65%
Investments in Unconsolidated
Subsidiaries
183 155 28 18.06%
Intangible Assets 2,180 752 1,428 189.89%
Other Assets 2,346 1,847 499 27.02%
TOTAL ASSETS 74,419 61,044 13,375 21.91%
LIABILITIES
Non-Interest Bearing Deposits 12,265 9.424 2,841 30.15%
Interest Bearing Deposits 48,753 41,121 7,632 18.56%
TOTAL DEPOSITS 61,018 50,545 10,473 20.72%
Federal Funds Purchased and
Securities
516 427 89 20.84%
Repurchase Agreement
Trading Liabilities 1 5 -4 -80.00%
Other Borrowed Money 2,656 2,561 95 3.71%
Other Liabilities 619 654 -35 -5.35%
TOTAL LIABILITIES 64,810 54,193 10,617 19.59%
Minority Interests in
Unconsolidated Subsidiaries
1 0 1

30 | P a g e
EQUITY CAPITAL June 30, 2017 June 30, 2016 $ Change % Change
Preferred Stock 23 24 -1 4.17%
Common Stock 359 366 -7 -1.91%
Surplus 5,806 3,323 2,483 74.72%
Undivided Profits 3,428 3,024 404 13.36%
Accumulated Other Comprehensive
Income
-3 119 -122 -102.52%
Other Equity Capital Components -5 -5 0 0.00%
TOTAL EQUITY CAPITAL 9,609 6,851 2,758 40.26%
TOTAL LIABILITIES AND EQUITY
CAPITAL
74,419 61,044 13,375 21.91%
JUNE 30, 2017 JUNE 30, 2016
Interest Income 1303 1181
Interest Expenses 153 128
NET INTEREST INCOME 1150 1053
Non-Interest Income 339 328
Non-Interest Expense 923 890
Provision for Loan and Lease Losses 45 32
Securities Gains/Losses 1 9
Pre-Tax Net Income 522 468
Applicable Income Taxes 144 117
NET OPERATING INCOME 378 351
Extraordinary Gains/Losses 0 0
NET INCOME 378 351
TOTAL CASH DIVIDENDS 128 140

31 | P a g e
(A) (B) (C) (D) (E) (F) (G) (H) (I) (J)
City Institution Cash Invest Total
Loans
Loan
Loss
Reserve
Other
Assets Total Assets Deposits
Other
Liabilities MIUS CAPITAL
Net
Income
ADAMSVILLE Farmers &
Merchants Bank 8,228 9,602 21,748 437 1,090 40,231 35,551 40 0 4,640 184
ASHLAND CITY Community Bank &
Trust 7,647 86,761 133,274 2,276 12,168 237,574 195,412 19,907 0 22,255 912
ATWOOD Citizens Bank & Trust
Company 2,266 13,416 9,558 86 532 25,686 23,271 81 0 2,334 76
BARTLETT Bank of Bartlett 19,318 102,817 198,960 2,216 40,564 359,443 321,982 10,203 0 27,258 862
BELLS Bank of Crockett 5,998 94,929 51,125 657 9,640 161,035 141,373 1,705 0 17,957 1,172
BOLIVAR Merchants &
Planters Bank 10,131 20,857 49,991 877 6,964 87,066 72,319 3,550 0 11,197 312
BRENTWOOD Reliant Bank 30,051 181,289 731,950 9,385 68,504 1,002,409 840,366 51,288 0 110,755 4,656
BRIGHTON Brighton Bank 2,561 4,605 48,101 435 2,578 57,410 54,096 151 0 3,163 272
BROWNSVILLE INSOUTH Bank 6,716 38,814 245,836 1,599 20,144 309,911 269,869 10,125 0 29,917 1,357
BYRDSTOWN
People's Bank and
Trust Company of
Pickett County
11,484 16,319 84,469 1,475 4,805 115,602 100,379 631 0 14,592 617
CAMDEN Apex Bank 37,325 8,102 444,720 5,506 50,213 534,854 428,559 24,072 0 82,223 11,675
CARTHAGE Citizens Bank 11,211 365,137 196,238 1,605 9,573 580,554 479,800 1,901 0 98,853 6,661
CHATTANOOGA First Volunteer Bank 140,058 49,866 724,654 9,234 57,379 962,723 852,795 9,304 0 100,624 6,603
CLARKSVILLE F&M Bank 21,635 48,553 827,100 2,068 101,765 996,985 808,260 75,225 0 113,500 3,813
CLARKSVILLE First Advantage Bank 10,601 47,267 459,957 6,767 33,308 544,366 417,816 62,589 0 63,961 2,159
CLARKSVILLE Legends Bank 17,514 86,478 325,845 3,294 24,527 451,070 397,496 10,929 0 42,645 1,720
CLARKSVILLE Cumberland Bank
and Trust 16,365 15,540 135,414 1,737 9,504 175,086 153,352 877 0 20,857 855
CLEVELAND Bank of Cleveland 17,964 5,242 222,246 2,841 14,443 257,054 215,489 1,565 0 40,000 1,937
CLIFTON Peoples Bank 7,673 18,512 130,623 1,416 16,802 172,194 150,805 5,686 0 15,703 776
COLLIERVILLE BankTennessee 15,994 18,247 227,173 3,601 26,834 284,647 253,204 1,540 0 29,903 1,989
COLLIERVILLE Landmark
Community Bank 16,513 128,111 738,489 7,598 34,370 909,885 737,020 93,572 0 79,293 3,874
COLUMBIA First Farmers and
Merchants Bank 40,017 398,007 858,781 9,259 77,358 1,364,904 1,185,608 62,096 95 117,105 5,363
COLUMBIA Community First
Bank & Trust 62,711 72,726 308,279 3,708 36,049 476,057 426,795 2,616 0 46,646 1,598
COLUMBIA Heritage Bank &
Trust 5,307 17,130 90,391 1,710 8,701 119,819 104,084 3,930 0 11,805 565
COOKEVILLE Bank of Putnam
County 70,529 262,213 400,036 2,785 32,275 762,268 695,602 9,484 0 57,182 3,581
COOKEVILLE Putnam 1st
Mercantile Bank 4,739 21,316 93,339 1,418 3,274 121,250 107,087 494 0 13,669 865
CORDOVA First Alliance Bank 11,251 8,216 103,671 1,097 8,914 130,955 112,974 4,473 0 13,508 172
DECATURVILLE Decatur County Bank 6,709 30,152 49,560 601 6,780 92,600 78,714 6,002 0 7,884 420
DICKSON Bank of Dickson 8,950 82,620 133,394 1,317 6,297 229,944 193,609 6,808 0 29,527 771
DICKSON First Federal Bank 70,658 201,656 220,905 4,284 30,808 519,743 444,532 17,023 0 58,188 4,201
DICKSON TriStar Bank 6,255 56,025 170,573 1,800 19,641 250,694 210,451 17,871 0 22,372 910
DUNLAP Mountain Valley
Bank 7,199 19,188 65,084 614 6,173 97,030 87,968 182 0 8,880 151
DUNLAP Citizens Tri-County
Bank 41,847 272,131 465,588 6,425 43,247 816,388 725,914 6,584 0 83,890 6,278
DYER The Farmers &
Merchants Bank 3,313 59,398 30,478 134 9,257 102,312 88,291 4,747 0 9,274 (607)
ELIZABETHTON Citizens Bank 26,062 228,352 567,694 4,661 34,032 851,479 694,816 54,356 478 101,829 7,887
ELIZABETHTON Security Federal
Bank 3,083 12,674 43,151 432 4,190 62,666 46,185 6,506 0 9,975 276
ERIN Traditions First Bank 11,791 29,924 73,985 648 5,688 120,740 106,068 1,265 0 13,407 434
FARRAGUT SouthEast Bank 54,398 - 1,213,914 4,643 63,630 1,327,299 1,208,780 9,846 0 108,673 6,083
FAYETTEVILLE Bank of Lincoln
County 17,200 13,555 102,419 1,320 8,316 140,170 120,219 626 0 19,325 871
FRANKEWING Bank of Frankewing 35,520 9,748 175,912 3,304 11,014 228,890 198,436 3,142 0 27,312 876
FRANKLIN Franklin Synergy
Bank 96,786 1,243,405 2,023,679 18,689 96,034 3,441,215 2,759,761 333,891 104 347,459 18,355
GALLATIN Sumner Bank &
Trust 14,364 32,014 107,426 1,098 8,743 161,449 145,313 1,788 0 14,348 501
GATES Gates Banking and
Trust Company 722 27,384 13,762 306 2,589 44,151 38,616 310 0 5,225 202
GERMANTOWN First Capital Bank 7,847 26,616 244,569 2,161 10,720 287,591 232,966 23,999 0 30,626 1,217
GLEASON Bank of Gleason 6,896 72,977 36,549 829 2,754 118,347 92,257 723 0 25,367 707
GREENEVILLE Andrew Johnson 19,147 34,455 286,089 5,036 14,201 348,856 312,547 1,008 0 35,301 1,751

32 | P a g e
Bank
(A) (B) (C) (D) (E)
(F) (G) (H) (I) (J)
City Institution Cash Invest Total
Loans
Loan
Loss
Reserve
Other
Assets Total Assets Deposits
Other
Liabilities MIUS CAPITAL
Net
Income
HALLS The Lauderdale
County Bank 5,934 18,800 23,568 288 2,260 50,274 44,373 704 0 5,197 146
HARROGATE Commercial Bank 51,396 107,880 704,691 7,720 75,822 932,069 760,331 72,973 0 98,765 5,416
HARTSVILLE Citizens Bank 6,668 29,861 165,607 2,466 12,372 212,042 181,669 8,656 0 21,717 1,120
HENDERSON Chester County Bank 18,987 24,276 26,104 248 1,370 70,489 62,551 295 0 7,643 250
HUNTINGDON Carroll Bank and
Trust 9,394 27,643 209,080 1,683 25,894 270,328 242,737 906 0 26,685 791
JACKSON The Bank of Jackson 3,107 103,705 58,629 1,097 7,077 171,421 144,458 9,149 0 17,814 720
JACKSON First South Bank 77,139 91,704 253,557 - 61,464 483,864 386,060 22,888 0 74,916 1,078
JAMESTOWN Union Bank 5,594 69,878 114,907 1,366 20,890 209,903 185,037 1,455 0 23,411 669
JAMESTOWN Progressive Savings
Bank 32,137 27,503 211,238 1,977 34,646 303,547 275,033 1,873 0 26,641 995
JASPER Tower Community
Bank 10,064 22,163 104,562 672 18,513 154,630 135,595 5,847 172 13,016 260
JEFFERSON CITY First Peoples Bank of
Tennessee 14,986 27,167 94,890 917 9,458 145,584 126,338 6,613 0 12,633 219
JELLICO UBank 5,940 17,560 40,227 578 4,312 67,461 57,619 773 0 9,069 325
KINGSPORT Bank of Tennessee 21,372 168,241 854,143 7,674 86,932 1,123,014 899,914 123,880 0 99,220 6,306
KNOXVILLE Mountain Commerce
Bank 12,582 61,255 575,456 5,706 35,235 678,822 600,890 9,877 0 68,055 3,069
KNOXVILLE Clayton Bank & Trust 24,208 46,608 791,042 17,505 35,664 880,017 655,594 60,329 0 164,094 17,153
LA FOLLETTE Peoples Bank of the
South 19,412 244 125,240 1,596 5,555 148,855 126,776 1,538 0 20,541 1,486
LAFAYETTE Citizens Bank of
Lafayette 36,490 308,528 523,822 7,614 44,561 905,787 696,035 112,607 0 97,145 4,810
LAFAYETTE Macon Bank and
Trust Company 15,578 202,860 147,660 2,597 20,931 384,432 324,726 10,731 0 48,975 1,549
LAWRENCEBURG Lawrenceburg
Federal Bank 1,940 - 56,056 201 3,795 61,590 45,744 1,737 0 14,109 275
LEBANON Wilson Bank and
Trust 106,352 347,033 1,742,247 23,323 120,319 2,292,628 2,022,447 11,431 0 258,750 13,784
LEBANON CedarStone Bank 4,607 46,119 129,042 1,312 11,976 190,432 148,459 23,740 0 18,233 621
LEBANON First Freedom Bank 36,691 - 346,551 4,235 41,686 420,693 347,721 29,469 0 43,503 1,924
LEWISBURG First Commerce
Bank 22,336 69,792 251,710 3,070 15,928 356,696 322,843 2,903 0 30,950 2,093
LEXINGTON Community Bank 2,448 19,076 117,038 1,307 8,210 145,465 120,724 11,329 0 13,412 748
LIVINGSTON Union Bank & Trust
Company 5,623 17,351 58,242 1,002 3,233 83,447 72,357 322 0 10,768 923
LIVINGSTON
American Bank &
Trust of the
Cumberlands
17,084 9,570 173,474 1,736 11,815 210,207 190,098 1,414 0 18,695 1,326
LOBELVILLE Bank of Perry County 4,389 9,958 134,747 1,652 9,185 156,627 132,906 8,396 0 15,325 1,369
MADISONVILLE Volunteer Federal
Savings Bank 33,345 6,096 126,430 617 13,129 178,383 140,147 12,361 0 25,875 479
MADISONVILLE Peoples Bank of East
Tennessee 9,939 35,444 141,882 1,275 17,138 203,128 177,230 1,556 0 24,342 795
MANCHESTER Peoples Bank &
Trust Company 11,138 26,332 56,065 872 6,191 98,854 86,969 1,431 0 10,454 233
MANCHESTER Coffee County Bank 15,563 11,215 145,155 2,168 4,747 174,512 150,347 4,196 0 19,969 2,159
MARYVILLE CBBC Bank 27,092 135,427 176,005 3,084 10,031 345,471 292,358 2,678 0 50,435 1,074
MARYVILLE Foothills Bank &
Trust 6,965 49,849 144,112 2,345 7,731 206,312 183,749 2,123 0 20,440 795
MC KENZIE McKenzie Banking
Company 35,833 25,284 63,186 1,731 8,903 131,475 112,782 856 0 17,837 712
MCMINNVILLE
Security Federal
Savings Bank of
McMinnville
16,897 37,235 133,427 1,482 8,064 194,141 170,715 3,648 0 19,778 780
MCMINNVILLE Homeland
Community Bank 13,085 42,676 79,697 1,672 9,371 143,157 129,007 1,285 0 12,865 354
MEMPHIS Bank3 17,670 10,027 66,715 823 4,046 97,635 72,992 297 0 24,346 (1,785)
MEMPHIS Tri-State Bank of
Memphis 7,024 17,796 64,189 1,116 5,816 93,709 79,640 794 0 13,275 (180)
MEMPHIS Financial Federal
Bank 17,928 2,500 490,507 6,949 9,418 513,404 353,185 89,338 0 70,881 4,753
MEMPHIS Independent Bank 53,097 12,070 816,593 9,323 145,543 1,017,980 837,935 63,387 0 116,658 4,904
MEMPHIS Paragon Bank 6,400 45,704 297,304 4,530 12,647 357,525 288,780 31,307 0 37,438 1,280
MEMPHIS Triumph Bank 14,748 109,293 507,612 5,704 14,812 640,761 529,120 50,743 0 60,898 2,815
MILAN The Bank of Milan 4,967 24,734 35,557 216 3,366 68,408 59,036 2,885 0 6,487 279
MILLINGTON Patriot Bank 3,019 166,748 128,341 2,079 19,277 315,306 268,678 16,806 0 29,822 1,566
MOUNT JULIET Souther Bank of
Tennessee 34,170 25,102 184,402 1,542 11,305 253,437 221,767 3,910 0 27,760 1,238
MOUNTAIN CITY Farmers State Bank 4,001 40,618 86,854 1,084 12,044 142,433 117,732 3,063 0 21,638 487
MOUNTAIN CITY Johnson County 10,838 41,384 63,882 621 6,676 122,159 100,908 3,354 0 17,897 595

33 | P a g e
Bank
(A) (B) (C) (D) (E)
(F) (G) (H) (I) (J)
City Institution Cash Invest Total
Loans
Loan
Loss
Reserve
Other
Assets Total Assets Deposits
Other
Liabilities MIUS CAPITAL
Net
Income
NASHVILLE
Citizens Savings
Bank and Trust
Company
6,017 5,414 92,389 1,953 4,861 106,728 92,926 4,286 0 9,516 63
NASHVILLE InsBank 20,561 20,039 349,318 4,169 30,066 415,815 327,959 43,908 0 43,948 1,384
NASHVILLE Pinnacle Bank 537,811 2,446,664 14,860,408 61,944 2,982,313 20,765,252 15,800,346 1,169,625 123 3,795,158 84,711
NASHVILLE Truxton Trust
Company 18,366 89,110 294,558 3,047 16,944 415,931 347,489 23,417 0 45,025 2,760
NASHVILLE Civic Bank & Trust 5,798 38,174 115,205 1,526 7,329 164,980 118,326 22,916 0 23,738 2,000
NASHVILLE CapStar Bank 48,093 202,542 1,070,190 12,454 63,242 1,371,613 1,133,845 112,572 0 125,196 (2,776)
NEW TAZEWELL Citizens Bank 8,260 11,020 171,904 1,931 7,525 196,778 179,255 1,673 0 15,850 836
NEWBERN Security Bank 7,566 109,565 57,202 1,131 15,318 188,520 154,566 12,399 0 21,555 917
NOLENSVILLE Peoples State Bank 17,415 33,535 99,502 1,444 10,742 159,750 139,489 802 0 19,459 524
OAK RIDGE TNBANK 7,290 36,923 146,021 1,808 13,274 201,700 162,589 20,450 0 18,661 372
OOLTEWAH Millennium Bank 26,973 15,272 127,331 1,518 7,648 175,706 157,518 692 0 17,496 1,061
PARIS Commercial Bank &
Trust Co. 27,600 171,914 492,695 6,720 40,574 726,063 640,263 5,317 0 80,483 6,257
PARIS Security Bank and
Trust Company 13,143 67,994 232,163 598 26,189 338,891 297,509 6,090 0 35,292 4,822
PARSONS Farmers Bank 14,261 3,866 18,313 261 1,294 37,473 32,600 185 0 4,688 143
PIGEON FORGE Tennessee State
Bank 51,375 113,041 447,245 4,980 48,898 655,579 582,112 6,491 0 66,976 2,655
PIGEON FORGE SmartBank 82,893 132,762 865,115 5,498 66,073 1,141,345 994,629 26,727 0 119,989 4,160
PIKEVILLE First Farmers &
Commercial Bank 11,631 40,043 59,032 756 7,059 117,009 103,719 359 0 12,931 370
PIPERTON The Bank of Fayette
County 10,061 62,577 438,383 4,861 25,925 532,085 433,553 54,660 0 43,872 2,959
PORTLAND The Farmers Bank 14,869 181,243 382,624 4,860 35,704 609,580 505,902 33,914 0 69,764 3,994
PORTLAND Volunteer State Bank 19,441 28,718 500,143 4,862 51,689 595,129 456,693 79,486 0 58,950 4,293
RIPLEY Bank of Ripley 14,769 118,408 75,140 943 12,516 219,890 185,327 2,405 0 32,158 646
ROGERSVILLE Civis Bank 13,268 9,518 68,784 886 12,853 103,537 97,332 2,060 0 4,145 101
ROGERSVILLE
First Community
Bank of East
Tennessee
24,492 23,459 114,824 1,868 16,993 177,900 148,364 8,231 0 21,305 471
RUTLEDGE
Citizens Bank and
Trust Company of
Grainger County
6,404 131,647 61,119 741 10,452 208,881 173,274 679 0 34,928 928
SARDIS The Peoples Bank 1,855 17,976 54,489 606 3,229 76,943 68,562 639 0 7,742 249
SAVANNAH The Hardin County
Bank 8,636 59,613 367,122 4,261 31,948 463,058 403,740 19,894 0 39,424 2,392
SAVANNAH Central Bank 11,334 23,264 54,155 1,390 6,128 93,491 84,132 656 0 8,703 311
SELMER Home Banking
Company 6,948 47,834 34,925 356 6,252 95,603 85,048 1,071 0 9,484 240
SEVIERVILLE Sevier County Bank 36,272 36,516 209,509 2,601 41,359 321,055 300,253 2,355 0 18,447 (339)
SHELBYVILLE First Community
Bank of Tennessee 20,955 71,956 351,968 2,267 68,633 511,245 294,717 158,755 0 57,773 1,962
SHELBYVILLE Peoples Bank of
Middle Tennessee 2,736 27,271 109,939 1,784 7,405 145,567 128,257 1,524 0 15,786 641
SPRING CITY First Bank of
Tennessee 29,637 16,999 244,287 2,947 11,048 299,024 246,814 20,518 0 31,692 2,332
TAZEWELL First Century Bank 11,964 30,898 284,095 3,555 18,301 341,703 305,389 3,934 0 32,380 1,935
TREZEVANT Centennial Bank 24,954 21,800 307,596 5,675 21,436 370,111 312,765 19,988 0 37,358 1,723
TULLAHOMA Southern
Community Bank 13,377 31,909 195,459 2,155 13,549 252,139 219,934 6,141 0 26,064 1,234
TULLAHOMA First Vision Bank of
Tennessee 10,221 31,775 154,315 1,970 11,218 205,559 180,524 1,864 0 23,171 978
TULLAHOMA American City Bank 4,498 14,155 275,442 2,932 16,877 308,040 236,369 11,299 0 60,372 3,847
WARTBURG Citizens First Bank 18,245 24,914 116,263 1,212 10,514 168,724 149,246 4,815 0 14,663 641
WAYNESBORO The Bank of
Waynesboro 14,365 19,044 109,001 1,615 9,767 150,562 128,838 742 0 20,982 1,092
WAYNESBORO Wayne County Bank 17,535 36,266 226,010 4,896 32,590 307,505 258,637 7,045 0 41,823 1,633
WINCHESTER Citizens Community
Bank 25,024 43,318 143,062 3,328 14,040 222,116 193,677 2,808 0 25,631 1,730
TOTAL 3,421,578 12,588,143 52,656,269 492,169 6,244,914 74,418,735 61,017,548 3,792,646 972 9,607,569 377,709
(A) Cash - Includes currency/coin, both interest-bearing and non-interest bearing balances due from depository institutions
(B) Investments – Investments owned: Includes securities, federal funds sold, and securities purchased under agreements to resell
(C) Total Loans – Includes all loans and lease financing receivables, net of unearned income
(D) Loan Loss Reserve – Allowance for Loan and Lease Losses
(E) Other Assets – Includes premises and fixed assets, trading assets, other real estate owned, investments in unconsolidated subsidiaries and associated companies, customer’s liability to bank on acceptances outstanding, intangible assets,
and assets not reportable elsewhere.
(F) Deposits – Includes all interest bearing and non-interest bearing customer deposits held.
(G) Other Liabilities – Includes federal funds purchased, securities sold under agreements to repurchase, demand notes issued to U.S. Treasury, mortgage indebtedness, obligations under capital leases, bank’s liability on acceptances
outstanding, and all other liabilities
(H) Minority Interest in Unconsolidated Subsidiaries
(I) Equity Capital – Includes preferred stock, common stock, surplus, undivided profits, and accumulated other comprehensive income
(J) Net Income – Income earned after all expenses, taxes, and extraordinary items

34 | P a g e
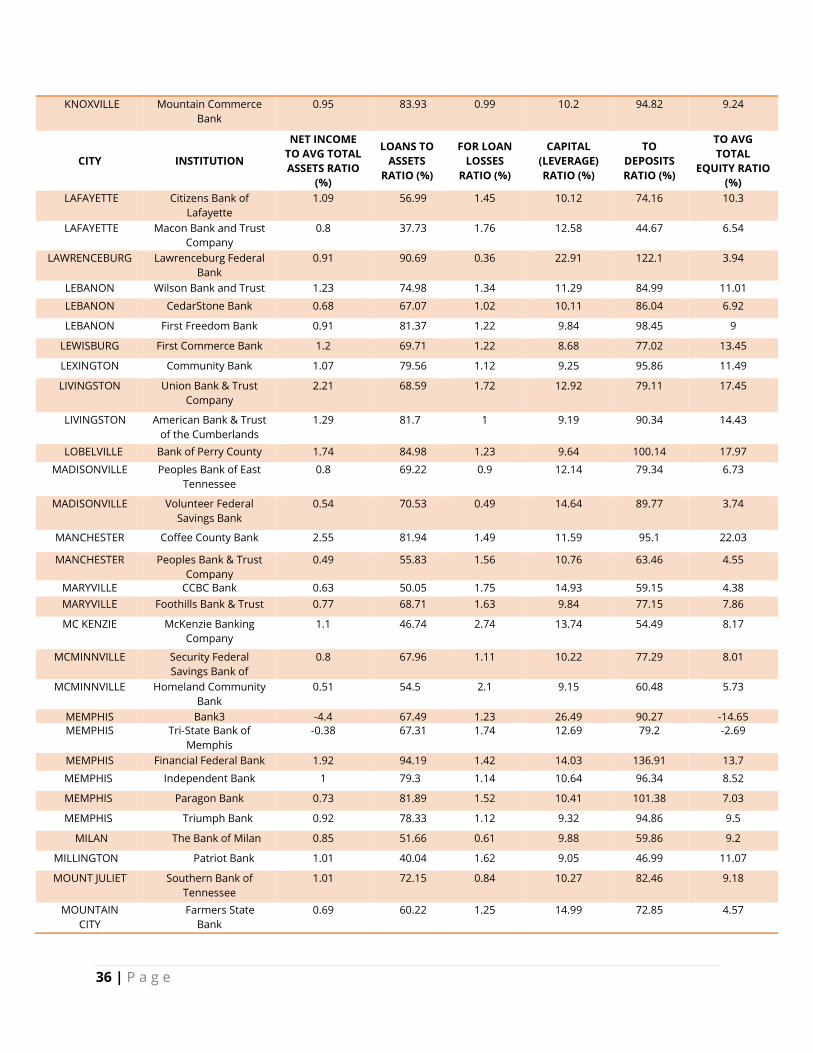
CITY INSTITUTION
NET INCOME
TO AVG TOTAL
ASSETS RATIO
(%)
LOANS TO
ASSETS
RATIO (%)
FOR LOAN
LOSSES
RATIO (%)
CAPITAL
(LEVERAGE)
RATIO (%)
TO
DEPOSITS
RATIO (%)
TO AVG
TOTAL
EQUITY RATIO
(%)
ADAMSVILLE Farmers & Merchants
Bank
0.94 52.97 2.01 11.34 59.94 8.16
ASHLAND CITY Community Bank &
Trust
0.82 55.14 1.71 9.95 67.04 8.53
ATWOOD Citizens Bank & Trust
Company
0.58 36.88 0.9 8.4 40.7 6.57
BARTLETT Bank of Bartlett 0.49 54.74 1.11 6.93 61.1 6.47
BELLS Bank of Crockett 1.51 31.34 1.29 10.77 35.7 13.78
BOLIVAR Merchants & Planters
Bank
0.71 56.41 1.75 12.44 67.91 5.7
BRENTWOOD Reliant Bank 0.98 72.08 1.28 10.29 85.98 8.6
BRIGHTON Brighton Bank 0.99 83.03 0.9 5.55 88.11 18.09
BROWNSVILLE INSOUTH Bank 0.89 78.81 0.65 9.1 90.5 9.18
BYRDSTOWN People's Bank and
Trust Company of
Pickett County
1.06 71.79 1.75 12.47 82.68 8.64
CAMDEN Apex Bank 4.69 82.12 1.24 14.19 102.49 29.82
CARTHAGE Citizens Bank 2.32 33.53 0.82 17.13 40.57 13.67
CHATTANOOGA First Volunteer Bank 1.41 74.31 1.27 10.34 83.89 13.24
CLARKSVILLE F&M Bank 0.78 82.75 0.25 9.07 102.08 6.76
CLARKSVILLE First Advantage Bank 0.81 83.25 1.47 11.88 108.47 6.84
CLARKSVILLE Legends Bank 0.79 71.51 1.01 9.73 81.15 8.11
CLARKSVILLE Cumberland Bank and
Trust
0.97 76.35 1.28 11.81 87.17 8.37
CLEVELAND Bank of Cleveland 1.53 85.35 1.28 15.61 101.82 9.76
CLIFTON Peoples Bank 0.92 75.04 1.08 9.25 85.68 10.18
COLLIERVILLE BankTennessee 1.39 78.54 1.59 9.5 88.3 13.46
COLLIERVILLE Landmark Community
Bank
0.87 80.33 1.03 8.63 99.17 10
COLUMBIA First Farmers and
Merchants Bank
0.79 62.24 1.08 7.99 71.65 9.28
COLUMBIA Community First
Bank & Trust
0.68 63.98 1.2 9.15 71.36 6.99
COLUMBIA Heritage Bank & Trust 0.96 74.01 1.89 9.97 85.2 9.94
COOKEVILLE Bank of Putnam
County
0.95 52.11 0.7 7.74 57.11 12.64
COOKEVILLE Putnam 1st Mercantile
Bank
1.47 75.81 1.52 11.54 85.84 12.87
CORDOVA First Alliance Bank 0.27 78.33 1.06 9.93 90.79 2.56
DECATURVILLE Decatur County Bank 0.92 52.87 1.21 9.11 62.2 11.52

35 | P a g e
DICKSON Bank of Dickson 0.68 57.44 0.99 12.39 68.22 5.32
CITY INSTITUTION
NET INCOME
TO AVG TOTAL
ASSETS RATIO
(%)
LOANS TO
ASSETS
RATIO (%)
FOR LOAN
LOSSES
RATIO (%)
CAPITAL
(LEVERAGE)
RATIO (%)
TO
DEPOSITS
RATIO (%)
TO AVG
TOTAL
EQUITY RATIO
(%)
DICKSON TriStar Bank 0.74 67.32 1.06 8.9 80.2 8.35
DUNLAP Mountain Valley Bank 0.32 66.44 0.94 9.48 73.29 3.44
DUNLAP Citizens Tri-County
Bank
1.55 56.24 1.38 9.25 63.25 15.35
DYER The Farmers &
Merchants Bank
-1.12 29.66 0.44 8.7 34.37 -13.33
ELIZABETHTON Citizens Bank 1.85 66.12 0.82 10.6 81.03 16.18
ELIZABETHTON Security Federal Bank 0.87 68.17 1 15.68 92.5 5.25
ERIN Traditions First Bank 0.72 60.74 0.88 11.1 69.14 6.66
FARRAGUT SouthEast Bank 0.96 91.11 0.38 8.37 100.04 11.53
FAYETTEVILLE Bank of Lincoln County 1.25 72.13 1.29 13.72 84.1 9.24
FRANKEWING Bank of Frankewing 0.77 75.41 1.88 11.91 86.98 6.53
FRANKLIN Franklin Synergy Bank 1.09 58.26 0.92 9.8 72.65 10.94
GALLATIN Sumner Bank & Trust 0.62 65.86 1.02 8.82 73.17 7.21
GATES Gates Banking and
Trust Company
0.94 30.48 2.22 11.19 34.85 8.07
GERMANTOWN First Capital Bank 0.84 84.29 0.88 10.64 104.05 8.87
GLEASON Bank of Gleason 1.21 30.18 2.27 20.59 38.72 5.69
GREENEVILLE Andrew Johnson Bank 1.01 80.56 1.76 10.03 89.92 10.17
GREENEVILLE Heritage Community
Bank
0.76 75.53 1.85 8.91 85.9 8.59
GREENFIELD Greenfield Banking
Company
0.7 79.66 1.09 12.15 95.18 5.87
HALLS Bank of Halls 1.17 45.56 1.72 11.17 52.06 10.29
HALLS The Lauderdale County
Bank
0.59 46.31 1.22 10.24 52.46 5.76
HARROGATE Commercial Bank 1.16 74.78 1.1 10.48 91.67 11.23
HARTSVILLE Citizens Bank 1.06 76.94 1.49 10.23 89.8 10.67
HENDERSON Chester County Bank 0.7 36.68 0.95 10.46 41.34 6.76
HUNTINGDON Carroll Bank and Trust 0.58 76.72 0.8 9.62 85.44 6
JACKSON First South Bank 1.76 52.4 0 9.16 65.68 13.33
JACKSON The Bank of Jackson 0.85 33.56 1.87 9.75 39.83 8.52
JAMESTOWN Union Bank 0.63 54.09 1.19 11.29 61.36 5.82
JAMESTOWN Progressive Savings
Bank
0.66 68.94 0.94 8.55 76.09 7.59
JASPER Tower Community
Bank
0.33 67.19 0.64 7.72 76.62 4.05
JEFFERSON CITY First Peoples Bank of
Tennessee
0.3 64.55 0.97 8.7 74.38 3.53
JELLICO UBank 0.99 58.77 1.44 13.21 68.81 7.3
KINGSPORT Bank of Tennessee 1.17 75.36 0.9 8.89 94.04 13.32
36 | P a g e
KNOXVILLE Mountain Commerce
Bank
0.95 83.93 0.99 10.2 94.82 9.24
CITY INSTITUTION
NET INCOME
TO AVG TOTAL
ASSETS RATIO
(%)
LOANS TO
ASSETS
RATIO (%)
FOR LOAN
LOSSES
RATIO (%)
CAPITAL
(LEVERAGE)
RATIO (%)
TO
DEPOSITS
RATIO (%)
TO AVG
TOTAL
EQUITY RATIO
(%)
LAFAYETTE Citizens Bank of
Lafayette
1.09 56.99 1.45 10.12 74.16 10.3
LAFAYETTE Macon Bank and Trust
Company
0.8 37.73 1.76 12.58 44.67 6.54
LAWRENCEBURG Lawrenceburg Federal
Bank
0.91 90.69 0.36 22.91 122.1 3.94
LEBANON Wilson Bank and Trust 1.23 74.98 1.34 11.29 84.99 11.01
LEBANON CedarStone Bank 0.68 67.07 1.02 10.11 86.04 6.92
LEBANON First Freedom Bank 0.91 81.37 1.22 9.84 98.45 9
LEWISBURG First Commerce Bank 1.2 69.71 1.22 8.68 77.02 13.45
LEXINGTON Community Bank 1.07 79.56 1.12 9.25 95.86 11.49
LIVINGSTON Union Bank & Trust
Company
2.21 68.59 1.72 12.92 79.11 17.45
LIVINGSTON American Bank & Trust
of the Cumberlands
1.29 81.7 1 9.19 90.34 14.43
LOBELVILLE Bank of Perry County 1.74 84.98 1.23 9.64 100.14 17.97
MADISONVILLE Peoples Bank of East
Tennessee
0.8 69.22 0.9 12.14 79.34 6.73
MADISONVILLE Volunteer Federal
Savings Bank
0.54 70.53 0.49 14.64 89.77 3.74
MANCHESTER Coffee County Bank 2.55 81.94 1.49 11.59 95.1 22.03
MANCHESTER Peoples Bank & Trust
Company
0.49 55.83 1.56 10.76 63.46 4.55
MARYVILLE CCBC Bank 0.63 50.05 1.75 14.93 59.15 4.38
MARYVILLE Foothills Bank & Trust 0.77 68.71 1.63 9.84 77.15 7.86
MC KENZIE McKenzie Banking
Company
1.1 46.74 2.74 13.74 54.49 8.17
MCMINNVILLE Security Federal
Savings Bank of
McMinnville
0.8 67.96 1.11 10.22 77.29 8.01
MCMINNVILLE Homeland Community
Bank
0.51 54.5 2.1 9.15 60.48 5.73
MEMPHIS Bank3 -4.4 67.49 1.23 26.49 90.27 -14.65
MEMPHIS Tri-State Bank of
Memphis
-0.38 67.31 1.74 12.69 79.2 -2.69
MEMPHIS Financial Federal Bank 1.92 94.19 1.42 14.03 136.91 13.7
MEMPHIS Independent Bank 1 79.3 1.14 10.64 96.34 8.52
MEMPHIS Paragon Bank 0.73 81.89 1.52 10.41 101.38 7.03
MEMPHIS Triumph Bank 0.92 78.33 1.12 9.32 94.86 9.5
MILAN The Bank of Milan 0.85 51.66 0.61 9.88 59.86 9.2
MILLINGTON Patriot Bank 1.01 40.04 1.62 9.05 46.99 11.07
MOUNT JULIET Southern Bank of
Tennessee
1.01 72.15 0.84 10.27 82.46 9.18
MOUNTAIN
CITY
Farmers State
Bank
0.69 60.22 1.25 14.99 72.85 4.57

37 | P a g e
MOUNTAIN
CITY
Johnson County Bank 0.97 51.79 0.97 14.12 62.69 6.82
NASHVILLE FirstBank 1.36 71.03 0.97 9.67 81.6 12.89
CITY INSTITUTION
NET INCOME
TO AVG TOTAL
ASSETS RATIO
(%)
LOANS TO
ASSETS
RATIO (%)
FOR LOAN
LOSSES
RATIO (%)
CAPITAL
(LEVERAGE)
RATIO (%)
TO
DEPOSITS
RATIO (%)
TO AVG
TOTAL
EQUITY RATIO
(%)
NASHVILLE InsBank 0.69 83.01 1.19 10.86 105.24 6.56
NASHVILLE Pinnacle Bank 1.28 71.27 0.42 16.67 93.66 4.46
NASHVILLE Truxton Trust
Company
1.33 70.09 1.03 10.62 83.89 12.58
NASHVILLE Civic Bank & Trust 2.35 68.9 1.32 13.78 96.07 17.5
NASHVILLE CapStar Bank -0.41 77.12 1.16 8.85 93.29 -4.64
NEW TAZEWELL Citizens Bank 0.87 86.38 1.12 8.23 94.82 10.95
NEWBERN Security Bank 1 29.74 1.98 11.06 36.28 8.91
NOLENSVILLE Peoples State Bank of
Commerce
0.66 61.38 1.45 12.18 70.3 5.49
OAK RIDGE TNBANK 0.37 71.5 1.24 8.61 88.7 4.03
OOLTEWAH Millennium Bank 1.27 71.6 1.19 10.31 79.87 12.13
PARIS Commercial Bank &
Trust Co.
1.72 66.93 1.36 10.44 75.9 16.06
PARIS Security Bank and
Trust Company
3.4 68.33 0.26 9.89 77.83 27.75
PARSONS Farmers Bank 0.78 48.17 1.43 12.54 55.37 6.2
PIGEON FORGE Tennessee State Bank 0.83 67.46 1.11 10.5 75.98 8.18
PIGEON FORGE SmartBank 0.79 75.32 0.64 10.98 86.43 7.4
PIKEVILLE First Farmers &
Commercial Bank
0.64 49.8 1.28 11.09 56.19 5.76
PIPERTON The Bank of Fayette
County
1.2 81.48 1.11 8.62 99.99 14.44
PORTLAND The Farmers Bank 1.3 61.97 1.27 11.26 74.67 11.81
PORTLAND Volunteer State Bank 1.52 83.22 0.97 9.95 108.45 14.57
RIPLEY Bank of Ripley 0.59 33.74 1.25 13.54 40.04 4.15
ROGERSVILLE Civis Bank 0.19 65.58 1.29 4.04 69.76 4.97
ROGERSVILLE First Community Bank
of East Tennessee
0.52 63.49 1.63 11.29 76.13 4.43
RUTLEDGE Citizens Bank and Trust
Company of Grainger
County
0.89 28.91 1.21 16.03 34.85 5.47
SARDIS The Peoples Bank 0.65 70.03 1.11 10.01 78.59 6.58
SAVANNAH The Hardin County
Bank
1.06 78.36 1.16 8.77 89.87 12.77
SAVANNAH Central Bank 0.64 56.44 2.57 9.04 62.72 7.37
SELMER Home Banking
Company
0.52 36.16 1.02 9.7 40.65 5.25
SEVIERVILLE Sevier County Bank -0.21 64.45 1.24 5.77 68.91 -3.68
SHELBYVILLE First Community Bank
of Bedford County
0.88 68.4 0.64 11.65 118.66 6.94

38 | P a g e
SHELBYVILLE Peoples Bank of Middle
Tennessee
0.89 74.3 1.62 11.03 84.33 8.22
SPRING CITY First Bank of
Tennessee
1.56 80.71 1.21 10.44 97.78 14.92
TAZEWELL First Century Bank 1.16 82.1 1.25 9.26 91.86 12.33
CITY INSTITUTION
NET INCOME
TO AVG TOTAL
ASSETS RATIO
(%)
LOANS TO
ASSETS
RATIO (%)
FOR LOAN
LOSSES
RATIO (%)
CAPITAL
(LEVERAGE)
RATIO (%)
TO
DEPOSITS
RATIO (%)
TO AVG
TOTAL
EQUITY RATIO
(%)
TULLAHOMA American City Bank of
Tullahoma
2.44 88.47 1.06 16.79 115.29 13.17
TULLAHOMA First Vision Bank of
Tennessee
0.98 74.11 1.28 11.29 84.39 8.51
TULLAHOMA Southern Community
Bank
1 76.67 1.1 9.89 87.89 9.75
WARTBURG Citizens First Bank 0.78 68.19 1.04 8.81 77.09 8.99
WAYNESBORO The Bank of
Waynesboro
1.44 71.32 1.48 13.86 83.35 10.48
WAYNESBORO Wayne County Bank 1.05 71.91 2.17 13.42 85.49 7.95
WINCHESTER Citizens Community
Bank
1.58 62.91 2.33 11.53 72.15 13.82
Median Including All Institutions 0.92 69.08 1.22 10.33 81.38 8.53

39 | P a g e
June 30, 2017 June 30, 2016 $ Change % Change
ASSETS
Cash and Due from Banks 52,045 46,974 5,071 10.80%
Securities and Investments 2,432 3,073 -641 -20.86%
Premises and Fixed Assets 2,001 2,067 -66 3.19%
Intangible Assets 22,932 34,891 -11,959 -34.28%
Other Assets 16,789 14,224 2,565 18.03%
TOTAL ASSETS 96,199 101,229 -5,030 -4.97%
LIABILITIES
Other Liabilities 14,308 17,225 -2,917 -16.93%
TOTAL LIABILITIES 14,308 17,225 -2,917 -16.93%
EQUITY CAPITAL
Common Stock 9,093 8,151 942 11.56%
Less: Treasury Stock 1,333 1,301 32 2.46%
Surplus 5,350 4,890 460 9.41%
Additional Paid-in Capital 63,452 63,232 220 -0.35%
Undivided Profits 5,329 9,032 -3,703 -41.00%
Unrealized Gains and
(Losses)
0 0
TOTAL EQUITY CAPITAL 81,891 84,004 -2,113 -2.52%
TOTAL LIABILITIES AND 96,199 101,229 -5,030 -4.97%
EQUITY CAPITAL
Fee Income 61,385 58,848 2,537 4.31%
NET FEE INCOME 61,385 58,848 2,537 4.31%
Other Income 53 22 31 140.91%
TOTAL INCOME 61,438 58,870 2,568 4.36%
Operating Expenses 46,186 42,276 3,910 9.25%
Advisor/Consulting Fees 7,200 8,593 -1,393 -16.21%
Inter-Company Expense 1,011 678 333 49.12%
(Credit)
Securities (Gains) and Losses 0 13 -13
TOTAL OPERATING EXPENSES 54,397 51,547 2,850 5.53%
Pre-Tax Net Operating
Income
7,041 7,323 -282 -3.85%
Less:
Applicable Income Taxes 848 1,662 -814 -48.98%
Non-Operating Expenses 2,359 2,160 199 9.21%
NET OPERATING INCOME 3,834 3,501 333 9.51%
Extraordinary Gains/Losses 0 0 0 0.00%
NET INCOME 3,834 3,501 333 9.51% Note: Guardianship and Trust Company is not included in the figures above.

40 | P a g e
(A) (B) (C) (D) (E) (F) (G) (H) (I) (J)
Institution City Cash Invest Other
Assets
Total
Assets
Other
Liabilities
Equity
Capital
Net
Income TAUM
Common/
Collective
Funds
No. of
Funds
Advocacy Trust
of Tennessee,
LLC
Chattanooga 624 1,008 376 2,008 278 1,730 262 348,139 0 0
First Mercantile
Trust Company Cordova 41,508 0 20,804 62,312 2,795 59,517 488 2,921,962 2,277,974 139
Meridian Trust
and Investment Knoxville 523 400 794 1,717 114 1,603 893 660,051 0 0
The Trust
Company of
Knoxville
Knoxville 2,001 0 1,739 3,740 659 3,081 745 2,826,224 53,089 1
Argent Trust
and Investment Nashville 754 0 8,127 8,881 3,597 5,284 446 8,169,597 0 0
Diversified Trust
Company Memphis 3,879 0 5,379 9,258 5,217 4,041 0 6,046,823 1,749,073 11
Cumberland
Trust and
Investment
Nashville -85 0 4,139 4,054 1,305 2,749 427 2,734,249 0 0
Equitable Trust
Company Nashville 1,645 1,024 226 2,895 225 2,670 1,148 2,534,343 0 0
Pendleton
Square Trust
Co., LLC
Nashville 1,196 0 138 1,334 118 1,216 -575 173,664 0 0
Totals
52,045 2,432 41,722 96,199 14,308 81,891 3,834 26,415,052 4,080,136 151
Cash - Includes currency and coin, and both interest bearing and non-interest bearing balances due from depository institutions
Investments - Investments Owned
Other Assets -Includes premises and fixed assets, investments in unconsolidated subsidiaries, intangible assets, and all other assets
Total Assets - The sum of (A) through (C)
Other Liabilities - Includes all liabilities
Equity Capital - Includes preferred stock, common stock, treasury stock, debt capital, surplus, undivided profits, and all other capital reserves net of any unrealized holding gains (losses) on
available for sale securities
Net Income - Income earned after all expenses, taxes, and extraordinary items
Total Assets Under Management - Total Discretionary and Non-Discretionary Assets Under Management and/or Custody inclusive of funds held in Common/Collective Funds
Common/Collective Funds - Assets held in Common and/or Collective Investment Funds trusteed by company at market value
Number of Funds - Number of Common/Collective Funds
Note: Guardianship and Trust Company is not included.

41 | P a g e
The Department’s Compliance Division is responsible for
the licensing and examination of certain non-depository
financial institutions and individuals doing business in
Tennessee that are subject by law to regulatory oversight
by the department:
Check Cashing Companies
Deferred Presentment Services Providers
Flexible Credit Lenders
Home Equity Conversion (Reverse) Mortgage
Lenders
Industrial Loan and Thrift Companies
Insurance Premium Finance Companies
Money Transmitters
Residential Mortgage Lenders, Brokers and Servicers
Residential Mortgage Loan Originators
Title Pledge Lenders
Nicole Chamblee, CFE, Assistant Commissioner Melanie Harper, Administrative Services Assistant
Melody Johnson, Financial Analyst
David Axford, JD, Chief Administrator
Carl Scott, CFSA, Director of Licensing
Stephen Henley, CPA, Director of Licensing
Luke Schroer, Financial Analyst
Harvie Franklin, III, Money Transmitter Compliance
Officer
Mandy Heady, Financial Analyst
Steffany Daniel, Administrative Services Assistant 5
Jack Lay, Chief Administrator
Cathy Henry, Compliance Examination Supervisor
Patrick Somers, Compliance Examination
Supervisor
Robert Campbell, Loan Examiner 4
Steve Cranor, Loan Examiner 4
Robert Doyle, Loan Examiner 4
Stephanie Dunn, Loan Examiner 3
Grant Gouveia, CFE, Loan Examiner 4
Marisa Graham, Loan Examiner 1
Chad Haney, Loan Examiner 4
Elizabeth Harrell, Loan Examiner 4
Kevin Hicks, Loan Examiner 4
Robert Hornbeak, Loan Examiner 3
Kerry Rial, Loan Examiner 4
Keith Sharp, Loan Examiner 3
James Simmons, Loan Examiner 4
Calvin Stout, Loan Examiner 3
Robert Walker, Loan Examiner 4
Mike Wiggins, Loan Examiner 4
Personnel Designation: CPA, Certified Public Accountant, JD, Doctor of Jurisprudence, CFSA, Certified Financial Services
Auditor, CFE, Certified Fraud Examiner

42 | P a g e
Nashville Office Compliance Division
Compliance Division Examiners attending
the 2017 Examiners Conference held in
Gatlinburg, TN.

43 | P a g e
In order to lawfully engage in business in Tennessee, each institution or individual must first obtain
a license, certificate of registration or authorization from the department. All such applications are
processed by the Compliance Division, which ensures that each applicant meets the minimum
qualifications required by law in order to engage in such business.
Through a comprehensive examination program, licensed and registered entities are subject to
periodic examination by the Compliance Division’s examiners. Examinations are designed to test
and enforce compliance with Tennessee laws, as well as certain federal laws and regulations such as
the Real Estate Settlement Procedures Act and the Truth in Lending Act. These laws and regulations
were promulgated in order to protect consumers by, among other things, limiting the amount of
interest, loan charges and insurance charges that may be imposed, as well as providing for specific
disclosures to the consumer regarding loan provisions. The Compliance Division’s examiners also
investigate consumer complaints and allegations of consumer fraud and usury.
Through 2,886 examinations and other methods of regulatory oversight of non-depository
institutions, the department returned refunds in the amount of $4,138,766.81 to consumers for the
calendar year ending December 31, 2017. In addition, administrative enforcement actions initiated
by the department resulted in civil monetary penalties of $261,568.02.
The department implemented a risk-focused
examination program (“risk program”) July 1,
2013, for Title Pledge, Check Cashing, and
Deferred Presentment Services licensees. The
program was expanded July 1, 2014, to include
Industrial Loan and Thrift Company registrants,
Residential Lending, Brokerage, and Servicing
licensees, and Insurance Premium Finance
licensees. Flexible Credit licensees were
brought into the program on July 1, 2017.
The program utilizes a data sheet concept
which resembles a scorecard method, like the
risk scoring model used for credit scoring. Risk
questions were derived from a study of the historical examination reports and other related
regulatory information for each license type. This provided a logical and statistically sound
basis for developing risk questions. The data sheet method provided a way for the department
to compile, combine, and analyze the raw data to develop a risk rating.
Each licensee’s data sheet was used to build a database of information for each license
type. The data factors were then studied for their statistical relationship to risk of consumer
harm. The database was used to develop an industry average by license type. Each licensee’s
score is then compared to the industry average by license type. The risk rating is then

44 | P a g e
determined by whether the licensee’s score is below or above the industry average. This rating
system allows the department to focus on licensees that appear to have the greatest risk. The
risk program is intended and designed to identify potential risks to consumers. Through
scheduling, we focus examiner resources on institutions and locations that present a greater
level of risk while lessening the burden on institutions presenting the least level of risk by
extending the period between exams.
The examination scheduling is based upon the risk rating. For Check Cashing, Deferred
Presentment, Flexible Credit, Industrial Loan and Thrift, Insurance Premium Finance, and Title
Pledge licensees, a “Low” rating would result in a scheduled examination in 15 to 18 months, a
“Moderate” rating would result in a scheduled examination in 12 to 15 months, and a “High”
rating would result in a scheduled examination within 9 to 12 months of the date of last
examination. For Residential Lending, Brokerage, and Servicing licensees, a “Low” risk rating
would result in a scheduled examination in 48 to 54 months, a “Moderate” rating would result in
a scheduled examination in 30 to 36 months, and a “High” risk rating would result in a scheduled
examination within 9 to 12 months of the date of last examination. The existing rating is
updated at the beginning of each fiscal year, July 1 to June 30.
The program has provided some positive impacts to the regulated industries and to the
Compliance Division as well.
Prior to the implementation of the risk exam program, the Division showed an average
examination time for non-mortgage to be one (1) day, and four (4) days for mortgage. The
program goal was to keep the examination time the same or decrease it. The examinations
were expanded, but we achieved the goal of keeping the examination time constant through
examination efficiency improvements.
Through the yearly scheduling report that is sent to companies in early October, a listing of each
location and its scheduled rating and estimated exam frequency is given. This provides
companies with multiple locations the ability to determine an estimate of examination needs for
the coming year.
By deploying a risk-focused exam program, the department can be more efficient and effective
in not only protecting the public but in also partnering with the industry to reduce risk to
consumers. Our goal is to assist licensees to better understand their risk to consumers and to
find ways to reduce that risk. The focus by some companies to establish or improve risk
management systems is an important step toward risk reduction. The risk-focused program
empowers the department to understand each company based on its risk profile rather than
deploying a one-size-fits-all exam approach. This risk approach also permits the department to
better manage the exam workforce rather than having to hire and lay off staff based on industry
volatility.
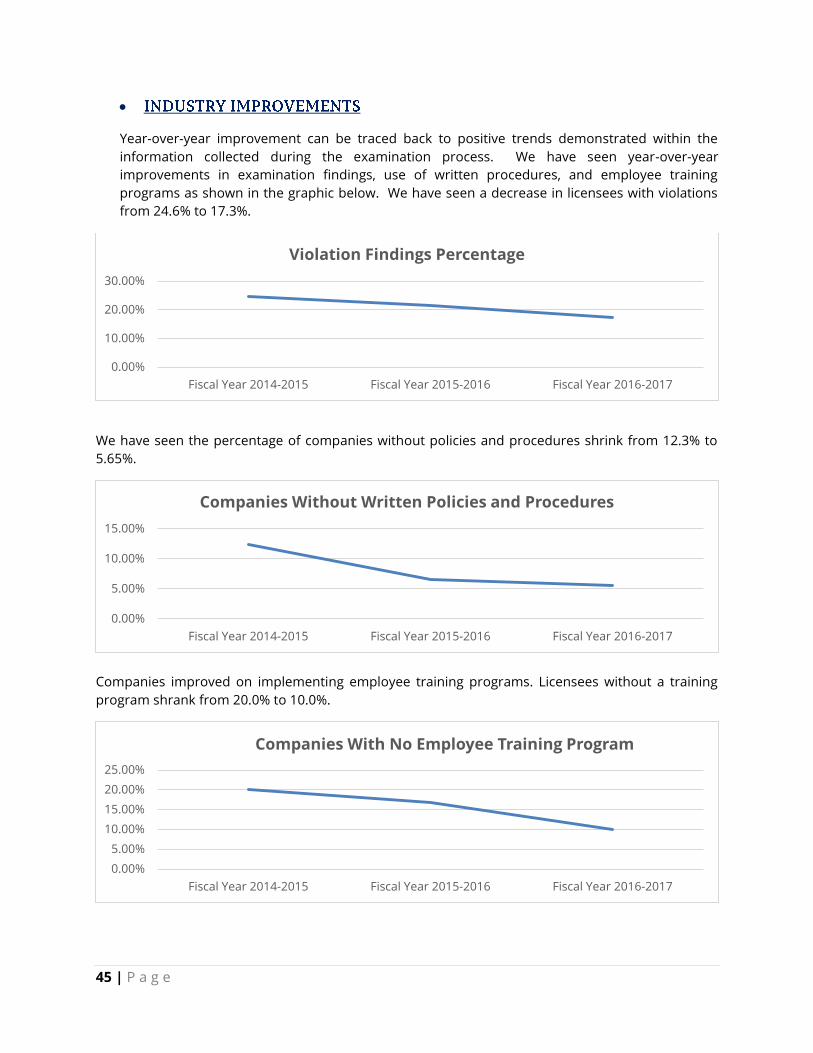
45 | P a g e
Year-over-year improvement can be traced back to positive trends demonstrated within the
information collected during the examination process. We have seen year-over-year
improvements in examination findings, use of written procedures, and employee training
programs as shown in the graphic below. We have seen a decrease in licensees with violations
from 24.6% to 17.3%.
We have seen the percentage of companies without policies and procedures shrink from 12.3% to
5.65%.
Companies improved on implementing employee training programs. Licensees without a training
program shrank from 20.0% to 10.0%.
0.00%
10.00%
20.00%
30.00%
Fiscal Year 2014-2015 Fiscal Year 2015-2016 Fiscal Year 2016-2017
Violation Findings Percentage
0.00%
5.00%
10.00%
15.00%
Fiscal Year 2014-2015 Fiscal Year 2015-2016 Fiscal Year 2016-2017
Companies Without Written Policies and Procedures
0.00%
5.00%
10.00%
15.00%
20.00%
25.00%
Fiscal Year 2014-2015 Fiscal Year 2015-2016 Fiscal Year 2016-2017
Companies With No Employee Training Program

46 | P a g e
Public Chapter 736 of the Tennessee Public Acts of 2014 amended parts of Title 45 of the
Tennessee Code relative to non-depository financial institutions regulated by the Compliance
Division. Public Chapter 736 changed the way that licensees and registrants regulated by the
Compliance Division are assessed licensing, registration and examination fees, combining those
fees into an annual supervision fee. Each person regulated by the Compliance Division, except
money transmitters and mortgage loan originators, is assessed an annual supervision fee, which
is determined by the Commissioner annually, based on the department’s budget as approved by
the Administration and the General Assembly. The supervision fee includes the annual licensing
or registration fee and the costs for a routine examination or investigation. Licensees and
registrants continue to pay the actual expenses for out-of-state examinations and inspections.
The supervision fee is paid with the filing of an application, whether a new or renewal
application, and payment of the fee is a condition of obtaining the issuance or renewal of the
license or registration. Money transmission licensees and mortgage loan originators are not
assessed a supervision fee, but continue to pay fees which are required by statute. The
supervision fee was phased in at different times during 2015 and is in full effect. The new fee
structure will assist the department in implementing its risk-focused examination program for
non-depository institutions, furthering the department’s overarching goal of establishing an
appropriate level of regulatory oversight to fulfill the department’s obligations to consumers, but
doing so in a manner so as to permit financial institutions to contribute to economic progress
and to serve the needs of consumers.
Check cashers, for a fee, provide currency in exchange for a payment instrument, such as a check.
They are licensed under the Check Cashing Act of 1997, Tenn. Code Ann. §§ 45-18-101, et seq.
Licensed check cashers may charge fees as follows: in general, no more than 5% of the face amount
of the payment instrument or $5, whichever is greater; for payment instruments for state public
assistance or federal social security benefits, no more than 3% of the face amount or $2, whichever
is greater; and for personal checks or money orders, no more than 10% of the face amount or $5,
whichever is greater.
The requirements for licensure
include a minimum net worth of
$25,000 for each location. Licenses
under the Check Cashing Act expire
on March 31 of each year and may be
renewed by the filing of a renewal
application on or before March 1. As
of December 31, 2017, there were
557 check cashing locations licensed
with the department. For calendar
year 2017, the department conducted
430 examinations of check cashing
businesses, resulting in refunds
totaling $12,643.89.
47 | P a g e
Licensees under the Deferred Presentment Services Act, Tenn. Code Ann. §§ 45-17-101, et seq., may
engage in the business of deferred presentment services. A deferred presentment service is a
transaction involving, in exchange for a fee, the acceptance and payment by the licensee of a check
and the holding of the check for a period of time prior to presentment for payment. Licensees may
charge a fee of not more than 15% of the face amount of the check, and may not have outstanding
more than two (2) checks from any one (1) customer at the same time, with the aggregate face value
of all outstanding checks from any one (1) customer not to exceed $500.
The requirements for licensure include having a minimum net worth of $25,000 for each location.
Licenses under the Deferred Presentment Services Act expire on December 31 of each year and may
be renewed by the filing of a renewal application, through the Nationwide Multistate Licensing
System (NMLS), between November 1 and December 31. As of December 31, 2017, there were 983
deferred presentment service locations licensed with the department. For calendar year 2017, the
department conducted 717 examinations of deferred presentment service businesses, resulting in
refunds totaling $65,648.59.
By December 31st of each year, licensees are required by T.C.A. § 45-17-119 to file with the
Commissioner of Financial Institutions an Annual Report covering the licensee’s business
activities as of the close of business on December 31st of the prior year. These reports
include a balance sheet, statement of income and expense, as well as other statistical data.
Following is a recapitulation of the 2016 annual reports, submitted by licensees with renewal
applications, for the purpose of reflecting the general results of operations for the calendar
year ending December 31, 2016.
The following tabulation represents aggregate information from reports filed by 152 licensed
companies. The department did not require an annual report from companies that opened
after December, 2016.
As of December 31, 2016, five (5) companies owned 85% of the industry’s assets. This
accounts for $755,929,612 of the total reported assets of $891,449,838. Fifty-five (55)
companies reported assets greater than $500,000; 71 companies had assets of between
$100,000 and $500,000; and the remaining 26 showed total assets of less than $100,000.
Total Assets $891,449,838
Total Liabilities $552,762,657
Net Worth $338,687,181

48 | P a g e
The following information was compiled from the statements of income and expenses for
the period of January 1, 2016 to December 31, 2016.
*Excluding Owners’ Compensation
Of the 152 reporting companies, 39 reported operating losses and 16 reported net income
of over $100,000 for the period ending December 31, 2016. The average company made a
profit of $153,176. Salaries are a major company expense, amounting to about 27% of total
operating income. The average salary expense for a reporting company was $235,470.
Losses on receivables constitute another major industry expense. Bad debt expense
represented approximately 19% of total operating income.
The following transactional data was reported for the reporting period ending December 31,
2016:
Number of Transactions 2,904,116
Dollar Amount of Transactions During the Year $797,020,519
Average Size of Receivable Transactions $274
369,602
1,279,574
1,254,940
$1 - $150
$151 - $250
$251 - $500
Number of Transactions by Size of Check
Total Operating Income $134,319,327
Salary Expense $35,791,417
Bad Debt Expense $25,157,798
Owners’ Compensation $2,895,809
Net Income* $23,282,750
49 | P a g e
Businesses licensed under the Flexible Credit Act, Tenn. Code Ann. §§ 45-12-101, et seq., may offer
“flex loans”. A flex loan plan means a written agreement subject to this chapter between a licensee
and a customer establishing an open-end credit plan under which the licensee contemplates
repeated noncommercial loans for personal, family or household purposes.
Flex loan plans may be unsecured or secured by personal property, and may be without fixed
maturities or limitations as to the length of term. Flexible credit lenders may charge a periodic
interest rate not to exceed 24% per annum, and a customary fee not to exceed a daily rate of 0.7%
of the average daily principal balance in any billing cycle. No flex loan plan may have an outstanding
principal balance in excess of $4,000 at any time.
The requirements for licensure under the Flexible
Credit Act include having a minimum net worth of
$50,000 for each location, and filing with the
department a surety bond in the amount of
$25,000 for each location up to a maximum of
$200,000 for any one (1) licensee. Licenses under
the Flexible Credit Act expire on December 31 of
each year and may be renewed by filing a renewal
application, through the Nationwide Multistate
Licensing System (NMLS), between November 1
and December 31. As of December 31, 2017, there
were 576 flexible credit locations licensed with the
Department. For calendar year 2017, the department conducted 247 examinations of flexible credit
lenders, resulting in refunds totaling $1,061,096.70.
Under T.C.A. § 45-12-122, the Commissioner shall prepare and submit to the governor and
general assembly, annually, an analysis and recapitulation of the reports for the preceding
calendar year for the purpose of reflecting the general results of operations under this
chapter.
The following tabulation represents aggregate information from the audited financial
statements of 19 reporting entities.
Total Assets $304,022,112
Total Liabilities $136,196,931
Net Worth $167,825,181

50 | P a g e
As of December 31, 2016, five (5) companies owned 84% of the industry’s assets. This
accounts for $254,569,702 of the total reported assets of $304,022,112. Eleven (11)
companies reported assets greater than $500,000; whereas eight (8) companies had less
than $500,000 in assets.
The following tabulation represents aggregate information for the period ending December
31, 2016:
*Excluding Owners’ Compensation
Of the 19 reporting companies four (4) reported operating losses. The average company
made a profit of $284,511.
Salaries are a major company expense, amounting to about 15% of total operating income.
The average salary expense for a reporting company was $1,843,889. Losses on receivables
constitute another major industry expense. Bad debt expense represented approximately
23% of total operating income.
Distribution of 2016 New Agreements by Dollar Amount: (Maximum agreement amount=
$4,000)
150,713
34,911
2,859
$1,000 orless
$1,001 -$3,000
$3,001 -$4,000
New Agreements
Total Operating Income $231,834,537
Salary Expense $35,033,893
Bad Debt Expense $53,942,837
Owners’ Compensation $3,407,042
Net Income* $11,105,715
Number of New Agreements Entered Into for 2016 188,483
Dollar Amount of New Agreements During 2016 $135,488,000

51 | P a g e
Home equity conversion mortgages, also known as reverse mortgages, are governed in Tennessee
by the Home Equity Conversion Mortgage Act, Tenn. Code Ann. §§ 47-30-101, et seq. A business
that makes home equity conversion mortgages must be licensed under the Tennessee Residential
Lending, Brokerage and Servicing Act, Tenn. Code Ann. §§ 45-13-101, et seq. and must also be an
authorized lender under the Home Equity Conversion Mortgage Act. All reverse mortgages issued in
Tennessee must comply with
all requirements for
participation in the federal
Department of Housing and
Urban Development’s (HUD)
Home Equity Conversion
Mortgage Program (or other
similar federal reverse
mortgage loan programs) and
must be insured by the
Federal Housing Agency or
other similar federal agency.
The requirements for
authorization include
licensure under the
Tennessee Residential
Lending, Brokerage and
Servicing Act, and proof of
approval as a lender by the Department of Housing and Urban Development. Authorized lenders
are examined for compliance with the Home Equity Conversion Mortgage Act at the same time that
they are examined for compliance under the Tennessee Residential Lending, Brokerage and
Servicing Act. As of December 31, 2017, 52 lenders were authorized to make reverse mortgage
loans.
The Tennessee Industrial Loan and Thrift (TILT) Companies Act, Tenn. Code Ann. §§ 45-5-101, et seq.,
was adopted for the stated purpose of allowing the citizens of Tennessee to have available the
facilities and resources of regulated lending institutions to meet their needs for loans at rates and
charges reasonably commensurate with economic realities. TILT companies are authorized to
charge rates of interest higher than the rates currently authorized under Tennessee’s general usury
statutes. The requirements for registration under the TILT Act include having a minimum net worth
of $25,000 for each location from which business is conducted, and filing with the department a
surety bond in the amount of $200,000 if the business proposes to make residential mortgage loans,
or $50,000 otherwise. Registrations under the TILT Act expire on March 31 of each year and may be
renewed by filing a renewal application on or before March 1. As of December 31, 2017, there were
1,098 TILT locations registered with the department. For the calendar year 2017, the department
conducted 665 examinations of TILT companies resulting in refunds totaling $750,049.10.

52 | P a g e
Number of Companies Included in This Report 214
Number of Offices Included in This Report 1,080
Number of Employees Included in This Report 5,409
RATE OF RETURN
Average Monthly Gross Receivable (Industry) $1,946,827,630
Average Monthly Gross Receivable (Location) $1,802,619
Net Income (Industry) $43,824,284
Net Income (Location) $40,578
Rate of Return on Outstanding Receivables (Location) 2.25%
ANALYSIS OF ACCOUNTS OUTSTANDING (MONTHLY AVERAGE)
Average Number of Accounts Outstanding (Industry) 712,791
Average Number of Accounts Outstanding (Company) 3,330
Average Number of Accounts Outstanding (Location) 660
OTHER INFORMATION
Number of Loans Outstanding at Beginning of Year 754,638
Dollar Amount of Loans Outstanding at Beginning of Year $1,767,588,991.13
Average Amount per Loan Outstanding at Beginning of Year $2,342
Number of Loans Made During the Year 2,357,446
Dollar Amount of Loans Made During the Year $2,748,083,992.35
Average Amount per Loan Made $1,165
Number of Loans Charged Off During the Year 178,961
Dollar Amount of Loans Charged Off During the Year $141,236,633.40
Average Account Balance Charged Off $789
Number of Loans Outstanding at Year End 755,569
Dollar Amount of Loans Outstanding at Year End $2,002,017,692.13
Average Account Balance per Loan Outstanding at Year End $2,650

53 | P a g e
Gross Loan Receivables Outstanding – January $1,923,124,141.44
Gross Loan Receivables Outstanding – February $1,908,263,219.84
Gross Loan Receivables Outstanding – March $1,917,397,412.05
Gross Loan Receivables Outstanding – April $1,909,453,799.58
Gross Loan Receivables Outstanding – May $1,956,198,470.83
Gross Loan Receivables Outstanding – June $1,945,356,253.89
Gross Loan Receivables Outstanding – July $1,951,210,818.96
Gross Loan Receivables Outstanding – August $1,962,999,987.22
Gross Loan Receivables Outstanding – September $1,971,760,403.07
Gross Loan Receivables Outstanding – October $1,953,503,296.94
Gross Loan Receivables Outstanding – November $1,968,588,003.22
Gross Loan Receivables Outstanding – December $1,994,075,763.20
Persons engaged in the business of premium finance companies in Tennessee must be licensed
under the Premium Finance Company Act of 1980, Tenn. Code Ann. §§ 56-37-101, et seq. Premium
finance companies enter into agreements by which an insured or prospective insured promises to
pay to the premium finance company the amount advanced or to be advanced under the
agreement to an insurer or insurance agent or producing agent in payment of premiums of an
insurance contract, together with interest and a service charge. A premium finance company may
charge interest not to exceed a maximum effective rate of 24% per annum, and may charge on pre-
computed loans a service charge in an amount equal to 4% of the total amount of the loan.
The requirements for licensure under the Premium Finance Company Act include the experience,
training or education so as to be qualified in the business for which the license is required. As of
December 31, 2017, there were 50 insurance premium finance companies licensed with the
department. For calendar year 2017, the department conducted 22 examinations of insurance
premium finance companies resulting in refunds totaling $10,829.76.
The activities of Money Transmitter companies are
governed by the Tennessee Money Transmitter Act of
1994, Tenn. Code Ann. §§ 45-7-101, et seq. There are
exemptions that apply to certain government agencies,
as well as business organizations. See Tenn. Code Ann.
§ 45-7-204.
The department continues to enhance its policies and
procedures to ensure that they efficiently and
effectively facilitate its statutory responsibility to ensure

54 | P a g e
certain consumer protections as well as to help provide a good business environment for legitimate
industry. The department also continues to be an active participant in the Money Transmitter
Regulatory Association and Conference of State Bank Supervisors to facilitate fulfillment of its
responsibilities with respect to money transmission licensing and regulation.
Each applicant for a money transmitter license must demonstrate, and each licensee must maintain,
a net worth of not less than $100,000 computed according to generally accepted accounting
principles. Persons transmitting, or proposing to transmit, money shall have an additional net worth
of $25,000 per additional location or agent located in Tennessee, as applicable, to a maximum of
$500,000. The applicant must demonstrate such experience, character, and general fitness as to
command the confidence of the public and warrant the belief that the business will be operated
lawfully and fairly. As of December 31, 2017, the division licensed 124 money transmitters. For
calendar year 2017, the department conducted one (1) money transmitter examination and 16
examinations of money transmitters were conducted by the Multistate Money Transmitter Exam
Team (MMET), of which the department is a member, or the examinations were conducted by other
states and accepted by the MMET and the department. The Tennessee Money Transmitter Act
authorizes the department to accept examinations of an agency of another state. Consumer
refunds were made in the amount of $1,123,232.80.
Residential mortgage lenders, brokers and
servicers doing business in Tennessee
must be licensed under the Tennessee
Residential Lending, Brokerage and
Servicing Act, Tenn. Code Ann. §§ 45-13-
101, et seq. The requirements for
licensure include having a minimum net
worth of $25,000, and filing with the
department a surety bond in an initial
amount of between $90,000 and $200,000
depending on the nature of the business
to be conducted, and the bond is
adjustable annually based on the dollar
amount of Tennessee residential
mortgage loans originated in the preceding calendar year. Licenses expire on December 31 of each
year and may be renewed by the filing of a renewal application, through the Nationwide Multistate
Licensing System (NMLS), between November 1 and December 31. As of December 31, 2017, there
were 632 mortgage businesses licensed with the department. For the calendar year 2017, the
department conducted 114 examinations of mortgage companies, resulting in refunds totaling
$965,619.99.
Residential mortgage loan originators must also be licensed under the Tennessee Residential
Lending, Brokerage and Servicing Act, Tenn. Code Ann. §§ 45-13-101, et seq. The requirements for
licensure include the following: 20 hours of pre-licensure education, two (2) hours of which must be
in Tennessee law; passing score on a national test with uniform state content; authorization for a

55 | P a g e
fingerprint based criminal background check through the FBI; authorization for a credit report from
a national credit reporting agency. A mortgage loan originator license is not active unless the
individual is also sponsored by a licensed mortgage lender or mortgage loan broker, and a mortgage
loan originator is prohibited by law from providing origination services with an inactive license.
Licenses expire on December 31 of each year and may be renewed by the filing of a renewal
application, through the Nationwide Multistate Licensing System (NMLS), between November 1 and
December 31. As of December 31, 2017, there were 13,454 mortgage loan originators licensed with
the department. The department examines the work product of individual mortgage loan
originators when it examines the sponsoring broker or lender.
The Tennessee Title Pledge Act, Tenn. Code Ann. §§ 45-15-101, et seq., governs the activities of title
pledge lenders in Tennessee. A title pledge loan is a 30 day loan, which may be renewed, secured by
the borrower’s motor vehicle. Title pledge lenders may charge interest at a rate not to exceed 2%
per month, and a customary fee of no more than 1/5 of the original principal amount of the loan or
the unpaid balance due at the inception of any renewal. If a borrower fails to repay a loan, the
lender may repossess and sell the vehicle, but the borrower is not personally liable for any
deficiency balance.
Effective August 1, 2017, the department began using the National Multistate Licensing System
(NMLS) to manage title pledge lender licenses. Through NMLS, entities can apply for, amend, and
renew their Tennessee title pledge lender license authority conveniently and safely online.
NMLS is a secure, web-based system created by state regulators to provide efficiencies in the
processing of state license and to improve supervision of state regulated industries. Through NMLS,
companies maintain a single record which they use to apply for, maintain, renew, and surrender
licenses in one (1) or more states.
More information about NMLS can be found at:
http://mortgage.nationwidelicensingsystem.org/Pages/default.aspx
The requirements for licensure under the Tennessee Title Pledge Act include having a minimum net
worth of $75,000 for each location, and filing with the department a surety bond in the amount of
$25,000 for each location up to a maximum of $200,000 for any one (1) licensee. Licenses under the
Tennessee Title Pledge Act expire on December 31 of each year and may be renewed by filing a
renewal application on or before December 1. As of December 31, 2017, there were 830 title pledge
locations licensed with the department. For the calendar year 2017, the department conducted 674
examinations of title pledge businesses resulting in refunds totaling $149,645.98.
The following tabulation represents aggregate information from reports filed by 91 licensed
companies. The department did not require an annual report from companies that opened
after December, 2016.

56 | P a g e
As of December 31, 2016, five (5) companies owned 76% of the industry’s assets. This
accounts for $353,078,596 of the total reported assets of $465,666,066. Forty (40)
companies reported assets greater than $500,000; 46 companies had assets of between
$100,000 and $500,000; and the remaining five (5) reflected total assets of less than
$100,000.
The following information was compiled from the statements of income and expenses for
the period of January 1, 2016 to December 31, 2016.
*Excluding Owners’ Compensation
Of the 91 reporting companies, 20 reported operating losses and 10 reported net income of
over $100,000 for the period ending December 31, 2016. The average company made a
profit of $262,775.
Salaries are a major company expense, amounting to about 19% of total operating income.
The average salary expense for a reporting company was $303,296. Losses on receivables
constitute another major industry expense. Bad debt expense represented approximately
29% of total operating income.
The following transactional data was reported for the reporting period ending December 31,
2016:
Total Assets $465,666,066
Total Liabilities $63,525,973
Net Worth $402,140,093
Total Operating Income $145,447,512
Salary Expense $27,599,930
Bad Debt Expense $41,938,885
Owners’ Compensation $2,572,876
Net Income* $23,912,527
Number of New Agreements Entered Into for 2016 180,147
Dollar Amount of New Agreements During 2016 $167,114,168
Number of Defaults 414,693
Number of Repossessions 16,524
Total Surplus Amount Returned to Customers after Sale of
Repossessed Vehicles $464,713

57 | P a g e
Distribution of 2016 New Agreements by Dollar Amount: (Maximum agreement amt. =
$2,500)
94,405
50,729
35,013
$1,000 or Less
$1,001 - $2,000
$2,001 - $2,500
New Agreements
Series1
Number of Customers Holding Agreements Outstanding as of December 31, 2016 118,889
Number of Customers who Deferred a Principal Payment Reduction in 2016 24,197

58 | P a g e
The Credit Union Division is responsible for the supervision and examination of state-chartered
natural-person and corporate credit unions. Credit union examiners perform safety and soundness
examinations for each state-chartered credit union and Volunteer Corporate Credit Union to
determine compliance with governing laws and regulations. Evaluations of each credit union’s
assets, liabilities, income and expenses are performed to assess the solvency of the institution. They
also perform investigations as a result of complaints filed with the Department’s Consumer
Resources Section.
Collectively, the 84 natural-person credit unions regulated by the Credit Union Division have assets
of approximately $11.1 billion. The return on average assets was 1.04%. Individually, the
institutions present a vast array of asset sizes, field of membership and services.
Volunteer Corporate Credit Union (VolCorp), located in Nashville, Tennessee continues to meet the
financial service needs of natural-person credit unions, whether state or federally-chartered.
VolCorp is a $1.3 billion corporate credit union that serves more than 351 member credit unions in
Tennessee and other states. Primary offerings include traditional correspondent services such as
investments, item processing, security safekeeping, consulting services and web design.
The Credit Union Division remains accredited by the National Association of State Credit Union
Supervisors (NASCUS). The NASCUS accreditation was re-certified in June 2015 (for another five-year
period). Additionally, eligible division examiners and supervisors have met comprehensive criteria
for NASCUS examination certifications. This certification program provides recognition to superior
state credit union examiners and encourages continued professional development through the
certification’s required continuing education hours.
The primary responsibility of the Credit Union Division is to provide the people of Tennessee with a
safe and sound system of credit unions by ensuring compliance with governing law, while giving
institutions the opportunity to contribute to the economic progress of Tennessee.

59 | P a g e
Credit Union Examiners with Commissioner Gonzales (far right) and Deputy Commissioner Miller (center)
Tina G. Miller, Deputy Commissioner
Anthony Rogers, Safety and Soundness Chief
Administrator
Jennifer Meade, Administrative Services
Assistant 3
West Tennessee District
Randall Means, CSCUES, Credit Union Examiner 5
Josh Evans, Credit Union Examiner 4
Robert Heisse, Credit Union Examiner 4
Dana R. Owen, CFE, CEIC, CISE, Credit Union
Examiner 4
Middle Tennessee District
Steve Eddings, CFE, CSCUE, CEIC, Credit Union
Examiner 5
Matthew Adkison, Credit Union Examiner 4
Jim Eller, Credit Union Examiner 4
Derek Quarles, Credit Union Examiner 1
East Tennessee District
Brian Williams, Safety and Soundness Supervisor
George Goodwin, Credit Union Examiner 4
Shane Hardin, CFE, CSCUE Credit Union Examiner 5
William Justice, Credit Union Examiner 4
Dwight Ward, Credit Union Examiner 4
Personnel Designation: CEIC, Certified Examiner-in-Charge; CFE, Certified Fraud Examiner; CISE, Certified Information Systems
Examiner; CSCUE, Certified State Credit Union Examiner; CSCUES, Certified State Credit Union Examiner Supervisor

60 | P a g e
Mergers/Liquidations
Knoxville News Sentinel Credit Union merged with and into New South Credit Union
(12/31/2016)
Employment Security Credit Union merged with and into Tennessee Employees Credit Union
(05/01/2017)
There were no credit union liquidations during the fiscal year.
Name Changes
There were no credit union name changes during the fiscal year.
Principal Address Change
Olivet Baptist Credit Union changed its principal office to 10000 Woodland Hills Drive,
Cordova, Tennessee (03/31/2017)
New Branches/Branch Relocations
Kingsport Press Credit Union – Approval to relocate branch to 102 N. Sneedville Pike,
Rogersville, Tennessee (08/08/2016)
Horizon Credit Union – Approval to establish a branch at 130 Main Street, Mt. Carmel,
Tennessee (12/11/2016)
Eastman Credit Union – Approval to establish a branch at The Meadows Development, Parcel
1, Abingdon, Virginia (12/16/2016)
Mountain States Credit Union – Approval to establish a branch at 1102 and 1106 W. Market
Place, Johnson City, Tennessee (01/24/2017)
Heritage South Credit Union – Approval to establish a branch at 941 Sgt. Asbury Hawn Way,
Smyrna, Tennessee (04/18/2017)
Leaders Credit Union – Approval to establish a branch at 15432 First South Street, Milan,
Tennessee (04/27/2017)
Approval to Close/Sell Branches
Mountain States Credit Union – Approval to close branch located at 1021 W. Oakland
Avenue, Johnson City, Tennessee (01/24/2017)
Field of Membership Application Approvals
Vanderbilt University Credit Union – Approval to add Vanderbilt University Medical Center
employees (10/12/2016)
Leaders Credit Union – Approval to add persons who live, work, worship or attend school in
certain census tracts of Carroll, Crockett and Gibson Counties in Tennessee (12/15/2016)
First South Financial Credit Union – Approval to add certain areas of the Nashville MSA as a
separate community group (03/09/2017)
Pathway Credit Union – Approval to add Church of God members in Tennessee (05/03/2017)
Leaders Credit Union – Approval to add members of the Boys and Girls Club of Jackson-
Madison County, Inc. (05/18/2017)

61 | P a g e
Lakeside Employees Credit Union – Approval to expand community charter to include
Benton and Dickson Counties (06/08/2017)
FYE
6/30/2016
FYE
6/30/2017
CAPITAL ADEQUACY
Net Worth/Total Assets 12.85% 12.67%
Net Worth/Total Assets--Including Optional Total Assets
Election (if used)
12.86% 12.68%
Total Delinquent Loans / Net Worth 2.07% 2.13%
Solvency Evaluation (Estimated) 114.85% 114.64%
Classified Assets (Estimated) / Net Worth 4.59% 4.24%
ASSET QUALITY
Delinquent Loans / Total Loans 0.37% 0.36%
*Net Charge-Offs / Average Loans 0.30% 0.32%
Fair (Market) HTM Invest Value/Book Value HTM Invest. 100.35% 99.98%
Accum Unreal G/L On AFS/Cost Of AFS 0.31% -0.80%
Delinquent Loans / Assets 0.27% 0.27%
EARNINGS
*Return On Average Assets 1.01% 1.04%
*Gross Income/Average Assets 4.77% 4.87%
*Yield on Average Loans 4.44% 4.35%
*Yield on Average Investments 0.91% 1.10%
* Fee & Other Op. Income / Avg. Assets 1.38% 1.41%
*Cost of Funds / Avg. Assets 0.44% 0.48%
*Net Margin / Avg. Assets 4.33% 4.39%
*Operating Exp./ Avg. Assets 3.18% 3.14%
*Provision For Loan & Lease Losses / Average Assets 0.16% 0.23%
*Net Interest Margin/Avg. Assets 2.95% 2.99%
Operating Exp./Gross Income 66.62% 64.4%
Fixed Assets & Foreclosed & Repossessed Assets / Total Assets 2.53% 2.39%
*Net Operating Exp. /Avg. Assets 2.42% 2.39%
ASSET / LIABILITY MANAGEMENT
Net Long-Term Assets / Total Assets 33.21% 33.83%
Reg. Shares / Total Shares & Borrowings 32.66% 32.85%
Total Loans / Total Shares 84.51% 88.07%
Total Loans / Total Assets 71.77% 74.75%
Cash + Short-Term Investments / Assets 15.86% 14.84%
Total Shares, Dep. & Borrowings / Earning Assets 91.14% 91.14%
Reg. Shares + Share Drafts / Total Shares & Borrowings 48.69% 49.72%
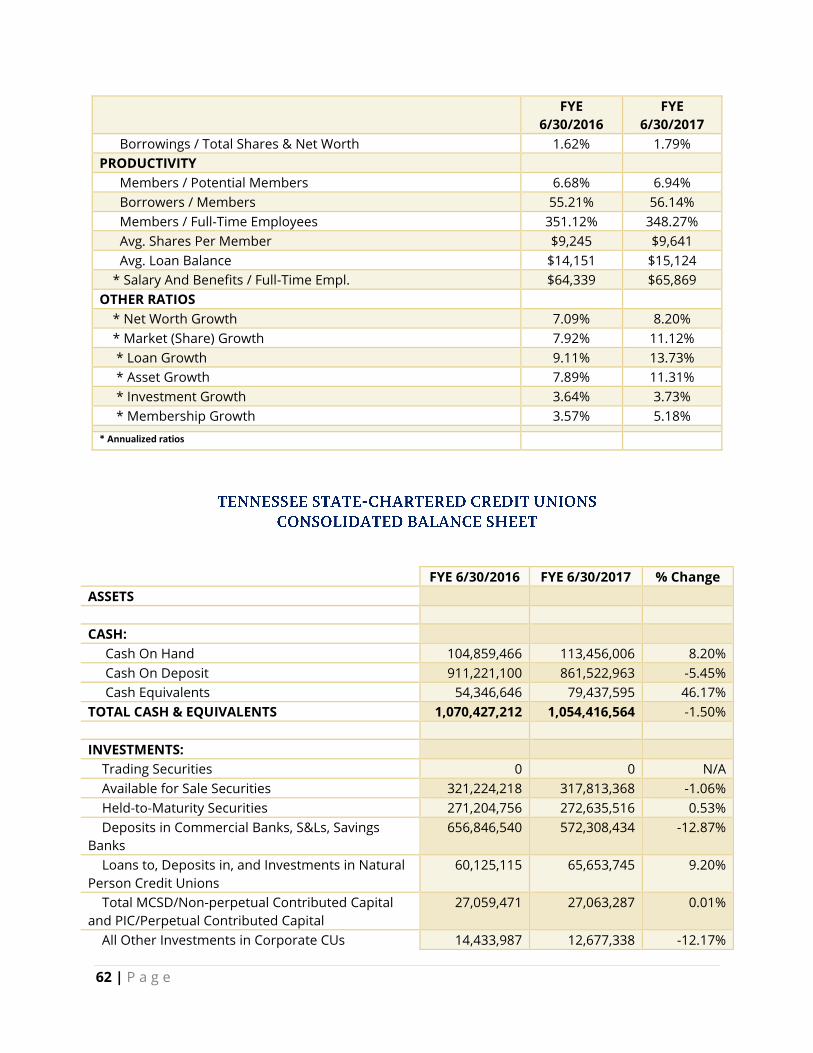
62 | P a g e
FYE
6/30/2016
FYE
6/30/2017
Borrowings / Total Shares & Net Worth 1.62% 1.79%
PRODUCTIVITY
Members / Potential Members 6.68% 6.94%
Borrowers / Members 55.21% 56.14%
Members / Full-Time Employees 351.12% 348.27%
Avg. Shares Per Member $9,245 $9,641
Avg. Loan Balance $14,151 $15,124
* Salary And Benefits / Full-Time Empl. $64,339 $65,869
OTHER RATIOS
* Net Worth Growth 7.09% 8.20%
* Market (Share) Growth 7.92% 11.12%
* Loan Growth 9.11% 13.73%
* Asset Growth 7.89% 11.31%
* Investment Growth 3.64% 3.73%
* Membership Growth 3.57% 5.18%
* Annualized ratios
FYE 6/30/2016 FYE 6/30/2017 % Change
ASSETS
CASH:
Cash On Hand 104,859,466 113,456,006 8.20%
Cash On Deposit 911,221,100 861,522,963 -5.45%
Cash Equivalents 54,346,646 79,437,595 46.17%
TOTAL CASH & EQUIVALENTS 1,070,427,212 1,054,416,564 -1.50%
INVESTMENTS:
Trading Securities 0 0 N/A
Available for Sale Securities 321,224,218 317,813,368 -1.06%
Held-to-Maturity Securities 271,204,756 272,635,516 0.53%
Deposits in Commercial Banks, S&Ls, Savings
Banks
656,846,540 572,308,434 -12.87%
Loans to, Deposits in, and Investments in Natural
Person Credit Unions
60,125,115 65,653,745 9.20%
Total MCSD/Non-perpetual Contributed Capital
and PIC/Perpetual Contributed Capital
27,059,471 27,063,287 0.01%
All Other Investments in Corporate CUs 14,433,987 12,677,338 -12.17%

63 | P a g e
FYE 6/30/2016 FYE 6/30/2017 % Change
All Other Investments 52,442,934 50,936,880 -2.87%
TOTAL INVESTMENTS 1,403,337,021 1,319,088,568 -6.00%
LOANS HELD FOR SALE 1,883,144 2,393,186 27.08%
LOANS AND LEASES:
Unsecured Credit Card Loans 238,522,656 250,331,354 4.95%
All Other Unsecured Loans/Lines of Credit 278,717,008 287,681,923 3.22%
Payday Alternative Loans (PAL Loans) (FCUs only) 0 0 N/A
Non-Federally Guaranteed Student Loans 61,092,105 61,952,412 1.41%
New Vehicle Loans 1,292,230,143 1,599,238,287 23.76%
Used Vehicle Loans 1,413,862,168 1,644,482,738 16.31%
Leases Receivable 976,516 0 -100.00%
All Other Secured Non-Real Estate Loans/Lines of
Credit
476,056,521 509,731,859 7.07%
Total Loans/Lines of Credit Secured by 1st Lien 1-
4 Family Residential Properties
3,262,848,585 3,644,417,350 11.69%
Total Loans/Lines of Credit Secured by Junior Lien
1-4 Family Residential Properties
317,775,804 326,691,849 2.81%
All Other Real Estate Loans/Lines of Credit N/A N/A N/A
Commercial Loans/Lines of Credit Real Estate
Secured
N/A N/A N/A
Commercial Loans/Lines of Credit Not Real Estate
Secured
N/A N/A N/A
TOTAL LOANS & LEASES 7,342,081,506 8,324,527,772 13.38%
(ALLOWANCE FOR LOAN & LEASE LOSSES): (60,429,409) (59,790,999) -1.06%
Foreclosed Real Estate 9,718,731 8,788,566 -9.57%
Repossessed Autos 2,020,550 2,326,214 15.13%
Foreclosed and Repossessed Other Assets 87,396 135,214 54.71%
TOTAL FORECLOSED and REPOSSESSED ASSETS : 11,826,677 11,249,994 -4.88%
Land and Building 215,005,851 222,293,830 3.39%
Other Fixed Assets 28,140,748 28,655,617 1.83%
NCUA Share Insurance Capitalization Deposit 79,267,161 84,879,266 7.08%
Identifiable Intangible Assets 27,043 32,020 18.40%
Goodwill 353,527 361,667 2.30%
TOTAL INTANGIBLE ASSETS: 380,570 393,687 3.45%
Accrued Interest on Loans 17,795,342 18,943,746 6.45%
Accrued Interest on Investments 2,399,969 2,355,532 -1.85%
Non-Trading Derivative Assets, net 1,546,328 0 -100.00%
All Other Assets 116,686,097 127,293,243 9.09%

64 | P a g e
FYE 6/30/2016 FYE 6/30/2017 % Change
TOTAL OTHER ASSETS 138,427,736 148,592,521 7.34%
TOTAL ASSETS 10,230,348,217 11,136,700,006 8.86%
TOTAL CU's 86 84 -2.33%
LIABILITIES, SHARES AND EQUITY
LIABILITIES:
Other Borrowings N/A N/A N/A
Other Notes, Promissory Notes, Interest Payable,
& Draws Against Lines of Credit
162,265,603 194,337,557 19.77%
Borrowing Repurchase Transactions 0 0 N/A
Subordinated Debt 0 0 N/A
Uninsured Secondary Capital and Subordinated
Debt Included in Net Worth
90,000 90,000 N/A
Non-Trading Derivative Liabilities, net 0 0 N/A
Accrued Dividends and Interest Payable 1,032,036 1,054,273 2.15%
Accounts Payable & Other Liabilities 88,148,414 105,764,175 19.98%
TOTAL LIABILITIES 251,536,053 301,246,005 19.76%
SHARES AND DEPOSITS:
Share Drafts 1,418,983,895 1,627,713,711 14.71%
Regular Shares 2,890,702,263 3,168,479,087 9.61%
Money Market Shares 1,317,848,774 1,356,936,350 2.97%
Share Certificates 2,155,092,684 2,343,908,642 8.76%
IRA/KEOGH Accounts 721,510,106 751,826,605 4.20%
All Other Shares 92,964,017 104,572,130 12.49%
Non-Member Deposits 91,187,536 98,734,521 8.28%
TOTAL SHARES AND DEPOSITS 8,688,289,275 9,452,171,046 8.79%
EQUITY:
Undivided Earnings 865,606,617 915,547,956 5.77%
Regular Reserves 391,296,881 439,248,376 12.25%
Appropriation For Non-Conforming Investments
(SCU Only)
0 0 N/A
Other Reserves 24,923,575 19,895,264 -20.17%
Equity Acquired in Merger 20,065,161 23,204,969 15.65%
Miscellaneous Equity 15,800 20,237 28.08%
Accumulated Unrealized G/L on AFS Securities 993,472 -2,565,823 -358.27%
Accumulated Unrealized Losses for OTTI
(due to other factors) on HTM Debt Securities
0 0 N/A
Accumulated Unrealized G/L on Cash Flow
Hedges
0 0 N/A

65 | P a g e
FYE 6/30/2016 FYE 6/30/2017 % Change
Other Comprehensive Income -25,863,437 -26,209,276 1.34%
Net Income * 13,484,820 14,141,252 4.87%
EQUITY TOTAL 1,290,522,889 1,383,282,955 7.19%
TOTAL SHARES & EQUITY 9,978,812,164 10,835,454,001 8.58%
TOTAL LIABILITIES, SHARES, & EQUITY 10,230,348,217 11,136,700,006 8.86%
NCUA INSURED SAVINGS:
Uninsured Shares 428,767,559 498,934,623 16.36%
Uninsured Non-Member Deposits 4,869,718 4,977,314 2.21%
Total Uninsured Shares & Deposits 433,637,277 503,911,937 16.21%
Insured Shares & Deposits 8,254,651,998 8,948,259,109 8.40%
TOTAL NET WORTH 1,315,306,852 1,411,829,799 7.34%
FYE 6/30/2016 FYE 6/30/2017 % Change
INCOME AND EXPENSE
INTEREST INCOME:
Interest on Loans 159,385,612 175,341,715 9.10%
Less Interest Refund (0) (0) N/A
Income from Investments 10,663,480 12,339,741 13.58%
Income from Trading 0 0 N/A
TOTAL INTEREST INCOME 170,049,092 187,681,456 9.39%
INTEREST EXPENSE:
Dividends 8,182,724 8,703,241 5.98%
Interest on Deposits 12,422,366 15,626,528 20.50%
Interest on Borrowed Money 1,291,446 1,536,125 15.93%
TOTAL INTEREST EXPENSE 21,896,536 25,865,894 15.35%
PROVISION FOR LOAN & LEASE LOSSES 8,053,032 12,326,156 34.67%
NET INTEREST INCOME AFTER PLL 140,099,524 149,489,406 6.28%
*Note: The Net Income shown in the Equity section of the Consolidated Balance Sheet will not reconcile to the Net Income shown
on the Consolidated Income Statement. This is due to the fact that credit unions are not required to close out their accounting
records on a quarterly basis, only on a year-end basis.

66 | P a g e
FYE 6/30/2016 FYE 6/30/2017 % Change
NON-INTEREST INCOME:
Fee Income 37,876,987 40,723,983 6.99%
Other Operating Income 31,501,560 35,557,216 11.41%
Gain (Loss) on Investments 52,657 -47,575 210.68%
Gain (Loss) on Non-Trading Derivatives 0 0 N/A
Gain (Loss) on Disposition of Assets -317,709 484,172 165.62%
Gain from Bargain Purchase (Merger) 21,847 17,650 -23.78%
Other Non-Oper Income/(Expense) 812,683 218,970 -271.14%
NCUSIF Stabilization Income 0 0 N/A
TOTAL NON-INTEREST INCOME 69,948,025 76,954,416 9.10%
NON-INTEREST EXPENSE
Total Employee Compensation & Benefits 86,102,003 92,710,320 7.13%
Travel, Conference Expense 1,431,330 1,428,765 -0.18%
Office Occupancy 9,579,246 10,011,613 4.32%
Office Operation Expense 34,069,849 35,389,383 3.73%
Educational and Promotion 4,968,039 5,443,399 8.73%
Loan Servicing Expense 7,284,081 8,215,970 11.34%
Professional, Outside Service 11,996,614 12,436,593 3.54%
Member Insurance N/A N/A N/A
Member Insurance - NCUSIF Premium 3,165 133,922 97.64%
Member Insurance - Temporary Corporate
CU Stabilization Fund
0 0 N/A
Member Insurance - Other 71,309 72,219 1.26%
Operating Fees 1,254,054 1,224,543 -2.41%
Misc Operating Expense 2,742,374 2,917,040 5.99%
TOTAL NON-INTEREST EXPENSE 159,502,064 169,983,767 6.17%
NET INCOME (LOSS) EXCLUDING STABILIZATION
EXPENSE AND NCUSIF PREMIUMS
50,548,650 56,593,977 10.68%
NET INCOME (LOSS) 50,545,485 56,460,055 10.48%
RESERVE TRANSFERS:
Transfer to Regular Reserve 13,952,042 22,541,338 38.10%

67 | P a g e
CREDIT UNION ASSET SIZE
RANGE
# OF CREDIT UNIONS -
CURRENT YEAR
CURRENT YEAR -
TOTAL ASSETS
PERCENTAGE OF
CREDIT UNIONS
IN GROUP
$250,000 OR LESS 1 $50,000 1.18
$250,001 TO $500,000 1 $452,000 1.18
$500,001 TO $1,000,000 1 $984,000 1.18
$1,000,001 TO $5,000,000 11 $25,100,000 12.94
$5,000,001 TO $10,000,000 9 $61,600,000 10.59
$10,000,001 TO $50,000,000 33 $826,700,000 38.80
$50,000,001 TO $100,000,000 12 $830,200,000 14.12
$100,000,001 TO $200,000,000 6 $882,600,000 7.06
$200,000,001 TO $500,000,000 7 $2,280,100,000 8.24
$500,000,001 AND OVER 4 $7,524,900,000 4.71
TOTAL 85 $12,432,686,000 100
84 Without Corporate Credit Union $11,136,700,000
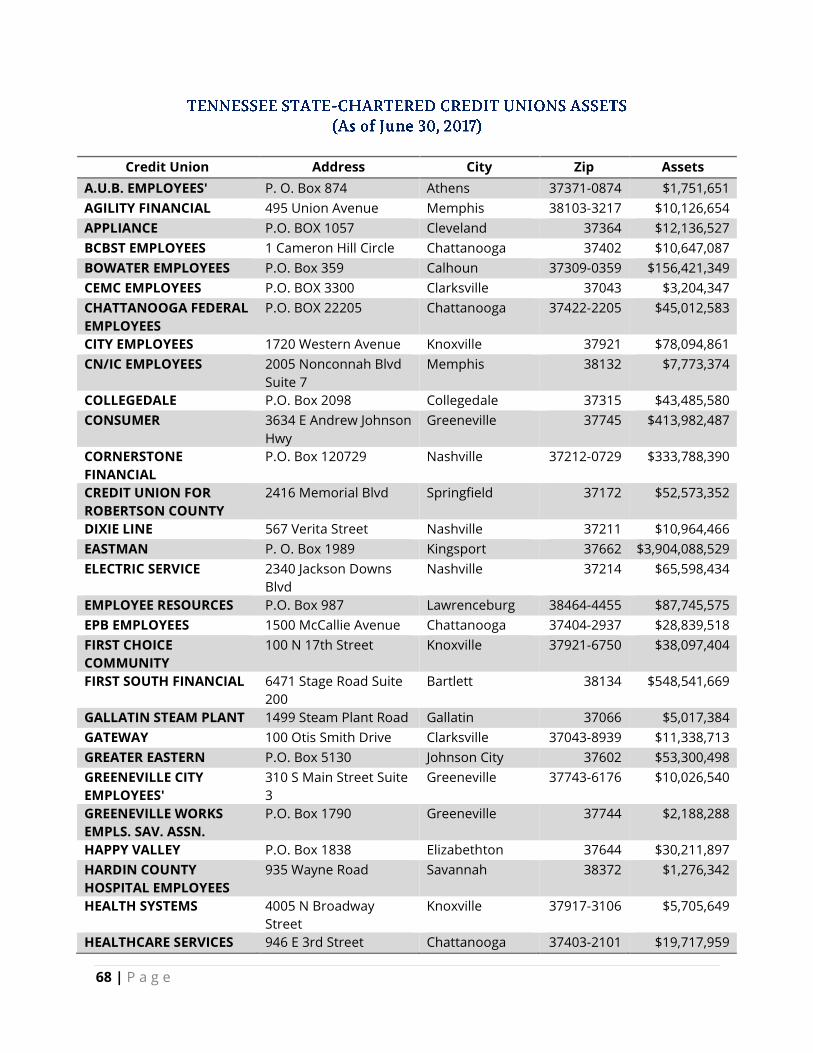
68 | P a g e
Credit Union Address City Zip Assets
A.U.B. EMPLOYEES' P. O. Box 874 Athens 37371-0874 $1,751,651
AGILITY FINANCIAL 495 Union Avenue Memphis 38103-3217 $10,126,654
APPLIANCE P.O. BOX 1057 Cleveland 37364 $12,136,527
BCBST EMPLOYEES 1 Cameron Hill Circle Chattanooga 37402 $10,647,087
BOWATER EMPLOYEES P.O. Box 359 Calhoun 37309-0359 $156,421,349
CEMC EMPLOYEES P.O. BOX 3300 Clarksville 37043 $3,204,347
CHATTANOOGA FEDERAL
EMPLOYEES
P.O. BOX 22205 Chattanooga 37422-2205 $45,012,583
CITY EMPLOYEES 1720 Western Avenue Knoxville 37921 $78,094,861
CN/IC EMPLOYEES 2005 Nonconnah Blvd
Suite 7
Memphis 38132 $7,773,374
COLLEGEDALE P.O. Box 2098 Collegedale 37315 $43,485,580
CONSUMER 3634 E Andrew Johnson
Hwy
Greeneville 37745 $413,982,487
CORNERSTONE
FINANCIAL
P.O. Box 120729 Nashville 37212-0729 $333,788,390
CREDIT UNION FOR
ROBERTSON COUNTY
2416 Memorial Blvd Springfield 37172 $52,573,352
DIXIE LINE 567 Verita Street Nashville 37211 $10,964,466
EASTMAN P. O. Box 1989 Kingsport 37662 $3,904,088,529
ELECTRIC SERVICE 2340 Jackson Downs
Blvd
Nashville 37214 $65,598,434
EMPLOYEE RESOURCES P.O. Box 987 Lawrenceburg 38464-4455 $87,745,575
EPB EMPLOYEES 1500 McCallie Avenue Chattanooga 37404-2937 $28,839,518
FIRST CHOICE
COMMUNITY
100 N 17th Street Knoxville 37921-6750 $38,097,404
FIRST SOUTH FINANCIAL 6471 Stage Road Suite
200
Bartlett 38134 $548,541,669
GALLATIN STEAM PLANT 1499 Steam Plant Road Gallatin 37066 $5,017,384
GATEWAY 100 Otis Smith Drive Clarksville 37043-8939 $11,338,713
GREATER EASTERN P.O. Box 5130 Johnson City 37602 $53,300,498
GREENEVILLE CITY
EMPLOYEES'
310 S Main Street Suite
3
Greeneville 37743-6176 $10,026,540
GREENEVILLE WORKS
EMPLS. SAV. ASSN.
P.O. Box 1790 Greeneville 37744 $2,188,288
HAPPY VALLEY P.O. Box 1838 Elizabethton 37644 $30,211,897
HARDIN COUNTY
HOSPITAL EMPLOYEES
935 Wayne Road Savannah 38372 $1,276,342
HEALTH SYSTEMS 4005 N Broadway
Street
Knoxville 37917-3106 $5,705,649
HEALTHCARE SERVICES 946 E 3rd Street Chattanooga 37403-2101 $19,717,959

69 | P a g e
Credit Union Address City Zip Assets
HERITAGE SOUTH
COMMUNITY
P. O. Box 1219 Shelbyville 37162 $190,131,585
HOLLEY P.O. Box 398 Paris 38242 $54,576,922
HORIZON 1201 N Eastman Road Kingsport 37664-3163 $46,388,589
HURD EMPLOYEES 200 W Church Street Greeneville 37745-3806 $3,201,151
JACK DANIEL EMPLOYEES P.O. Box 199 Lynchburg 37352 $30,988,170
JOHNSONVILLE TVA
EMPLOYEES
209 Highway 641 N Camden 38320 $97,363,581
KIMBERLY CLARK 1520 N 2nd Street Memphis 38107-1004 $111,340,797
KINGSPORT PRESS 528 W Center Street Kingsport 37660 $68,256,514
KINGSTON TVA
EMPLOYEES
714 Swan Pond Road Harriman 37748 $2,234,463
KNOX CO. EMPLOYEES 400 W Main Street
Room 355
Knoxville 37902 $10,024,717
KNOXVILLE TVA
EMPLOYEES
301 Wall Avenue, P.O.
Box 15994
Knoxville 37901 $1,776,363,367
LAKESIDE EMPLS. 1008 Broadway New
Johnsonville
37134 $39,029,739
LANGSTON BAG CO.
EMPLS. SAV. ASSN.
1760 S 3rd Street Memphis 38109-7712 $49,704
LEADERS 87 Murray Guard Drive Jackson 38305 $327,514,319
LIFE 2010 Church St Suite
204
Nashville 37203-2078 $34,864,425
LIFEWAY 1 Lifeway Plaza Nashville 37234-0193 $45,549,449
LOWLAND 622 W 1st North Street Morristown 37814 $95,876,859
M.P.D. COMMUNITY 2711 Old Lebanon
Road
Nashville 37214 $27,570,823
MARYVILLE MUNICIPAL 321 W Broadway
Avenue
Maryville 37801 $15,528,982
MCNAIRY COUNTY
EMPLOYEES
105 N Oak Street, P.O.
Box 867
Adamsville 38310 $1,422,095
MEMORIAL 6800 Longview Road Chattanooga 37421 $7,797,311
MEMPHIS CITY
EMPLOYEES
2608 Avery Avenue Memphis 38112-4821 $276,177,078
METROPOLITAN
TEACHERS
1605 Jefferson Street Nashville 37208 $2,744,899
MID EAST TENNESSEE
COMMUNITY
17640 State Highway
58 N
Decatur 37322 $12,077,072
MOUNTAIN STATES 400 N State of Franklin
Road
Johnson City 37604 $18,978,171
N.G.H. 1818 Albion Street Nashville 37208-2918 $6,492,073
NASHVILLE FIREMEN'S 908 Woodlands Street Nashville 37206 $23,840,880
NASHVILLE POST OFFICE P.O. Box 291233 Nashville 37229 $69,972,099
NEW SOUTH 3261 N Mall Road Knoxville 37924 $55,515,176

70 | P a g e
Credit Union Address City Zip Assets
NORTHEAST
COMMUNITY
980 Jason Witten Way Elizabethton 37643 $116,744,014
O.M.C. EMPLOYEES' P.O. Box 828 Charleston 37310 $27,846,368
OLD HICKORY P.O. Box 431 Old Hickory 37138 $230,576,147
OLIVET BAPTIST 3084 Southern Avenue Memphis 38111-3205 $451,863
P.I.A.S. 305 Plus Park Blvd Nashville 37217 $5,472,158
PATHWAY P.O. Box 2035 Cleveland 37320 $5,348,521
PATRIOT EQUITY 1450 Union University
Drive
Jackson 38305 $29,605,163
SCENIC COMMUNITY 4503 Hixson Pike Hixson 37343 $122,009,939
SKYLINE 3443 Dickerson Pike
#G10
Nashville 37207-2528 $17,240,747
SMART CHOICE 1075 Blythe Ave SE Cleveland 37311-2948 $3,314,650
SMITH & NEPHEW
EMPLOYEES
1450 E Brooks Road Memphis 38116 $8,635,607
SOUTHEAST FINANCIAL 220 South Royal Oaks Franklin 37064 $381,720,724
SOUTHERN P.O. Box 3490 Chattanooga 37404 $22,737,195
ST. THOMAS 4230 Harding Pike Suite
103
Nashville 37205 $26,660,764
TENNESSEE
DEPARTMENT OF SAFETY
1150 Foster Avenue Nashville 37243-4400 $9,372,540
TENNESSEE EMPLOYEES P.O. Box 198617 Nashville 37219-8617 $27,658,693
THE TENNESSEE 1400 8th Avenue South Nashville 37203 $316,335,954
THE WEST TENNESSEE 2521 Fite Road Memphis 38127 $17,491,801
TIMES FREE PRESS 400 E 11th St Chattanooga 37403 $1,919,136
TNCONNECT P.O. Box 52990 Knoxville 37950 $51,281,068
U. S. T. C. EMPLOYEES P.O. Box 331908 Nashville 37203-7510 $1,858,126
UPS EMPLOYEES 1814 E Brooks Road Memphis 38116 $22,171,396
US COMMUNITY P.O. Box 140570 Nashville 37214 $185,924,785
VANDERBILT UNIVERSITY
EMPLOYEES
P.O. Box 128426 Nashville 37212 $40,414,419
VOLUNTEER CORPORATE 2460 Atrium Way Nashville 37214 $1,295,947,898
WCG EMPLOYEES P.O. Box 284 Martin 38237 $983,550
WILLIS 26 Century Blvd Suite 3 Nashville 37214-3683 $19,397,498