annual report of finance lenders, brokers, and pace
TRANSCRIPT

2020
California Department of
Financial Protection and Innovation
Annual Report of Finance Lenders, Brokers,
and PACE Administrators
Licensed Under the California Financing Law
Report Required by Financial Code Section 22160 and 22692
The DFPI staff are reviewing PACE program data after inconsistencies were reported. Updates to the PACE section of the California Financing Law (CFL) Report will be made shortly and a revised report will be posted indicating corrected/revised information.

Lourdes M. Castro Ramírez, Secretary Business, Consumer Services and Housing Agency
Christopher S. Shultz, Acting Commissioner
Department of Financial Protection and Innovation
Edgar L. Gill Jr., Senior Deputy Commissioner
Division of Corporations and Financial Institutions
Mona Elsheikh, Deputy Commissioner
Financial Services
Version 2.0 Published Nov. 16, 2021

TABLE OF CONTENTS
Executive Summary ....................................................................................................... 1
Background .................................................................................................................... 3
Historical Licensing Data ................................................................................................ 4
Analysis of Loans Made by CFL Licensees for the Last 10 Years ................................. 5
Exhibit A - Consolidated Balance Sheet ........................................................................ 6
Exhibit B - Analysis of Loans and Receivables Outstanding .......................................... 7
Exhibit C - Statement of Income and Expenses ............................................................ 8
Exhibit D - Analysis of Income Received ....................................................................... 9
Exhibit E - Loans Made or Refinanced by Size .............................................................. 10
Exhibit F - Loans Made or Refinanced by Type of Security ........................................... 11
Exhibit G - Loans Made or Refinanced by Rate Charged .............................................. 14
Exhibit H - Schedule of Loan Activity by Security Type ................................................. 30
Exhibit I - Default Rates by Security Type and Size of Loan ......................................... 33
Exhibit J - Online Loan Information ................................................................................ 35
Exhibit K - Property Assessed Clean Energy (PACE) Program ..................................... 36

EXECUTIVE SUMMARY
California Department of Financial Protection and Innovation 1
The Department of Financial Protection and Innovation protects consumers and fosters trust by regulating companies and individuals offering financial products. The DFPI licenses and regulates finance lenders, brokers, and Property Assessed Clean Energy (PACE) Program Administrators pursuant to the California Financing Law (CFL).
In this report, the Department of Financial Protection and Innovation (DFPI) has compiled data submitted by finance lenders, brokers, and program administrators licensed under the California Financing Law. The licensees submitted the data pursuant to Financial Code sections 22159(a), 22160, and 22692.
The data collected covers two types of loan categories:
• Consumer loans are intended primarily for personal, family or household purposes, such as
paying utility and medical bills and for the purchase or repair of personal vehicles. The law also treats commercial loans with a principal amount of $5,000 or less as consumer loans and they are reported as such.
• Commercial loans are not intended for personal, family or household purposes.
Consumer and commercial loans are further classified by the type of security used to secure the loan.
Key Findings
• Consumer loans with a principal loan amount of at least $2,500 but less than $10,000 and an Annual Percentage Rate (“APR”) of 100 percent or more originated in 2020 decreased by 99.9 percent, to 36 from 376,645 in 2019. The total principal amount of such consumer loans decreased by 99.9 percent over the same period, to $155,000 from $1.2 billion.
• Consumer loans secured by auto title originated in 2020 decreased by 94.4 percent to 5,994 from 106,070 in 2019. The total principal amount of such consumer loans decreased by 92.6 percent over the same period, to $30.9 million from $415.6 million.
• This report contains the second year of reporting on PACE financing and PACE program administrators.
o PACE program administrators reported gross income of $43,478,875 from PACE program assessment financing in 2020, representing a 30 percent decrease since 2019.
o The total amount of assessment contracts funded by PACE program administrators was $332,517,305, representing a decrease of 8 percent since 2019.
o The total number of PACE assessment contracts funded and originated in 2020 was 10,129, representing an 18 percent decrease since 2019.
o In 2020, the aggregated total fees and other charges assessed to property owners, including interest, was $82,549,973, representing a decrease of 1 percent since 2019.

California Department of Financial Protection and Innovation 2
• The number of consumer loans increased significantly due to a surge in the “buy now, pay later” unsecured consumer loans reported to the DFPI. This product growing dramatically in volume and becoming a larger percentage of the DFPI’s portfolio under CFL.
o Finance lenders originated almost 12 million consumer loans in 2020, a 530.2 percent increase over 2019. The total principal amount of loans made in 2020 increased by 96.8 percent in comparison to 2019 (from $57 billion to $112.2 billion).
o The top six buy now pay later lenders accounted for 10,924,547, or 91 percent, of the total consumer loans originated in 2020.
o Excluding buy now pay later loans from the total number of consumer loans originated, unsecured loans accounted for 60.8 percent of the total number of consumer loans made in 2020 compared with 77.3 percent in 2019.
o The total number of consumer loans originated by finance lenders, excluding loans made by buy now pay later lenders, decreased overall by 41.1 percent to 1,005,094 from 1,707,651 in 2019. However, the total principal amount of such consumer loans increased by 94.8 percent over the same period, to $111 billion from $57 billion.
• Setting aside the buy now pay later loans, the total aggregate principal amount of consumer loans increased mainly due to the increase in originations of consumer loans secured by real estate.
o The number of consumer loans secured by real estate originated in 2020 increased by 117.2 percent to 261,777 from 120,519 in 2019. The total principal amount of such consumer loans increased by 113.8 percent over the same period, to $101 billion from $47.3 billion.
Other Findings • Consumer loans with principal loan amount under $2,500 accounted for 94.7 percent of the
total number of consumer loans made in 2020. Unsecured consumer loans made up 99.8 percent of loans with principal amount of less than $2,500.
• The number of commercial loans originated in 2020 decreased by 21.99 percent to 706,228 from 905,341 in 2019. The total principal amount of commercial loans decreased by 13.9 percent over the same period, to $160.4 billion from $186.4 billion.
• The number of online consumer loans originated in 2020 increased by 1,589 percent to 11,226,399 from 664,488 in 2019. The total principal amount of online loans increased by 24.18 percent over the same period, to $14.5 billion from $11.7 billion.
• The number of online commercial loans originated in 2020 increased by 23.18 percent to 36,016 from 29,239 in 2019. The total principal amount of online loans increased by 14.19 percent over the same period, to $2.4 billion from $2.1 billion.
California Department of Financial Protection and Innovation 3
BACKGROUND
The California Financing Law (Financial Code, § 22000, et seq.) (CFL) requires the licensing and regulation of finance lenders, brokers, or program administrators.
Effective January 1, 2020, Assembly Bill 539 (Limón, stats. 2019, ch. 708) enacted the Fair Access to Credit Act (the Act). The Act makes changes to permissible rates of charges: For any consumer loan of a bona fide principal amount of at least $2,500 but less than $10,000 (including commercial loans of $2,500 to $5,000), a finance lender may not contract for or receive charges at a rate exceeding annual simple interest of 36 percent plus the Federal Funds Rate. Prior to the Act, the CFL only limited the interest rates on consumer loans under $2,500.
The COVID-19 pandemic state of emergency was officially declared by state and federal agencies in March 2020, three months after the new law took effect, and dramatically altered the financial services landscape. A myriad of factors, including government assistance in the form of cash payments, expanded unemployment benefits and loan forbearances, likely had a significant impact on demand for loans and other consumer financial habits.
Financial Code section 22159(a) requires licensees to file with the DFPI Commissioner annual reports that provide information related to their lending activities under the program.
The DFPI is required to post a report every year on its website summarizing utilization of its Pilot Program pursuant to Financial Code section 22160.
This report contains unaudited data provided by licensees for the calendar year ending December 31, 2020. The report does not capture all consumer loans in the state, and does not include small- dollar loans made through bank partnerships, for instance.
As of December 31, 2020, the DFPI licensed 3,886 lenders, brokers, lenders and brokers, and PACE program administrators. Of the 3,886 licensees, 3,760 filed their required annual reports. All five PACE program administrators filed their annual reports. The DFPI notified the non-filers of its intent to revoke their licenses.
Data obtained from a small number of licensees who filed annual reports after the aggregate report was compiled is not included. This omission does not materially affect the integrity of the data reported in this composite report.
Due to rounding, numbers presented throughout this report may not add up precisely to the totals provided, and percentages may not precisely reflect the absolute figures.
This report and prior years’ reports can be found on the DFPI’s website at https://dfpi.ca.gov/ california-financing-law-publications/.

California Department of Financial Protection and Innovation 4
HISTORICAL LICENSING DATA
The table below shows the number of California Financing Law (CFL) licensees (including branches) at the end of each calendar year, and the number of license applications the DFPI received each year for the last 10 years.
Table 1: Licensing Data
Year
Number of Licensed
Companies
Number of Licensed Locations
Number of Applications for New
Licenses
2020 3,886 7,194 1,491 2019 3,616 7,392 1,406 2018 3,493 7,262 1,503 2017 3,200 6,776 1,398 2016 2,963 6,521 1,517 2015 2,580 6,369 1,358 2014 2,185 5,018 1,254 2013 2,155 4,776 1,191 2012 2,056 4,385 889 2011 2,026 4,302 910

California Department of Financial Protection and Innovation 5
ANALYSIS OF LOANS MADE BY CFL LICENSEES FOR THE LAST 10 YEARS
Table 2: Loan Details
Average Size of Loans Made
Year Number of Loans
Principal Amount of Consumer
Loans Commercial
Loans All Loans
*Variances from data published in the annual report due to late filings by licensees.
Made Loans Made
2020 12,635,869 $ 272,580,616,643 $ 9,402 $ 227,144 $ 21,572
2019* 2,809,749 $ 247,762,782,335 $ 30,188 $ 209,067 $ 88,180
2018* 2,471,685 $ 220,137,537,748 $ 21,139 $ 218,588 $ 89,064
2017* 2,455,012 $ 194,240,527,082 $ 25,084 $ 161,799 $ 79,120
2016* 2,458,476 $ 226,677,922,016 $ 27,971 $ 188,155 $ 92,203
2015 3,271,710 $ 232,654,056,610 $ 24,472 $ 105,661 $ 71,111
2014 2,711,495 $ 217,151,868,159 $ 20,674 $ 121,161 $ 80,086
2013 2,171,948 $ 174,302,457,184 $ 43,521 $ 106,650 $ 80,252
2012 1,876,767 $ 165,639,476,215 $ 60,110 $ 108,137 $ 88,258
2011 3,076,347 $ 139,166,897,599 $ 36,097 $ 47,604 $ 45,238

California Department of Financial Protection and Innovation 6
Exhibit A California Financing Law Licensees
Consolidated Balance Sheet As of December 31, 2020
($ in thousands)
ASSETS % of Total
Assets
Cash $ 117,442,991 3.89 Investments 335,198,593 11.10 California Finance Lenders Loan Receivables 169,063,940 5.60 Other Receivables 1,193,981,260 39.52 Reserves and Withholds by Banks and Finance Companies 6,070,403 0.20 Real and Personal Property (Net) 152,800,879 5.06 Prepaid Expenses and Deferred Charges 7,120,541 0.24 Commissions Receivables 2,137,590 0.07 Other Assets 1,037,184,133 34.33
$ 3,021,000,329 100.00
LIABILITIES AND NET WORTH % of Total Liabilities
and Net Worth
Loans and Notes Payable from Third Parties $ 605,895,702 20.06 Loans and Notes Payable from Parent Companies, Affiliates, etc. 396,839,834 13.14 Bonds, Debentures, and Certificates of Indebtedness 486,035,955 16.09 Accounts Payable 167,928,775 5.56 Dealers’ Reserves and Withholds 1,422,492 0.05 Accrued Taxes Other Than Income Tax 2,183,353 0.07 Reserve for Income Taxes 30,926,020 1.02 Credit Insurance Premiums Due Insurer 303,982 0.01
Total Assets

California Department of Financial Protection and Innovation 7
Exhibit B California Finance Lenders
Analysis of Loans and Receivables Outstanding As of December 31, 2020
($ in thousands)
CALIFORNIA FINANCE LENDERS LOAN RECEIVABLES
Consumer Loans Commercial Loans
Subtotal $ 173,878,780 100.00 Less: Unearned Pre-computed Charges 834,920
3,979,338 Allowance for Bad Debts Net California Finance Lenders Loan Receivables $ 169,064,522
OTHER RECEIVABLES
Sales Contracts $ 360,239,039 29.22 Leases (True Leases) 151,074,813 12.25 Factoring 6,444,386 0.52 Other 715,219,090 58.01
Subtotal $ 1,232,977,328 100.00 Less: Unearned Pre-computed Charges 15,625,416
23,370,652 Allowance for Bad Debts Net California Finance Lenders Loan Receivables $ 1,193,981,260
$
Aggregate Balance
% of Subtotal
49,834,842 124,043,938
28.66 71.34

California Department of Financial Protection and Innovation 8
Exhibit C California Financing Law Licensees
100.00
1.54 0.25 0.13 0.34 0.67 3.37
10.60 0.49 8.16 0.29 0.16 1.45
44.54
72.00
28.00
6.68 2.17
19.15 0.94
18.21
Statement of Income and Expenses Calendar Year 2020
($ in thousands)
INCOME
Gross Income of California Financing Law Licensees from Loans Made and Brokered Loans
$ 19,013,024
Gross Income from All Other Businesses and Sources 369,174,497 Total Gross Income $ 388,187,521
EXPENSES
$ 5,991,763 988,310 494,905
1,320,256 2,595,738
13,092,138 41,162,317 1,887,664
31,681,910 1,112,407
639,012 5,614,275
172,914,814
Loss on Loans Receivable Professional Audit and Accounting Services Insurance and Bond Premiums Legal Services and Expenses Occupancy Expenses Provision for Bad Debt Allowance Salaries and Bonuses: Employees Salaries and Bonuses: Owners, Partners, Executives Depreciation License Fees and Taxes Telephone and Utilities Advertising and Promotions Other Expenses
Total Expenses Before Interest and Income Taxes $ 279,495,509
Income or Loss Before Interest and Income Taxes $ 108,692,012
Less: Interest Paid to Bona Fide Third Parties 25,934,255 8,428,364 Interest Paid to Parent Company, Affiliates and Others
Income or Loss Before Income Taxes $ 74,329,393 Less: Provision for Income Taxes 3,635,453
Net Income or (Loss) $ 70,693,940
% of Total
Income
4.90
95.10
California Department of Financial Protection and Innovation 9
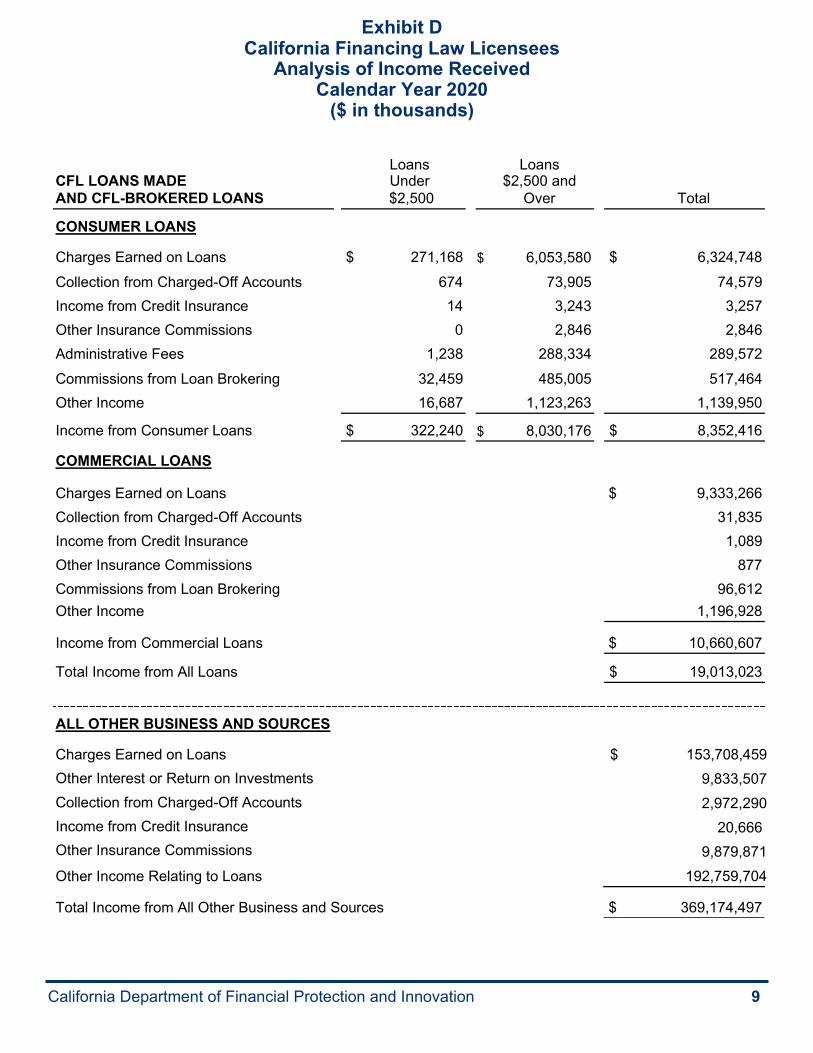
Exhibit D California Financing Law Licensees
Analysis of Income Received Calendar Year 2020
($ in thousands)
Loans Loans CFL LOANS MADE Under $2,500 and AND CFL-BROKERED LOANS $2,500 Over Total
CONSUMER LOANS
Charges Earned on Loans $ 271,168 $ 6,053,580 $ 6,324,748 Collection from Charged-Off Accounts 674 73,905 74,579 Income from Credit Insurance 14 3,243 3,257 Other Insurance Commissions 0 2,846 2,846 Administrative Fees 1,238 288,334 289,572 Commissions from Loan Brokering 32,459 485,005 517,464 Other Income 16,687 1,123,263 1,139,950
Income from Consumer Loans $ 322,240 $ 8,030,176 $ 8,352,416
COMMERCIAL LOANS
Charges Earned on Loans $ 9,333,266 Collection from Charged-Off Accounts 31,835 Income from Credit Insurance 1,089 Other Insurance Commissions 877 Commissions from Loan Brokering 96,612 Other Income 1,196,928
Income from Commercial Loans $ 10,660,607
Total Income from All Loans $ 19,013,023
ALL OTHER BUSINESS AND SOURCES
Charges Earned on Loans $ 153,708,459 Other Interest or Return on Investments 9,833,507 Collection from Charged-Off Accounts 2,972,290 Income from Credit Insurance 20,666 Other Insurance Commissions 9,879,871 Other Income Relating to Loans 192,759,704
Total Income from All Other Business and Sources $ 369,174,497

California Department of Financial Protection and Innovation 10
Exhibit E California Finance Lenders Loans
Made or Refinanced by Size Calendar Year 2020
($ in thousands)
Size of Loans Number of
Loans % of Total Number Principal Amount
% of Total Amount
CONSUMER LOANS
$ 499 or less 11,021,521 92.39 $ 1,142,677 1.02 500 to 1,999 259,225 2.17 195,805 0.17
2,000 to 2,499 13,477 0.11 29,673 0.03 2,500 to 4,999 110,131 0.92 380,328 0.34 5,000 to 9,999 139,638 1.17 996,845 0.89
10,000 or more 385,649 3.23 109,419,563 97.55
Total Consumer Loans Made 11,929,641 100.00 $ 112,164,891 100.00
COMMERCIAL LOANS
$5,000 or more 706,228 100.00 $ 160,415,726 100.00
Total Commercial Loans Made 706,228 100.00 $ 160,415,726 100.00
Total Loans Made, All Categories 12,635,869 $ 272,580,617

California Department of Financial Protection and Innovation 11
Exhibit F California Finance Lenders
Loans Made or Refinanced by Type of Security Calendar Year 2020
($ in thousands)
Type of Security Number of
Loans % of Total Number
Principal Amount
% of Total Amount
CONSUMER LOANS
LOANS UNDER $2,500
Unsecured 11,271,385 99.80 $ 1,345,790 98.37 Personal Property 887 0.01 1,406 0.10 Automobiles & Other Motor Vehicles 146 0.00 264 0.02 Auto Title Loans 67 0.00 107 0.01 Wage Assignments 66 0.00 150 0.01 Other Security 21,672 0.19 20,437 1.49
Total Loans Made 11,294,223 100.00 $ 1,368,154 100.00
LOANS OF $2,500 TO $4,999
Unsecured 93,381 84.79 $ 319,038 83.88 Personal Property 2,291 2.08 8,425 2.22 Automobiles & Other Motor Vehicles 4,726 4.29 18,466 4.86 Auto Title Loans 3,557 3.23 11,369 2.99 Wage Assignments 0 0.00 0 0.00 Other Security 6,176 5.61 23,031 6.06
Total Loans Made 110,131 100.00 $ 380,328 100.00
LOANS OF $5,000 TO $9,999
Unsecured 115,867 82.98 $ 822,744 82.53 Personal Property 2,381 1.71 15,868 1.59 Automobiles & Other Motor Vehicles 19,090 13.67 142,545 14.30 Auto Title Loans 1,973 1.41 13,281 1.33 Wage Assignments 0 0.00 0 0.00 Real Property 202 0.14 1,525 0.15 Other Security 125 0.09 883 0.09
Total Loans Made 139,638 100.00 $ 996,846 100.00
LOANS OF $10,000 AND MORE
Unsecured 54,483 14.13 $ 5,514,547 5.04 Personal Property 22,399 5.81 1,447,260 1.32 Automobiles & Other Motor Vehicles 42,679 11.07 969,105 0.89 Auto Title Loans 397 0.10 6,161 0.01 Wage Assignments 0 0.00 0 0.00 Real Property 261,575 67.83 101,040,364 92.34 Other Security 4,116 1.07 442,126 0.40
Total Loans Made 385,649 100.00 $ 109,419,563 100.00
Total Consumer Loans Made 11,929,641 $ 112,164,893

California Department of Financial Protection and Innovation 12
Exhibit F (continued) California Finance Lenders
Loans Made or Refinanced by Type of Security Calendar Year 2020 ($ in thousands)
Type of Security Number of
Loans % of Total Number
Principal Amount
% of Total Amount
ALL CONSUMER LOANS
Unsecured 11,535,116 96.69 $ 8,002,120 7.13 Personal Property 27,958 0.23 1,472,959 1.31 Automobiles & Other Motor Vehicles 66,641 0.56 1,130,380 1.01 Auto Title Loans 5,994 0.05 30,918 0.03 Wage Assignments 66 0.00 150 0.00 Real Property 261,777 2.19 101,041,889 90.08 Other Security 32,089 0.27 486,477 0.43
Total Consumer Loans Made 11,929,641 100.00 $ 112,164,893 100.00

California Department of Financial Protection and Innovation 13
Exhibit F (continued) California Finance Lenders
Loans Made or Refinanced by Type of Security Calendar Year 2020 ($ in thousands)
Type of Security Number of
Loans % of Total Number
Principal Amount
% of Total Amount
COMMERCIAL LOANS
Unsecured 61,015 8.64 $ 6,306,529 3.93 Personal Property 3,465 0.49 2,009,186 1.25 Automobiles & Other Motor Vehicles 528,333 74.81 41,881,984 26.11 Business Equipment 28,307 4.01 9,401,307 5.86 Real Property 26,807 3.80 74,023,118 46.14 Other Security 58,301 8.26 26,793,603 16.70
Total Commercial Loans Made 706,228 100.00 $ 160,415,727 100.00
Total Loans Made, All Categories 12,635,869 $ 272,580,620

California Department of Financial Protection and Innovation 14
Exhibit G California Finance Lenders
Loans Made or Refinanced by Rate Charged Calendar Year 2020
($ in thousands)
Rate Charged Number of
Loans % of Total Number
Principal Amount
% of Total Amount
CONSUMER LOANS
LOANS UNDER $2,500
Step Rate: 2.5, 2, 1.5, 1% per month 115,016 $ 33,155
Alternate Rate: 1.6% per month 56 75 Federal Reserve Bank Rate plus 10% 0 0
Other Rates: Up to 14.999 APR 10,951,228 96.96 $ 1,173,187 85.75 15.000 to 19.999 APR 51,825 0.46 34,548 2.53 20.000 to 24.999 APR 30,551 0.27 14,213 1.04 25.000 to 29.999 APR 1,014 0.01 963 0.07 30.000 to 34.999 APR 82,561 0.73 20,781 1.52 35.000 to 39.999 APR 59,567 0.53 58,652 4.29 40.000 to 69.999 APR 94,546 0.84 59,186 4.33 70.000 to 99.999 APR 19,193 0.17 5,353 0.39 100.000 or More APR 3,614 0.03 983 0.07 Variable Rate 124 0.00 289 0.02
Total Loans Made 11,294,223 100.00 $ 1,368,155 100.00
LOANS OF $2,500 TO $4,999
Up to 14.999 APR 3,185 2.89 $ 11,266 2.96 15.000 to 19.999 APR 4,366 3.96 15,753 4.14 20.000 to 24.999 APR 1,678 1.52 6,035 1.59 25.000 to 29.999 APR 4,587 4.17 16,950 4.46 30.000 to 34.999 APR 12,622 11.46 41,106 10.81 35.000 to 39.999 APR 81,807 74.28 283,288 74.49 40.000 to 69.999 APR 1,821 1.65 5,734 1.51 70.000 to 99.999 APR 49 0.04 148 0.04 100.000 or More APR 15 0.01 45 0.01 Variable Rate 1 0.00 3 0.00
Total Loans Made 110,131 100.00 $ 380,328 100.00

California Department of Financial Protection and Innovation 15
Exhibit G (continued) California Finance Lenders
Loans Made or Refinanced by Rate Charged Calendar Year 2020
($ in thousands)
Rate Charged Number of
Loans % of Total Number
Principal Amount
% of Total Amount
CONSUMER LOANS
LOANS OF $5,000 TO $9,999
Up to 14.999 APR 3,334 2.39 $ 23,492 2.36 15.000 to 19.999 APR 1,330 0.95 9,402 0.94 20.000 to 24.999 APR 4,372 3.13 33,262 3.34 25.000 to 29.999 APR 9,852 7.06 78,359 7.86 30.000 to 34.999 APR 38,412 27.51 295,298 29.62 35.000 to 39.999 APR 82,196 58.86 556,115 55.79 40.000 to 69.999 APR 19 0.01 122 0.01 70.000 to 99.999 APR 62 0.04 388 0.04 100.000 or More APR 21 0.02 110 0.01 Variable Rate 40 0.03 298 0.03
Total Loans Made 139,638 100.00 $ 996,846 100.00
LOANS OF $10,000 AND MORE
Up to 14.999 APR 332,840 86.31 $ 107,393,236 98.15 15.000 to 19.999 APR 7,134 1.85 153,612 0.14 20.000 to 24.999 APR 11,395 2.95 189,017 0.17 25.000 to 29.999 APR 6,203 1.61 81,963 0.07 30.000 to 34.999 APR 6,111 1.58 84,100 0.08 35.000 to 39.999 APR 17,268 4.48 221,847 0.20 40.000 to 69.999 APR 119 0.03 1,948 0.00 70.000 to 99.999 APR 755 0.20 8,723 0.01 100.000 or More APR 1,759 0.46 652,776 0.60 Variable Rate 2,065 0.54 632,339 0.58
Total Loans Made 385,649 100.00 $ 109,419,561 100.00
Total Consumer Loans Made 11,929,641 $ 112,164,890

California Department of Financial Protection and Innovation 16
Exhibit G (continued) California Finance Lenders
Loans Made or Refinanced by Rate Charged Calendar Year 2020
($ in thousands)
Number of Loans
% of Total Number
Principal Amount
% of Total Amount Rate Charged
COMMERCIAL LOANS
Up to 14.999 APR 623,648 88.31 $ 129,582,767 80.78 15.000 to 19.999 APR 36,785 5.21 1,736,479 1.08 20.000 to 24.999 APR 3,467 0.49 394,623 0.25 25.000 to 29.999 APR 4,690 0.66 299,726 0.19 30.000 to 34.999 APR 1,767 0.25 177,112 0.11 35.000 to 39.999 APR 1,370 0.19 84,914 0.05 40.000 to 69.999 APR 5,213 0.74 218,119 0.14 70.000 to 99.999 APR 3,032 0.43 138,636 0.09 100.000 or More APR 6,868 0.97 1,183,531 0.74 Variable Rate 19,388 2.75 26,599,819 16.58
Total Commercial Loans Made 706,228 100.00 $ 160,415,726 100.00
Total Loans Made, All Categories 12,635,869 $ 272,580,616

California Department of Financial Protection and Innovation 17
Exhibit G (continued) California Finance Lenders
Loans Made or Refinanced by Rate Charged Calendar Year 2020
($ in thousands)
Number of Loans
% of Total Number
Principal Amount
% of Total Amount Rate Charged
CONSUMER LOANS - UNSECURED
LOANS UNDER $2,500
Step Rate: 2.5, 2, 1.5, 1% per month 115,004 $ 33,134
Alternate Rate: 1.6% per month 53 74 Federal Reserve Bank Rate plus 10% 0 0
Other Rates: Up to 14.999 APR 10,947,030 97.12 $ 1,168,716 86.84 15.000 to 19.999 APR 34,043 0.30 18,140 1.35 20.000 to 24.999 APR 29,858 0.26 13,073 0.97 25.000 to 29.999 APR 997 0.01 937 0.07 30.000 to 34.999 APR 82,549 0.73 20,766 1.54 35.000 to 39.999 APR 59,556 0.53 58,637 4.36 40.000 to 69.999 APR 94,545 0.84 59,185 4.40 70.000 to 99.999 APR 19,193 0.17 5,353 0.40 100.000 or More APR 3,614 0.03 983 0.07 Variable Rate 0 0.00 0 0.00
Total Loans Made 11,271,385 100.00 $ 1,345,790 100.00
LOANS OF $2,500 TO $4,999
Up to 14.999 APR 1,877 2.01 $ 6,482 2.03 15.000 to 19.999 APR 1,401 1.50 4,622 1.45 20.000 to 24.999 APR 766 0.82 2,678 0.84 25.000 to 29.999 APR 1,797 1.92 6,417 2.01 30.000 to 34.999 APR 11,037 11.82 35,061 10.99 35.000 to 39.999 APR 74,745 80.04 258,228 80.94 40.000 to 69.999 APR 1,750 1.87 5,528 1.73 70.000 to 99.999 APR 5 0.01 15 0.00 100.000 or More APR 2 0.00 5 0.00 Variable Rate 1 0.00 3 0.00
Total Loans Made 93,381 100.00 $ 319,039 100.00

California Department of Financial Protection and Innovation 18
Exhibit G (continued) California Finance Lenders
Loans Made or Refinanced by Rate Charged Calendar Year 2020
($ in thousands)
Number of Loans
% of Total Number
Principal Amount
% of Total Amount Rate Charged
CONSUMER LOANS - UNSECURED
LOANS OF $5,000 TO $9,999
Up to 14.999 APR 2,445 2.11 $ 17,216 2.09 15.000 to 19.999 APR 907 0.78 6,060 0.74 20.000 to 24.999 APR 968 0.84 6,768 0.82 25.000 to 29.999 APR 6,992 6.03 57,160 6.95 30.000 to 34.999 APR 33,631 29.03 260,081 31.61 35.000 to 39.999 APR 70,868 61.16 475,096 57.75 40.000 to 69.999 APR 3 0.00 18 0.00 70.000 to 99.999 APR 2 0.00 10 0.00 100.000 or More APR 17 0.01 88 0.01 Variable Rate 34 0.03 247 0.03
Total Loans Made 115,867 100.00 $ 822,744 100.00
LOANS OF $10,000 AND MORE
Up to 14.999 APR 36,710 67.38 $ 5,171,164 93.77 15.000 to 19.999 APR 1,374 2.52 35,287 0.64 20.000 to 24.999 APR 850 1.56 12,399 0.22 25.000 to 29.999 APR 2,645 4.85 27,897 0.51 30.000 to 34.999 APR 1,264 2.32 15,802 0.29 35.000 to 39.999 APR 10,074 18.49 125,821 2.28 40.000 to 69.999 APR 1 0.00 10 0.00 70.000 to 99.999 APR 689 1.26 7,892 0.14 100.000 or More APR 100 0.18 1,010 0.02 Variable Rate 776 1.42 117,265 2.13
Total Loans Made 54,483 100.00 $ 5,514,547 100.00
Total Unsecured Consumer Loans Made 11,535,116 $ 8,002,120

California Department of Financial Protection and Innovation 19
Exhibit G (continued) California Finance Lenders
Loans Made or Refinanced by Rate Charged Calendar Year 2020
($ in thousands)
Number of Loans
% of Total Number
Principal Amount
% of Total Amount Rate Charged
CONSUMER LOANS - PERSONAL PROPERTY (HOUSEHOLD ITEMS)
LOANS UNDER $2,500
Step Rate: 2.5, 2, 1.5, 1% per month 0 $ 0
Alternate Rate: 1.6% per month 0 0 Federal Reserve Bank Rate plus 10% 0 0
Other Rates: Up to 14.999 APR 234 26.38 $ 374 26.60 15.000 to 19.999 APR 95 10.71 143 10.17 20.000 to 24.999 APR 554 62.46 883 62.80 25.000 to 29.999 APR 4 0.45 6 0.43 30.000 to 34.999 APR 0 0.00 0 0.00 35.000 to 39.999 APR 0 0.00 0 0.00 40.000 to 69.999 APR 0 0.00 0 0.00 70.000 to 99.999 APR 0 0.00 0 0.00 100.000 or More APR 0 0.00 0 0.00 Variable Rate 0 0.00 0 0.00
Total Loans Made 887 100.00 $ 1,406 100.00
LOANS OF $2,500 TO $4,999
Up to 14.999 APR 207 9.04 $ 748 8.88 15.000 to 19.999 APR 63 2.75 235 2.79 20.000 to 24.999 APR 525 22.92 1,854 22.01 25.000 to 29.999 APR 59 2.58 226 2.68 30.000 to 34.999 APR 275 12.00 1,008 11.96 35.000 to 39.999 APR 1,162 50.72 4,354 51.68 40.000 to 69.999 APR 0 0.00 0 0.00 70.000 to 99.999 APR 0 0.00 0 0.00 100.000 or More APR 0 0.00 0 0.00 Variable Rate 0 0.00 0 0.00
Total Loans Made 2,291 100.00 $ 8,425 100.00

Exhibit G (continued) California Finance Lenders
Loans Made or Refinanced by Rate Charged Calendar Year 2020
($ in thousands)
Number of Loans
% of Total Number
Principal Amount
% of Total Amount Rate Charged
California Department of Financial Protection and Innovation 20
CONSUMER LOANS - PERSONAL PROPERTY (HOUSEHOLD ITEMS)
LOANS OF $5,000 TO $9,999
Up to 14.999 APR 332 13.94 $ 2,138 13.47 15.000 to 19.999 APR 3 0.13 23 0.14 20.000 to 24.999 APR 242 10.16 1,636 10.31 25.000 to 29.999 APR 52 2.18 340 2.14 30.000 to 34.999 APR 340 14.28 2,260 14.24 35.000 to 39.999 APR 1,412 59.30 9,471 59.69 40.000 to 69.999 APR 0 0.00 0 0.00 70.000 to 99.999 APR 0 0.00 0 0.00 100.000 or More APR 0 0.00 0 0.00 Variable Rate 0 0.00 0 0.00
Total Loans Made 2,381 100.00 $ 15,868 100.00
LOANS OF $10,000 AND MORE
Up to 14.999 APR 20,629 92.10 $ 794,549 54.90 15.000 to 19.999 APR 22 0.10 1,683 0.12 20.000 to 24.999 APR 45 0.20 787 0.05 25.000 to 29.999 APR 24 0.11 580 0.04 30.000 to 34.999 APR 7 0.03 76 0.01 35.000 to 39.999 APR 25 0.11 280 0.02 40.000 to 69.999 APR 4 0.02 213 0.01 70.000 to 99.999 APR 0 0.00 0 0.00 100.000 or More APR 1,643 7.34 649,093 44.85 Variable Rate 0 0.00 0 0.00
Total Loans Made 22,399 100.00 $ 1,447,261 100.00
Total Personal Property Consumer Loans Made 27,958 $ 1,472,960

California Department of Financial Protection and Innovation 21
Exhibit G (continued) California Finance Lenders
Loans Made or Refinanced by Rate Charged Calendar Year 2020
($ in thousands)
Number of Loans
% of Total Number
Principal Amount
% of Total Amount Rate Charged
CONSUMER LOANS - AUTOMOBILES AND OTHER MOTOR VEHICLES
LOANS UNDER $2,500
Step Rate: 2.5, 2, 1.5, 1% per month 0 $ 0
Alternate Rate: 1.6% per month 0 0 Federal Reserve Bank Rate plus 10% 0 0
Other Rates: Up to 14.999 APR 10 6.85 $ 19 7.20 15.000 to 19.999 APR 9 6.16 17 6.44 20.000 to 24.999 APR 118 80.82 214 81.06 25.000 to 29.999 APR 3 2.05 5 1.89 30.000 to 34.999 APR 3 2.05 6 2.27 35.000 to 39.999 APR 2 1.37 3 1.14 40.000 to 69.999 APR 1 0.68 0 0.00 70.000 to 99.999 APR 0 0.00 0 0.00 100.000 or More APR 0 0.00 0 0.00 Variable Rate 0 0.00 0 0.00
Total Loans Made 146 100.00 $ 264 100.00
LOANS OF $2,500 TO $4,999
Up to 14.999 APR 18 0.38 $ 66 0.36 15.000 to 19.999 APR 47 0.99 183 0.99 20.000 to 24.999 APR 319 6.75 1,241 6.72 25.000 to 29.999 APR 526 11.13 2,103 11.39 30.000 to 34.999 APR 1,270 26.87 4,899 26.53 35.000 to 39.999 APR 2,543 53.81 9,963 53.95 40.000 to 69.999 APR 3 0.06 11 0.06 70.000 to 99.999 APR 0 0.00 0 0.00 100.000 or More APR 0 0.00 0 0.00 Variable Rate 0 0.00 0 0.00
Total Loans Made 4,726 100.00 $ 18,466 100.00

California Department of Financial Protection and Innovation 22
Exhibit G (continued) California Finance Lenders
Loans Made or Refinanced by Rate Charged Calendar Year 2020
($ in thousands)
Number of Loans
% of Total Number
Principal Amount
% of Total Amount Rate Charged
CONSUMER LOANS - AUTOMOBILES AND OTHER MOTOR VEHICLES
LOANS OF $5,000 TO $9,999
Up to 14.999 APR 317 1.66 $ 2,366 1.66 15.000 to 19.999 APR 408 2.14 3,241 2.27 20.000 to 24.999 APR 3,128 16.39 24,642 17.29 25.000 to 29.999 APR 2,790 14.61 20,731 14.54 30.000 to 34.999 APR 4,383 22.96 32,561 22.84 35.000 to 39.999 APR 8,064 42.24 59,003 41.39 40.000 to 69.999 APR 0 0.00 0 0.00 70.000 to 99.999 APR 0 0.00 0 0.00 100.000 or More APR 0 0.00 0 0.00 Variable Rate 0 0.00 0 0.00
Total Loans Made 19,090 100.00 $ 142,544 100.00
LOANS OF $10,000 AND MORE
Up to 14.999 APR 11,201 26.24 $ 467,969 48.29 15.000 to 19.999 APR 5,719 13.40 113,483 11.71 20.000 to 24.999 APR 10,474 24.54 173,896 17.94 25.000 to 29.999 APR 3,519 8.25 53,111 5.48 30.000 to 34.999 APR 4,747 11.12 66,735 6.89 35.000 to 39.999 APR 7,019 16.45 93,911 9.69 40.000 to 69.999 APR 0 0.00 0 0.00 70.000 to 99.999 APR 0 0.00 0 0.00 100.000 or More APR 0 0.00 0 0.00 Variable Rate 0 0.00 0 0.00
Total Loans Made 42,679 100.00 $ 969,105 100.00
Total Automobiles & Other Motor Vehicles Consumer Loans Made 66,641 $ 1,130,379

California Department of Financial Protection and Innovation 23
Exhibit G (continued) California Finance Lenders
Loans Made or Refinanced by Rate Charged Calendar Year 2020
($ in thousands)
Rate Charged Number of
Loans % of Total Number
Principal Amount
% of Total Amount
CONSUMER LOANS - AUTO TITLE LOANS
LOANS UNDER $2,500
Step Rate: 2.5, 2, 1.5, 1% per month 0 $ 0
Alternate Rate: 1.6% per month 0 0 Federal Reserve Bank Rate plus 10% 0 0
Other Rates: Up to 14.999 APR 20 29.85 $ 31 29.25 15.000 to 19.999 APR 2 2.99 4 3.77 20.000 to 24.999 APR 17 25.37 36 33.96 25.000 to 29.999 APR 10 14.93 14 13.21 30.000 to 34.999 APR 9 13.43 9 8.49 35.000 to 39.999 APR 9 13.43 12 11.32 40.000 to 69.999 APR 0 0.00 0 0.00 70.000 to 99.999 APR 0 0.00 0 0.00 100.000 or More APR 0 0.00 0 0.00 Variable Rate 0 0.00 0 0.00
Total Loans Made 67 100.00 $ 106 100.00
LOANS OF $2,500 TO $4,999
Up to 14.999 APR 11 0.31 $ 36 0.32 15.000 to 19.999 APR 7 0.20 22 0.19 20.000 to 24.999 APR 40 1.12 153 1.35 25.000 to 29.999 APR 7 0.20 25 0.22 30.000 to 34.999 APR 32 0.90 107 0.94 35.000 to 39.999 APR 3,335 93.76 10,659 93.75 40.000 to 69.999 APR 68 1.91 194 1.71 70.000 to 99.999 APR 44 1.24 133 1.17 100.000 or More APR 13 0.37 40 0.35 Variable Rate 0 0.00 0 0.00
Total Loans Made 3,557 100.00 $ 11,369 100.00

California Department of Financial Protection and Innovation 24
Exhibit G (continued) California Finance Lenders
Loans Made or Refinanced by Rate Charged Calendar Year 2020
($ in thousands)
Number of Loans
% of Total Number
Principal Amount
% of Total Amount Rate Charged
CONSUMER LOANS - AUTO TITLE LOANS
LOANS OF $5,000 TO $9,999
Up to 14.999 APR 11 0.56 $ 73 0.55 15.000 to 19.999 APR 10 0.51 66 0.50 20.000 to 24.999 APR 34 1.72 216 1.63 25.000 to 29.999 APR 15 0.76 100 0.75 30.000 to 34.999 APR 23 1.17 140 1.05 35.000 to 39.999 APR 1,800 91.23 12,183 91.73 40.000 to 69.999 APR 16 0.81 104 0.78 70.000 to 99.999 APR 60 3.04 378 2.85 100.000 or More APR 4 0.20 22 0.17 Variable Rate 0 0.00 0 0.00
Total Loans Made 1,973 100.00 $ 13,282 100.00
LOANS OF $10,000 AND MORE
Up to 14.999 APR 22 5.54 $ 619 10.05 15.000 to 19.999 APR 10 2.52 210 3.41 20.000 to 24.999 APR 21 5.29 396 6.43 25.000 to 29.999 APR 8 2.02 134 2.18 30.000 to 34.999 APR 60 15.11 1,051 17.06 35.000 to 39.999 APR 85 21.41 1,012 16.43 40.000 to 69.999 APR 114 28.72 1,725 28.00 70.000 to 99.999 APR 66 16.62 831 13.49 100.000 or More APR 11 2.77 182 2.95 Variable Rate 0 0.00 0 0.00
Total Loans Made 397 100.00 $ 6,160 100.00
Total Auto Title Consumer Loans Made 5,994 $ 30,917

California Department of Financial Protection and Innovation 25
Exhibit G (continued) California Finance Lenders
Loans Made or Refinanced by Rate Charged Calendar Year 2020
($ in thousands)
Number of Loans
% of Total Number
Principal Amount
% of Total Amount Rate Charged
CONSUMER LOANS - WAGE ASSIGNMENT
LOANS UNDER $2,500
Step Rate: 2.5, 2, 1.5, 1% per month 0 $ 0
Alternate Rate: 1.6% per month 0 0 Federal Reserve Bank Rate plus 10% 0 0
Other Rates: Up to 14.999 APR 66 100.00 $ 150 100.00 15.000 to 19.999 APR 0 0.00 0 0.00 20.000 to 24.999 APR 0 0.00 0 0.00 25.000 to 29.999 APR 0 0.00 0 0.00 30.000 to 34.999 APR 0 0.00 0 0.00 35.000 to 39.999 APR 0 0.00 0 0.00 40.000 to 69.999 APR 0 0.00 0 0.00 70.000 to 99.999 APR 0 0.00 0 0.00 100.000 or More APR 0 0.00 0 0.00 Variable Rate 0 0.00 0 0.00
Total Loans Made 66 100.00 $ 150 100.00
LOANS OF $2,500 TO $4,999
Up to 14.999 APR 0 0.00 $ 0 0.00 15.000 to 19.999 APR 0 0.00 0 0.00 20.000 to 24.999 APR 0 0.00 0 0.00 25.000 to 29.999 APR 0 0.00 0 0.00 30.000 to 34.999 APR 0 0.00 0 0.00 35.000 to 39.999 APR 0 0.00 0 0.00 40.000 to 69.999 APR 0 0.00 0 0.00 70.000 to 99.999 APR 0 0.00 0 0.00 100.000 or More APR 0 0.00 0 0.00 Variable Rate 0 0.00 0 0.00
Total Loans Made 0 0.00 $ 0 0.00

California Department of Financial Protection and Innovation 26
Exhibit G (continued) California Finance Lenders
Loans Made or Refinanced by Rate Charged Calendar Year 2020
($ in thousands)
Number of Loans
% of Total Number
Principal Amount
% of Total Amount Rate Charged
CONSUMER LOANS - WAGE ASSIGNMENT
LOANS OF $5,000 TO $9,999
Up to 14.999 APR 0 0.00 $ 0 0.00 15.000 to 19.999 APR 0 0.00 0 0.00 20.000 to 24.999 APR 0 0.00 0 0.00 25.000 to 29.999 APR 0 0.00 0 0.00 30.000 to 34.999 APR 0 0.00 0 0.00 35.000 to 39.999 APR 0 0.00 0 0.00 40.000 to 69.999 APR 0 0.00 0 0.00 70.000 to 99.999 APR 0 0.00 0 0.00 100.000 or More APR 0 0.00 0 0.00 Variable Rate 0 0.00 0 0.00
Total Loans Made 0 0.00 $ 0 0.00
LOANS OF $10,000 AND MORE
Up to 14.999 APR 0 0.00 $ 0 0.00 15.000 to 19.999 APR 0 0.00 0 0.00 20.000 to 24.999 APR 0 0.00 0 0.00 25.000 to 29.999 APR 0 0.00 0 0.00 30.000 to 34.999 APR 0 0.00 0 0.00 35.000 to 39.999 APR 0 0.00 0 0.00 40.000 to 69.999 APR 0 0.00 0 0.00 70.000 to 99.999 APR 0 0.00 0 0.00 100.000 or More APR 0 0.00 0 0.00 Variable Rate 0 0.00 0 0.00
Total Loans Made 0 0.00 $ 0 0.00
Total Wage Assignment Consumer Loans Made 66 $ 150

California Department of Financial Protection and Innovation 27
Exhibit G (continued) California Finance Lenders
Loans Made or Refinanced by Rate Charged Calendar Year 2020
($ in thousands)
Number of Loans
% of Total Number
Principal Amount
% of Total Amount Rate Charged
CONSUMER LOANS - REAL PROPERTY
LOANS OF $5,000 TO $9,999
Up to 14.999 APR 196 97.03 $ 1,474 96.66 15.000 to 19.999 APR 0 0.00 0 0.00 20.000 to 24.999 APR 0 0.00 0 0.00 25.000 to 29.999 APR 0 0.00 0 0.00 30.000 to 34.999 APR 0 0.00 0 0.00 35.000 to 39.999 APR 0 0.00 0 0.00 40.000 to 69.999 APR 0 0.00 0 0.00 70.000 to 99.999 APR 0 0.00 0 0.00 100.000 or More APR 0 0.00 0 0.00 Variable Rate 6 2.97 51 3.34
Total Loans Made 202 100.00 $ 1,525 100.00
LOANS OF $10,000 AND MORE
Up to 14.999 APR 260,283 99.51 $ 100,532,491 99.50 15.000 to 19.999 APR 0 0.00 0 0.00 20.000 to 24.999 APR 0 0.00 0 0.00 25.000 to 29.999 APR 0 0.00 0 0.00 30.000 to 34.999 APR 0 0.00 0 0.00 35.000 to 39.999 APR 0 0.00 0 0.00 40.000 to 69.999 APR 0 0.00 0 0.00 70.000 to 99.999 APR 0 0.00 0 0.00 100.000 or More APR 5 0.00 2,491 0.00 Variable Rate 1,287 0.49 505,382 0.50
Total Loans Made 261,575 100.00 $ 101,040,364 100.00
Total Real Property Consumer Loans Made 261,777 $ 101,041,889

California Department of Financial Protection and Innovation 28
Exhibit G (continued) California Finance Lenders
Loans Made or Refinanced by Rate Charged Calendar Year 2020
($ in thousands)
Number of Loans
% of Total Number
Principal Amount
% of Total Amount Rate Charged
CONSUMER LOANS - OTHER SECURITIES
LOANS UNDER $2,500
Step Rate: 2.5, 2, 1.5, 1% per month
12
$ 21
Alternate Rate: 1.6% per month
3
1
Federal Reserve Bank Rate plus 10% 0 0
Other Rates: Up to 14.999 APR
3,868
17.85
$ 3,896
19.06
15.000 to 19.999 APR 17,676 81.56 16,245 79.49 20.000 to 24.999 APR 4 0.02 7 0.03 25.000 to 29.999 APR 0 0.00 0 0.00 30.000 to 34.999 APR 0 0.00 0 0.00 35.000 to 39.999 APR 0 0.00 0 0.00 40.000 to 69.999 APR 0 0.00 0 0.00 70.000 to 99.999 APR 0 0.00 0 0.00 100.000 or More APR 0 0.00 0 0.00 Variable Rate 124 0.57 289 1.41
Total Loans Made 21,672 100.00 $ 20,437 100.00
LOANS OF $2,500 TO $4,999
Up to 14.999 APR 1,072 17.36 $ 3,935 17.09 15.000 to 19.999 APR 2,848 46.11 10,690 46.42 20.000 to 24.999 APR 28 0.45 109 0.47 25.000 to 29.999 APR 2,198 35.59 8,180 35.52 30.000 to 34.999 APR 8 0.13 32 0.14 35.000 to 39.999 APR 22 0.36 85 0.37 40.000 to 69.999 APR 0 0.00 0 0.00 70.000 to 99.999 APR 0 0.00 0 0.00 100.000 or More APR 0 0.00 0 0.00 Variable Rate 0 0.00 0 0.00
Total Loans Made 6,176 100.00 $ 23,031 100.00

California Department of Financial Protection and Innovation 29
Exhibit G (continued) California Finance Lenders
Loans Made or Refinanced by Rate Charged Calendar Year 2020
($ in thousands)
Number of Loans
% of Total Number
Principal Amount
% of Total Amount Rate Charged
CONSUMER LOANS - OTHER SECURITIES
LOANS OF $5,000 TO $9,999
Up to 14.999 APR 33 26.40 $ 225 25.51 15.000 to 19.999 APR 2 1.60 12 1.36 20.000 to 24.999 APR 0 0.00 0 0.00 25.000 to 29.999 APR 3 2.40 27 3.06 30.000 to 34.999 APR 35 28.00 255 28.91 35.000 to 39.999 APR 52 41.60 363 41.16 40.000 to 69.999 APR 0 0.00 0 0.00 70.000 to 99.999 APR 0 0.00 0 0.00 100.000 or More APR 0 0.00 0 0.00 Variable Rate 0 0.00 0 0.00
Total Loans Made 125 100.00 $ 882 100.00
LOANS OF $10,000 AND MORE
Up to 14.999 APR 3,995 97.06 $ 426,444 96.45 15.000 to 19.999 APR 9 0.22 2,948 0.67 20.000 to 24.999 APR 5 0.12 1,541 0.35 25.000 to 29.999 APR 7 0.17 242 0.05 30.000 to 34.999 APR 33 0.80 436 0.10 35.000 to 39.999 APR 65 1.58 823 0.19 40.000 to 69.999 APR 0 0.00 0 0.00 70.000 to 99.999 APR 0 0.00 0 0.00 100.000 or More APR 0 0.00 0 0.00 Variable Rate 2 0.05 9,691 2.19
Total Loans Made 4,116 100.00 $ 442,125 100.00
Total Other Securities Consumer Loans Made 32,089 $ 486,475

California Department of Financial Protection and Innovation 30
Exhibit H California Finance Lenders Schedule of Loan Activity
Calendar Year 2020 ($ in thousands)
Table 3: Consumer Loans Serviced - Unsecured and Personal Property
Unsecured
Number of Loans
Principal Amount
Personal
Number of Loans
Property
Principal Amount
Loans Outstanding at Prior Year End 12/31/2019 1,450,951 $10,082,315 103,120 $2,618,333 Loans Outstanding at Year End 12/31/2020 3,615,542 $8,921,018 121,365 $2,893,084 Loans with One or More Past Due Payments Which are Past Due 30 or More Days at 12/31/2020 779,218 $291,576 1,586 $42,801
Table 4: Current Year Loan Activity - Unsecured and Personal Property
Unsecured
Number of Loans
Principal Amount
Personal Property
Number of Loans
Principal Amount
Number of Loans Charged One or More Late Fees 540,933 6,832 Total Late Fees Collected 798,347 $10,631 5,644 $225 Total Number of Repossessions Conducted 0 63 Total Number of Loans Reinstated 20,516 2 Total Number of Collateral Redeemed 0 141 Total Collateral Sales Resulting in a Deficiency Balance 0 $0 38 $296 Total Collateral Sales Resulting in a Surplus Balance 0 $0 5 $302 Total Charge-offs 500,328 $498,918 5,341 $50,759 Average Contracted Term of Loan (In Months) 37 114

California Department of Financial Protection and Innovation 31
Exhibit H (continued) California Finance Lenders Schedule of Loan Activity
Calendar Year 2020 ($ in thousands)
Table 5: Consumer Loans Serviced - Automobiles & Other Motor Vehicles and Auto Title Loans
Automobiles and Other Motor Vehicles Auto Title Loans
Number of Loans
Principal Amount
Number of Loans
Principal Amount
Loans Outstanding at Prior Year End 12/31/2019 1,609,563 $25,872,276 113,988 $383,066 Loans Outstanding at Year End 12/31/2020 330,649 $3,872,827 49,979 $154,473 Loans with One or More Past Due Payments Which are Past Due 30 or More Days at 12/31/2020 1,036,736 $103,762 2,857 $10,560
Table 6: Current Year Loan Activity - Automobiles & Other Motor Vehicles and Auto Title Loans Automobiles and
Other Motor Vehicles Auto Title Loans
Number of Loans
Principal Amount
Number of Loans
Principal Amount
Number of Loans Charged One or More Late Fees 137,461 16,396 Total Late Fees Collected 109,739 $3,846 64,071 $1,012 Total Number of Repossessions Conducted 5,345 9,382 Total Number of Loans Reinstated 630 1,248 Total Number of Collateral Redeemed 352 781 Total Collateral Sales Resulting in a Deficiency Balance 2,819 $26,626 5,979 $9,672 Total Collateral Sales Resulting in a Surplus Balance 20 $68 109 $548 Total Charge-offs 9,776 $118,071 10,872 $33,623 Average Contracted Term of Loan (In Months) 55 28
California Department of Financial Protection and Innovation 32
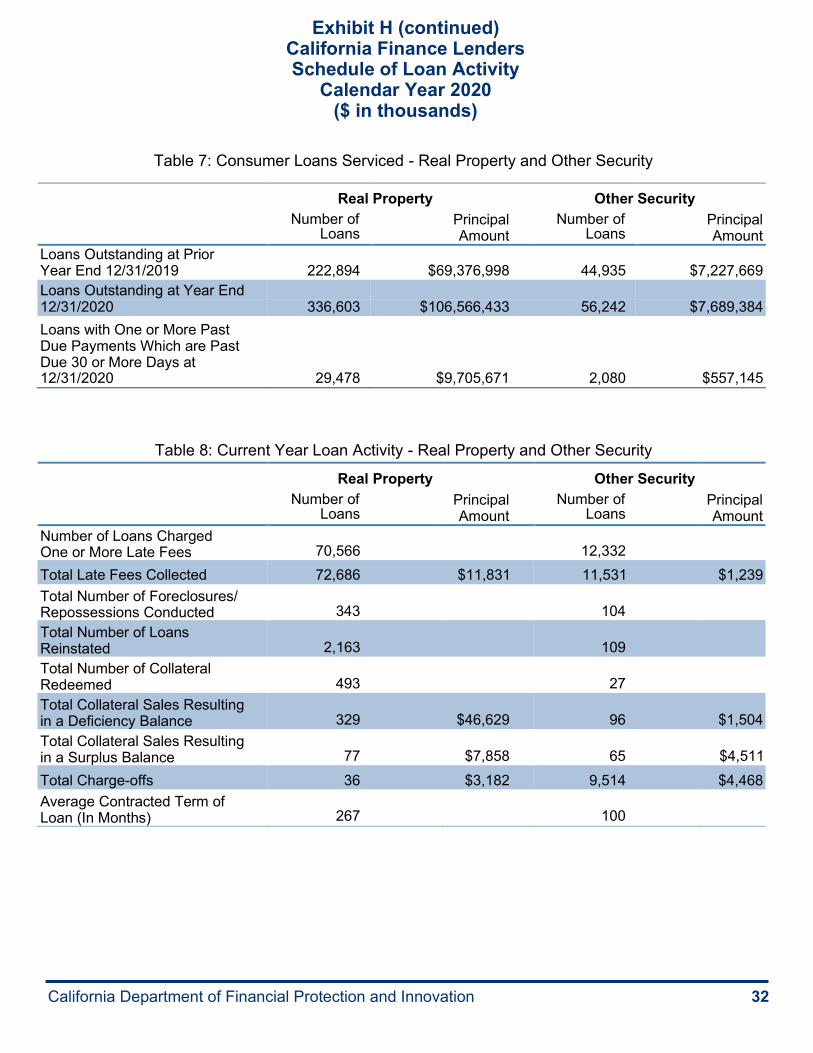
Exhibit H (continued) California Finance Lenders Schedule of Loan Activity
Calendar Year 2020 ($ in thousands)
Table 7: Consumer Loans Serviced - Real Property and Other Security
Real
Number of Loans
Property
Principal Amount
Other
Number of Loans
Security
Principal Amount
Loans Outstanding at Prior Year End 12/31/2019 222,894 $69,376,998 44,935 $7,227,669 Loans Outstanding at Year End 12/31/2020 336,603 $106,566,433 56,242 $7,689,384 Loans with One or More Past Due Payments Which are Past Due 30 or More Days at 12/31/2020 29,478 $9,705,671 2,080 $557,145
Table 8: Current Year Loan Activity - Real Property and Other Security
Real Property
Number of Loans
Principal Amount
Other Security
Number of Loans
Principal Amount
Number of Loans Charged One or More Late Fees 70,566 12,332 Total Late Fees Collected 72,686 $11,831 11,531 $1,239 Total Number of Foreclosures/ Repossessions Conducted 343 104 Total Number of Loans Reinstated 2,163 109 Total Number of Collateral Redeemed 493 27 Total Collateral Sales Resulting in a Deficiency Balance 329 $46,629 96 $1,504 Total Collateral Sales Resulting in a Surplus Balance 77 $7,858 65 $4,511 Total Charge-offs 36 $3,182 9,514 $4,468 Average Contracted Term of Loan (In Months) 267 100
California Department of Financial Protection and Innovation 33
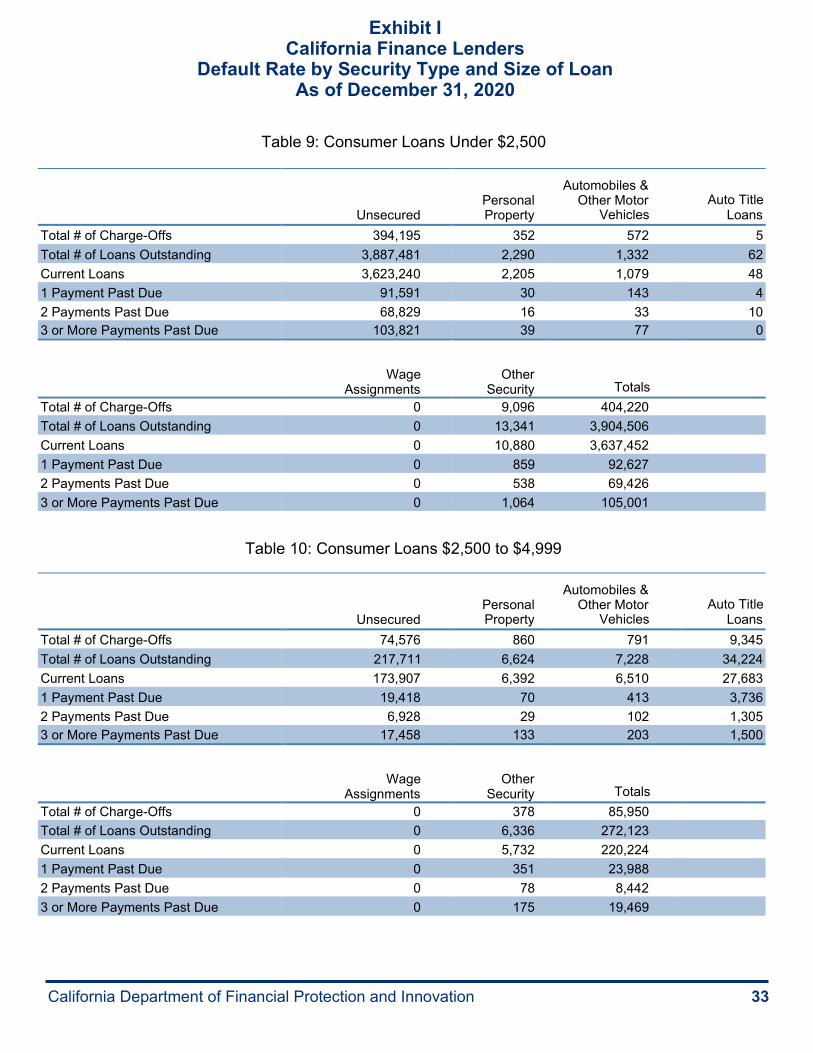
Exhibit I California Finance Lenders
Default Rate by Security Type and Size of Loan As of December 31, 2020
Table 9: Consumer Loans Under $2,500
Unsecured Personal Property
Automobiles & Other Motor
Vehicles Auto Title
Loans Total # of Charge-Offs 394,195 352 572 5 Total # of Loans Outstanding 3,887,481 2,290 1,332 62 Current Loans 3,623,240 2,205 1,079 48 1 Payment Past Due 91,591 30 143 4 2 Payments Past Due 68,829 16 33 10 3 or More Payments Past Due 103,821 39 77 0
Wage Assignments
Other Security Totals
Total # of Charge-Offs 0 9,096 404,220 Total # of Loans Outstanding 0 13,341 3,904,506 Current Loans 0 10,880 3,637,452 1 Payment Past Due 0 859 92,627 2 Payments Past Due 0 538 69,426 3 or More Payments Past Due 0 1,064 105,001
Table 10: Consumer Loans $2,500 to $4,999
Unsecured Personal Property
Automobiles & Other Motor
Vehicles Auto Title
Loans Total # of Charge-Offs 74,576 860 791 9,345 Total # of Loans Outstanding 217,711 6,624 7,228 34,224 Current Loans 173,907 6,392 6,510 27,683 1 Payment Past Due 19,418 70 413 3,736 2 Payments Past Due 6,928 29 102 1,305 3 or More Payments Past Due 17,458 133 203 1,500
Wage Assignments
Other Security Totals
Total # of Charge-Offs 0 378 85,950 Total # of Loans Outstanding 0 6,336 272,123 Current Loans 0 5,732 220,224 1 Payment Past Due 0 351 23,988 2 Payments Past Due 0 78 8,442 3 or More Payments Past Due 0 175 19,469

California Department of Financial Protection and Innovation 34
Exhibit I (continued) California Finance Lenders
Default Rate by Security Type and Size of Loan As of December 31, 2020
Table 11: Consumer Loans $5,000 to $9,999
Unsecured Personal Property
Automobiles & Other Motor
Vehicles Auto Title
Loans Total # of Charge-Offs 26,986 970 1,410 1,289 Total # of Loans Outstanding 250,107 17,321 22,844 9,752 Current Loans 208,925 16,895 21,141 8,028 1 Payment Past Due 22,192 94 963 1,104 2 Payments Past Due 6,428 99 259 271 3 or More Payments Past Due 12,562 233 481 349
Wage Assignments Real Property Other Security Totals
Total # of Charge-Offs 0 2 8 30,665 Total # of Loans Outstanding 0 1,552 231 301,807 Current Loans 0 1,493 200 256,682 1 Payment Past Due 0 0 7 24,360 2 Payments Past Due 0 27 5 7,089 3 or More Payments Past Due 0 32 19 13,676
Table 12: Consumer Loans $10,000 or More
Unsecured Personal Property
Automobiles & Other Motor
Vehicles Auto Title
Loans Total # of Charge-Offs 4,414 3,159 7,003 233 Total # of Loans Outstanding 103,384 113,117 191,725 1,972 Current Loans 100,202 111,726 184,076 1,587 1 Payment Past Due 1,611 730 4,604 234 2 Payments Past Due 531 317 1,539 59 3 or More Payments Past Due 1,040 344 1,506 92
Wage Assignments Real Property Other Security Totals
Total # of Charge-Offs 0 34 32 14,875 Total # of Loans Outstanding 0 1,838,105 37,262 2,285,565 Current Loans 0 1,820,013 35,347 2,252,951 1 Payment Past Due 0 867 194 8,240 2 Payments Past Due 0 4,111 404 6,961 3 or More Payments Past Due 0 13,114 1,317 17,413

California Department of Financial Protection and Innovation 35
Exhibit J California Finance Lenders
Loans Made Online by Type of Security Calendar Year 2020
($ in thousands)
Table 13: Loans Made Online Total Number of CFL Licensees Making Loans 1,525
Total Number of CFL Licensees Making Online Loans 127 % of CFL Licensees Making Online Loans 8.33%
Aggregate Principal Amount of All CFL Loans Made $ 272,580,617
Aggregate Principal Amount of Online CFL Loans Made $ 16,902,535
% of Online CFL Loans Made 6.20%
% of Total Number to All
CFL Number of Consumer
Type of Security Loans Number Principal Amount
% of Total Amount to All
CFL Consumer
Amount
CONSUMER LOANS
Unsecured (Under $2,500) 11,068,317 98.59 $1,230,630 8.50
Unsecured ($2,500 and Above) 89,580 0.80 $1,887,279 13.03 Personal Property 14,551 0.13 $483,401 3.34
Automobiles & Other Motor Vehicles 6,070 0.05 $114,806 0.79
Auto Title Loans 4,395 0.04 $22,534 0.16 Wage Assignments 0 0.00 $0 0.00 Real Property 29,081 0.26 $10,723,331 74.06 Other Security 14,405 0.13 $17,193 0.12
Total Consumer Loans Made 11,229,689 100.00 $14,479,174 100.00
% of Total Number to All
CFL Number of Commercial
Type of Security Loans Number Principal Amount
% of Total Amount to All
CFL Commercial
Amount
COMMERCIAL LOANS
Unsecured 16,230 45.06 $632,814 26.11 Personal Property 2,295 6.37 $204,062 8.42
Automobiles & Other Motor Vehicles 3,643 10.11 $18,304 0.76
Business Equipment 403 1.12 $109,191 4.51 Real Property 1,964 5.45 $817,939 33.75 Other Security 11,481 31.88 $641,051 26.45
Total Commercial Loans Made 36,016 100.00 $2,423,361 100.00

California Department of Financial Protection and Innovation 36
Exhibit K
Property Assessed Clean Energy (PACE) Program
Key Findings
Calendar Year 2020
The DFPI staff are reviewing PACE program data after inconsistencies were reported in this report. Updates to the PACE section of the California Financing Law (CFL) Report will be made shortly and a revised report will be posted indicating corrected/revised information.

California Department of Financial Protection and Innovation Toll-Free: 1-866-275-2677 TTY: 1-800-735-2922 Online: www.dfpi.ca.gov