tenaga nasional berhad · tenaga nasional berhad unaudited financial results for the 3rd quarter...
TRANSCRIPT
TENAGA NASIONAL BERHAD
UNAUDITED FINANCIAL RESULTS FOR THE 3rd QUARTER FY2006
14th July 2006

�
AGENDA
� Highlights Of Group’s Performance
� Details Of Group’s Performance
� Update On TNB’s Latest Events

�
Y.Bhg. Tan Sri Datuk Amar Leo Moggie
CHAIRMAN
Highlights Of Group’s Performance
“One Team. One Spirit. One Goal.”

�
� Status of KPI
� Revenue Growth + 5.3%
� Other Operating Income +13.6%
� Operating Expenses + 5.4%
� EBITDA + RM332.8 mnEBITDA Margin (33.9%)
� Forex Translation Gain + RM515.7 mn
Key Highlights
� On track to deliver
� Electricity sales in Peninsular rose by 4.9%
� Partially due to recovery of theft back billing
� Driven by:� 6.6% increase in coal prices
� Aggressive preventive maintenance program
� Delivery of KPI targets
� Strong Ringgit

�
1H FY’05
Revenue
Operating Expenses
Translation gain/(loss)
Finance Cost
RM mn
Operating Surplus
Other Operating Income
YTD3Q FY’05
14,021.4
(11,684.1)
14,763.9
(12,319.8)
(1,194.9)
515.7(81.8)
2,771.72,625.6
(1,157.5)
327.6288.3
Profit Before Tax & Translation gain/(loss) 1,448.41,503.8
Transaction Loss (46.8) (137.5)
Net Profit Before Translation gain/(loss) 874.8
Net Profit
958.2
876.4 1,390.5
YTD3Q FY’06
Financial Highlights…..

�
11,281.812,126.5
13,068.114,021.4 14,763.9
3,000
6,000
9,000
12,000
15,000
FY'02 FY'03 FY'04 FY'05 FY'06
RM mn5.3%
31.2 31.9 32.8 33.3 33.9
0
20
40
FY'02 FY'03 FY'04 FY'05 FY'06
EBITDA Margin
RM mn
9,641.1 10,189.610,898.9
11,684.1 12,319.8
2,000
6,000
10,000
14,000
FY'02 FY'03 FY'04 FY'05 FY'06
OPEX 5.4%
1.8%
Revenue
YTD3Q
%
662.9794.8
844.3958.2
874.8
200
400
600
800
1,000
FY'02 FY'03 FY'04 FY'05 FY'06
RM mn
Net Profit ex Forex Translation
Snapshot of Financial Performance Trend
-8.7%
YTD3Q
YTD3QYTD3Q
7.5 %7.8%
7.3%
�
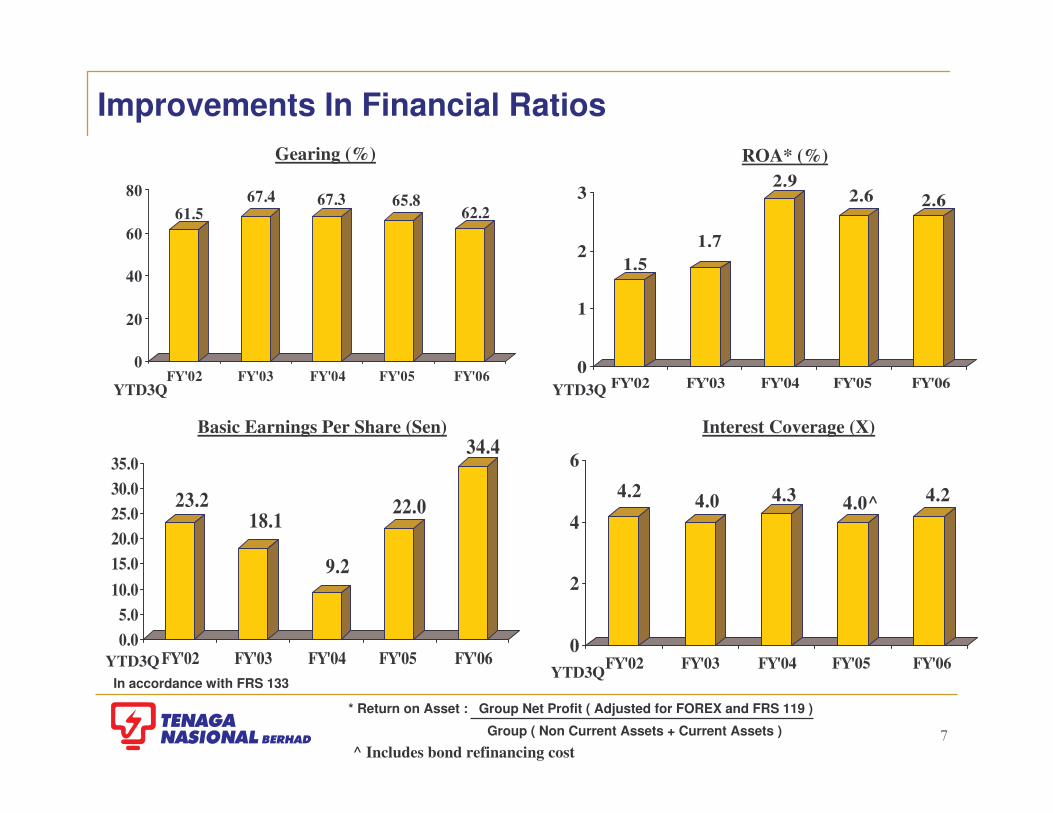
23.218.1
9.2
22.0
34.4
0.05.0
10.015.020.025.030.035.0
FY'02 FY'03 FY'04 FY'05 FY'06
4.2 4.0 4.3 4.0^ 4.2
0
2
4
6
FY'02 FY'03 FY'04 FY'05 FY'06
1.51.7
2.92.6 2.6
0
1
2
3
FY'02 FY'03 FY'04 FY'05 FY'06
ROA* (%)
Improvements In Financial Ratios
61.567.4 67.3 65.8
62.2
0
20
40
60
80
FY'02 FY'03 FY'04 FY'05 FY'06
Gearing (%)
Basic Earnings Per Share (Sen) Interest Coverage (X)
YTD3Q YTD3Q
YTD3QYTD3Q
* Return on Asset : Group Net Profit ( Adjusted for FOREX and FRS 119 )
Group ( Non Current Assets + Current Assets )
In accordance with FRS 133
^ Includes bond refinancing cost

�Note: TNB’s figure is based on annualised YTD3QFY06. Other utilities are based on FY’05.
Source: Citigroup
Return On Invested Capital (%)
��������
��������
���� ���
���
���
0
10
20
30
40
50
60
AGL TataPower
TEPCO CLP TNB KEPCO Datang EGCO
EBITDA Margin (%)
������
����� ���
������
��
0
2
4
6
8
10
12
14
16
18
TNB TataPower
EGCO TEPCO CLP AGL Datang KEPCO
Interest Coverage (x)
����
��� ���
�������
�����
��
0
20
40
60
80
KEPCO CLP AGL TataPower
EGCO TNB Datang TEPCO
Debt to Total Capital (%)
Benchmarked Against Other Utilities
������
��
���
���
���
����
���
0
2
4
6
8
10
12
14
16
KEPCO TEPCO TNB Datang TataPower
AGL CLP EGCO
Baa1/BBB
AGL
-/BBB
Datang
Not rated
ECGO
A1/A
KEPCO
A1/A
CLP
Ba2/BB+
TataPower
Aa3/AA-
TEPCO
Baa1/BBB
TNB
Rating (Moody’s/S&P)

�
Overall Domestic
Commercial Industrial
Average Tariff Still Among The Lowest In The Region
23.3 23.5 25.4 26.229.7 30.5 31.3
35.942.5
65.9
50.3
0.0
10.0
20.0
30.0
40.0
50.0
60.0
70.0
Indo
nesi
a
TNB
(Bef
ore)
Taiw
an
TNB
(Aft
er)
Thai
land
Kor
ea
Chi
na(S
hang
hai)
Sin
gapo
re
Hon
g K
ong
Phi
llipp
ines
Japa
n
22.6 23.4 24.729.7 30.7 31.0
36.5 36.942.3
53.0
77.3
0.010.020.030.040.050.060.070.080.090.0
Indo
nesi
a
TNB
(Bef
ore)
TNB
(Afte
r)
Chi
na(S
hang
hai)
Thai
land
Taiw
an
Kor
ea
Sin
gapo
re
Hon
g K
ong
Phi
llipp
ines
Japa
n
27.5 27.630.7
33.530.8
47.1
39.1
35.734.7
51.457.4
0.0
10.0
20.0
30.0
40.0
50.0
60.0
TN
B (Bef
ore)
Indo
nesi
a
Tai
wan
TN
B (After
)
Tha
iland
Chi
na
(Sha
ngha
i)
Sin
gapo
re
Kor
ea
Hon
gkon
g
Phi
llipp
ines
Japa
n
21.2 21.3 22.4 24.823.8
33.231.830.9
27.5
45.457.4
0.0
10.0
20.0
30.0
40.0
50.0
60.0
TN
B (
Bef
ore)
Tai
wan
Indo
nesi
a
TN
B (
Aft
er)
Kor
ea
Tha
iland
Chi
na (
Sha
ngha
i)
Sin
gapo
re
Hon
g K
ong
Phi
llipp
ines
Japa
n
Effective 1st June 2006
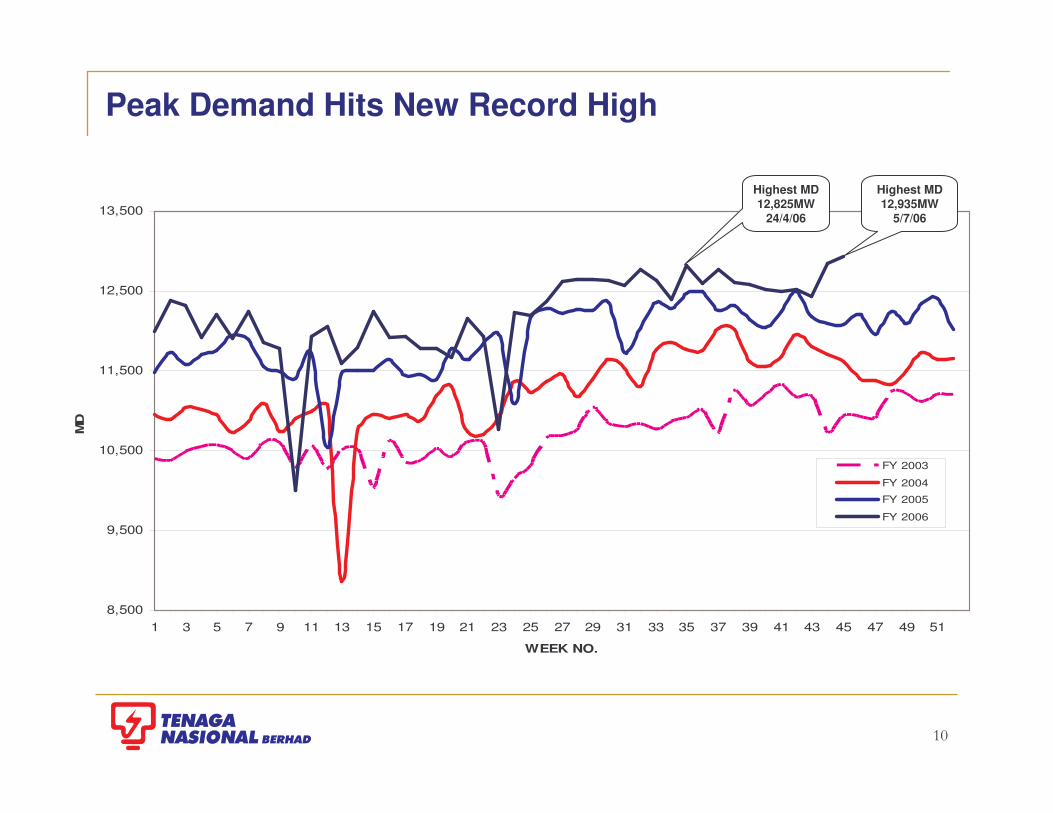
Peak Demand Hits New Record High
8,500
9,500
10,500
11,500
12,500
13,500
1 3 5 7 9 11 13 15 17 19 21 23 25 27 29 31 33 35 37 39 41 43 45 47 49 51
WEEK NO.
MD
FY 2003
FY 2004
FY 2005
FY 2006
Highest MD12,935MW
5/7/06
Highest MD12,825MW
24/4/06

Revenue – Predominantly From Electricity Sales
Peninsular Malaysia 89.2%
SESB3.5%
LPL 2.3% Deferred
income 1.5%
Goods & Services
1.5%
EGAT2.0%
14,763.914,021.418,977.5Total
220.8269.2357.3Goods & Services
226.5217.2293.8Deferred Income
331.6266.1357.7LPL
510.0499.4672.7SESB
300.5211.7286.1EGAT
13,174.512,557.817,009.9Peninsular Malaysia
YTD3QFY’06
YTD3QFY’05
FY’05
Revenue Breakdown(RM mn)
�
02,0004,0006,0008,000
10,00012,00014,00016,00018,00020,00022,00024,00026,00028,00030,000
Industrial Commercial Domestic *Others0
500
1,000
1,500
2,000
2,500
3,000
3,500
4,000
4,500
5,000
5,500
6,000
Industrial Commercial Domestic *Others(G
Wh)
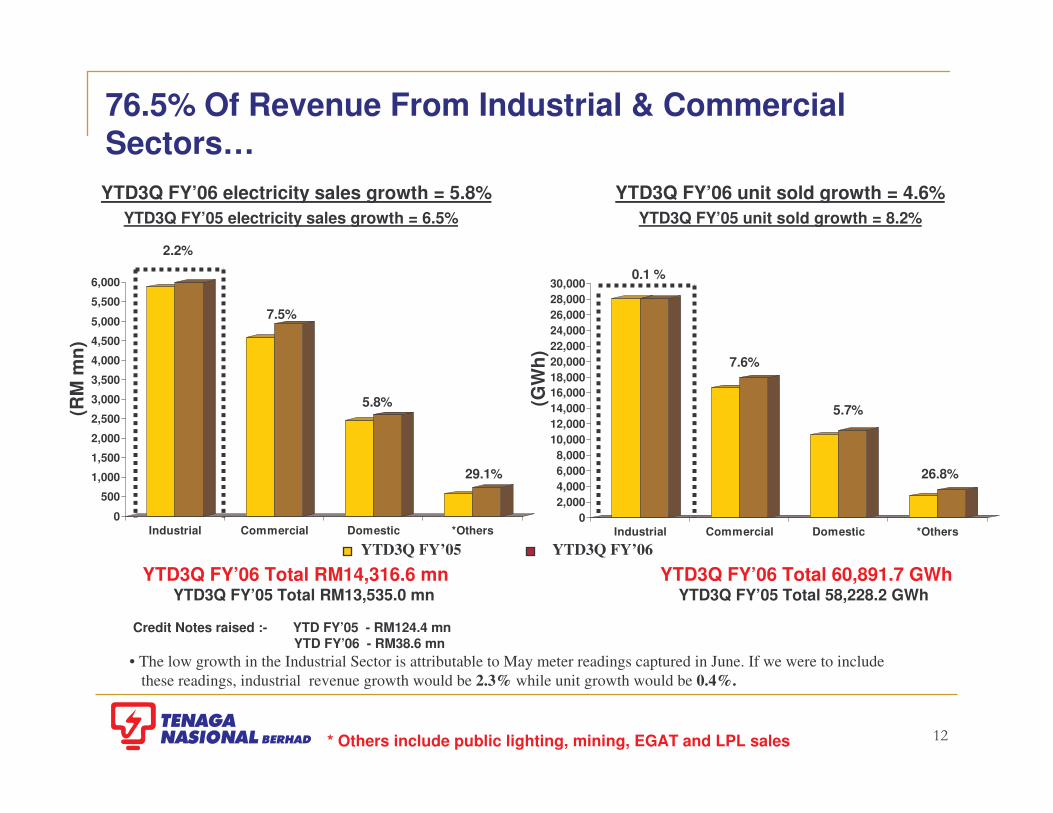
29.1%
0.1 %
7.6%
5.7%
26.8%
(RM
mn)
2.2%
7.5%
5.8%
YTD3Q FY’06 electricity sales growth = 5.8%
76.5% Of Revenue From Industrial & Commercial Sectors…
YTD3Q FY’06 Total 60,891.7 GWhYTD3Q FY’05 Total 58,228.2 GWh
* Others include public lighting, mining, EGAT and LPL sales
Credit Notes raised :- YTD FY’05 - RM124.4 mnYTD FY’06 - RM38.6 mn
• The low growth in the Industrial Sector is attributable to May meter readings captured in June. If we were to include these readings, industrial revenue growth would be 2.3% while unit growth would be 0.4%.
YTD3Q FY’05 electricity sales growth = 6.5%YTD3Q FY’06 unit sold growth = 4.6%
YTD3Q FY’05 unit sold growth = 8.2%
YTD3Q FY’05 YTD3Q FY’06YTD3Q FY’06 Total RM14,316.6 mn
YTD3Q FY’05 Total RM13,535.0 mn

�
Headline Key Performance IndicatorsOn Track To Deliver
Return on Assets ( ROA )
Gearing
Unplanned Outage Rate ( UOR )
Reduction in Transmission & Distribution Losses
Distribution SAIDI
Initiatives Target FY’06
YTD3QFY’06
* Based on annualised figure** YTD figure
Return on Asset : Group Net Profit ( Adjusted for FOREX and FRS 119 )
Group ( Non Current Assets + Current Assets )
Gearing (%) : LTD + STD
LTD + STD + Shareholders’ Fund + MI
62.2%
3.3%
**72.9 minutes
10.67%
*2.6%
63.0%
5.0%
133 minutes
9.5%
2.4%

�
AGENDA
� Highlights Of Group’s Performance
� Details Of Group’s Performance
� Update On TNB’s Latest Events

�
Details Of Group’s Performance
“Maintenance For A Sustainable Future”
Y.Bhg. Dato’ Che Khalib Bin Mohamad Noh President/Chief Executive Officer
�
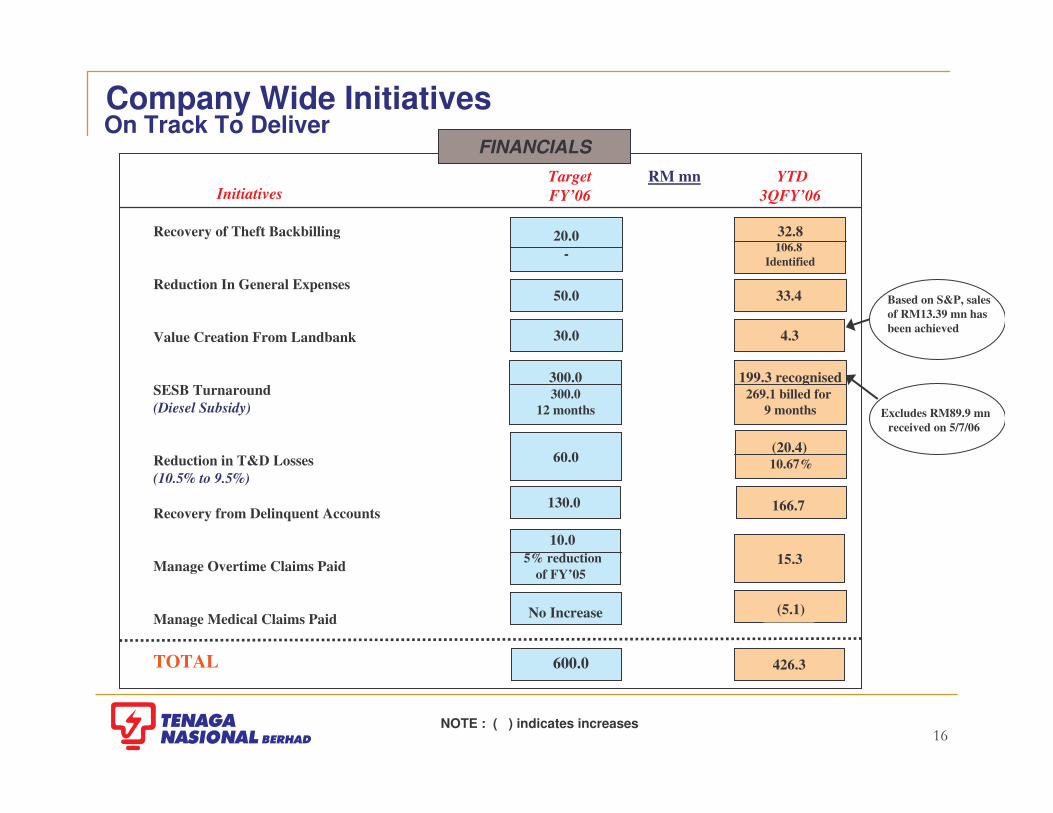
Recovery of Theft Backbilling
Reduction In General Expenses
Value Creation From Landbank
SESB Turnaround (Diesel Subsidy)
Reduction in T&D Losses (10.5% to 9.5%)
Recovery from Delinquent Accounts
Manage Overtime Claims Paid
Manage Medical Claims Paid
TOTAL
InitiativesTarget FY’06
20.0-
50.0
30.0
300.0300.0
12 months
FINANCIALS RM mn
60.0
130.0
32.8106.8
Identified
4.3
199.3 recognised269.1 billed for
9 months
15.3
426.3
(5.1)
NOTE : ( ) indicates increases
10.05% reduction
of FY’05
No Increase
Company Wide Initiatives On Track To Deliver
YTD3QFY’06
600.0
166.7
(20.4) 10.67%
33.4 Based on S&P, sales of RM13.39 mn has been achieved
Excludes RM89.9 mnreceived on 5/7/06
�
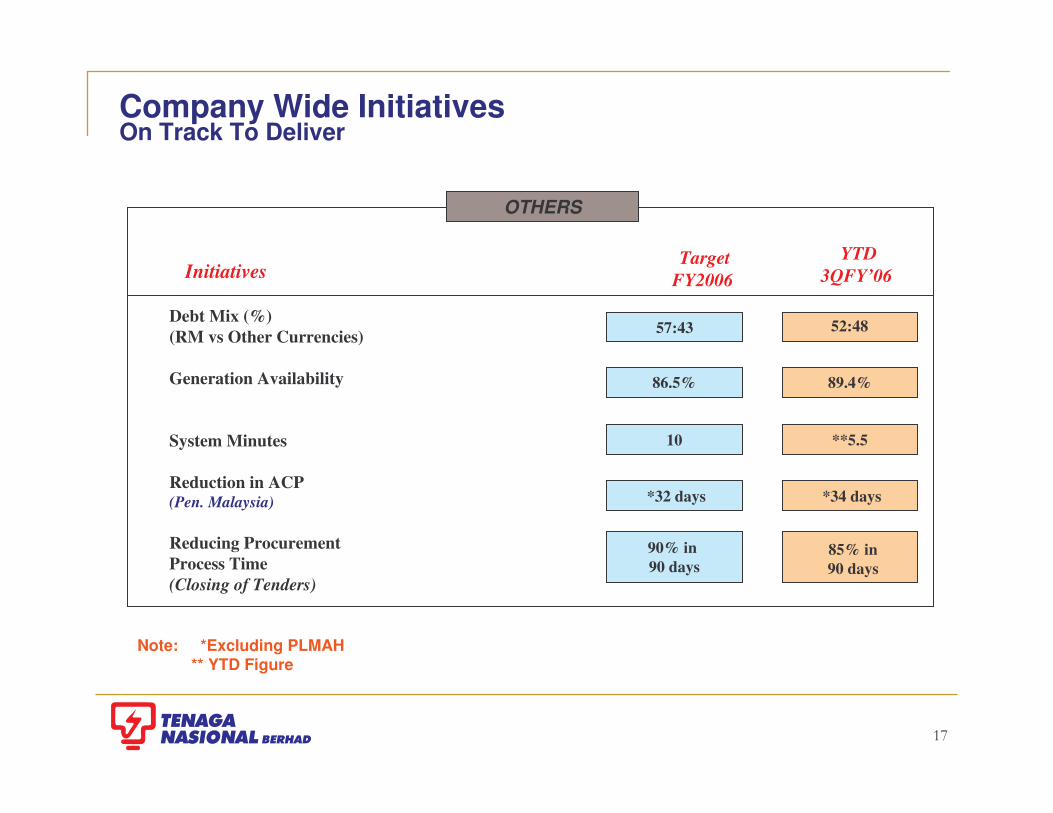
Company Wide Initiatives On Track To Deliver
Debt Mix (%)(RM vs Other Currencies)
Generation Availability
System Minutes
Reduction in ACP(Pen. Malaysia)
Reducing Procurement Process Time (Closing of Tenders)
OTHERS
InitiativesTarget
FY2006
86.5%
10
*32 days
Note: *Excluding PLMAH ** YTD Figure
**5.5
YTD3QFY’06
90% in 90 days
52:48
85% in 90 days
57:43
*34 days
89.4%

�
CUMULATIVE PERIODINDIVIDUAL PERIOD
RM mn
(1,369.8)(1,410.6)(366.0)(490.8)Economic Profit / (Loss)
52,807.47.5%
(2,966.5)
52,284.27.5%
(2,937.1)
52,807.47.5%
(988.8)
52,284.27.5%
(979.0)
2,120.1(593.6)1,526.5
FY’05
YTD3Q
2,217.6(620.9)1,596.7
FY’06
865.0(242.2)622.8
FY’06
Economic Charge computationAverage Invested CapitalWACCEconomic Charge
678.1(189.9)488.2
FY’05
3Q
NOPLAT computationEarning Before Interest and Tax (EBIT)*Adjusted TAxNOPLAT
Economic Profit /(Loss)
�
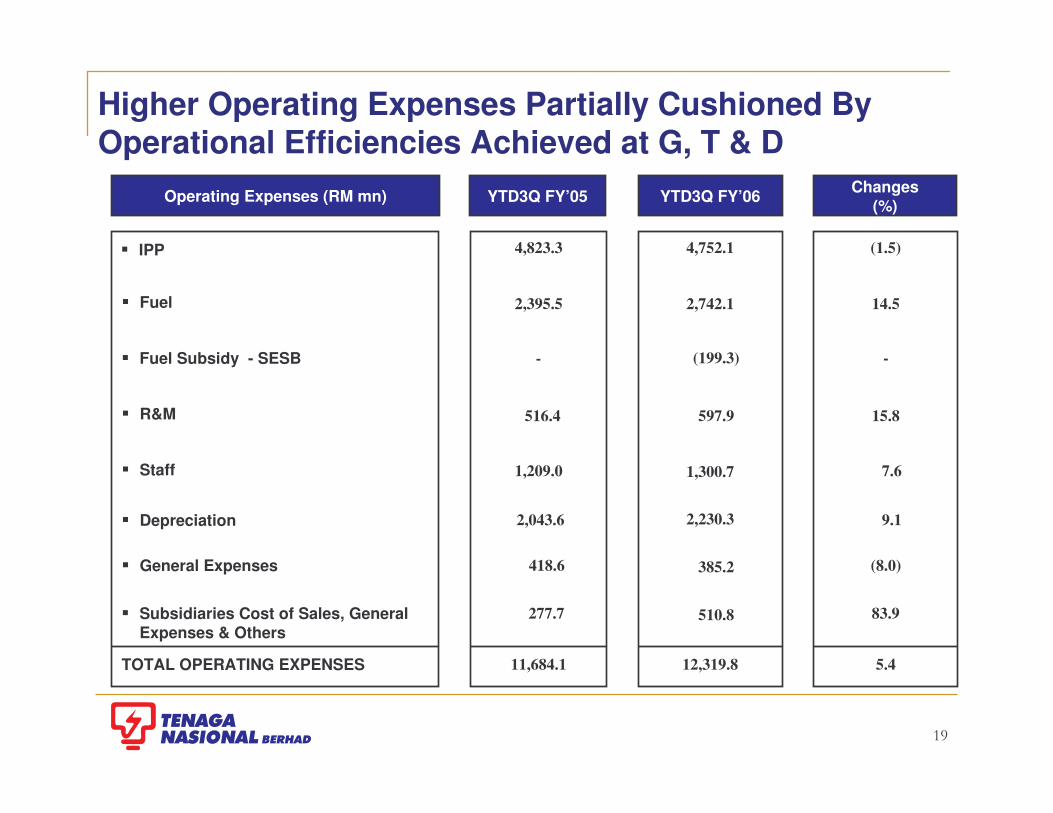
YTD3Q FY’06YTD3Q FY’05 Changes (%)
� IPP
� Fuel
� Staff 1,209.0
� Depreciation
� General Expenses
7.6
2,043.6 9.1
418.6 (8.0)
Operating Expenses (RM mn)
� R&M
TOTAL OPERATING EXPENSES 11,684.1 12,319.8 5.4
� Fuel Subsidy - SESB - (199.3) -
4,823.3 4,752.1 (1.5)
2,742.1
597.9 15.8
Higher Operating Expenses Partially Cushioned By Operational Efficiencies Achieved at G, T & D
14.52,395.5
516.4
1,300.7
2,230.3
385.2
� Subsidiaries Cost of Sales, General Expenses & Others
277.7 510.8 83.9
�
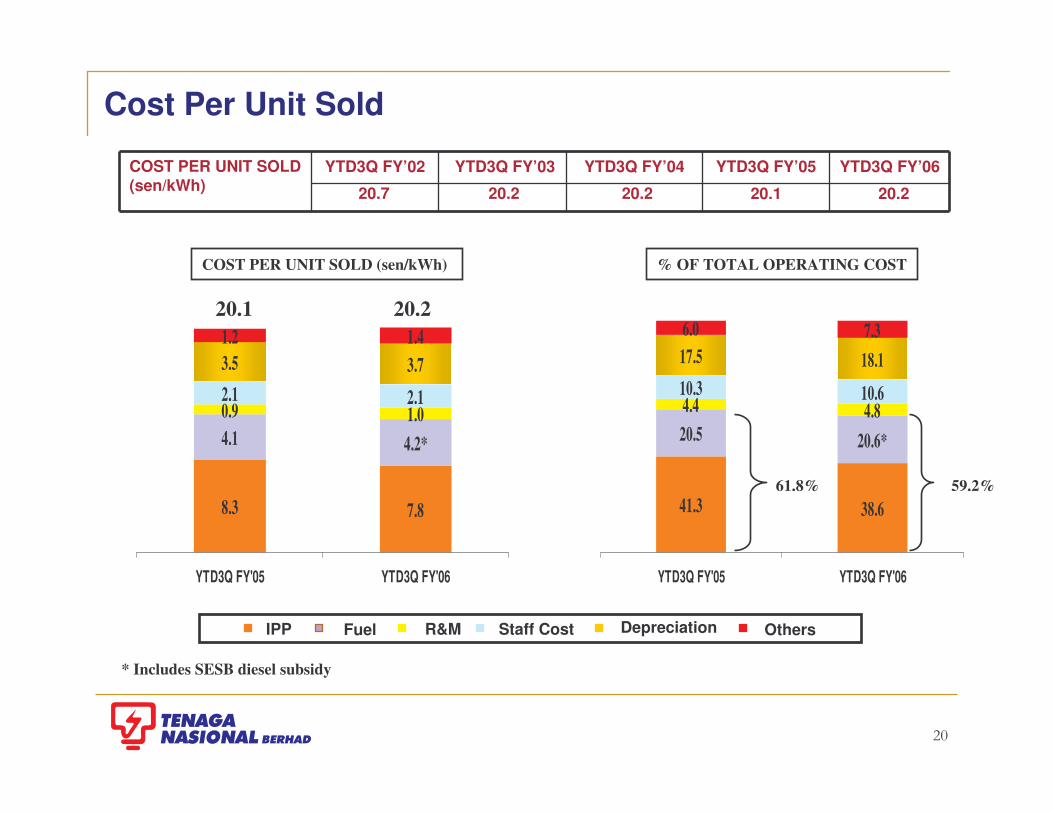
Cost Per Unit Sold
20.1 20.2
Depreciation IPP Fuel R&M Staff Cost Others
61.8% 59.2%
20.1
YTD3Q FY’06YTD3Q FY’05YTD3Q FY’04YTD3Q FY’03YTD3Q FY’02COST PER UNIT SOLD (sen/kWh) 20.220.220.7
8.3
3.5
7.8
4.1 4.2*
0.9 1.02.1 2.1
3.71.2 1.4
YTD3Q FY'05 YTD3Q FY'06
COST PER UNIT SOLD (sen/kWh) % OF TOTAL OPERATING COST
41.3
17.5
38.6
20.5 20.6*
4.4 4.810.3 10.6
18.16.0 7.3
YTD3Q FY'05 YTD3Q FY'06
20.2
* Includes SESB diesel subsidy

�
YTD3Q FY’05 YTD3Q FY’06
TOTAL: RM2,395.5 mn
Average coal price USD 49.8 per metric tonne*Consumption of Coal 5.9 MT
TOTAL:RM2,742.1 mn
TOTAL: 39,140.5 GWhTOTAL: 34,066.1 GWh
Gas 15,078.1 Gwh
44.3%
Distillate 22.8Gwh
0.1%
Hydro 4,000.9Gwh
11.7%Coal
14,387.9 Gwh42.2%
Oil 576.4 Gwh
1.7%
Average coal price USD 53.1 per metric tonne*Consumption of Coal 6.4 MT
247.4197.5Total
193.3179.5SESB
1,209.41,036.6Total
54.118.0TNB
33.523.5SESB
188.0133.1LPL
Oil
987.9880.0TNB
Gas
YTD3QFY’06
YTD3Q FY’05
RM mn
594.7576.4Total
301.5393.5SESB
19,070.315,078.1Total
293.2182.9TNB
458.8303.2SESB
1,032.0946.1LPL
Oil
17,579.513,828.8TNB
Gas
YTD3QFY’06
YTD3Q FY’05
GWh
Higher Fuel Costs Impacted by 14.9% Increase In Units Generated and 6.6% in Coal Prices
Gas 19,070.3Gwh
48.7%
Distillate 27.3Gwh
0.1%
Hydro 4,284.2Gwh
11.0%
Coal 15,164.0 Gwh
38.7%
Oil 594.7 Gwh
1.5%
Gas RM1,036.6 mn
43.3%
Distillate RM21.9 mn
0.9%Coal
RM1,139.5mn47.6%
Oil RM197.5 mn
8.2%
Gas RM1,209.4 mn
44.1%
Distillate RM26.9 mn
1.0%
Coal RM1,258.4mn
45.9%
Oil RM247.4 mn
9.0%
* Average coal price purchased from 3rd parties:-•YTD3Q FY’05 USD 50.9 per metric tonne•YTD3Q FY’06 USD 56.2 per metric tonne

��
INDUSTRY GENERATIONYTD3Q FY’06 = 64,587.8 GWh
INDUSTRY GENERATIONYTD3Q FY’05 = 60,805.7 GWh
Achieving Optimal System Mix But Constrained By Gas Allocation
Gas IPP 28,714.2 Gwh
47.2%
Hydro3,669.1 Gwh
6.0%
Distillate 22.8 Gwh
0.0%
Oil 182.9 Gwh
0.3%
Coal 14,387.9 Gwh
23.7%
Gas TNB 13,828.8 Gwh
22.8%
69.8%70.0 %
Note : Peninsular Malaysia only
Coal IPP 113.3 Gwh
0.2%
Gas IPP 27,526.1 Gwh
42.6%
Hydro3,884.4 Gwh
6.0%
Distillate 27.3 Gwh
0.0%
Oil 293.2 Gwh
0.5%
Coal 15,164.0 Gwh
23.5%
Gas TNB 17,579.5 Gwh
27.2%

��
Debt Portfolio Benefits From Strengthening of Ringgit
RM50.3%
Yen 14.7%
STG4.2%
USD28.9%
Euro1.9%
*Total Debt = RM29.9 bnFixed 87.1% : 12.9%
Weighted Average Cost of Debt 5.35%
* In accordance with FRS 132
31st Aug ’05
USD/RM : 3.77100YEN/RM : 3.39STG/RM : 6.8EURO/RM : 4.6USD/YEN : 111.0
31st May ’06
*Total Debt = RM28.8 bnFixed 89.6% : 10.4%
Weighted Average Cost of Debt 5.72%
USD/RM : 3.62100YEN/RM : 3.24STG/RM : 6.83EURO/RM : 4.67USD/YEN : 111.79
RM52.4%
Yen 14.5%
STG4.2%
USD27.1%
Euro1.8%

��
Benefits of different financing instruments
Primary Equity Preferred Straight Debt Convertible
• Strengthen balance sheet
• Enhance credit rating
• Diversify shareholding among blue-chip institutions
• Earnings dilution minimal if issued at right price
• Perpetual maturity
• Accounting equity credit
• Equity credit with rating agencies
• Diversify funding sources
• No impact on shareholder base
• Cheaper than preferred or equity financing
• Long-term funding source
• Tax deductible interest expense
• No impact on shareholder base
• Lowest coupon and yield
• Potentially issuing new equity at a substantial premium to current market
• Defers dilution to shareholders
TNB Is Continuously Exploring Various Financing Alternatives To Meet Funding Requirements
As at 31st May 2005 :- • Deposits, bank and cash balances 3,413.6
• Medium/long term debt facilities 6,196.2
• Short term debt facilities 2,617.0
RM mn
��
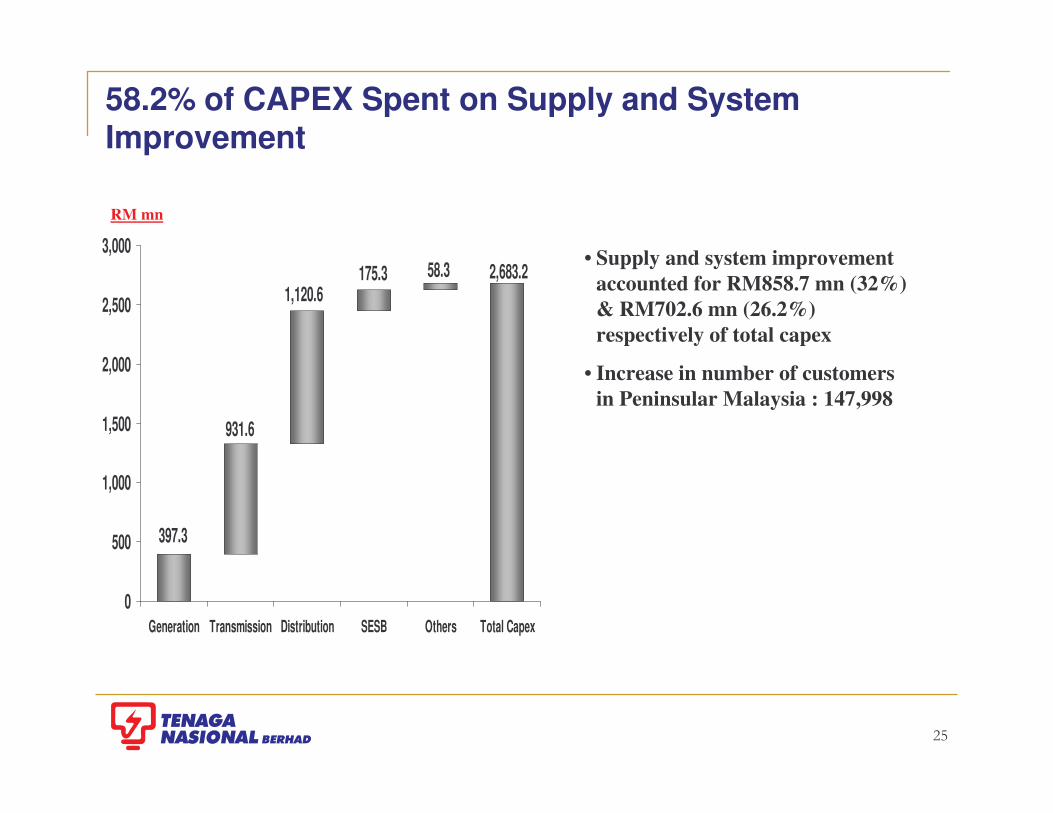
58.2% of CAPEX Spent on Supply and System Improvement
397.3
931.6
1,120.6175.3 58.3 2,683.2
0
500
1,000
1,500
2,000
2,500
3,000
Generation Transmission Distribution SESB Others Total Capex
RM mn
• Supply and system improvement accounted for RM858.7 mn (32%) & RM702.6 mn (26.2%) respectively of total capex
• Increase in number of customers in Peninsular Malaysia : 147,998

��
Cash Surplus Sufficient For Capex In FY’06
2,309.7
3,611.9
5,921.6
FY’05
2,636.21,254.81,019.7959.6SURPLUS
2,587.63,982.63,114.54,072.7Capex
5,223.85,237.44,134.25,032.3Cashflow From Operations (before debt servicing and capex)
YTD3Q FY’06
FY’04FY’03FY’02RM mn

��
AGENDA
� Highlights Of Group’s Performance
� Details Of Group’s Performance
� Update On TNB’s Latest Events
��
� On 3rd July 2006, TNB announced the termination of Conditional Sale of Business Agreement (SBA) for non-fulfillment of Conditions Precedent.
� All deposit paid by TNB pursuant to the terms and conditions of the SBA and all interest earned to be returned.
� TNB will be exploring with the Vendors on a no-obligation basis alternative business arrangements or agreements in respect of the assets of NUR including the purchase of its transmission and distribution facilities.
Proposed Acquisition Of Business And Business Assets of Northern Utility Resources (“NUR”)
��
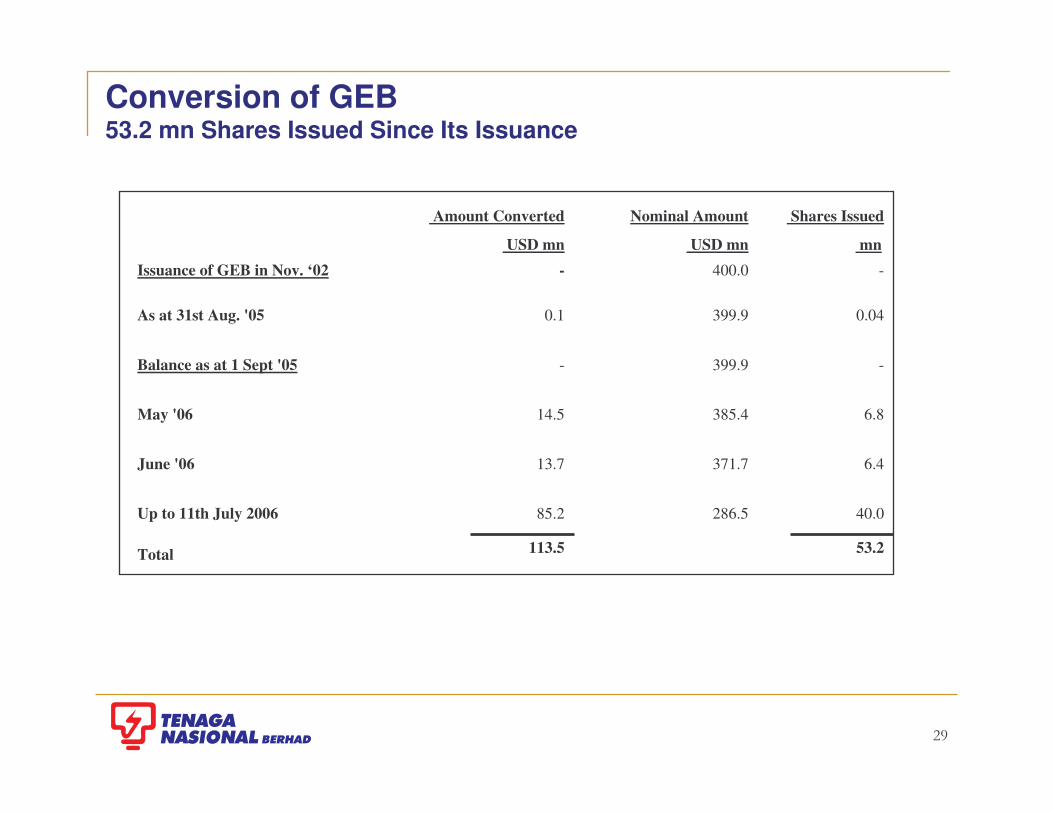
Conversion of GEB 53.2 mn Shares Issued Since Its Issuance
53.2 113.5 Total
40.0286.585.2 Up to 11th July 2006
6.4 371.7 13.7 June '06
6.8 385.4 14.5May '06
-399.9-Balance as at 1 Sept '05
0.04 399.90.1 As at 31st Aug. '05
-400.0 -Issuance of GEB in Nov. ‘02mnUSD mnUSD mn
Shares IssuedNominal Amount Amount Converted

�
`
Unloc
king
Val
ue T
hrou
gh A
Per
form
ance
Driven
Cul
ture
May ‘04Government’s Initiative To Restructure GLC’s
New Appointments At GLC’s With Set Mission
Internal Restructuring Of Organisation
Performance Indicators Focusing On Cost Rationalisation,
Improving Efficiency & Identifying New Growth Avenues
Execution, Execution & Execution
Improved Financial & Operational Performance
Tariff Review
“Rerating”Of Tenaga
July ‘04
Sept ‘04
Nov ‘04
Jan ‘05
We Stand by Our Commitment - To Improve Shareholder Value
In Summary
June ‘06
On going

�
Thank You
Powering The Nation’s Progress
www.tnb.com.my