temporal variability of carbon recycling in coastal
TRANSCRIPT
HAL Id: hal-02881057https://hal.archives-ouvertes.fr/hal-02881057
Submitted on 29 Jun 2020
HAL is a multi-disciplinary open accessarchive for the deposit and dissemination of sci-entific research documents, whether they are pub-lished or not. The documents may come fromteaching and research institutions in France orabroad, or from public or private research centers.
L’archive ouverte pluridisciplinaire HAL, estdestinée au dépôt et à la diffusion de documentsscientifiques de niveau recherche, publiés ou non,émanant des établissements d’enseignement et derecherche français ou étrangers, des laboratoirespublics ou privés.
Temporal variability of carbon recycling in coastalsediments influenced by rivers: assessing the impact of
flood inputs in the Rhône River prodeltaC. Cathalot, C. Rabouille, L. Pastor, B. Deflandre, E. Viollier, R. Buscail, A.
Grémare, C. Treignier, A.M. Pruski
To cite this version:C. Cathalot, C. Rabouille, L. Pastor, B. Deflandre, E. Viollier, et al.. Temporal variability of carbonrecycling in coastal sediments influenced by rivers: assessing the impact of flood inputs in the RhôneRiver prodelta. Biogeosciences, European Geosciences Union, 2010, 7 (3), pp.1187-1205. �10.5194/bg-7-1187-2010�. �hal-02881057�
Biogeosciences, 7, 1187–1205, 2010www.biogeosciences.net/7/1187/2010/© Author(s) 2010. This work is distributed underthe Creative Commons Attribution 3.0 License.
Biogeosciences
Temporal variability of carbon recycling in coastal sedimentsinfluenced by rivers: assessing the impact of flood inputs in theRhone River prodelta
C. Cathalot1, C. Rabouille1, L. Pastor2, B. Deflandre2,3, E. Viollier 2, R. Buscail4, A. Gr emare3, C. Treignier1, andA. Pruski5,6
1Laboratoire des Sciences du Climat et de l’Environnement, UMR 8212, CEA-CNRS/INSU-UVSQ Gif-sur-Yvette, France2Laboratoire de Geochimie des Eaux, IPGP & Universite Paris Diderot, Paris, France3Laboratoire Environnements et Paleoenvironnements Oceaniques, Universite Bordeaux 1, France4Centre de Formation et de Recherche sur l’Environnement Marin, Perpignan, France5LECOB, UPMC Univ Paris 06, FRE 3350, Observatoire Oceanologique, Banyuls/mer, France6LECOB, CNRS, FRE 3350, Observatoire Oceanologique, Banyuls/mer, France
Received: 9 October 2009 – Published in Biogeosciences Discuss.: 17 November 2009Revised: 17 March 2010 – Accepted: 19 March 2010 – Published: 31 March 2010
Abstract. River deltas are particularly important in the ma-rine carbon cycle as they represent the transition between ter-restrial and marine carbon: linked to major burial zones, theyare reprocessing zones where large carbon fluxes can be min-eralized. In order to estimate this mineralization, sedimentoxygen uptake rates were measured in continental shelf sedi-ments and river prodelta over different seasons near the outletof the Rhone River in the Mediterranean Sea. On a selectedset of 10 stations in the river prodelta and nearby continentalshelf, in situ diffusive oxygen uptake (DOU) and laboratorytotal oxygen uptake (TOU) measurements were performedin early spring and summer 2007 and late spring and win-ter 2008. In and ex situ DOU did not show any significantdifferences except for shallowest organic rich stations. Sed-iment DOU rates show highest values concentrated close tothe river mouth (approx. 20 mmol O2 m−2 d−1) and decreaseoffshore to values around 4.5 mmol O2 m−2 d−1 with lowestgradients in a south west direction linked to the preferen-tial transport of the finest riverine material. Core incuba-tion TOU showed the same spatial pattern with an averagedTOU/DOU ratio of 1.2±0.4. Temporal variations of sedi-ment DOU over different sampling periods, spring summerand late fall, were limited and benthic mineralization ratespresented a stable spatial pattern.
Correspondence to:C. Cathalot([email protected])
A flood of the Rhone River occurred in June 2008 and de-livered up to 30 cm of new soft muddy deposit. Immedi-ately after this flood, sediment DOU rates close to the rivermouth dropped from around 15–20 mmol O2 m−2 d−1 to val-ues close to 10 mmol O2 m−2 d−1, in response to the deposi-tion near the river outlet of low reactivity organic matter as-sociated to fine material. Six months later, the oxygen distri-bution had relaxed back to its initial stage: the initial spatialdistribution was found again underlining the active microbialdegradation rates involved and the role of further deposits.These results highlight the immediate response of the sedi-ment oxygen system to flood deposit and the rapid relaxationof this system towards its initial state (6 months or less) po-tentially linked to further deposits of reactive material.
1 Introduction
River dominated shelves represent a dynamic interface link-ing land and ocean biogeochemical cycles of relevant ele-ments such as Organic Carbon (OC) (Hedges, 1992; Gattusoet al., 1998; McKee et al., 2004). They are productive areassustained by high inputs of nutrients and terrestrial material(Dagg et al., 2004), characterized by a tight pelagic-benthiccoupling and active benthic mineralization rates (Smith andHollibaugh, 1993). Indeed, over 50% of all organic car-bon burial in the ocean takes place in continental margins(Hedges and Keil, 1995). In addition, it is estimated that
Published by Copernicus Publications on behalf of the European Geosciences Union.
1188 C. Cathalot et al.: Temporal variability of carbon recycling in coastal sediments
up to 70% of the 0.15×10¹⁵ gC of particulate OC annuallydischarged from rivers to ocean is oxidized in these areas(Hedges et al., 1997; Burdige, 2005; Galy et al., 2007; Mey-beck, 1982).
River inputs to the coastal ocean are highly variable overtime, shifting from flood and high sediment supply to low-river discharge (Wheatcroft and Borgeld, 2000). This vari-ability causes a non-stationary OC deposition in deltas andprodeltas (Bentley and Nittrouer, 2003; McKee et al., 2004).Post-depositional processes such as physical (winnowing)and biological (bioturbation) reworking can also affect theorganic matter reaching the sea floor in these environments(Rabouille et al., 2003). OC oxidation in sediments is cou-pled to the utilization of terminal electron acceptors: withthe highest free energy yield, oxygen is first consumed byaerobic bacteria in the sedimentary column (Froelich et al.,1979). Oxygen distribution in sediments also reflects chemi-cal reactions (oxidation of reduced species). Integrating ben-thic microbial respiration and reoxidation of anoxic reducedcompounds, oxygen consumption by marine sediments isthus a good proxy to estimate benthic metabolism and OCmineralization rates and their variability over time and spacein river dominated environments (Rabouille et al., 2003;Glud et al., 2000, 2003; Lansard et al., 2003; Cai et al.,1995). River flood may modify the sediment mineralizationof organic matter by introducing large quantities of terrige-neous organic carbon with various reactivities and favour itspreservation in shallow coastal environments (Leithold andHope, 1999). Tesi et al. (2008) showed evidence of majorchanges in the biogeochemical composition and reactivity ofsedimentary organic matter in a flood deposit in the Po Riverprodelta. Furthermore, the retention capacity of flood inputsin estuaries is variable: some estuaries may retain only 20%of the flood inputs in the innershore region (Lisitsyn, 1995;Sommerfield and Nittrouer, 1999), while other larger systemslike the Atchafalaya River may act as efficient traps for floodinputs (Allison et al., 2000). It appears that (i) the responseto flood events of continental margins at river outlets seemsto be system-dependant and (ii) the parameters driving thesediment response are largely unknown. For instance, littleis known about the partitioning between burial and recyclingunder normal and flood discharge rates regimes at the river-sea interface. Given the high OC sequestration and oxidationpotential of river dominated margins at a global scale (Blairet al., 2004; Burdige, 2005), it is therefore critical to assessthe behaviour of the benthic system after a flood event, andespecially the dynamics of its OC degradation activity.
Since the damming of the Nile, the Rhone River is themost important freshwater input of the Mediterranean Seaboth in terms of water and particle discharges (Pont et al.,2002; Copin-Montegut, 1993). Its influence over the conti-nental shelf of the Gulf of Lions has been widely documented(Monaco et al., 1999; De Madron et al., 2000, 2003; Sempereet al., 2000). Recently, Lansard et al. (2009) proposed a firstsnapshot of the oxygen uptake rates in the continental shelf
sediments off the Rhone River mouth and observed a specificpattern with high sediment uptake rates near the outlet withan exponential gradient offshore.
Yet the evolution of this pattern of organic carbon recy-cling in sediments during the annual cycle and under floodconditions is completely unknown. In particular, floods arelikely to play a major role in this dynamics since they can ac-count up to 80% of the particles input from the Rhone Riverto the Mediterranean Sea (Antonelli et al., 2008). It has beenproposed using a modelling approach that the Rhone Riverprodelta acts as a deposit centre for flood inputs (Ulses et al.,2008). Consequently, Rhone River flood events influence therecycling of organic matter in the river prodelta and alter thefiltering capacity of river particulate inputs.
In this paper, we present oxygen uptake rates from a sea-sonal survey of the sediments in the Rhone River prodeltaand adjacent shelf. The same stations were visited four timesbetween April 2007 and December 2008, including a RhoneRiver flood period in June 2008. Transient evolution of thespatial pattern of the sediment oxygen uptake in the prodeltawas investigated using in situ and laboratory measurements.As proxies of organic matter quality, OC and Chlorophylla
(Chl a) contents in surface sediments also brought insightson the existing links between flood deposit lability, OC sed-iment degradation and the transitory processes involved be-tween both. We discuss the effect of flood inputs and sea-sonal changes on the prodelta filtering capacity and the dy-namics of oxygen and organic carbon in sediments after flooddeposition.
2 Material and methods
2.1 Study area
The Gulf of Lions is a large continental shelf located inthe NW Mediterranean Sea. The North Western Mediter-ranean current flows southwestward along the slope and im-poses a general cyclonic circulation. The water columnis seasonally stratified, but intense vertical mixing events,which induce major nutrient export, occur during strongregional winds outbursts (Millot, 1990; de Madron et al.,1999). The Gulf of Lions is a microtidal sea and the mod-erate wave-energy is swell-dominated. The Rhone Riverhas a drainage basin of 97 800 km2, a mean water flow of1700 m3 s−1, and an annual particulate organic carbon dis-charge of 19.2±6×10⁴ tC/an (Sempere et al., 2000). TheRhone River is thus the main source of freshwater, nutrientsand organics for the Gulf of Lions (Sempere et al., 2000;Pont et al., 2002; De Madron et al., 2000). The hydrologi-cal regime of the Rhone River shows strong seasonal contrastwith a large difference between low (<500 m3 s−1) and high(>3000 m3 s−1) water-discharge (Pont et al., 2002). Largeamounts of terrestrial muddy sediments accumulate in thewide prodelta off the Rhone river mouth, extending then
Biogeosciences, 7, 1187–1205, 2010 www.biogeosciences.net/7/1187/2010/
C. Cathalot et al.: Temporal variability of carbon recycling in coastal sediments 1189
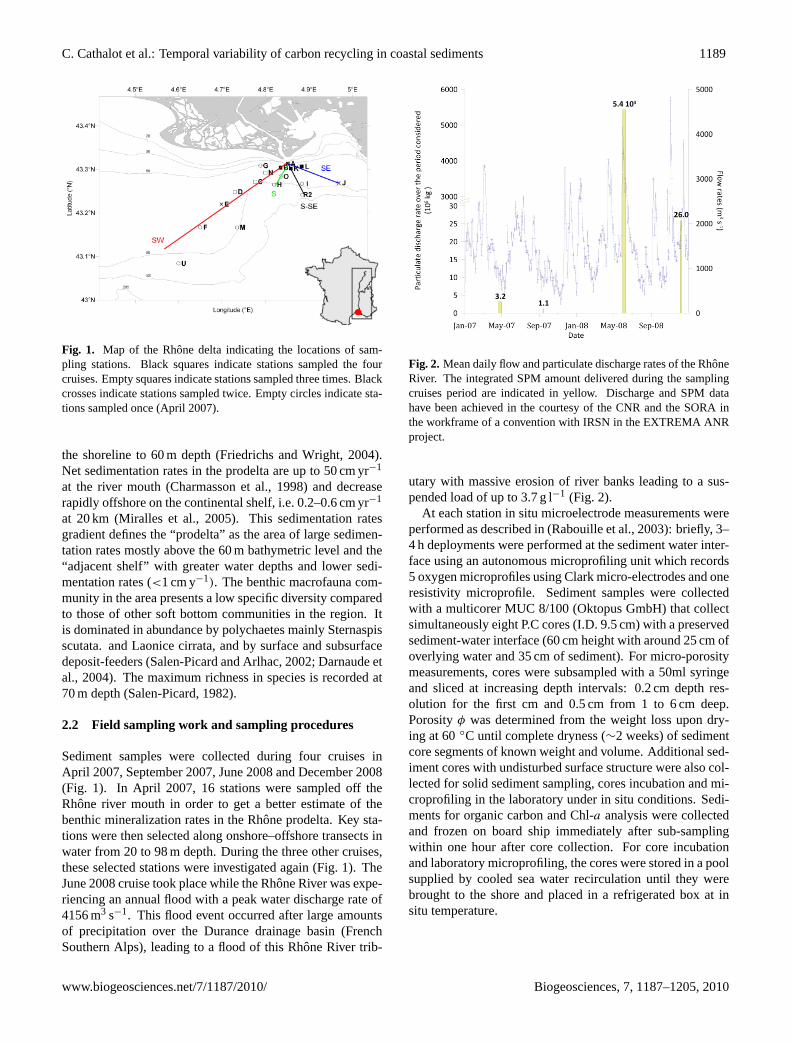
Fig. 1. Map of the Rhone delta indicating the locations of sam-pling stations. Black squares indicate stations sampled the fourcruises. Empty squares indicate stations sampled three times. Blackcrosses indicate stations sampled twice. Empty circles indicate sta-tions sampled once (April 2007).
the shoreline to 60 m depth (Friedrichs and Wright, 2004).Net sedimentation rates in the prodelta are up to 50 cm yr−1
at the river mouth (Charmasson et al., 1998) and decreaserapidly offshore on the continental shelf, i.e. 0.2–0.6 cm yr−1
at 20 km (Miralles et al., 2005). This sedimentation ratesgradient defines the “prodelta” as the area of large sedimen-tation rates mostly above the 60 m bathymetric level and the“adjacent shelf” with greater water depths and lower sedi-mentation rates (<1 cm y−1). The benthic macrofauna com-munity in the area presents a low specific diversity comparedto those of other soft bottom communities in the region. Itis dominated in abundance by polychaetes mainly Sternaspisscutata. and Laonice cirrata, and by surface and subsurfacedeposit-feeders (Salen-Picard and Arlhac, 2002; Darnaude etal., 2004). The maximum richness in species is recorded at70 m depth (Salen-Picard, 1982).
2.2 Field sampling work and sampling procedures
Sediment samples were collected during four cruises inApril 2007, September 2007, June 2008 and December 2008(Fig. 1). In April 2007, 16 stations were sampled off theRhone river mouth in order to get a better estimate of thebenthic mineralization rates in the Rhone prodelta. Key sta-tions were then selected along onshore–offshore transects inwater from 20 to 98 m depth. During the three other cruises,these selected stations were investigated again (Fig. 1). TheJune 2008 cruise took place while the Rhone River was expe-riencing an annual flood with a peak water discharge rate of4156 m3 s−1. This flood event occurred after large amountsof precipitation over the Durance drainage basin (FrenchSouthern Alps), leading to a flood of this Rhone River trib-
Fig. 2. Mean daily flow and particulate discharge rates of the RhoneRiver. The integrated SPM amount delivered during the samplingcruises period are indicated in yellow. Discharge and SPM datahave been achieved in the courtesy of the CNR and the SORA inthe workframe of a convention with IRSN in the EXTREMA ANRproject.
utary with massive erosion of river banks leading to a sus-pended load of up to 3.7 g l−1 (Fig. 2).
At each station in situ microelectrode measurements wereperformed as described in (Rabouille et al., 2003): briefly, 3–4 h deployments were performed at the sediment water inter-face using an autonomous microprofiling unit which records5 oxygen microprofiles using Clark micro-electrodes and oneresistivity microprofile. Sediment samples were collectedwith a multicorer MUC 8/100 (Oktopus GmbH) that collectsimultaneously eight P.C cores (I.D. 9.5 cm) with a preservedsediment-water interface (60 cm height with around 25 cm ofoverlying water and 35 cm of sediment). For micro-porositymeasurements, cores were subsampled with a 50ml syringeand sliced at increasing depth intervals: 0.2 cm depth res-olution for the first cm and 0.5 cm from 1 to 6 cm deep.Porosityφ was determined from the weight loss upon dry-ing at 60◦C until complete dryness (∼2 weeks) of sedimentcore segments of known weight and volume. Additional sed-iment cores with undisturbed surface structure were also col-lected for solid sediment sampling, cores incubation and mi-croprofiling in the laboratory under in situ conditions. Sedi-ments for organic carbon and Chl-a analysis were collectedand frozen on board ship immediately after sub-samplingwithin one hour after core collection. For core incubationand laboratory microprofiling, the cores were stored in a poolsupplied by cooled sea water recirculation until they werebrought to the shore and placed in a refrigerated box at insitu temperature.
www.biogeosciences.net/7/1187/2010/ Biogeosciences, 7, 1187–1205, 2010
1190 C. Cathalot et al.: Temporal variability of carbon recycling in coastal sediments
Bottom-water was sampled at 2 m above bottom by aNiskin bottle for determination of temperature and dissolvedoxygen (Table 1).
In addition, a coring station (43◦18.420 N, 4◦51.320 E,water depth: 45 m) was selected to monitor the evolution offlood deposits off the Rhone River mouth. Sediment coreswere therefore collected four times at this station in June,September, October and December 2008. The cruise in De-cember 2008 followed an annual flood that brought new ma-terial. Significant wave heights in 2008 in this area fromJune to December 2008 were acquired from the CANDHISdatabase of in situ wave height measurements.
For each cruise, immediately after sampling, a classicalsedimentological inspection of the core was performed, de-scribing the different visible layers. Sediments were thensectioned into slices and stored at−20◦C for further OCanalyses. Vertical resolutions were: 0.5 cm in the first topcentimetre, 1 cm down to 20 cm, and 2 cm deeper in the core.
In June 2008, in order to describe the redox front in theflood deposit, redox potential measurements were performedon the core right after its retrieval. The redox potential (Eh inmV) was obtained with a pH/redox meter (Knick apparatusand Ingold platinum electrode). Measurements were takensuccessively over the first cm and in the whole sedimentarycolumn at 2 cm intervals (the P. C. core was equipped with aremovable side panel).
2.3 Organic carbon content analysis
OC contents were analysed using milled, freeze-dried sedi-ments. Surface OC content was determined on the 0–0.5 cmtop layer of the sediment. Organic carbon concentrationswere measured on homogeneised, precisely weighed sub-samples in an automatic CN – analyser LECO 2000, after incups acidification with 2N HCl (overnight, at 50◦C) in orderto remove carbonates prior to the analyses of OC (Cauwet etal., 1990). The precision for OC was 2%.
2.4 Pigment analysis
Surface sediments (0–0.5 cm layer) were rapidly thawed and100 mg were extracted overnight in 5 ml of acetone at 5◦C inthe dark. Adjustment was made for sediment water contentto obtain a final acetone degree of 90%. The fluorescence ofthe sediment extracts was measured on a LS 55 spectroflu-orimeter (Perkin Elmer Inc., USA) according to the methoddeveloped by Neveux and Lantoine (1993). Uncertainty onthe pigments content was lower than 1%. For each station,the analyses were performed on three cores and in triplicates(i.e. 9 independent extracts). Data are expressed as weightper gram dry sediment.
2.5 Grain size measurement
Sediment granulometry was assessed using a Malvern Mas-tersizer 2000 laser microgranulometer. Grain size is given as
the d(0.5), which corresponds to the median of the size distri-bution based on the equivalent spherical volume diameters.
2.6 Microelectrode measurements
The 200 µm resolution O2 and resistivity in situ profiles wereobtained by a benthic microprofiler (Unisense®) equippedwith 4–5 O2 microelectrodes and 1 resistivity sensor. Theprofiling unit was mounted on an autonomous tripodal frame.
Ex situ measurements of O2 microprofiles were performedin a thermostated bath maintained at in situ sampling tem-perature. Up to 15 steady-state O2 microprofiles (50–100 µmresolution) were completed within 6 h after sampling. Con-servation of overlying water oxygenation was achieved by asoft bubbling system.
Dissolved oxygen concentration was measured by oxygenmicroelectrodes (Unisense®) provided with a built-in refer-ence and an internal guard cathode (Revsbech, 1989). TheO2 microsensors had tip outer diameters of 50–100 µm, a stir-ring sensitivity of<1%, a 90% response time<10 s, and lessthan 2% per hour current drift. The electrode signals wererecorded in the overlying-water before and after each profileto assess the stability of the measurements. We used a linearcalibration for the microelectrodes, between the bottom wa-ter oxygen content estimated by Winkler titration (Grasshoffet al., 1983) and the anoxic zone of the sediment.
The location of the sediment-water interface relative to thein situ oxygen profiles was determined from O2 micropro-files. We used the classical method which consists in as-signing the interface location to a break in the oxygen con-centration gradient. The observed change of slope is due tothe increased diffusion coefficient in the sediment comparedto the diffusive boundary layer (DBL) (Jorgensen and Revs-bech, 1985; Revsbech, 1989; Sweerts et al., 1989). In someprofiles, the slope break was not clearly visible: they ratherdisplayed a steady increase of the slope towards a maximumwithin the first millimeter below the initial concentration de-crease. In these cases, we adopted the position of this maxi-mum gradient as the sediment-water interface. Oxygen pene-tration depth was determined from the O2 profile and was as-signed to the depth where the microelectrode signal reachedthe zero current.
Resistivity measurements were carried out with an elec-trode similar to the one described by Andrews and Ben-nett (1981). Four thin parallel wires were buried in a ma-trix of epoxy, with only their tips in electrical contact withseawater. The resistivity sensor has a rectangular section of10×3 mm and is edged at the lower end. Recordings weremade at 200 µm as for the oxygen but the pertinent resolu-tion is certainly around 1 mm due to the shape of the sensor(Rabouille et al., 2003; Andrews and Bennett, 1981). Voltageoutputs were calibrated to resistivity with standard KCl solu-tions, and the resistivity recordings were converted to inverseformation factor values by the formulation of Berner (1980):
F−1= Rbw/Rz (1)
Biogeosciences, 7, 1187–1205, 2010 www.biogeosciences.net/7/1187/2010/
C. Cathalot et al.: Temporal variability of carbon recycling in coastal sediments 1191
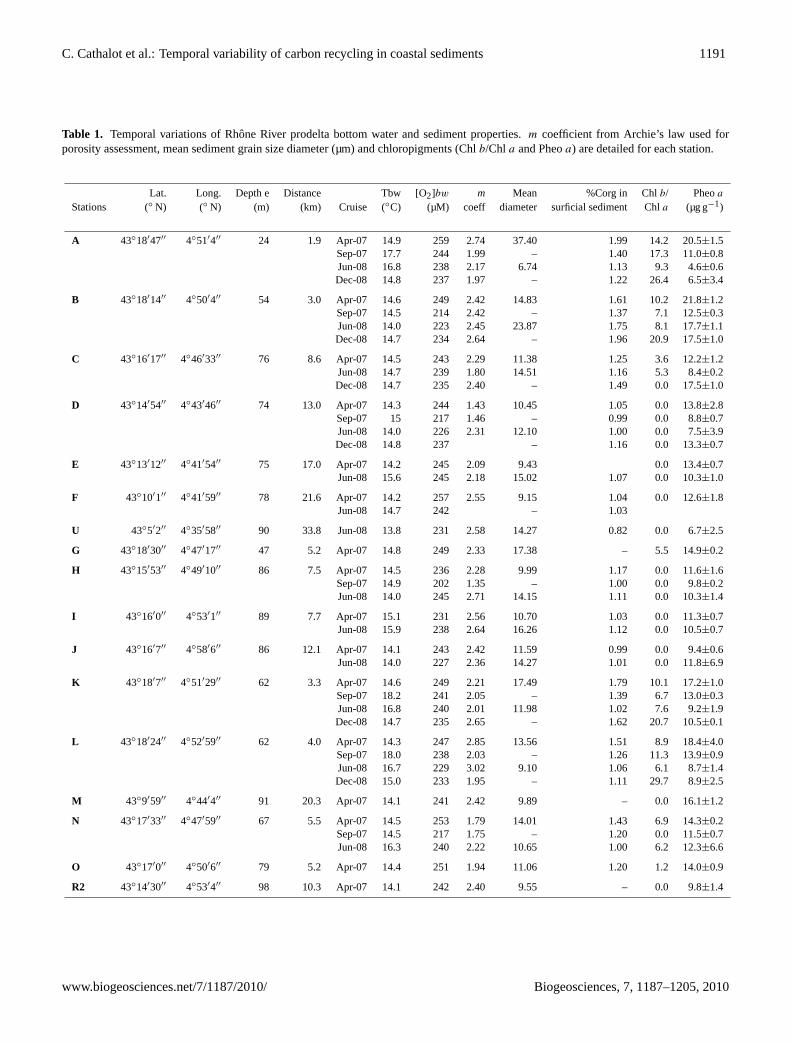
Table 1. Temporal variations of Rhone River prodelta bottom water and sediment properties.m coefficient from Archie’s law used forporosity assessment, mean sediment grain size diameter (µm) and chloropigments (Chlb/Chl a and Pheoa) are detailed for each station.
Lat. Long. Depth e Distance Tbw [O2]bw m Mean %Corg in Chlb/ PheoaStations (◦ N) (◦ N) (m) (km) Cruise (◦C) (µM) coeff diameter surficial sediment Chla (µg g−1)
A 43◦18′47′′ 4◦51′4′′ 24 1.9 Apr-07 14.9 259 2.74 37.40 1.99 14.2 20.5±1.5Sep-07 17.7 244 1.99 – 1.40 17.3 11.0±0.8Jun-08 16.8 238 2.17 6.74 1.13 9.3 4.6±0.6Dec-08 14.8 237 1.97 – 1.22 26.4 6.5±3.4
B 43◦18′14′′ 4◦50′4′′ 54 3.0 Apr-07 14.6 249 2.42 14.83 1.61 10.2 21.8±1.2Sep-07 14.5 214 2.42 – 1.37 7.1 12.5±0.3Jun-08 14.0 223 2.45 23.87 1.75 8.1 17.7±1.1Dec-08 14.7 234 2.64 – 1.96 20.9 17.5±1.0
C 43◦16′17′′ 4◦46′33′′ 76 8.6 Apr-07 14.5 243 2.29 11.38 1.25 3.6 12.2±1.2Jun-08 14.7 239 1.80 14.51 1.16 5.3 8.4±0.2Dec-08 14.7 235 2.40 – 1.49 0.0 17.5±1.0
D 43◦14′54′′ 4◦43′46′′ 74 13.0 Apr-07 14.3 244 1.43 10.45 1.05 0.0 13.8±2.8Sep-07 15 217 1.46 – 0.99 0.0 8.8±0.7Jun-08 14.0 226 2.31 12.10 1.00 0.0 7.5±3.9Dec-08 14.8 237 – 1.16 0.0 13.3±0.7
E 43◦13′12′′ 4◦41′54′′ 75 17.0 Apr-07 14.2 245 2.09 9.43 0.0 13.4±0.7Jun-08 15.6 245 2.18 15.02 1.07 0.0 10.3±1.0
F 43◦10′1′′ 4◦41′59′′ 78 21.6 Apr-07 14.2 257 2.55 9.15 1.04 0.0 12.6±1.8Jun-08 14.7 242 – 1.03
U 43◦5′2′′ 4◦35′58′′ 90 33.8 Jun-08 13.8 231 2.58 14.27 0.82 0.0 6.7±2.5
G 43◦18′30′′ 4◦47′17′′ 47 5.2 Apr-07 14.8 249 2.33 17.38 – 5.5 14.9±0.2
H 43◦15′53′′ 4◦49′10′′ 86 7.5 Apr-07 14.5 236 2.28 9.99 1.17 0.0 11.6±1.6Sep-07 14.9 202 1.35 – 1.00 0.0 9.8±0.2Jun-08 14.0 245 2.71 14.15 1.11 0.0 10.3±1.4
I 43◦16′0′′ 4◦53′1′′ 89 7.7 Apr-07 15.1 231 2.56 10.70 1.03 0.0 11.3±0.7Jun-08 15.9 238 2.64 16.26 1.12 0.0 10.5±0.7
J 43◦16′7′′ 4◦58′6′′ 86 12.1 Apr-07 14.1 243 2.42 11.59 0.99 0.0 9.4±0.6Jun-08 14.0 227 2.36 14.27 1.01 0.0 11.8±6.9
K 43◦18′7′′ 4◦51′29′′ 62 3.3 Apr-07 14.6 249 2.21 17.49 1.79 10.1 17.2±1.0Sep-07 18.2 241 2.05 – 1.39 6.7 13.0±0.3Jun-08 16.8 240 2.01 11.98 1.02 7.6 9.2±1.9Dec-08 14.7 235 2.65 – 1.62 20.7 10.5±0.1
L 43◦18′24′′ 4◦52′59′′ 62 4.0 Apr-07 14.3 247 2.85 13.56 1.51 8.9 18.4±4.0Sep-07 18.0 238 2.03 – 1.26 11.3 13.9±0.9Jun-08 16.7 229 3.02 9.10 1.06 6.1 8.7±1.4Dec-08 15.0 233 1.95 – 1.11 29.7 8.9±2.5
M 43◦9′59′′ 4◦44′4′′ 91 20.3 Apr-07 14.1 241 2.42 9.89 – 0.0 16.1±1.2
N 43◦17′33′′ 4◦47′59′′ 67 5.5 Apr-07 14.5 253 1.79 14.01 1.43 6.9 14.3±0.2Sep-07 14.5 217 1.75 – 1.20 0.0 11.5±0.7Jun-08 16.3 240 2.22 10.65 1.00 6.2 12.3±6.6
O 43◦17′0′′ 4◦50′6′′ 79 5.2 Apr-07 14.4 251 1.94 11.06 1.20 1.2 14.0±0.9
R2 43◦14′30′′ 4◦53′4′′ 98 10.3 Apr-07 14.1 242 2.40 9.55 – 0.0 9.8±1.4
www.biogeosciences.net/7/1187/2010/ Biogeosciences, 7, 1187–1205, 2010
1192 C. Cathalot et al.: Temporal variability of carbon recycling in coastal sediments
WhereRbw is the average resistivity in the bottom water andRz is the mean resistivity at given depthz.
We calculated then a porosity profile by convertingF−1
values using the empirical Archie’s relation:
F−1= φm (2)
Whereφ is the porosity andm is an experimental factor usu-ally ranging from to 2 to 3.m was determined for each sta-tion as corresponding to the best least square fit to the mea-sured porosity profile (through an Microsoft Excel® solverroutine).
2.7 Sediment diffusive oxygen fluxes calculations
Sediment oxygen consumption rates were estimated fromO2 microprofiles by two ways. Diffusive oxygen uptake(DOU) was calculated from O2 concentration gradients at thesediment–water interface by using the 1-D Fick’s first law of
diffusion: DOU= ϕ Ds
[dO2dx
]x=0
whereφ is the porosity,
Ds is the O2 diffusion coefficient within the sediment and[dO2dx
]x=0
is the oxygen gradient just below the sediment–
water interface (estimated from the profiles).Ds was es-timated asDs =
D0O21+3(1−ϕ)
(Iversen and Jorgensen, 1993).
D0O2is the molecular diffusion coefficient of O2 (cm2 s−1)
at in situ temperature, salinity and hydrostatic pressure andwas evaluated using tables from Broecker and Peng (1974).
We also used the numerical model PROFILE (Berg et al.,1998), which calculates the consumption rates with depth byadjusting a calculated oxygen profile to the observed one. Itallowed us to determine the location of oxygen productionand oxygen consumption layers, the extent of these zones,and the resulting fluxes across the sediment-water interface.The two boundary conditions used for the calculations corre-spond to the zero oxygen concentration and flux at the bottomof the oxic zone.
2.8 Sediment core incubation and total oxygen uptakemeasurements
Immediately after retrieval, 3 sediment cores with undis-turbed interface were selected per station and placed in arefrigerated box at in situ temperature back to the labora-tory. Once sealed, overlying water was kept homogenised bya rotating floating magnet fixed to the upper core cap. Darkincubations started within 6 h after sampling. Every 2–4 h,50 ml of the overlying water was sampled and replaced withthe same volume of filtered bottom water (Denis et al., 2001;Hulth et al., 1997) We determined the oxygen concentrationin the overlying water of each core and the filtered bottomwater by Winkler titration (Grasshoff et al., 1983). Samplingintervals and incubation duration were adjusted so that oxy-gen concentration in the overlying water did not decrease bymore than 20–30% of the initial concentration. TOU was
calculated from concentration change of oxygen in the over-lying water with incubation time, after correction had beenmade for input of replacement water. This approach allowedthe determination of TOU with only a small deviation fromthe ambient bottom water concentrations in the overlying wa-ter.
2.9 Statistical calculation
Non parametric Wilcoxon signed rank tests were used to as-sess statistical differences between in situ vs. ex situ DOUand OPD. These tests were performed on the mean in and exsitu DOU and OPD recorded for any combination of cruisesand stations.
Significance of temporal changes in in situ DOU at eachstation was assessed using non parametric Kruskal-WallisANOVAs (when stations had been sampled more than twice),or Mann and Whitney U tests (when stations had been sam-pled only twice).
A two way analysis of variance (ANOVA) was carried outto test for temporal and depth differences in sedimentary OCcontent among sampling periods (June, September, Octoberand December) and deposit layers (sediment depth).
3 Results
3.1 Porosity: cores measurements and estimation fromF−1
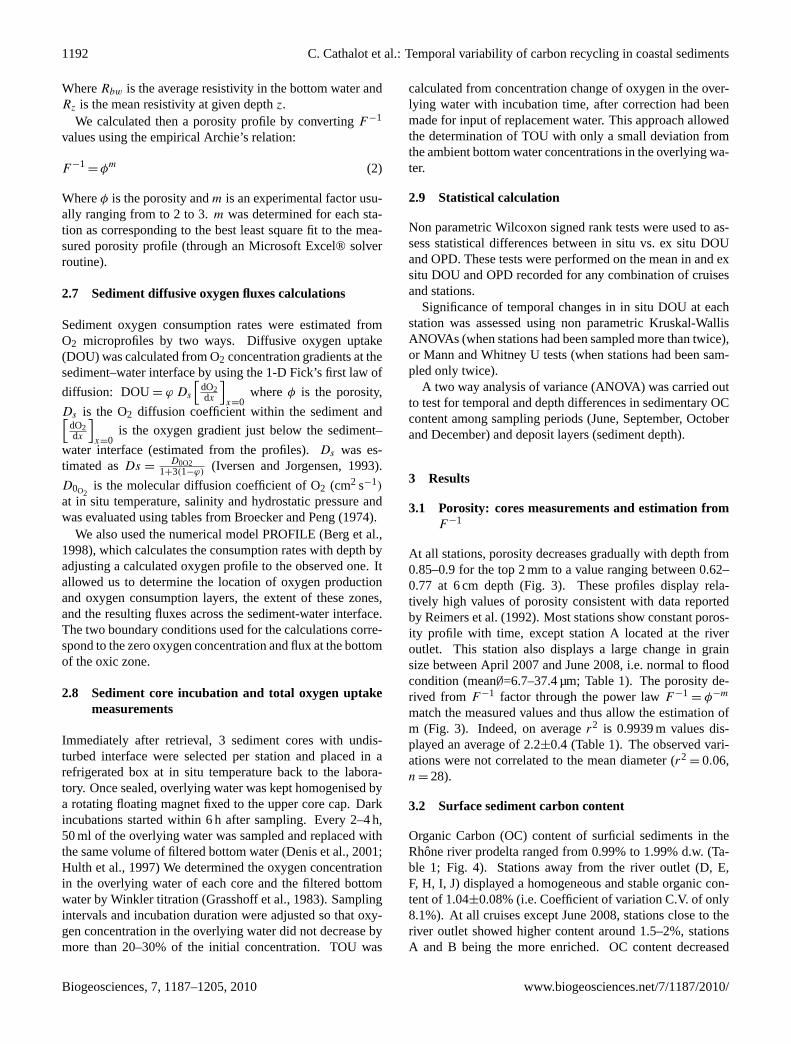
At all stations, porosity decreases gradually with depth from0.85–0.9 for the top 2 mm to a value ranging between 0.62–0.77 at 6 cm depth (Fig. 3). These profiles display rela-tively high values of porosity consistent with data reportedby Reimers et al. (1992). Most stations show constant poros-ity profile with time, except station A located at the riveroutlet. This station also displays a large change in grainsize between April 2007 and June 2008, i.e. normal to floodcondition (mean∅=6.7–37.4 µm; Table 1). The porosity de-rived from F−1 factor through the power lawF−1
= φ−m
match the measured values and thus allow the estimation ofm (Fig. 3). Indeed, on averager2 is 0.9939 m values dis-played an average of 2.2±0.4 (Table 1). The observed vari-ations were not correlated to the mean diameter (r2
= 0.06,n = 28).
3.2 Surface sediment carbon content
Organic Carbon (OC) content of surficial sediments in theRhone river prodelta ranged from 0.99% to 1.99% d.w. (Ta-ble 1; Fig. 4). Stations away from the river outlet (D, E,F, H, I, J) displayed a homogeneous and stable organic con-tent of 1.04±0.08% (i.e. Coefficient of variation C.V. of only8.1%). At all cruises except June 2008, stations close to theriver outlet showed higher content around 1.5–2%, stationsA and B being the more enriched. OC content decreased
Biogeosciences, 7, 1187–1205, 2010 www.biogeosciences.net/7/1187/2010/
C. Cathalot et al.: Temporal variability of carbon recycling in coastal sediments 1193
Fig. 3. Porosity profiles for all stations during all cruises. Data points indicate measured values while thin curves represent the fitted profilesbased on resistivity measurements and Archie’s law (see text for details).
www.biogeosciences.net/7/1187/2010/ Biogeosciences, 7, 1187–1205, 2010
1194 C. Cathalot et al.: Temporal variability of carbon recycling in coastal sediments
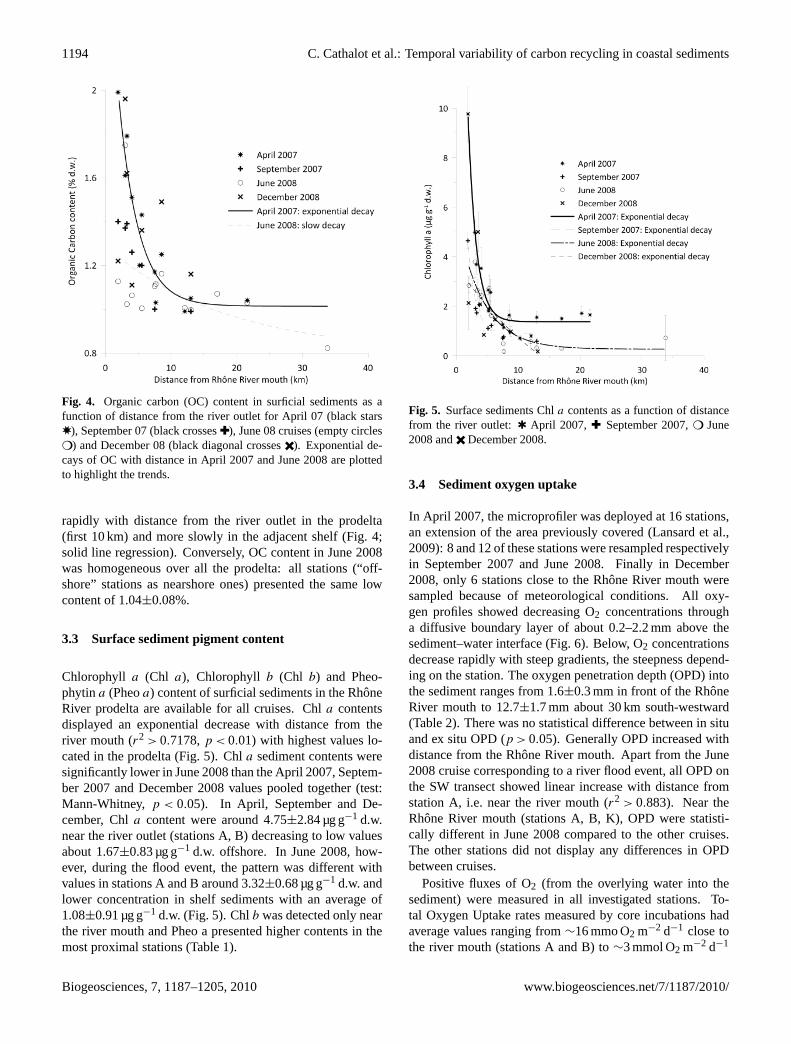
Fig. 4. Organic carbon (OC) content in surficial sediments as afunction of distance from the river outlet for April 07 (black stars✸), September 07 (black crosses✚), June 08 cruises (empty circles❍) and December 08 (black diagonal crosses✖). Exponential de-cays of OC with distance in April 2007 and June 2008 are plottedto highlight the trends.
rapidly with distance from the river outlet in the prodelta(first 10 km) and more slowly in the adjacent shelf (Fig. 4;solid line regression). Conversely, OC content in June 2008was homogeneous over all the prodelta: all stations (“off-shore” stations as nearshore ones) presented the same lowcontent of 1.04±0.08%.
3.3 Surface sediment pigment content
Chlorophyll a (Chl a), Chlorophyll b (Chl b) and Pheo-phytina (Pheoa) content of surficial sediments in the RhoneRiver prodelta are available for all cruises. Chla contentsdisplayed an exponential decrease with distance from theriver mouth (r2 > 0.7178,p < 0.01) with highest values lo-cated in the prodelta (Fig. 5). Chla sediment contents weresignificantly lower in June 2008 than the April 2007, Septem-ber 2007 and December 2008 values pooled together (test:Mann-Whitney,p < 0.05). In April, September and De-cember, Chla content were around 4.75±2.84 µg g−1 d.w.near the river outlet (stations A, B) decreasing to low valuesabout 1.67±0.83 µg g−1 d.w. offshore. In June 2008, how-ever, during the flood event, the pattern was different withvalues in stations A and B around 3.32±0.68 µg g−1 d.w. andlower concentration in shelf sediments with an average of1.08±0.91 µg g−1 d.w. (Fig. 5). Chlb was detected only nearthe river mouth and Pheo a presented higher contents in themost proximal stations (Table 1).
Fig. 5. Surface sediments Chla contents as a function of distancefrom the river outlet:✱ April 2007, ✚ September 2007,❍ June2008 and✖ December 2008.
3.4 Sediment oxygen uptake
In April 2007, the microprofiler was deployed at 16 stations,an extension of the area previously covered (Lansard et al.,2009): 8 and 12 of these stations were resampled respectivelyin September 2007 and June 2008. Finally in December2008, only 6 stations close to the Rhone River mouth weresampled because of meteorological conditions. All oxy-gen profiles showed decreasing O2 concentrations througha diffusive boundary layer of about 0.2–2.2 mm above thesediment–water interface (Fig. 6). Below, O2 concentrationsdecrease rapidly with steep gradients, the steepness depend-ing on the station. The oxygen penetration depth (OPD) intothe sediment ranges from 1.6±0.3 mm in front of the RhoneRiver mouth to 12.7±1.7 mm about 30 km south-westward(Table 2). There was no statistical difference between in situand ex situ OPD (p > 0.05). Generally OPD increased withdistance from the Rhone River mouth. Apart from the June2008 cruise corresponding to a river flood event, all OPD onthe SW transect showed linear increase with distance fromstation A, i.e. near the river mouth (r2 > 0.883). Near theRhone River mouth (stations A, B, K), OPD were statisti-cally different in June 2008 compared to the other cruises.The other stations did not display any differences in OPDbetween cruises.
Positive fluxes of O2 (from the overlying water into thesediment) were measured in all investigated stations. To-tal Oxygen Uptake rates measured by core incubations hadaverage values ranging from∼16 mmo O2 m−2 d−1 close tothe river mouth (stations A and B) to∼3 mmol O2 m−2 d−1
Biogeosciences, 7, 1187–1205, 2010 www.biogeosciences.net/7/1187/2010/
C. Cathalot et al.: Temporal variability of carbon recycling in coastal sediments 1195
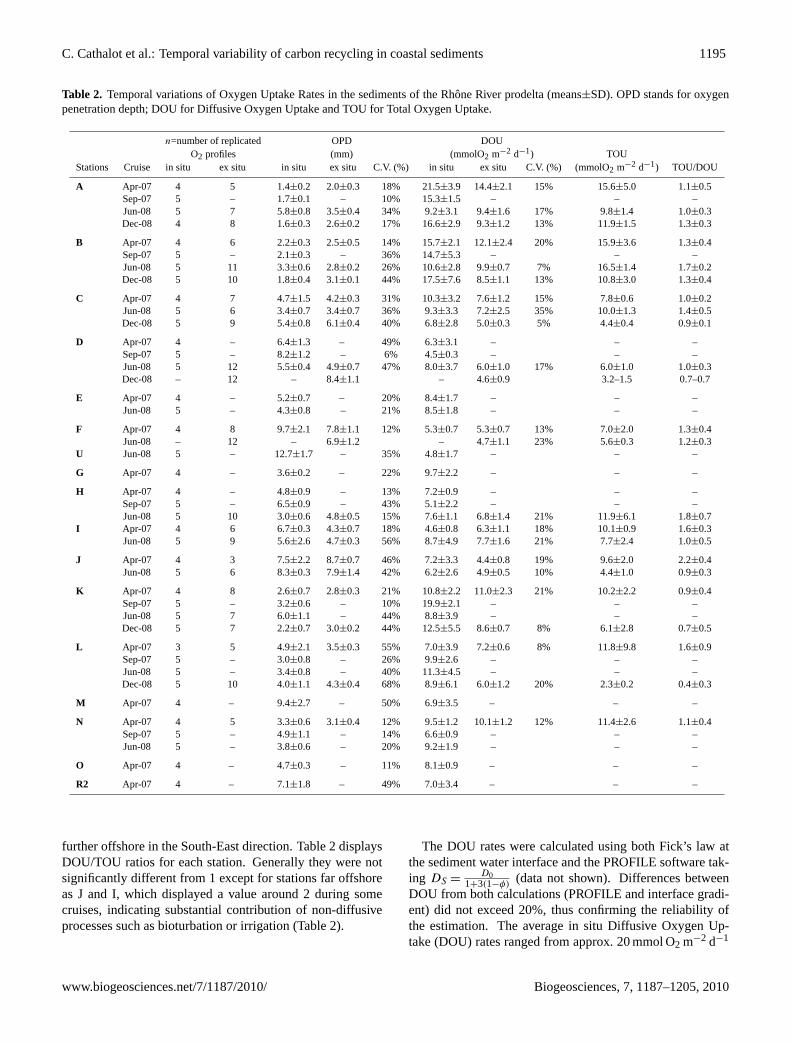
Table 2. Temporal variations of Oxygen Uptake Rates in the sediments of the Rhone River prodelta (means±SD). OPD stands for oxygenpenetration depth; DOU for Diffusive Oxygen Uptake and TOU for Total Oxygen Uptake.
n=number of replicated OPD DOUO2 profiles (mm) (mmolO2 m−2 d−1) TOU
Stations Cruise in situ ex situ in situ ex situ C.V. (%) in situ ex situ C.V. (%) (mmolO2 m−2 d−1) TOU/DOU
A Apr-07 4 5 1.4±0.2 2.0±0.3 18% 21.5±3.9 14.4±2.1 15% 15.6±5.0 1.1±0.5Sep-07 5 – 1.7±0.1 – 10% 15.3±1.5 – – –Jun-08 5 7 5.8±0.8 3.5±0.4 34% 9.2±3.1 9.4±1.6 17% 9.8±1.4 1.0±0.3Dec-08 4 8 1.6±0.3 2.6±0.2 17% 16.6±2.9 9.3±1.2 13% 11.9±1.5 1.3±0.3
B Apr-07 4 6 2.2±0.3 2.5±0.5 14% 15.7±2.1 12.1±2.4 20% 15.9±3.6 1.3±0.4Sep-07 5 – 2.1±0.3 – 36% 14.7±5.3 – – –Jun-08 5 11 3.3±0.6 2.8±0.2 26% 10.6±2.8 9.9±0.7 7% 16.5±1.4 1.7±0.2Dec-08 5 10 1.8±0.4 3.1±0.1 44% 17.5±7.6 8.5±1.1 13% 10.8±3.0 1.3±0.4
C Apr-07 4 7 4.7±1.5 4.2±0.3 31% 10.3±3.2 7.6±1.2 15% 7.8±0.6 1.0±0.2Jun-08 5 6 3.4±0.7 3.4±0.7 36% 9.3±3.3 7.2±2.5 35% 10.0±1.3 1.4±0.5Dec-08 5 9 5.4±0.8 6.1±0.4 40% 6.8±2.8 5.0±0.3 5% 4.4±0.4 0.9±0.1
D Apr-07 4 – 6.4±1.3 – 49% 6.3±3.1 – – –Sep-07 5 – 8.2±1.2 – 6% 4.5±0.3 – – –Jun-08 5 12 5.5±0.4 4.9±0.7 47% 8.0±3.7 6.0±1.0 17% 6.0±1.0 1.0±0.3Dec-08 – 12 – 8.4±1.1 – 4.6±0.9 3.2–1.5 0.7–0.7
E Apr-07 4 – 5.2±0.7 – 20% 8.4±1.7 – – –Jun-08 5 – 4.3±0.8 – 21% 8.5±1.8 – – –
F Apr-07 4 8 9.7±2.1 7.8±1.1 12% 5.3±0.7 5.3±0.7 13% 7.0±2.0 1.3±0.4Jun-08 – 12 – 6.9±1.2 – 4.7±1.1 23% 5.6±0.3 1.2±0.3
U Jun-08 5 – 12.7±1.7 – 35% 4.8±1.7 – – –
G Apr-07 4 – 3.6±0.2 – 22% 9.7±2.2 – – –
H Apr-07 4 – 4.8±0.9 – 13% 7.2±0.9 – – –Sep-07 5 – 6.5±0.9 – 43% 5.1±2.2 – – –Jun-08 5 10 3.0±0.6 4.8±0.5 15% 7.6±1.1 6.8±1.4 21% 11.9±6.1 1.8±0.7
I Apr-07 4 6 6.7±0.3 4.3±0.7 18% 4.6±0.8 6.3±1.1 18% 10.1±0.9 1.6±0.3Jun-08 5 9 5.6±2.6 4.7±0.3 56% 8.7±4.9 7.7±1.6 21% 7.7±2.4 1.0±0.5
J Apr-07 4 3 7.5±2.2 8.7±0.7 46% 7.2±3.3 4.4±0.8 19% 9.6±2.0 2.2±0.4Jun-08 5 6 8.3±0.3 7.9±1.4 42% 6.2±2.6 4.9±0.5 10% 4.4±1.0 0.9±0.3
K Apr-07 4 8 2.6±0.7 2.8±0.3 21% 10.8±2.2 11.0±2.3 21% 10.2±2.2 0.9±0.4Sep-07 5 – 3.2±0.6 – 10% 19.9±2.1 – – –Jun-08 5 7 6.0±1.1 – 44% 8.8±3.9 – – –Dec-08 5 7 2.2±0.7 3.0±0.2 44% 12.5±5.5 8.6±0.7 8% 6.1±2.8 0.7±0.5
L Apr-07 3 5 4.9±2.1 3.5±0.3 55% 7.0±3.9 7.2±0.6 8% 11.8±9.8 1.6±0.9Sep-07 5 – 3.0±0.8 – 26% 9.9±2.6 – – –Jun-08 5 – 3.4±0.8 – 40% 11.3±4.5 – – –Dec-08 5 10 4.0±1.1 4.3±0.4 68% 8.9±6.1 6.0±1.2 20% 2.3±0.2 0.4±0.3
M Apr-07 4 – 9.4±2.7 – 50% 6.9±3.5 – – –
N Apr-07 4 5 3.3±0.6 3.1±0.4 12% 9.5±1.2 10.1±1.2 12% 11.4±2.6 1.1±0.4Sep-07 5 – 4.9±1.1 – 14% 6.6±0.9 – – –Jun-08 5 – 3.8±0.6 – 20% 9.2±1.9 – – –
O Apr-07 4 – 4.7±0.3 – 11% 8.1±0.9 – – –
R2 Apr-07 4 – 7.1±1.8 – 49% 7.0±3.4 – – –
further offshore in the South-East direction. Table 2 displaysDOU/TOU ratios for each station. Generally they were notsignificantly different from 1 except for stations far offshoreas J and I, which displayed a value around 2 during somecruises, indicating substantial contribution of non-diffusiveprocesses such as bioturbation or irrigation (Table 2).
The DOU rates were calculated using both Fick’s law atthe sediment water interface and the PROFILE software tak-ing DS =
D01+3(1−φ)
(data not shown). Differences betweenDOU from both calculations (PROFILE and interface gradi-ent) did not exceed 20%, thus confirming the reliability ofthe estimation. The average in situ Diffusive Oxygen Up-take (DOU) rates ranged from approx. 20 mmol O2 m−2 d−1
www.biogeosciences.net/7/1187/2010/ Biogeosciences, 7, 1187–1205, 2010

1196 C. Cathalot et al.: Temporal variability of carbon recycling in coastal sediments
Fig. 6. In situ Oxygen microprofiles in the sediment at all station investigated for April 2007 (red), September 2007 (green), June 2008(Blue) and December 2008 (brown).
Biogeosciences, 7, 1187–1205, 2010 www.biogeosciences.net/7/1187/2010/
C. Cathalot et al.: Temporal variability of carbon recycling in coastal sediments 1197
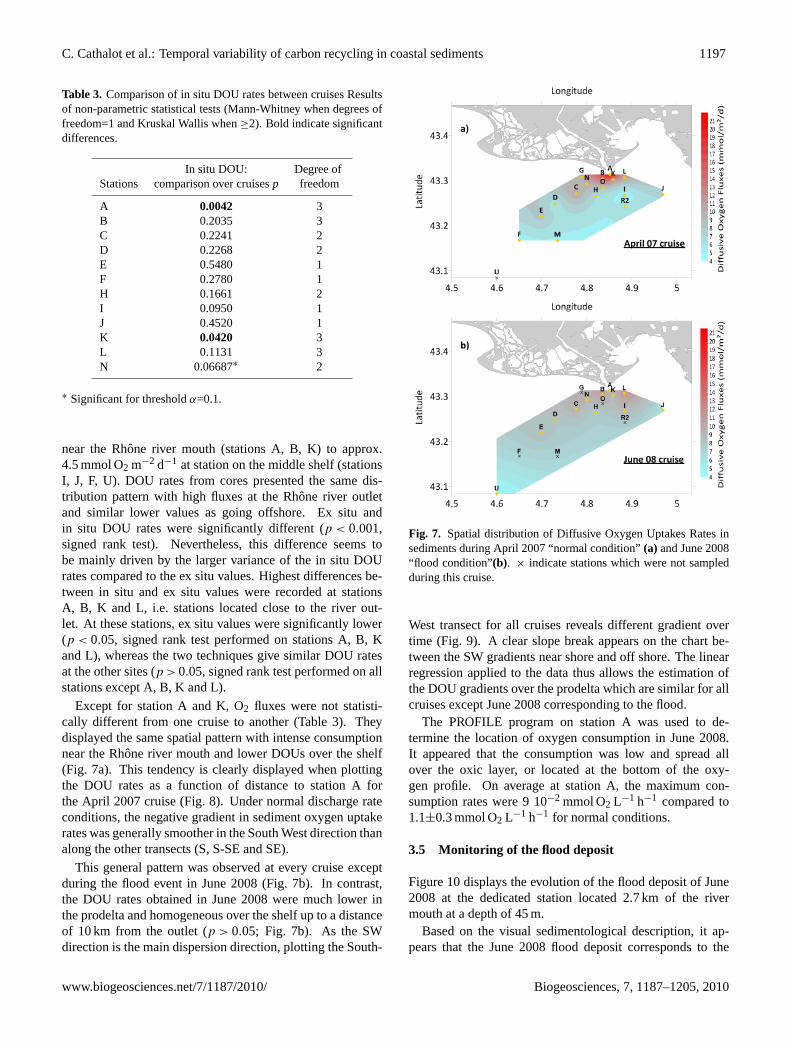
Table 3. Comparison of in situ DOU rates between cruises Resultsof non-parametric statistical tests (Mann-Whitney when degrees offreedom=1 and Kruskal Wallis when≥2). Bold indicate significantdifferences.
In situ DOU: Degree ofStations comparison over cruisesp freedom
A 0.0042 3B 0.2035 3C 0.2241 2D 0.2268 2E 0.5480 1F 0.2780 1H 0.1661 2I 0.0950 1J 0.4520 1K 0.0420 3L 0.1131 3N 0.06687∗ 2
∗ Significant for thresholdα=0.1.
near the Rhone river mouth (stations A, B, K) to approx.4.5 mmol O2 m−2 d−1 at station on the middle shelf (stationsI, J, F, U). DOU rates from cores presented the same dis-tribution pattern with high fluxes at the Rhone river outletand similar lower values as going offshore. Ex situ andin situ DOU rates were significantly different (p < 0.001,signed rank test). Nevertheless, this difference seems tobe mainly driven by the larger variance of the in situ DOUrates compared to the ex situ values. Highest differences be-tween in situ and ex situ values were recorded at stationsA, B, K and L, i.e. stations located close to the river out-let. At these stations, ex situ values were significantly lower(p < 0.05, signed rank test performed on stations A, B, Kand L), whereas the two techniques give similar DOU ratesat the other sites (p > 0.05, signed rank test performed on allstations except A, B, K and L).
Except for station A and K, O2 fluxes were not statisti-cally different from one cruise to another (Table 3). Theydisplayed the same spatial pattern with intense consumptionnear the Rhone river mouth and lower DOUs over the shelf(Fig. 7a). This tendency is clearly displayed when plottingthe DOU rates as a function of distance to station A forthe April 2007 cruise (Fig. 8). Under normal discharge rateconditions, the negative gradient in sediment oxygen uptakerates was generally smoother in the South West direction thanalong the other transects (S, S-SE and SE).
This general pattern was observed at every cruise exceptduring the flood event in June 2008 (Fig. 7b). In contrast,the DOU rates obtained in June 2008 were much lower inthe prodelta and homogeneous over the shelf up to a distanceof 10 km from the outlet (p > 0.05; Fig. 7b). As the SWdirection is the main dispersion direction, plotting the South-
Fig. 7. Spatial distribution of Diffusive Oxygen Uptakes Rates insediments during April 2007 “normal condition”(a) and June 2008“flood condition”(b). × indicate stations which were not sampledduring this cruise.
West transect for all cruises reveals different gradient overtime (Fig. 9). A clear slope break appears on the chart be-tween the SW gradients near shore and off shore. The linearregression applied to the data thus allows the estimation ofthe DOU gradients over the prodelta which are similar for allcruises except June 2008 corresponding to the flood.
The PROFILE program on station A was used to de-termine the location of oxygen consumption in June 2008.It appeared that the consumption was low and spread allover the oxic layer, or located at the bottom of the oxy-gen profile. On average at station A, the maximum con-sumption rates were 9 10−2 mmol O2 L−1 h−1 compared to1.1±0.3 mmol O2 L−1 h−1 for normal conditions.
3.5 Monitoring of the flood deposit
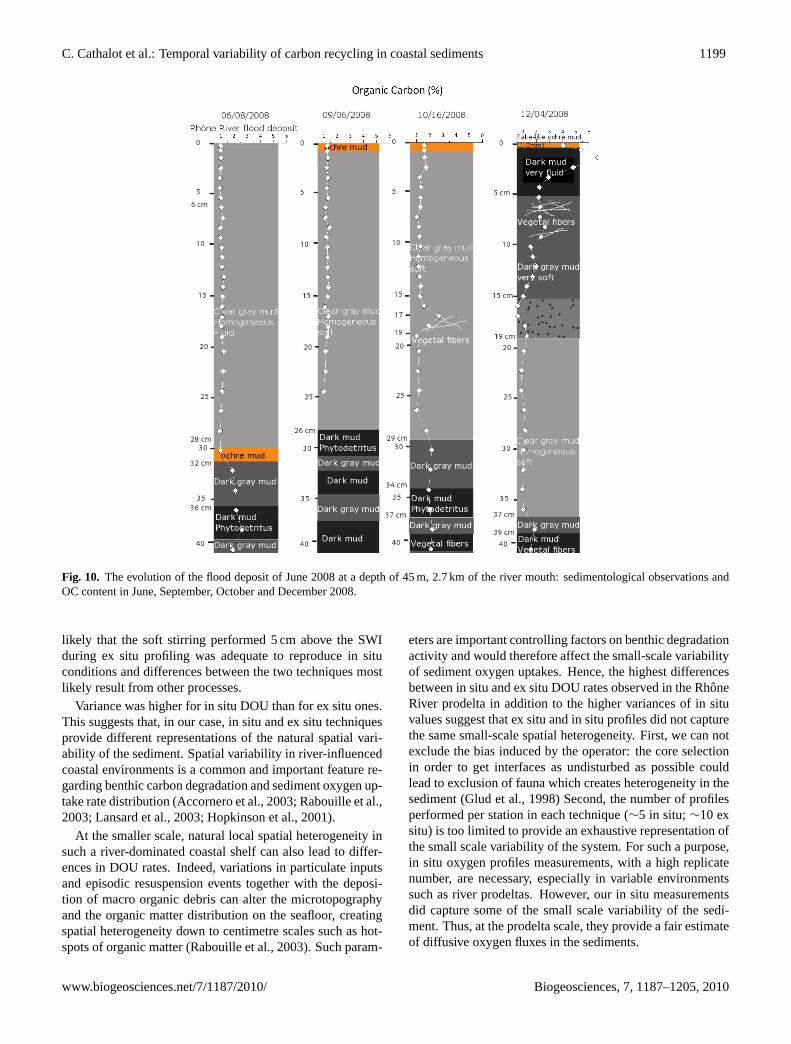
Figure 10 displays the evolution of the flood deposit of June2008 at the dedicated station located 2.7 km of the rivermouth at a depth of 45 m.
Based on the visual sedimentological description, it ap-pears that the June 2008 flood deposit corresponds to the
www.biogeosciences.net/7/1187/2010/ Biogeosciences, 7, 1187–1205, 2010
1198 C. Cathalot et al.: Temporal variability of carbon recycling in coastal sediments
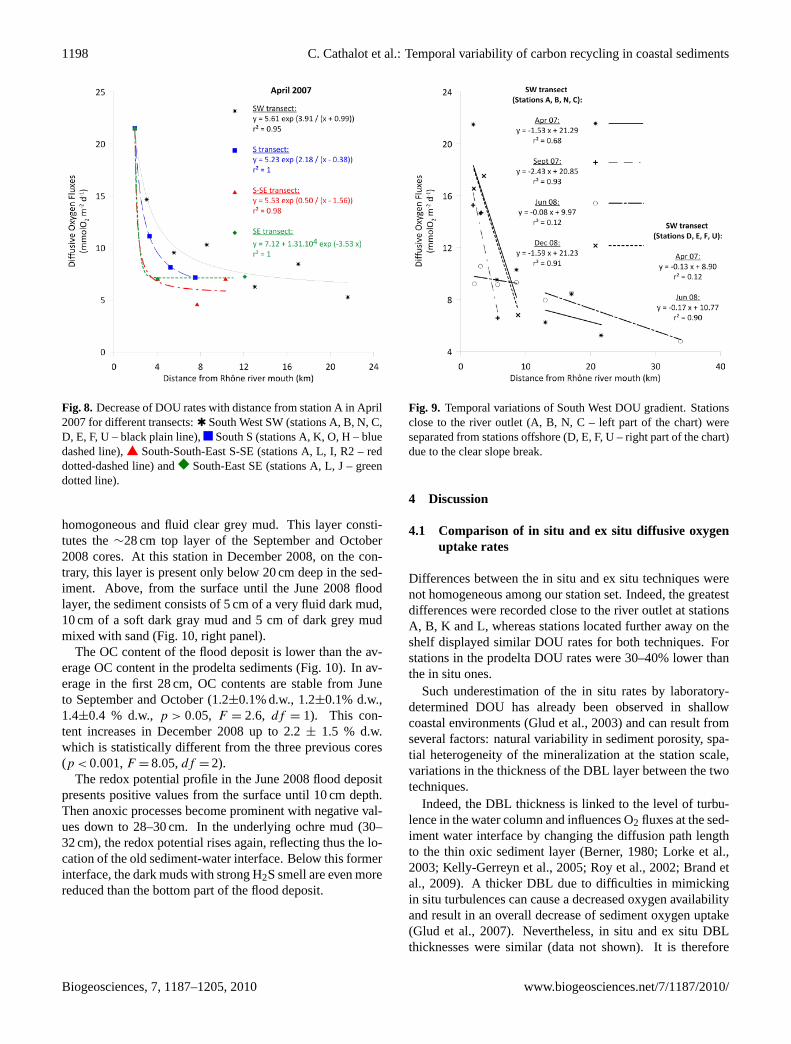
Fig. 8. Decrease of DOU rates with distance from station A in April2007 for different transects:✱ South West SW (stations A, B, N, C,D, E, F, U – black plain line),
Figures caption
Figure 1. Map of the Rhône delta indicating the locations of sampling stations. Black squares
indicate stations sampled the four cruises. Empty squares indicate stations sampled three
times. Black crosses indicate stations sampled twice. Empty circles indicate stations sampled
once (April 2007).
Figure 2. Mean daily flow and particulate discharge rates of the Rhône River. The integrated
SPM amount delivered during the sampling cruises period are indicated in yellow. Discharge
and SPM data have been achieved in the courtesy of the CNR and the SORA in the
workframe of a convention with IRSN in the EXTREMA ANR project.
Figure 3. Porosity profiles for all stations during all cruises. Data points indicate measured
values while thin curves represent the fitted profiles based on resistivity measurements and
Archie’s law (see text for details).
Figure 4. Organic carbon (OC) content in surficial sediments as a function of distance from
the river outlet for April 07 (black stars ), September 07 (black crosses ), June 08 cruises
(empty circles ) and December 08 (black diagonal crosses ). Exponential decays of OC
with distance in April 2007 and June 2008 are plotted to highlight the trends.
Figure 5. Surface sediments Chla contents as a function of distance from the river outlet:
April 07, September 07, June 08 and December 08.
Figure 6. In situ Oxygen microprofiles in the sediment at all station investigated for April
2007 (red), September 2007 (green), June 2008 (Blue) and December 2008 (brown).
Figure 7. Spatial distribution of Diffusive Oxygen Uptakes Rates in sediments during Apr-07
“normal condition” (a) and June-08 “flood condition”(b). × indicate stations which were not
sampled during his cruise.
Figure 8. Decrease of DOU rates with distance from station A in April 2007 for different
transects: South West SW (stations A, B, N, C, D, E, F, U - black plain line), South S
(stations A, K, O, H – blue dashed line), South-South-East S-SE (stations A, L, I, R2 – red
dotted-dashed line) and South-East SE (stations A, L, J – green dotted line)
Figure 9. Temporal variations of South West DOU gradient. Stations close to the river outlet
(A, B, N, C – left part of the chart) were separated from stations offshore (D, E, F, U – right
part of the chart).
Figure 10. The evolution of the flood deposit of June 2008 at a depth of 45 meters, 2.7 km of
the river mouth (visual observations a few months after the flood event).
South S (stations A, K, O, H – bluedashed line),
Figures caption
Figure 1. Map of the Rhône delta indicating the locations of sampling stations. Black squares
indicate stations sampled the four cruises. Empty squares indicate stations sampled three
times. Black crosses indicate stations sampled twice. Empty circles indicate stations sampled
once (April 2007).
Figure 2. Mean daily flow and particulate discharge rates of the Rhône River. The integrated
SPM amount delivered during the sampling cruises period are indicated in yellow. Discharge
and SPM data have been achieved in the courtesy of the CNR and the SORA in the
workframe of a convention with IRSN in the EXTREMA ANR project.
Figure 3. Porosity profiles for all stations during all cruises. Data points indicate measured
values while thin curves represent the fitted profiles based on resistivity measurements and
Archie’s law (see text for details).
Figure 4. Organic carbon (OC) content in surficial sediments as a function of distance from
the river outlet for April 07 (black stars ), September 07 (black crosses ), June 08 cruises
(empty circles ) and December 08 (black diagonal crosses ). Exponential decays of OC
with distance in April 2007 and June 2008 are plotted to highlight the trends.
Figure 5. Surface sediments Chla contents as a function of distance from the river outlet:
April 07, September 07, June 08 and December 08.
Figure 6. In situ Oxygen microprofiles in the sediment at all station investigated for April
2007 (red), September 2007 (green), June 2008 (Blue) and December 2008 (brown).
Figure 7. Spatial distribution of Diffusive Oxygen Uptakes Rates in sediments during Apr-07
“normal condition” (a) and June-08 “flood condition”(b). × indicate stations which were not
sampled during his cruise.
Figure 8. Decrease of DOU rates with distance from station A in April 2007 for different
transects: South West SW (stations A, B, N, C, D, E, F, U - black plain line), South S
(stations A, K, O, H – blue dashed line), South-South-East S-SE (stations A, L, I, R2 – red
dotted-dashed line) and South-East SE (stations A, L, J – green dotted line)
Figure 9. Temporal variations of South West DOU gradient. Stations close to the river outlet
(A, B, N, C – left part of the chart) were separated from stations offshore (D, E, F, U – right
part of the chart).
Figure 10. The evolution of the flood deposit of June 2008 at a depth of 45 meters, 2.7 km of
the river mouth (visual observations a few months after the flood event).
South-South-East S-SE (stations A, L, I, R2 – reddotted-dashed line) and
Figures caption
Figure 1. Map of the Rhône delta indicating the locations of sampling stations. Black squares
indicate stations sampled the four cruises. Empty squares indicate stations sampled three
times. Black crosses indicate stations sampled twice. Empty circles indicate stations sampled
once (April 2007).
Figure 2. Mean daily flow and particulate discharge rates of the Rhône River. The integrated
SPM amount delivered during the sampling cruises period are indicated in yellow. Discharge
and SPM data have been achieved in the courtesy of the CNR and the SORA in the
workframe of a convention with IRSN in the EXTREMA ANR project.
Figure 3. Porosity profiles for all stations during all cruises. Data points indicate measured
values while thin curves represent the fitted profiles based on resistivity measurements and
Archie’s law (see text for details).
Figure 4. Organic carbon (OC) content in surficial sediments as a function of distance from
the river outlet for April 07 (black stars ), September 07 (black crosses ), June 08 cruises
(empty circles ) and December 08 (black diagonal crosses ). Exponential decays of OC
with distance in April 2007 and June 2008 are plotted to highlight the trends.
Figure 5. Surface sediments Chla contents as a function of distance from the river outlet:
April 07, September 07, June 08 and December 08.
Figure 6. In situ Oxygen microprofiles in the sediment at all station investigated for April
2007 (red), September 2007 (green), June 2008 (Blue) and December 2008 (brown).
Figure 7. Spatial distribution of Diffusive Oxygen Uptakes Rates in sediments during Apr-07
“normal condition” (a) and June-08 “flood condition”(b). × indicate stations which were not
sampled during his cruise.
Figure 8. Decrease of DOU rates with distance from station A in April 2007 for different
transects: South West SW (stations A, B, N, C, D, E, F, U - black plain line), South S
(stations A, K, O, H – blue dashed line), South-South-East S-SE (stations A, L, I, R2 – red
dotted-dashed line) and South-East SE (stations A, L, J – green dotted line)
Figure 9. Temporal variations of South West DOU gradient. Stations close to the river outlet
(A, B, N, C – left part of the chart) were separated from stations offshore (D, E, F, U – right
part of the chart).
Figure 10. The evolution of the flood deposit of June 2008 at a depth of 45 meters, 2.7 km of
the river mouth (visual observations a few months after the flood event).
South-East SE (stations A, L, J – greendotted line).
homogoneous and fluid clear grey mud. This layer consti-tutes the∼28 cm top layer of the September and October2008 cores. At this station in December 2008, on the con-trary, this layer is present only below 20 cm deep in the sed-iment. Above, from the surface until the June 2008 floodlayer, the sediment consists of 5 cm of a very fluid dark mud,10 cm of a soft dark gray mud and 5 cm of dark grey mudmixed with sand (Fig. 10, right panel).
The OC content of the flood deposit is lower than the av-erage OC content in the prodelta sediments (Fig. 10). In av-erage in the first 28 cm, OC contents are stable from Juneto September and October (1.2±0.1% d.w., 1.2±0.1% d.w.,1.4±0.4 % d.w.,p > 0.05, F = 2.6, df = 1). This con-tent increases in December 2008 up to 2.2± 1.5 % d.w.which is statistically different from the three previous cores(p < 0.001,F = 8.05,df = 2).
The redox potential profile in the June 2008 flood depositpresents positive values from the surface until 10 cm depth.Then anoxic processes become prominent with negative val-ues down to 28–30 cm. In the underlying ochre mud (30–32 cm), the redox potential rises again, reflecting thus the lo-cation of the old sediment-water interface. Below this formerinterface, the dark muds with strong H2S smell are even morereduced than the bottom part of the flood deposit.
Fig. 9. Temporal variations of South West DOU gradient. Stationsclose to the river outlet (A, B, N, C – left part of the chart) wereseparated from stations offshore (D, E, F, U – right part of the chart)due to the clear slope break.
4 Discussion
4.1 Comparison of in situ and ex situ diffusive oxygenuptake rates
Differences between the in situ and ex situ techniques werenot homogeneous among our station set. Indeed, the greatestdifferences were recorded close to the river outlet at stationsA, B, K and L, whereas stations located further away on theshelf displayed similar DOU rates for both techniques. Forstations in the prodelta DOU rates were 30–40% lower thanthe in situ ones.
Such underestimation of the in situ rates by laboratory-determined DOU has already been observed in shallowcoastal environments (Glud et al., 2003) and can result fromseveral factors: natural variability in sediment porosity, spa-tial heterogeneity of the mineralization at the station scale,variations in the thickness of the DBL layer between the twotechniques.
Indeed, the DBL thickness is linked to the level of turbu-lence in the water column and influences O2 fluxes at the sed-iment water interface by changing the diffusion path lengthto the thin oxic sediment layer (Berner, 1980; Lorke et al.,2003; Kelly-Gerreyn et al., 2005; Roy et al., 2002; Brand etal., 2009). A thicker DBL due to difficulties in mimickingin situ turbulences can cause a decreased oxygen availabilityand result in an overall decrease of sediment oxygen uptake(Glud et al., 2007). Nevertheless, in situ and ex situ DBLthicknesses were similar (data not shown). It is therefore
Biogeosciences, 7, 1187–1205, 2010 www.biogeosciences.net/7/1187/2010/
C. Cathalot et al.: Temporal variability of carbon recycling in coastal sediments 1199
Fig. 10. The evolution of the flood deposit of June 2008 at a depth of 45 m, 2.7 km of the river mouth: sedimentological observations andOC content in June, September, October and December 2008.
likely that the soft stirring performed 5 cm above the SWIduring ex situ profiling was adequate to reproduce in situconditions and differences between the two techniques mostlikely result from other processes.
Variance was higher for in situ DOU than for ex situ ones.This suggests that, in our case, in situ and ex situ techniquesprovide different representations of the natural spatial vari-ability of the sediment. Spatial variability in river-influencedcoastal environments is a common and important feature re-garding benthic carbon degradation and sediment oxygen up-take rate distribution (Accornero et al., 2003; Rabouille et al.,2003; Lansard et al., 2003; Hopkinson et al., 2001).
At the smaller scale, natural local spatial heterogeneity insuch a river-dominated coastal shelf can also lead to differ-ences in DOU rates. Indeed, variations in particulate inputsand episodic resuspension events together with the deposi-tion of macro organic debris can alter the microtopographyand the organic matter distribution on the seafloor, creatingspatial heterogeneity down to centimetre scales such as hot-spots of organic matter (Rabouille et al., 2003). Such param-
eters are important controlling factors on benthic degradationactivity and would therefore affect the small-scale variabilityof sediment oxygen uptakes. Hence, the highest differencesbetween in situ and ex situ DOU rates observed in the RhoneRiver prodelta in addition to the higher variances of in situvalues suggest that ex situ and in situ profiles did not capturethe same small-scale spatial heterogeneity. First, we can notexclude the bias induced by the operator: the core selectionin order to get interfaces as undisturbed as possible couldlead to exclusion of fauna which creates heterogeneity in thesediment (Glud et al., 1998) Second, the number of profilesperformed per station in each technique (∼5 in situ;∼10 exsitu) is too limited to provide an exhaustive representation ofthe small scale variability of the system. For such a purpose,in situ oxygen profiles measurements, with a high replicatenumber, are necessary, especially in variable environmentssuch as river prodeltas. However, our in situ measurementsdid capture some of the small scale variability of the sedi-ment. Thus, at the prodelta scale, they provide a fair estimateof diffusive oxygen fluxes in the sediments.
www.biogeosciences.net/7/1187/2010/ Biogeosciences, 7, 1187–1205, 2010
1200 C. Cathalot et al.: Temporal variability of carbon recycling in coastal sediments
4.2 Spatial and temporal distribution of benthicmineralization in the Rhone River prodelta
4.2.1 Spatial variability in sediment oxygen uptake
O2 uptake rates measured out of the June 2008 flood perioddisplay a spatial distribution pattern (Fig. 7a) consistent withthe one previously described by Lansard et al. (2009). Highsediment oxygen consumption were found in a radius of 8 kmfrom the vicinity of the Rhone river mouth with values from10 to 20 mmol O2 m−2 d−1; these rates decreasing offshoreto values around 5 mmol O2 m−2 d−1 (stations F, I, J). Thesediment oxygen uptake rates observed at the outlet of theRhone River are in the range of values reported in the litera-ture. Morse and Rowe (1999) reported DOU rates decreasingfrom 50 mmol O2 m−2 d−1 near the Mississippi River mouthdown to 2 mmol O2 m−2 d−1 further on the Gulf of Mexicoshelf while Alongi (1995) measured fluxes ranging from 18–47 mmol O2 m−2 d−1 in the Gulf of Papua influenced by riverinputs.
In our study, the distribution pattern over the shelf in-dicates an intense benthic mineralization close to the rivermouth and a decrease of benthic degradation fluxes slowerto the South-West than towards the South or the Southeast(Fig. 8). This feature matches the distribution footprint ofthe Rhone River inputs. Indeed, the South West has beenproven to be a preferential direction for deposition of theterrestrial material in this area (Naudin et al., 1997; Cal-met and Fernandez, 1990). Moreover, particles and organicmatter tracers (radionuclides, carbon and nitrogen stable iso-topes) from earlier studies clearly demonstrated a terrestrialorigin of the sedimentary material nearby the river mouth(Aloisi et al., 1982; De Madron et al., 2000; Radakovitchet al., 1999b; Lansard et al., 2009; Tesi et al., 2007). Thehigh OC and Chla contents observed in the prodelta areaare associated with high Chlb and Pheoa contents; offshorestations presenting lower degraded material content and noChl b. This likely reflects inputs of terrestrial phytodetri-tus (Christensen, 1962) rather than local primary productionstimulated by riverine nutrient inputs. Moreover, Chlb hasbeen evidenced to be inversely correlated with labile carbonfraction in the area influenced by the Rhone River dilutionplume (Alliot et al., 2003): the author evidence enrichmentin labile organic matter mainly due to detritic organic matterof terrestrial origin. Therefore, although terrestrial materialis generally supposed to be more refractory than marine in-puts (Epping et al., 2002), this South West transect and theintense benthic mineralization at the river mouth seem to bedirectly dependant of the Rhone River inputs. This feature isconsistent with theδ13C values of OM measured in Lansardet al. (2009). The terrestrial material is mainly deposited andprocessed in a restricted area corresponding to a radius of8 km off the Rhone River mouth and high microbial degra-dation activity in this area is related both to the amount ofmaterial supplied and to its lability.
4.2.2 Temporal variability of sediment oxygen uptake:non flood discharge rates conditions
Our study indicates that under normal discharge rates, spatialpattern of OC oxidation in the prodelta is stable temporallyon an annual basis: a similar distribution of DOU in the sed-iments was observed in spring, late summer or fall. Indeed,during our sampling cruises in April 2007, September 2007and December 2008, the Rhone River discharge rates werearound average and did not exceed 3000 m3 s−1 (the dis-charge rate at Arles for an annual flood being 4280 m3 s−1).Inputs during these cruises were therefore moderate, com-pared to the high discharge rates (liquid and particulate) de-livered during the June 2008 cruise. Distribution of the DOUrates was similar during the three cruises and matches theone observed by Lansard et al. (2009) in June 2005. Theseauthors performed their measurements under low dischargerates comparable to the one in April and September 2007(Q ∼ 500 m3 s−1): the benthic degradation activity beingdriven by the Rhone River inputs (see above), it is there-fore not surprising to observe similar DOU rates. Dischargerates in December 2008 were higher (Q ∼ 2000 m3 s−1), ex-plaining the differences in integrated SPM amount deliveredduring our cruise. This December 2008 cruise followed a6-days annual flood that occurred on 1 November (see be-low). Nevertheless, one month after and under moderateflow rates, benthic degradation activity in the Rhone Riverprodelta displayed DOU values similar to low dischargerates. It can thus be concluded that, below the flood regime(Q < 3000 m3 s−1), under what can be qualified as “normal”discharge rates conditions, the sediment oxygen uptake dis-tribution displays a stable pattern over time, indicating po-tential stationary conditions.
4.2.3 Temporal variability of sediment oxygen uptake:flood discharge rates conditions
Our results (Fig. 7) show that the temporal variations of ben-thic mineralisation in the Rhone River prodelta are linked toextreme deposition events following flood conditions (June2008). This annual flood delivered up to 5.4×10⁶ tons ofsediment in a 10 days period. This corresponds to∼7.9×10⁴
tons of C and an average flood deposit of 30 cm, (Fig. 10).The Rhone River material settled near the river mouth (asmuch as 60 cm deposit at the nearest station) mainly in asouth-westward direction (SW: 30–40 cm vs. SE: 13 cm).Ulses et al. (2008) used a model coupling hydrodynamicsand sediment transport in the Gulf of Lions for the floodof December 2003 and showed that the riverine material isdeposited in the prodelta and mainly in front of the rivermouth (20 cm deposit). This flood is comparable to theJune 2008 event: the water discharge rate was higher (upto 9346 m3 s−1) but the total sediment discharge was similar(∼4 Mt). Rapid and efficient sedimentation of the riverinematerial was also observed after the Po River flood in 2000
Biogeosciences, 7, 1187–1205, 2010 www.biogeosciences.net/7/1187/2010/
C. Cathalot et al.: Temporal variability of carbon recycling in coastal sediments 1201
(Miserocchi et al., 2007). The Rhone River prodelta is thuslikely to act as an OC accumulation centre during flood pe-riods. This idea is consistent with the high sedimentationrates between 48 cm y−1 to 10 cm y−1 observed in the area(Radakovitch et al., 1999a; Charmasson et al., 1998; Miralleset al., 2005) and the spatial distribution Pu isotopes, a tracerof river particles in sediments (Lansard et al., 2007).
The rapid deposition of large quantities of organic mat-ter (OM) in the prodelta during the June 2008 flood induceda sudden change in biogeochemical conditions in the sedi-ment. Oxygen fluxes decreased by 20–30% at all stationsclose to the outlet of the Rhone River (Fig. 7) and deeperoxygen penetration depth were observed a few days afterthe flood deposit. This is in agreement with a study of thePo River flood in 2000 (Dell’Anno et al., 2008) who ob-served a decrease of OM degradation rates in coastal sedi-ments from the Northern Adriatic. Similarly, a drop in ben-thic community respiration was observed after a flood insouth-eastern Australian rivers (Rees et al., 2005) and in theAustralian subtropical Brunswick estuary (Eyre et al., 2006).Authors argued that the flood scoured the sediment, leavinga poor carbon content layer to be degraded. In our study,the flood in June 2008 did not erode the sediment as evi-denced by the presence of an ochre mud below the flooddeposit (Fig. 10). Alternatively, the flood brought a lowOC content layer, poor in phytodetritus and labile organicmatter which resulted in a decrease of OM mineralizationrate. Indeed, surface sediments of stations A, B, K, L, C lo-cated near the river mouth presented lower OC and Chla
contents in June 2008 compared to the “non-flood” cruises(OC: 1.1±0.1% vs. 1.5±0.2%; Chla: 3 vs. 10 µg g−1 d.w.;Fig. 10; Table 1). In addition the bio-available compoundscontents constituted by the sum of carbohydrates, lipids andproteins were considerably lower in the June 2008 surfacesediments indicating also a poorly degradable material (4 vs.7 mg g−1 d.w.; R. Buscail, personal communication, 2009).The Suspended Particulate Matter (SPM) of the Rhone Riverduring the June 2008 flood event had a low OC content(0.8%) with depleted114C and enrichedδ13C signatures(114C=−500‰, δ13C=−25.8‰), compared to the normalhydrological regimes where POC content in the river is 3.5%,with 114C∼100‰ andδ13C∼−27‰ signatures (Cathalot etal., 2010). Linked to a Western Alps related flood whicheroded river banks and cultivated land, the flood has certainlybrought large quantities of soil carbon as evidenced by Tesiet al. (2008) at the Po River outlet in October 2000. The low114C signal and slightly enrichedδ13C (−25.8‰) values in-dicate a mixture of old soil-derived OC, with minor contribu-tion of vascular plants and riverine and estuarine phytoplank-ton, as indicated by the low Chla and Chlb content observedin the flood deposit. Mean diameter of surface sediments atthe river outlet (stations A and K) dropped from 37.40 µm to6 µm shifting from silt to clay like sediments (cf. Table 1) inagreement with the soil origin of the particles. An importantpart of the organic material from the flood may be associ-
ated with clay and thus protected from bacterial degradation(Mayer, 1994; Keil et al., 1994) which could reduce miner-alisation of organic matter in the sediments after this type offlood. These results indicate that flood events may bring soilOM in large quantities but do not imply an increase in thesediment recycling despite the large quantities of carbon de-livered. The prodelta thus acts as a depocentre for terrestrialOM inputs.
During our study, we were able to follow the flood eventover 6 months with sediment cores and measure the DOUrates at the start of the flood and 6 months after. This gaveus valuable insights on the dynamics and pathways involvedin the relaxation of the sediment system linked to mineralisa-tion. The large June 2008 flood obviously generated a tran-sient state in the sediment compared to April and Septem-ber 2007 distributions. Indeed, DOU rates in the depositzone were significantly lower after the flood. Besides, theredox profile performed in the June 2008 deposit clearly in-dicates the location of a former interface below the newlydeposited material. Dell’Anno et al. (2008) noticed that af-ter the immediate decrease consecutive to the deposition offlood material, sediment oxygen uptake rates rose up again,as a consequence of the system relaxation. The return to sta-tionary conditions results from a combination of all biogeo-chemical processes taking place in the sedimentary column:a new interface is forming, all chemical species are diffusing,marine bacteria are colonizing the new sediment and con-suming the organic carbon (Deflandre et al., 2002; Mucciet al., 2003; Sundby, 2006). Erosion of the 30 cm soft de-posit in the prodelta is certainly limited since the depositedlayer, sampled 2.7 km south from the Rhone River mouth, re-mains identical until at least October 2008 (Fig. 10). This isconsistent with the hydrodynamic conditions during this pe-riod: low wave significant heights (<4 m) and low dischargerates. A slight compaction (from 30 cm thickness to∼25 cm)is visible with no significant organic carbon decrease. Newsedimentation of river particles also occurred since in De-cember only 18 cm of this soft mud from the June 2008 floodremains and a new deposit is visible mainly due to furtherNovember flood, which brought organic-rich material (6%).This sudden burial of OC underlines the transient nature ofthese prodelta environments during flood deposits. Hence,the sediment O2 distribution, and therefore DOU rates, isnot strickly related to carbon degradation in these transientenvironments. Successive depositions of OM material viaflood events switch the systems from stationary conditions(under normal discharge rates) with a tight coupling betweenoxygen consumption and carbon mineralization, to transientflood conditions with uncoupled OC and O2 cycles (Aller,1998).
Six months after the flood event, oxygen fluxes in theprodelta had increased and had reached back their initialvalues before the flood. At the same time, the Southwestgradient of oxygen consumption was re-established (Fig. 9).Oxygen consumption in station A sediments during the flood
www.biogeosciences.net/7/1187/2010/ Biogeosciences, 7, 1187–1205, 2010
1202 C. Cathalot et al.: Temporal variability of carbon recycling in coastal sediments
was around 9×10⁻² mmol O2 L−1 h−1. Considering a meanoxygen concentration among the sediment in the new de-posit of 300 µmol L−1, it would only take 3.3 h for the wholeoxygen trapped in porewaters during mud deposition to beconsumed, indicating that consumption of oxygen at the ob-served rates can significantly contribute to the relaxation ofthe system. Oxygen consumption after the flood event resultsfrom the re-establishment of the bacterial community and there-establishment of the redox front within the flood deposit.Our current dataset do not allow us to discriminate whichprocess dominates but gives insights on the time-scales in-volved. Indeed, the redox profile in the June 2008 flood de-posit indicates that only a few days after the beginning of theflood, the redox front was already settled at 10 cm below theSWI. We can thus assume that the time scales involved forthe return to stationary conditions are short. Moreover, ourobservations in December 2008 also suggest a dynamic andrapid system. Indeed, DOU rates in the prodelta sedimentsof the prodelta already showed similar to low discharge ratesconditions, only one month after an annual flood. ThisNovember flood was different from the June flood with∼11times less particles, but just∼6 times less carbon delivered,and OC contents above 5%. The response induced to thesediment might therefore have been different. Nevertheless,it still indicates that sediments off the Rhone River are reac-tive enough to display stationary conditions one month after aflood event. This time scale is in agreement with flood eventstudies in other coastal environments which evidenced relax-ation time scales around weeks (Bentley and Nittrouer, 2003;Eyre and Ferguson, 2006; Eyre and Twigg, 1997; Deflandreet al., 2002). Re-establishment of bacterial community couldbe one of the driving mechanisms as the time scales involvedare also in the order of weeks (Boer et al., 2009; Aller andAller, 2004), in agreement with our data.
Therefore, our study indicates the relative importanceof the mineralization reaction processes and the re-establishment of the microbial community, and their rapidtimescale (hours to weeks). It appears that the dynamics ofthe Rhone River inputs and the sedimentation processes as-sociated are key factor for carbon mineralization processesin the sediment. Our data suggest that the response of thebenthic degradation system of the Rhone River prodelta toflood inputs involves rapid processes ranging from weeks tomonths.
5 Conclusions
This paper describes the temporal variability of organicmatter mineralization in sediments from the Rhone Riverprodelta and Gulf of Lions adjacent shelf using oxygen de-mand as a proxy.
The results indicate that the spatial pattern of decreasingoxygen demand with distance from the river mouth is per-sistent over different seasons under “normal discharge con-ditions” i.e. out of the flood periods. River organic inputs
are concentrated and largely mineralized in a zone locatedaround 8 km from the river outlet. This large mineralizationis linked to substantial inputs of reactive terrestrial organicmatter indicated by the presence of Chla and Chlb at theriver outlet.
During one major flood deposition (average of 30cm),the oxygen demand in the prodelta decreases by 20–30%,whereas the shelf is not affected. For the flood encoun-tered in June 2008, a realistic scenario is the deposition ofa large quantity of low reactivity material originating fromsoils in the drainage basin near the outlet of the Rhone River.Transient processes are involved after a flood deposit: bac-terial respiration, reduction and oxidation cycles, depositionof new organic material from the river, which create a rapidrelaxation of the oxygen distribution towards its initial state(weeks to months). Oxygen demand in flood impacted sed-iment is decoupled from carbon mineralization: successionof flood deposits and transient conditions promote burial oflarge quantities of OM and tend to reduce the efficiency ofbenthic carbon degradation. The extent of this decouplingdepends on the quantity and the lability of the carbon deliv-ered by the flood (soil OM vs. fresh phyto-detritus), and istherefore directly dependant on the type of flood event.
Acknowledgements.We thank the captains and crews of theR. V. Tethys II for their help in sea work during the four sea ex-peditions of this project. We would like to thank B. Bombled,B. Lansard, M. Desmalades, K. Escoubeyrou, G. Vetion, andB. Riviere for their work and technical support during the cruisesand their help during laboratory analyses. F. Lantoine provided ex-pertise in pigment analysis.
We thank Claire Powell for proofreading our article and correctingimproper English expressions.
In situ wave height measurements were extracted from the Frenchnational database CANDHIS and performed within the frame-work between the Direction Regionale de l’Environnement, del’Am enagement et du Logement Languedoc-Roussillon, the PortAutonome de Marseille et the CETMEF.
Discharge and SPM data have been achieved in the courtesy of theCNR and the SORA in the workframe of a convention with IRSNin the EXTREMA ANR project.
This work was supported by the French National Research Agency,programme “Vulnerabilites: Milieux et Climat”, under the grantno. ANR-06-VULN-001 to the CHACCRA project, the FrenchINSU-EC2CO program RiOMar.fr, and the CEA. This is a LSCEcontribution 4178.
Edited by: A. V. Borges
The publication of this article is financed by CNRS-INSU.
Biogeosciences, 7, 1187–1205, 2010 www.biogeosciences.net/7/1187/2010/
C. Cathalot et al.: Temporal variability of carbon recycling in coastal sediments 1203
References
Accornero, A., Picon, P., de Bovee, F., Charriere, B., and Buscail,R.: Organic carbon budget at the sediment-water interface on theGulf of Lions continental margin, Cont. Shelf Res., 23, 79–92,2003.
Aller, J. Y. and Aller, R. C.: Physical disturbance creates bacterialdominance of benthic biological communities in tropical deltaicenvironments of the Gulf of Papua, Cont. Shelf Res., 24, 2395–2416, 2004.
Aller, R. C.: Mobile deltaic and continental shelf muds as suboxic,fluidized bed reactors, Mar. Chem., 61, 143–155, 1998.
Alliot, E., Younes, W. A. N., Romano, J. C., Rebouillon, P., andMasse, H.: Biogeochemical impact of a dilution plume (RhoneRiver) on coastal sediments: Comparison between a surface wa-ter survey (1996–2000) and sediment composition, Estuar. Coast.Shelf Sci., 57, 357–367, 2003.
Allison, M. A., Kineke, G. C., Gordon, E. S., and Goni, M. A.: De-velopment and reworking of a seasonal flood deposit on the innercontinental shelf off the Atchafalaya River, Cont. Shelf Res., 20,2267–2294, 2000.
Aloisi, J. C., Cambon, J. P., Carbonne, J., Cauwet, G., Millot, C.,Monaco, A., and Pauc, H.: Origin and role of the bottom neph-eloid layer in the tranfer of particles into the marine environment– application to the Gulf of Lions, Oceanol. Acta, 5, 481–491,1982.
Alongi, D. M.: Decomposition and recycling of organic matter inmuds of the Gulf of Papua, northern coral sea, Cont. Shelf Res.,15, 1319–1337, 1995.
Andrews, D. and Bennett, A.: Measurements of diffusivity nearthe sediment-water interface with a fine-scale resistivity probe,Geochim. Cosmochim. Acta, 45, 2169–2175, 1981.
Antonelli, C., Eyrolle, F., Rolland, B., Provansal, M., andSabatier, F.: Suspended sediment and Cs-137 fluxes dur-ing the exceptional December 2003 flood in the RhoneRiver, southeast France, Geomorphology, 95, 350–360,doi:10.1016/j.geomorph.2007.06.007, 2008.
Bentley, S. J. and Nittrouer, C. A.: Emplacement, modification,and preservation of event strata on a flood-dominated continen-tal shelf: Eel shelf, Northern California, Cont. Shelf Res., 23,1465–1493, doi:10.1016/j.csr.2003.08.005, 2003.
Berg, P., Risgaard-Petersen, N., and Rysgaard, S.: Interpretation ofmeasured concentration profiles in sediment pore water, Limnol.Oceanogr., 43, 1500–1510, 1998.
Berner, R. A.: Early diagenesis: A theoretical approach, Prince-ton series in geochemistry, edited by: Princeton, N. J., PrincetonUniversity Press, Princeton, 241 pp., 1980.
Blair, N. E., Leithold, E. L., and Aller, R. C.: From bedrock toburial: The evolution of particulate organic carbon across cou-pled watershed-continental margin systems, Mar. Chem., 92,141–156, 2004.
Boer, S. I., Arnosti, C., van Beusekom, J. E. E., and Boetius, A.:Temporal variations in microbial activities and carbon turnover insubtidal sandy sediments, Biogeosciences, 6, 1149–1165, 2009,http://www.biogeosciences.net/6/1149/2009/.
Brand, A., Dinkel, C., and Wehrli, B.: Influence of the diffu-sive boundary layer on solute dynamics in the sediments of aseiche-driven lake: A model study, J. Geophys. Res.-Biogeosci.,114(12), G01010 doi:10.1029/2008jg000755, 2009.
Broecker, W. S. and Peng, T. H.: Gas-exchange rates between air
and sea, Tellus, 26, 21–35, 1974.Burdige, D. J.: Burial of terrestrial organic matter in marine sedi-
ments: A re-assessment, Global Biogeochem. Cy., 19, GB4011,doi:10.1029/2004GB002368, 2005.
Cai, W. J., Reimers, C. E., and Shaw, T.: Microelectrode studies oforganic carbon degradation and calcite dissolution at a Californiacontinental rise site, Geochim. Cosmochim. Acta, 59, 497–511,1995.
Calmet, D. and Fernandez, J.-M.: Caesium distribution in North-west Mediterranean seawater, suspended particles and sediments,Cont. Shelf Res., 10, 895–913, 1990.
Cathalot, C., Rabouille, C., Tisnerat-Laborde, N., Buscail, R., Ker-herve, P., and Gontier, G.: Sources and fate of particulate organiccarbon export from the Rhne River in the Mediterranean Sea:combined use of114C andδ13C, in preparation, 2010.
Cauwet, G., Gadel, F., de Souza Sierra, M. M., Donard, O., andEwald, M.: Contribution of the rhone river to organic carboninputs to the Northwestern Mediterranean Sea, Cont. Shelf Res.,10, 1025–1037, 1990.
Charmasson, S., Bouisset, P., Radakovitch, O., Pruchon, A. S., andArnaud, M.: Long-core profiles of cs-137, cs-134, co-60 and pb-210 in sediment near the Rhone River (Northwestern Mediter-ranean Sea), Estuaries, 21, 367–378, 1998.
Christensen, T.: Alger, in: Botanik ii. Systematik botanik, editedby: Bocher, T. W., Lange, M., and Sorensen, T., Munksgaard,Copenhagen, 1–178, 1962.
Copin-Montegut, C.: Alkalinity and carbon budgets in the Mediter-ranean Sea, Global Biogeochem. Cy., 7, 915–925, 1993.
Dagg, M., Benner, R., Lohrenz, S., and Lawrence, D.: Transforma-tion of dissolved and particulate materials on continental shelvesinfluenced by large rivers: Plume processes, Cont. Shelf Res.,24, 833–858, 2004.
Darnaude, A. M., Salen-Picard, C., and Harmelin-Vivien, M. L.:Depth variation in terrestrial particulate organic matter exploita-tion by marine coastal benthic communities off the Rhone Riverdelta (NW Mediterranean), Mar. Ecol.-Prog. Ser., 275, 47–57,2004.
de Madron, X. D., Radakovitch, O., Heussner, S., Loye-Pilot, M.D., and Monaco, A.: Role of the climatological and current vari-ability on shelf-slope exchanges of particulate matter: Evidencefrom the Rhone continental margin (NW Mediterranean), Deep-Sea Res. I, 46, 1513–1538, 1999.
De Madron, X. D., Abassi, A., Heussner, S., Monaco, A., Aloisi,J. C., Radakovitch, O., Giresse, P., Buscail, R., and Kerherve,P.: Particulate matter and organic carbon budgets for the Gulf ofLions (NW Mediterranean), Oceanol. Acta, 23, 717–730, 2000.
de Madron, X. D., Denis, L., Diaz, F., Garcia, N., Guieu, C., Grenz,C., Loye-Pilot, M. D., Ludwig, W., Moutin, T., Raimbault, P.,and Ridame, C.: Nutrients and carbon budgets for the Gulf ofLion during the Moogli cruises, Oceanol. Acta, 26, 421–433,2003.
Deflandre, B., Mucci, A., Gagne, J. P., Guignard, C., and Sundby,B.: Early diagenetic processes in coastal marine sediments dis-turbed by a catastrophic sedimentation event, Geochim. Cos-mochim. Acta, 66, 2547–2558, 2002.
Dell’Anno, A., Pusceddu, A., Langone, L., and Danovaro,R.: Biochemical composition and early diagenesis of or-ganic matter in coastal sediments of the NW Adriatic Seainfluenced by riverine inputs, Chem. Ecol., 24, 75–85,
www.biogeosciences.net/7/1187/2010/ Biogeosciences, 7, 1187–1205, 2010
1204 C. Cathalot et al.: Temporal variability of carbon recycling in coastal sediments
doi:10.1080/02757540701814580, 2008.Denis, L., Grenz, C., Alliot, E., and Rodier, M.: Temporal variabil-
ity in dissolved inorganic nitrogen fluxes at the sediment-waterinterface and related annual budget on a continental shelf (NWMediterranean), Oceanol. Acta, 24, 85–97, 2001.
Epping, E., van der Zee, C., Soetaert, K., and Helder, W.: On theoxidation and burial of organic carbon in sediments of the Iberianmargin and Nazare canyon (NE Atlantic), Prog. Oceanogr., 52,399–431, 2002.
Eyre, B. D. and Ferguson, A. J. P.: Impact of a flood event on ben-thic and pelagic coupling in a sub-tropical east Australian estuary(Brunswick), Estuar. Coast. Shelf Sci., 66, 111–122, 2006.
Friedrichs, C. T. and Wright, L. D.: Gravity-driven sedimenttransport on the continental shelf - implications for equilib-rium profiles near river mouths, Coast. Eng., 51, 795–811,doi:10.1016/j.coastaleng.2004.07.010, 2004.
Froelich, P. N., Klinkhammer, G. P., Bender, M. L., Luedtke, N. A.,Heath, G. R., Cullen, D., Dauphin, P., Hammond, D., Hartman,B., and Maynard, V.: Early oxidation of organic-matter in pelagicsediments of the eastern equatorial atlantic – suboxic diagenesis,Geochim. Cosmochim. Acta, 43, 1075–1090, 1979.
Galy, V., France-Lanord, C., Beyssac, O., Faure, P., Kudrass, H.,and Palhol, F.: Efficient organic carbon burial in the Bengal fansustained by the Himalayan erosional system, Nature, 450, 407–410, 2007.
Gattuso, J. P., Frankignoulle, M., and Wollast, R.: Carbon and car-bonate metabolism in coastal aquatic ecosystems, Annual Re-view of Ecology and Systematics, 29, 405–434, 1998.
Glud, R. N., Holby, O., Hoffmann, F., and Canfield, D. E.: Ben-thic mineralization and exchange in Arctic sediments (Svalbard,Norway), Mar. Ecol.-Prog. Ser., 173, 237–251, 1998.
Glud, R. N., Risgaard-Petersen, N., Thamdrup, B., Fossing, H.,and Rysgaard, S.: Benthic carbon mineralization in a high-arcticsound (Young Sound, NE Greenland), Mar. Ecol.-Prog. Ser., 206,59–71, 2000.
Glud, R. N., Gundersen, J. K., Roy, H., and Jorgensen, B. B.: Sea-sonal dynamics of benthic o-2 uptake in a semienclosed bay: Im-portance of diffusion and faunal activity, Limnol. Oceanogr., 48,1265–1276, 2003.
Glud, R. N., Berg, P., Fossing, H., and Jorgensen, B. B.: Effect ofthe diffusive boundary layer on benthic mineralization and o-2distribution: A theoretical model analysis, Limnol. Oceanogr.,52, 547–557, 2007.
Grasshoff, K., Ehrhardt, M., and Kremling, K.: Methods of seawa-ter analysis, Verlag Chemie, 419 pp., 1983.
Hedges, J. I.: Global biogeochemical cycles: Progress and prob-lems, Mar. Chem., 39, 67–93, 1992.
Hedges, J. I. and Keil, R. G.: Sedimentary organic-matter preserva-tion - an assessment and speculative synthesis, Mar. Chem., 49,81–115, 1995.
Hedges, J. I., Keil, R. G., and Benner, R.: What happens to terres-trial organic matter in the ocean?, Org. Geochem., 27, 195–212,1997.
Hopkinson, C. S., Giblin, A. E., and Tucker, J.: Benthic metabolismand nutrient regeneration on the continental shelf of Eastern Mas-sachusetts, USA, Mar. Ecol.-Prog. Ser., 224, 1–19, 2001.
Hulth, S., Tengberg, A., Landen, A., and Hall, P. O. J.: Mineral-ization and burial of organic carbon in sediments of the SouthernWeddell Sea (Antarctica), Deep-Sea Res. I, 44, 955–981, 1997.
Iversen, N. and Jorgensen, B. B.: Diffusion-coefficients of sul-fate and methane in marine-sediments – influence of porosity,Geochim. Cosmochim. Acta, 57, 571–578, 1993.
Jorgensen, B. B. and Revsbech, N. P.: Diffusive boundary-layers and the oxygen-uptake of sediments and detritus, Limnol.Oceanogr., 30, 111–122, 1985.
Keil, R. G., Montlucon, D. B., Prahl, F. G., and Hedges, J. I.: Sorp-tive preservation of labile organic matter in marine sediments,Nature, 370, 549–552, 1994.
Kelly-Gerreyn, B. A., Hydes, D. J., and Waniek, J. J.: Control ofthe diffusive boundary layer on benthic fluxes: A model study,Mar. Ecol.-Prog. Ser., 292, 61–74, 2005.
Lansard, B., Rabouille, C., and Massias, D.: Variability in benthicoxygen fluxes during the winter-spring transition in coastal sedi-ments: An estimation by in situ micro-electrodes and laboratorymini-electrodes, Oceanol. Acta, 26, 269–279, 2003.
Lansard, B., Charmasson, S., Gasco, C., Anton, M. P., Grenz,C., and Arnaud, M.: Spatial and temporal variations of pluto-nium isotopes (Pu-238 and Pu-239, Pu-240) in sediments off theRhone River mouth (NW Mediterranean), Sci. Total Environ.,376, 215–227, doi:10.1016/j.scitotenv.2007.01.069, 2007.
Lansard, B., Rabouille, C., Denis, L., and Grenz, C.: Benthic rem-ineralization at the land-ocean interface: A case study of theRhone River (NW Mediterranean Sea), Estuar. Coast. Shelf Sci.,81, 544–554, doi:10.1016/j.ecss.2008.11.025, 2009.
Leithold, E. L. and Hope, R. S.: Deposition and modification ofa flood layer on the Northern California shelf: Lessons fromand about the fate of terrestrial particulate organic carbon, Mar.Geol., 154, 183–195, 1999.
Lisitsyn, A. P.: The marginal filter of the ocean, Oceanology, 34,671–682, 1995.
Lorke, A., Muller, B., Maerki, M., and Wuest, A.: Breathing sed-iments: The control of diffusive transport across the sediment-water interface by periodic boundary-layer turbulence, Limnol.Oceanogr., 48, 2077–2085, 2003.
Mayer, L. M.: Surface area control of organic carbon accumulationin continental shelf sediments, Geochim. Cosmochim. Acta, 58,1271–1284, 1994.
McKee, B. A., Aller, R. C., Allison, M. A., Bianchi, T. S., andKineke, G. C.: Transport and transformation of dissolved andparticulate materials on continental margins influenced by majorrivers: Benthic boundary layer and seabed processes, Cont. ShelfRes., 24, 899–926, 2004.
Meybeck, M.: Carbon, nitrogen, and phosphorus transport by worldrivers, Am. J. Sci., 282, 401–450, 1982.
Millot, C.: The Gulf of Lions hydrodynamics, Cont. Shelf Res., 10,885–894, 1990.
Miralles, J., Radakovitch, O., and Aloisi, J. C.: Pb-210 sedimen-tation rates from the Northwestern Mediterranean margin, Mar.Geol., 216, 155–167, 2005.
Miserocchi, S., Langone, L., and Tesi, T.: Content and isotopiccomposition of organic carbon within a flood layer in the PoRiver prodelta (Adriatic Sea), Cont. Shelf Res., 27, 338–358,2007.
Monaco, A., de Madron, X. D., Radakovitch, O., Heussner, S., andCarbonne, J.: Origin and variability of downward biogeochemi-cal fluxes on the Rhone continental margin (NW Mediterranean),Deep-Sea Res. I, 46, 1483–1511, 1999.
Morse, J. W. and Rowe, G. T.: Benthic biogeochemistry beneath
Biogeosciences, 7, 1187–1205, 2010 www.biogeosciences.net/7/1187/2010/
C. Cathalot et al.: Temporal variability of carbon recycling in coastal sediments 1205
the Mississippi River plume, Estuaries, 22, 206–214, 1999.Mucci, A., Boudreau, B., and Guignard, C.: Diagenetic mobility of
trace elements in sediments covered by a flash flood deposit: Mn,Fe and As, Appl. Geochem., 18, 1011–1026, 2003.
Naudin, J. J., Cauwet, G., ChretiennotDinet, M. J., Deniaux, B.,Devenon, J. L., and Pauc, H.: River discharge and wind influ-ence upon particulate transfer at the land-ocean interaction: Casestudy of the Rhone River plume, Estuar. Coast. Shelf Sci., 45,303–316, 1997.
Neveux, J. and Lantoine, F.: Spectrofluorometric assay of chloro-phylls and pheopigments using the least-squares approximationtechnique, Deep-Sea Res. I, 40, 1747–1765, 1993.
Pont, D., Simonnet, J. P., and Walter, A. V.: Medium-term changesin suspended sediment delivery to the ocean: Consequences ofcatchment heterogeneity and river management (Rhone River,France), Estuar. Coast. Shelf Sci., 54, 1–18, 2002.
Rabouille, C., Denis, L., Dedieu, K., Stora, G., Lansard, B., andGrenz, C.: Oxygen demand in coastal marine sediments: Com-paring in situ microelectrodes and laboratory core incubations, J.Exp. Mar. Biol. Ecol., 285, 49–69, 2003.
Radakovitch, O., Charmasson, S., Arnaud, M., and Bouisset, P.:Pb-210 and caesium accumulation in the Rhone delta sediments,Estuar. Coast. Shelf Sci., 48, 77–92, 1999a.
Radakovitch, O., Cherry, R. D., and Heussner, S.: Pb-210 and po-210: Tracers of particle transfer on the Rhone continental margin(NW Mediterranean), Deep-Sea Res. I, 46, 1539–1563, 1999b.
Rees, G. N., Bowen, P. M., and Watson, G. O.: Variability in benthicrespiration in three southeastern australian lowland rivers, RiverRes. Applic., 21, 1147–1156, 2005.
Reimers, C. E., Jahnke, R. A., and McCorkle, D. C.: Carbon fluxesand burial rates over the continental slope and rise off centralCalifornia with implications for the global carbon cycle, GlobalBiogeochem. Cy., 6, 199–224, doi:10.1029/92GB00105, 1992.
Revsbech, N. P.: An oxygen microsensor with a guard cathode,Limnol. Oceanogr., 34, 474–478, 1989.
Roy, H., Huttel, M., and Jorgensen, B. B.: The role of small-scalesediment topography for oxygen flux across the diffusive bound-ary layer, Limnol. Oceanogr., 47, 837–847, 2002.
Salen-Picard, C. and Arlhac, D.: Long-term changes in a Mediter-ranean benthic community: Relationships between the poly-chaete assemblages and hydrological variations of the RhoneRiver, Estuaries, 25, 1121–1130, 2002.
Sempere, R., Charriere, B., Van Wambeke, F., and Cauwet, G.: Car-bon inputs of the Rhone River to the Mediterranean Sea: Biogeo-chemical implications, Global Biogeochem. Cy., 14, 669–681,2000.
Smith, S. V. and Hollibaugh, J. T.: Coastal metabolism and theoceanic organic-carbon balance, Rev. Geophys., 31, 75–89,1993.
Sommerfield, C. K. and Nittrouer, C. A.: Modern accumulationrates and a sediment budget for the Eel shelf: A flood-dominateddepositional environment, Mar. Geol., 154, 227–241, 1999.
Sundby, B.: Transient state diagenesis in continental margin muds,Mar. Chem., 102, 2–12, 2006.
Sweerts, J., Stlouis, V., and Cappenberg, T. E.: Oxygen concen-tration profiles and exchange in sediment cores with circulatedoverlying water, Freshwater Biol., 21, 401–409, 1989.
Tesi, T., Miserocchi, S., Goni, M. A., and Langone, L.: Source,transport and fate of terrestrial organic carbon on the WesternMediterranean Sea, Gulf of Lions, France, Mar. Chem., 105,101–117, 2007.
Tesi, T., Langone, L., Goni, M. A., Miserocchi, S., andBertasi, F.: Changes in the composition of organic mat-ter from prodeltaic sediments after a large flood event (PoRiver, Italy), Geochim. Cosmochim. Acta, 72, 2100–2114,doi:10.1016/j.gca.2008.02.005, 2008.
Ulses, C., Estournel, C., de Madron, X. D., and Palanques, A.: Sus-pended sediment transport in the Gulf of Lions (NW Mediter-ranean): Impact of extreme storms and floods, Cont. Shelf Res.,28, 2048–2070, doi:10.1016/j.csr.2008.01.015, 2008.
Wheatcroft, R. A. and Borgeld, J. C.: Oceanic flood deposits onthe Northern California shelf: Large-scale distribution and small-scale physical properties, Cont. Shelf Res., 20, 2163–2190, 2000.
www.biogeosciences.net/7/1187/2010/ Biogeosciences, 7, 1187–1205, 2010