temporal reliability of estimates from contingent …rcarson/papers/temporalreliability.pdfrichard...
TRANSCRIPT

Temporal Reliability of Estimates from Contingent Valuation
Richard T. Carson; W. Michael Hanemann; Raymond J. Kopp; Jon A. Krosnick; Robert C.Mitchell; Stanley Presser; Paul A. Rudd; V. Kerry Smith; Michael Conaway; Kerry Martin
Land Economics, Vol. 73, No. 2. (May, 1997), pp. 151-163.
Stable URL:
http://links.jstor.org/sici?sici=0023-7639%28199705%2973%3A2%3C151%3ATROEFC%3E2.0.CO%3B2-0
Land Economics is currently published by University of Wisconsin Press.
Your use of the JSTOR archive indicates your acceptance of JSTOR's Terms and Conditions of Use, available athttp://www.jstor.org/about/terms.html. JSTOR's Terms and Conditions of Use provides, in part, that unless you have obtainedprior permission, you may not download an entire issue of a journal or multiple copies of articles, and you may use content inthe JSTOR archive only for your personal, non-commercial use.
Please contact the publisher regarding any further use of this work. Publisher contact information may be obtained athttp://www.jstor.org/journals/uwisc.html.
Each copy of any part of a JSTOR transmission must contain the same copyright notice that appears on the screen or printedpage of such transmission.
The JSTOR Archive is a trusted digital repository providing for long-term preservation and access to leading academicjournals and scholarly literature from around the world. The Archive is supported by libraries, scholarly societies, publishers,and foundations. It is an initiative of JSTOR, a not-for-profit organization with a mission to help the scholarly community takeadvantage of advances in technology. For more information regarding JSTOR, please contact [email protected].
http://www.jstor.orgMon Jan 21 20:07:39 2008
Temporal Reliability of Estimates f rom Contingent Valuation
Richard T. Carson, W.Michael Hanemann, Raymond J. Kopp, Jon A. Krosnick, Robert C. Mitchell, Stanley Presser, Paul A. Ruud,
and K Keny Smith with Michael Conaway and K e y Martin
ABSTRAm. In 1992 the National Oceanic and Atmospheric Administration (NOAA) convened a panel of prominent social scientists to assess the reliability of natural resource damage estimates de-rived from contingent valuation (CU. The panel recommended that "time dependent measurement noise should be reduced by averaging across inde-pendentb drawn samples taken at different points in time." In this paper we eramine the temporal relia-bility of CV estimates. Our findings, using a CV instrument designed to measure willingness to pay for a p r o p m to protect Prince William Sound, Alaska, from future oil spills, exhibited no signifi-cant sensitiuity to the timing of the interviews. (JEL Q26, D60)
I. INTRODUCTION
Over the past two decades the use of contingent valuation (CV) in policy analysis and academic research has grown rapidly. According to one estimate there are now almost two thousand studies in the litera-ture dealing with CV (see Carson et al. 1995). Special attention has focused on its use in estimating passive use value because indirect methods can only measure use-re-lated values.' While there is a substantial literature describing the theoretical founda-tion for nonuse or passive use values (e.g., Krutilla 1967; Plourde 1975; McConnell 1983), the prospect of routinely including estimates for these losses in natural re-source damages has generated considerable c o n t r o ~ e r s ~ . ~The 1989 Court of Appeals ruling in Ohio v. Department of the Interior held that lost passive use values should be included in damage awards resulting from injuries to natural resources due to releases
The authors are, respectively: associate professor of economics, University of California (San Diego); pro-fessor of agricultural and natural resource economics, University of California (Berkeley); senior fellow, Re-sources for the Future; associate professor of psychol-ogy and political science, Ohio State University; profes-sor of geography, Clark University; professor of sociol-ogy, University of Maryland (College Park); professor of economics, University of California (Berkeley); and arts and sciences professor, Duke University and uni-versity fellow, Resources for the Future. Conaway and Martin are members of Natural Resource Damage Assessment, Inc., and made extensive contributions throughout the effort. The work described in this paper was funded by the Damage Assessment Office of the National Oceanic and Atmospheric Administration as part of a natural resource damage assessment under contract number 50-DGNC-1-00007. Additional sup-port to aid in the preparation of this paper was pro-vided Smith by the UNC Sea Grant Program under Grant No. R/MRD-25. Thanks to Richard Bishop, Trudy Cameron, Nicholas Flores, Carol Jones, Norman Meade, Pierre Du Vair, Alan Randall, and two anony-mous referees for comments on aspects of this work. All opinions expressed in this paper are those of the authors and should not be attributed to the National Oceanic and Atmospheric Administration, the Alfred P. Sloan Foundation, or any persons or organizations acknowledged above.'The term passive use was first used in the ruling by the United States Court of Appeals for the District of Columbia in Ohio u. Department of the Interior, 880 F.2d 432 (D.C. Cir. 1989). The value derived from passive use has been referred to as nonuse value, existence value, and bequest value. Option value is also listed as a component of passive use value in some of the discussion explaining the ruling. The literature now generally recognizes option value as a measure of peo-ple's risk aversion for factors that might affect the ability to have access to or use environmentalresources and therefore not a component of nonuse values (see Smith 1987 and Randall 1991). In addition, subsequent research by Larson (1993) has suggested that existence values could be measured with assumptions from infor-mation about people's use of the resource to be valued. While Larson's derivation is correct, his interpretation requires specific untestable assumptions restricting in-dividual preferences to offer the interpretation as exis-ten$e values (Bockstael and McConnell 1993).
See Diamond and Hausman (1994) and Hane-mann (1994) as examples.
Land Economics May 1997 73 (2): 151-63

152 Land Economics May 1997
of hazardous substance^.^ Under this deci- sion, it is unnecessary for an individual to be a direct user of a natural resource, for ex- ample as a recreationist, to hold an eco-nomic value for the resource in q ~ e s t i o n . ~ The Ohio Court also emphasized the impor- tance of the "reliability" of the methods used to estimate natural resource damages.' Because contingent valuation is currently the only technique available to measure economic values that include use and pas- sive use, much of the current CV research has been directed at evaluating its reliabil- ity.
To assess the reliability of natural re-source damage estimates derived from CV, the National Oceanic and Atmospheric Ad- ministration (NOAA) convened a panel of prominent social scientist^.^ The Panel's re- port concluded that:
under those conditions (and others specified above), CV studies convey useful information. We think it is fair to describe such information as reliable by the standards that seem to be implicit in similar contexts, like market analysis for new and innovative products and the assess- ment of other damages normally allowed in court proceedings. (Federal Register, January 15, 1993, 4610)
The Panel's "conditions" are a set of guide- lines for CV survey design, administration, and data analysis.' This paper focuses on one of these guidelines-the Panel's call for the "temporal averaging" of willingness-to- pay (WTP) responses obtained from CV surveys as one method for increasing their reliability. The Panel suggested:
Time dependent measurement noise should be reduced by averaging across independently drawn samples taken at different points in time. A clear and substantial time trend in the responses would cast doubt on the "reliability" of the findings. (Federal Register, January 15, 1993, 4609)
The reasoning underlying the NOAA Panel's recommendation for temporal aver- aging is not clear. Measurement error can be reduced by averaging across multiple ob- servations that are assumed to be realiza- tions from the same underlying stochastic
The opinion in Ohio u. Department of the Interior stated,
On remand, DO1 should consider a rule that would permit trustees to derive use values for natural re- sources by summing up all reliably calculated use values, however measured, so long as the trustee does not double count. (p. 87)
The opinion made clear that its definition of use values included use and passive use or nonuse values.
We adopt the term "economic value" rather than simply "value" to distinguish our meaning from other uses of the word value. Economic values are defined by an individual's choices. When it is known that someone chooses to give up x in order to obtain y, we can conclude the economic value of y (termed the object of choice) is at least x.
In the debate over the appropriate uses of CV, the word "reliability" is frequently used. It is not apparent, however, that this word has the same meaning to all the participants in the debate. As noted in Kopp and Pease (1997), a recent U.S. Supreme Court decision concerning the admissibility of scientific evidence (Daubert u. Merrell Dow Pharmaceuticals, 113 S.Ct. 2786, 2795, n9 (1993)), noted that while scientists "typically distinguish between 'validity' (does the principle sup- oort what it Duruorts to show?) and 'reliabilitv' (does gpplication bf 'the principle produce cohsistent results?)," the Court emphasized its "reference here is to evidentiary reliabilityLthat is, trustworthiness." As used by the Ohio Court and in the NOAA Panel report, the reliability of a measure is the degree to which it measures the theoretical construct under in- vestigation. However, in the empirical social sciences, this preceding definition pertains to validity, whereas reliability is defined in terms of replicability: the extent to which the same results are obtained when the identi- cal measurement procedures are repeated. We use the term reliability in this latter sense.
The Panel was co-chaired by two Nobel Laureate economists, Kenneth Arrow and Robert Solow. The additional members of the Panel were: Edward Leamer of the University of California, Los Angeles, Paul Port- ney of Resources for the Future, Roy Radner of Bell Laboratories and New York University, and Howard Schuman of the University of Michigan. The Panel's report was published in the January 15, 1993, issue of the Federal Register. 'In addition to temporal averaging, the Panel also
recommended: (a) the use of probability samples allow- ing inference to target population, (b) personal inter- views, (c) careful pretesting for interviewer effects and questionnaire design, and (d) the minimization of non- response. The Panel also made specific recommenda- tions for the survey itself. These recommendations included: (a) a conservative survey design (i.e., one that tends to understate values), (b) a willingness-to-pay referendum style value elicitation format, (c) accurate description of the program or policy, (d) pretesting of photographs, (e) reminder of undamaged substitute

153 73(2) Carson et al.: Contingent Valuation
process. The Panel's report raises concern about the existence of time dependency in the location or scale parameters for CV constructed measures of willingness to pay.
However each individual's economic value for a commodity should be expected to change with the conditions that influence any choice. In general, the prices (and avail- ability) of substitutes and complements, level of income, and all other factors that would affect these decisions can be expected to be determinants of measures of economic val- u e ~ . ~Thus, changes in estimates of eco-nomic value, alone, are not likely to be the source of the NOAA Panel's call for atten- tion to the temporal reliability of CV. Rather it might represent a concern that immediate reactions to an event, such as a large oil spill, may be particularly labile. Thus, for example, public reaction might initially en- tail outrage directed at the party thought to be responsible, or more generally, people may require time to evaluate the full impli- cations of the event. With time, such short- term responses may be often modified as more information about the cause, and the full consequences of the event, becomes known. The Panel's suggestion might be treated as a concern over the timing of a single CV survey in relation to the event giving rise to natural resource injuries.
In this context temporal averaging would not improve the estimates. Their hypothesis implies WTP estimates constructed from one set of responses would be superior to those at the times that are more subject to these short-term influences. Given such concerns, it is important to distinguish research on the stability of CV estimates of WTP over time from a recommendation to average the esti- mates for increased reliability. The alterna- tive hypotheses providing reasons for focus- ing research on temporal stability all suggest temporal averaging would not improve the properties of CV estimate^.^
Our findings use a CV instrument de- signed to measure WTP for a program to protect Prince William Sound, Alaska, from future oil spills, like the Exxon Valdez spill. These results indicate that choices made two years after the spill are not significantly
different from those made four years after the spill."'
11. TESTING THE TEMPORAL VOLATILITY HYPOTHESIS
On March 24, 1989, the oil tanker I k o n Valdez left the port of Valdez, on its way to the Gulf of Alaska. It ran into the sub- merged rocks of Bligh Reef, releasing some 11 million gallons of Prudoe Bay crude oil into the waters of Prince William Sound. As part of its damage assessment, the State of Alaska funded a CV study (Carson et al. 1992) designed to measure the passive use losses due to the spill. With few exceptions, that study followed the survey design and administration procedures subsequently rec- ommended by the NOAA CV Panel. The Exxon Valdez spill together with the Carson et al. study offer a unique opportunity to investigate the question posed by the NOAA Panel. By conducting a comparable analysis four years after the spill we can investigate whether the timing of this initial study was within the interval the Panel implicitly sus- pected could be problematic. To undertake our analysis, we compare the results of the
commodities, (f) adequate time lapse from the acci- dent, (g)no-answer option, (h) yes/no follow-ups, and (i) checks on understanding and acceptance of the object of choice presented in the CV survey.
In the case of resources that are assumed to provide a source of passive use values it is reasonable, following Hanemann (19881, to assume they make sep- arable contributions to individual preferences. Under this premise we would expect that the amount and conditions of access to other substitute resources could influence these choices, but the relative prices of other goods making the separable contribution to prefer-ences would not. In that case measures of economic value would respond to changes in only the aspects of the circumstances of choice related to income and nonmarket substitutes.
There has been some evidence that news and its sources influence public opinions. See Jordan (1993) as one example.
lo Carson and Mitchell (1993) also report the results of a replication study. Their study, using a CV instru- ment to value changes in surface water quality, showed no sigmficant differences in estimates of willingness to pay (after adjusting by changes in the consumer price index) between two surveys conducted three years apart.

154 Land Economics May 1997
original national face-to-face survey con-ducted from January to mid-April 1991 with those of a follow-up, face-to-face survey conducted in 1993 two years later, using the identical questionnaire and a comparable sample. Because of the complexity of each study and the importance of the design and survey administration to the issue of relia- bility, we discuss each study separately.
After four field pilot tests, the original Exxon Valdez damage assessment survey was placed into the field in January of 1991, 22 months after the spill." The field adminis- tration of the survey was conducted by Wes- tat, one of the nation's leading survey orga- nizations, using a multi-stage area probabil- ity sample of residential dwelling units (DU) drawn from the 50 United States and the District of Columbia. The Primary Sampling Units (PSUs) consisted of Westat's National Master Sample supplemented by the Hon- olulu SMSA.'~ Within each of the 61 PSUs, the second-stage selections were drawn from a list of all the Census blocks in the PSU. The lists were stratified by two block charac- teristics: percent of the population that was black, and a weighted average of the value of owner-occupied housing and the rent of renter-occupied housing. The 334 secondary selections were then drawn with probabili- ties proportionate to their total population counts. In the third stage, approximately 1,600 dwelling units were drawn from the selected blocks. Within each dwelling unit, a household member 18 or older who owned, rented, or paid toward the mortgage or rent was selected at random to be the respon- dent. The overall response rate for the orig- inal study was 75.2 percent, yielding a sam- ple of 1,043 cases.13
Our second survey was conducted by the National Opinion Research Center (NORC) of the University of Chicago as part of an empirical study involving 1,408 interviewed households. Three hundred of these respon- dents received the original Alaska question- naire and visuals. The remaining 1,108 households received versions of the original Alaska instrument that were modified to examine other issues not relevant to this study.14
The sample was composed of 12 PSUs selected from NORC's master area proba- bility sample: Baltimore, MD; Birmingham, AL; Boston, MA; Charleston, SC; Harris- burg, PA, Ft. Wayne, IN; Manchester, NY; Nicholas County, KY; Portland, OR; Rich- mond, VA; Seattle, WA; and Tampa, FL. Six segments were selected from each PSU, resulting in 72 segments. 1,925 dwelling units were then randomly selected from the 72 segments. NORC's sampling staff then ran- domly assigned one of four interview ver- sions of the questionnaires comprising our larger study to each selected dwelling unit in advance of the field period.
The selection of the respondent for the interview was made from all individuals in the household meeting the same eligibility requirements as with the original 1991 Exxon Valdez survey.15 The interviews for this study were conducted over an eight-week period from May 26 to July 17, 1993, and the overall response rate was 73 percent. As in the original survey, non-English-speaking households were ineligible for the survey.
Due to differences in how PSUs were drawn in the first stage of sample selection, the original 1991 sample and the 1993 sam- ple are not fully equivalent. In the 1991 sample, the first-stage PSU selection fol- lowed a full probability selection scheme, The 12 PSUs in the 1993 sample were se- lected from NORC's master list by choosing
l1 A complete description of the h a 1 survey and its development is provided in Carson et al. (1992).
l2 Westat's Mastet Sample of 60 PSUs was selected from a list that grouped the 3,111 counties in the continental United States in 1980 into 1,179 PSUs, each consisting of one or more adjacent counties. The 1980 census was used since results from the 1990 census were not available at the time the sample was drawn. Because Alaska and Hawaii were excluded from Westat's original sampling list, a new stratum was cre- ated consisting of those two states. A random selection of ??Us from this stratum yielded the Honolulu SMSA.
Non-English-speaking households were iheligible for the survey.
l4 Results of the larger study are contained in Car- sonlFt al. (1994).
In households with more than one eligible re- spondent, the interviewer used a random number table to select one eligible respondent for the main inter- view.

155 73(2) Carson et al.: Contingent Valuation
PSUs where NORC had sufficient inter-viewers to conduct the study. In all subse- quent stages of sample selection (i.e., choos- ing Census blocks, dwelling units, and re-spondents), the samples were drawn with identical procedures. One effect of the dif- ference in the first-stage sampling was to exclude the major metropolitan areas of New York, Philadelphia, Chicago, and Los Ange- les (included in the 1991 sample) from the 1993 sample.
Since the first-stage sampling differs in the 1991 and 1993 samples, we provide two different procedures to adjust for sample differences. Section IV presents results based on a choice function, conventionally used in tests of construct validity (Mitchell and Carson 1989). The specification for this function was based on the construct validity test with the 1991 sample. We use this func- tion to test for differences in the parameters associated with the factors influencing choices with the two samples. In addition, we replicated all of the analyses reported in this paper using a subsample of the 1991 sample that excluded the following PSUs: Bronx / Manhattan, NY; Kings / Queens / Richmond, NY; Nassau / Suffolk, NY; Philadelphia, PA, Chicago, IL; Los Angeles, CA. None of the test outcomes are changed when using this sub-sample. Therefore, we focus our discussion on analyses that com- pare the full 1991 sample with our 1993 replication.
111. RESULTS
The questionnaire uses a referendum value elicitation format. Respondents were asked to vote on a program that, for the next ten years, would protect Prince William Sound from another oil spill causing natural resource injuries comparable to those from the Exxon Valdez spill. Questions were also asked in a double-bounded format so that if the respondents said they voted "for" the protection program then they were asked about a higher one-time cost question. Re- spondents answering "against" or "not sure" to the first amount were offered the pro- gram at a lower amount. Four versions of the base survey questionnaire, differing only
in the amounts used in these two questions, were administered.16
Tests for the effects of the timing of the initial Alaska survey were undertaken in three ways: simple contingency analyses with both the first and the second response; anal- ysis of the estimated parameters for the choice functions from each sample; and es- timates of the WTP from each sample. We consider each in turn.17
Results for Contingency Table
The first panel in Table 1 reports the percentage of respondents voting "for" or "against" adoption of the protection pro-gram based on the first question. The table displays the percentages for the two surveys, for each of the four dollar amounts used. Simple inspection of the distributions sug- gests that the results of the initial Alaska survey were not impacted by its proximity to the incident. The identical survey conducted two years later provides equivalent results.
The null hypothesis of equal proportions voting "for" and "against" the plan is tested
16 The actual amounts used are displayed below.
Second Second Amount Amount
First If "For" If "Against" Version Amount the Program the Program
A $10 $30 $5 B $30 $60 $10 C $60 $120 $30 D $120 $250 $60
l7 An approximate way to consider the power of our test of reliability is to use the Mitchell-Carson (1989, 365-66) evaluation of sample requirements to isolate specified differences in means expressed in propor- tional terms. Given the p-value for probability of a Type I error for the test, the desired power, and an assumption about the coefficient of variation for the initial sample, Table C-4 provides (for a two-sided t-test) the desired sample size when a = .05 and power = .90. Taking the assumed coefficient of variation (cu) as the estimate based on the lower bound mean for 1991 we have cu = .04. This is substantially below the estimates in Table C-4. Nonetheless, using cu = .1 as a conservative assumption, a sample size of 28 would be required to detect 10 percent differences in the means (32 for power = .95). Our sample of 300 clearly exceeds this standard.

Land Economics May 1997
TABLE 1 CONTINGENCY OF VOTESFORIAGAINST PLANANALYSIS PREVENTION
Percent Voting For/Against Plana Contingency Test-xz
First Dollar For Against First Voteb First and Second
Amount 1991 1993 1991 1993 For/Against With DK Without DK VoteC
*Significantly different at the 95 percent level. 'Both the 1991 and 1993 surveys permit respondents to reconsider their votes later in the survey. This analysis considers
only the response to the first vote question and therefore does not reflect reconsideration of the vote. b"~or /~gains t"recodes volunteered "don't know/not sure" responses as "against." With DK includes "for," "against,"
and "don't know/not sure" as separate categories. Without DK drops the "don't know/not sure" responses from the sample.
'"First and Sewnd Vote" base the outcome of the second vote on any reconsiderations the respondent made, that is, changing their vote from "for" to "against."
four ways with these choices. Using the first question we consider: (a) votes with "don't know" and "not sure" recoded as against;'' (b) "don't know" and "not sure" treated as a separate category so three responses are allowed (i.e., "for," "against," and "don't know/not sure"); and (c) deleting the "don't know/not sure" responses. The next three columns in Table 1 report the chi square statistics for each possible interpretation of the choices reported with each dollar amount. None would permit rejection of the null hypothesis of equal proportions in the categories identifying the respondents' choices.
The last column in Table 1 presents the results using choices from the first and sec- ond voting questions. There are four possi- ble voting patterns based on both response questions-for-for, for-against, against-for, and against-against. The null hypothesis of equal distribution between the two surveys can be rejected only at the $30 amount.
Results for Choice Function
Three estimators for the choice function were used in testing consistency as part of construct validity tests for respondents' choices in the two samples. Both probit and Weibull survival models were applied to the responses from the first question. In addi- tion, we used the responses to both ques-
tions to develop interval censored estimates of a WTP function (i.e., the so-called dou- ble-bounded model, see Hanemann, Loomis, and Kanninen 1991) and again used a Weibull framework to evaluate the factors influencing the choices used in estimating this equation.
Each of the estimators has quite different implicit assumptions. The probit was esti- mated in terms of the level of the tax amount (and thus is consistent with a linear random utility or WTP specification, see McConnell 1990). It does not constrain the probability of favoring the program to unity as the tax amount declines to zero. The Weibull's lo- cation parameter assumes a model that im- plies independent variables in linear form will shift the log of median (or mean) WTP. It also constrains the probability to vote "for" the program to be unity when the proposed tax amount is zero.
The double-bounded estimator is perhaps the most controversial approach in that it relies on the responses to both questions being governed by the same underlying probability distribution. Cameron and Quig- gin (1994) have suggested violations in this assumption can bias the estimates of WTP
18 These responses were not offered by interviewers but were recorded if respondents voluntarily offered either answer.

73(2) Carson et a l : Contingent Valuation
and of the parameters in the WTP function used to describe the choice^.'^ Our primary concern here is with the consistency in the overall conclusions from fitting these mod- els to both samples.
Table 2 defines the independent variables included in all choice models. These factors correspond to the regressors selected for the original 1991 survey (see Carson et al. 1992 for a more complete discussion). Be- cause this analysis seeks to evaluate whether replication would change conclusions about choices, we did not consider alternative specifications. Table 3 presents the probit and survival function estimates. The data from the two surveys are pooled for a total of 1,144 observation^.^" The first column of Table 3 presents the probit results. Standard errors are shown in parentheses beside the coefficients. The variable labeled as "1993" identifies the replication sample as an inter- cept shift. It is not significantly different from zero, implying that under the assump- tion of common slope parameters, there is no shift in the choice model. The second and third columns of Table 3 imply the same conclusion, using the single- and dou- ble-bounded Weibull survival models.
Table 4 presents the results of relaxing the common slope parameter assumption. Each of the three models presented (probit, single-bounded survival, and double-bounded survival) contain a 1993 intercept shifting variable and interaction dummy variables (denoted N variable) for each of the independent variables (to allow testing for differences in each parameter between the two samples). The 1993 intercept shift- ing variable is again insignificant in all three models. With the probit and single-bounded survival estimates, only the COASTAL in-teraction slope effect would be judged sig- nificantly different from zero at the 5 per-cent level. Estimates for the double-bounded model imply none of the slope parameters are significantly different between the two choice functions for the two samples. Over- all, then, the determinants of choices in the samples separated by two years remained stable.21
Willingness-to-Pay Estimates
Our estimates for the mean WTP use the Turnbull (1976) nonparametric estimator based on interval censored data along with Carson et al.'s (1994) method for estimating a lower bound for the mean of the underly- ing WTP distribution. Assuming referen- dum questions with a single take-it or leave- it decision, the design of responses over proposed costs, t j allows respondents to be sorted into two groups for each cost (or tax amount). This allows the distribution func- tion to be defined as:
1 - Qj= Probability(WTP > t , ) .
To develop a maximum likelihood estimator for the distribution function we need only the frequencies in each cell. The log-likeli- hood function, I , is given in equation [I].
where
N, = number of respondents indicating "against" program at tax amount ti,
l9 There have been a variety of responses to the critique. Kanninen (1995) argues implicitly that the bias could be due to poor bid design. Alberini's (1995) analysis of the properties of different bid designs also "accepts" the responses to the second question as arising from the same underlying distribution as the first."The original 1991 and the recent 1993 data sets employed in the contingency table tests had 1,043 and 300 observations, respectively, for a total of 1,343 ob-servations. In the choice function equations we employ the logarithm of income as an explanatory variable. In the 1991 and 1993 data there are 160 and 39 observa-tions, respectively, that have missing income informa- tion. This reduces the size of the pooled data set that can be used to estimate the choice functions to 1,144 observations.
21 There are actually different hypotheses implied by each estimator. With the probit model, the parame- ters reflect both the location and scale parameters for the distribution. In the Weibull model, they measure the percentage change in latent WTP with a change in each independent variable.

1993
Land Economics May 1997
TABLE 2 DEFINITIONOF VARIABLES
Variable Name Coding of Variable
Constant Intercept, equals unity for all respondents Coded as 1 if respondent from the 1993 replication sample; 0 otherwise
wlamt Dollar amount for first stated tax amount linc Logarithm of household income protest Response coded as 1 if respondent protested that Exxon or the oil companies should pay for the
plan before they were asked how they would vote; 0 othenuise Response coded as 1 if respondent answered B-1 as more damage and B-2 as 3 indicating great
deal more damage than Exxon Valdez in absence of escort ship plan; 0 otherwise more Response coded as 1 if respondent answered B-1 as more damage and B-2 as 2 indicating somewhat
more damage than Exxon Valdez in absence of escort ship plan; 0 otherwise less Response coded as 1 if respondent answered B-1 as less damage and B-3 as a little or a lot less than
Exxon Valdez in absence of escort ship plan; 0 otherwise Response coded as 1 if respondent answered B-1 as less damage and B-3 as no damage in relation
to Exxon Valdez in absence of escort ship plan; 0 otherwise mwork Response coded as 1 if respondent answered plan not completely effective (B-7) and suggest in B-8
it would reduce damage a little or a moderate amount; 0 otherwise nwork Response coded as 1 if respondent answered plan not completely effective (B-7) and suggest in B-8
it would not reduce damage at all; 0 otherwise name Response coded as 1 if respondent spontaneously named the Exxon Valdez as one of the major
environment accidents caused by humans; 0 otherwise coastal Response coded as 1 if respondent rated as personally (A-3) protecting coastal areas from oil
spills as "extremely important" or "very important"; 0 otherwise wild Response coded as 1 if respondent indicated (A-4) government should over next few years set aside
very large amount or large amount of new land as wilderness; 0 otherwise Response coded as 1 if respondent identifies himself or herself as a strong environmentalist
(B-17 = 1 or 2); 0 otherwise Response coded as 1 if respondent indicates household "very likely" or "somewhat likely" to visit
Alaska in future; 0 otherwise white Response coded 1 for Caucasian, 0 otherwise
2;. = number of respondents indicating "for" The unobserved mean is bounded from be- program at tax amount t,, low by the estimated lower-bound mean and
k = number of values for t,. from above by the estimated upper-bound The lower-bound estimate of mean WTP is mean.23 defined in equation [2].22 The Turnbull lower-bound mean esti-
mate from the 1991 sample, using responses to the first voting question, is $52.80 with a
WTPLB= 0 . Prob(0 I WTP < t , ) standard error of $2.12. The comparable estimate for the 1993 sample is $52.81 with
+ t , .Prob(t, IWTP < t 2 )
+ t2.prob(t2 IWTP < t , ) 22 Estimation with two questions yields interval esti-
+ ....+ I , - , mates of @ (e.g., (Qj - Q,- ,)). The likelihood function can be defined using these intervals. See Haab and Mc$onnell(1996) for further illustration of the method.
Prob(t,-, I WTP < t ,) This statement is true irrespective of the particu- lar amounts used to define the intervals, although the particular tax amounts used can influence how much + t, . ( 1 - @,). [21 less the lower-bound mean is than the sample mean.

Carson et al.: Contingent Valuation
TABLE 3 CHOICEFUNCTIONS
Variable Probit. First Vote Survival First & Second Vote
Survival
1993 wlamt linc protest grnore more less nodam mwork nwork name coastal wild Stenu likuis white -cons
Note: n = 1,144. *Indicates significance at the 95 percent level.
a standard error of $4.08. Whether or not IV. CONCLUSION we adjust for the effects of changes in the general price level over this time, there is Three features of the stated choices of no significant difference between the two our respondents that might vary over time samples' lower-bound means.24 have been examined. They are (1) the distri-
Moreover, as one would suspect from the bution of "for" and "against" votes, (2) pa- tests using contingency tables, our conclu- rameters of estimated choice functions, and sions are insensitive to the treatment of (3) lower-bound estimates for the mean "don't know/not sure" responses. Deleting WTP. Choices were not significantly differ- them from the sample yields a lower-bound ent. Several sets of estimates for the lower- mean of $56.41 (2.21) for the 1991 sample bound mean of WTP were not significantly and $57.27 (4.33) for the 1993 sample, with different in real terms, and the choice func- an asymptotic Z statistic (0.89) indicating tions were remarkably stable. no significant difference. We should expect estimates of the WTP
Using the first and second vote choices for any object of choice to change as impor- and the reconsideration questions to con- tant aspects of the circumstances of choice struct interval censored measures for esti- change. The NOAA Panel's recommenda- mating the distribution functions yields tion to consider evidence of "a clear and seven WTP intervals: (1) $0 to $5, (2) $5 to substantial time trend in responses" as a $10, (3) $10 to $30, (4) $30 to $60, (5) $60 to source of "doubt on the 'reliability' of the $120, (6) $120 to $250, and (7) above $250. findings" is best interpreted as a concern The lower bound Turnbull mean based on about the timing of CV surveys in relation- these seven intervals and using the 1991 sample is $54.23 ($2.72), while the compara- ble estimate based on the 1993 sample is $54.02 ($5.13). As with the cross tabulations "Using the consumer price index to adjust for the
for choices alone and the choice functions, price increases scales the 1991 estimate by 1.061. Then the asymptotic Z-statistic testing equality of the two
these estimates are not significantly differ- means is 1.16, implying the null hypothesis of equality ent. cannot be rejected at any conventional p-value.

Land Economics May 1997
TABLE 4 CHOICEFUNCTIONS INTERACTIONWITH FULL EFFECTS
Variable Probit. First Vote Survival First & Second Vote Survival
1993 wlamt linc protest p o r e more less nodam mwork nwork name coastal wild stenu 1ikui.s white n-wlamt n-linc n -prtest n m o r e n -less n-nodam nmwork n-name n-coast n-wild n-stenu n-likuis n-white -cons
Note: n = 1,144. *Indicates significance at the 95 percent level.
ship to the date of the accident that may by Roper Starch Worldwide, Inc.), as well as have prompted interest in measuring passive the decline in the percent reporting that we use losses (i.e., for a damage assessment). are spending too little on improving and Our results suggest that a random sample of protecting the environment (as reported respondents' choices four years after the from surveys by the National Opinion Re- Exxon Valdez accident do not imply eco- search Center) over the approximate period nomic values that would be judged to be covered by Exxon Valdez (1991) and NORC significantly different from what an inde- replication (1993) surveys.26 To believe that pendent sample selected in 1991 stated. changes in these broad indicators of envi-
These results are remarkably stable and ronmental attitudes should be reflected in have prompted some diverse responses. For CV measures of WTP one must assume that example, in contrast to the NOAA Panel's CV responses are dominated by broad envi- concerns about too much change, one might ronmental attitudes rather than preferences ask is there too little change?25 Proponents of these questions might cite the apparent decline in the percent of people identifying
25 We are grateful to John Payne for identifying this environmental issues as problems that most interpretation of the results. concerned them (as reported from surveys 26 See Ladd and Bowman 1995.
161 73(2) Carson et al: Contingent Valuation
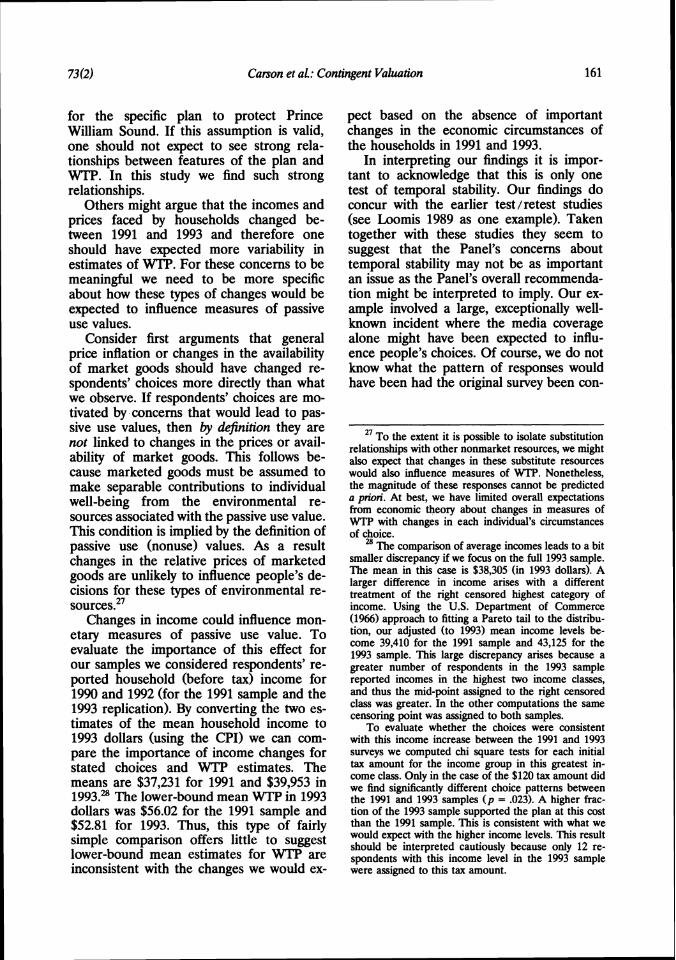
for the specific plan to protect Prince William Sound. If this assumption is valid, one should not expect to see strong rela- tionships between features of the plan and WTP. In this study we find such strong relationships.
Others might argue that the incomes and prices faced by households changed be- tween 1991 and 1993 and therefore one should have expected more variability in estimates of WTP. For these concerns to be meaningful we need to be more specific about how these types of changes would be expected to influence measures of passive use values.
Consider first arguments that general price inflation or changes in the availability of market goods should have changed re- spondents' choices more directly than what we observe. If respondents' choices are mo- tivated by concerns that would lead to pas- sive use values, then by definition they are not linked to changes in the prices or avail- ability of market goods. This follows be- cause marketed goods must be assumed to make separable contributions to individual well-being from the environmental re-sources associated with the passive use value. This condition is implied by the definition of passive use (nonuse) values. As a result changes in the relative prices of marketed goods are unlikely to influence people's de- cisions for these types of environmental re- source~.~"
Changes in income could influence mon- etary measures of passive use value. To evaluate the importance of this effect for our samples we considered respondents' re- ported household (before tax) income for 1990 and 1992 (for the 1991 sample and the 1993 replication). By converting the two es- timates of the mean household income to 1993 dollars (using the CPI) we can com- pare the importance of income changes for stated choices and WTP estimates. The means are $37,231 for 1991 and $39,953 in 1993.~' The lower-bound mean WTP in 1993 dollars was $56.02 for the 1991 sample and $52.81 for 1993. Thus, this type of fairly simple comparison offers little to suggest lower-bound mean estimates for WTP are inconsistent with the changes we would ex-
pect based on the absence of important changes in the economic circumstances of the households in 1991 and 1993.
In interpreting our findings it is impor- tant to acknowledge that this is only one test of temporal stability. Our findings do concur with the earlier testlretest studies (see Loomis 1989 as one example). Taken together with these studies they seem to suggest that the Panel's concerns about temporal stability may not be as important an issue as the Panel's overall recommenda- tion might be interpreted to imply. Our ex- ample involved a large, exceptionally well- known incident where the media coverage alone might have been expected to influ- ence people's choices. Of course, we do not know what the pattern of responses would have been had the original survey been con-
27 TO the extent it is possible to isolate substitution relationships with other nonmarket resources, we might also expect that changes in these substitute resources would also influence measures of WTP. Nonetheless, the magnitude of these responses cannot be predicted a prion. At best, we have limited overall expectations from economic theory about changes in measures of WTP with changes in each individual's circumstances of choice.
The comparison of average incomes leads to a bit smaller discrepancy if we focus on the full 1993 sample. The mean in this case is $38,305 (in 1993 dollars). A larger difference in income arises with a different treatment of the right censored highest category of income. Using the U.S. Department of Commerce (1966) approach to fitting a Pareto tail to the distribu- tion, our adjusted (to 1993) mean income levels be- come 39,410 for the 1991 sample and 43,125 for the 1993 sample. This large discrepancy arises because a greater number of respondents in the 1993 sample reported incomes in the highest two income classes, and thus the mid-point assigned to the right censored class was greater. In the other computations the same censoring point was assigned to both samples.
To evaluate whether the choices were consistent with this income increase between the 1991 and 1993 surveys we computed chi square tests for each initial tax amount for the income group in this greatest in- come class. Only in the case of the $120 tax amount did we find significantly different choice patterns between the 1991 and 1993 samples ( p = .023). A higher frac- tion of the 1993 sample supported the plan at this cost than the 1991 sample. This is consistent with what we would expect with the higher income levels. This result should be interpreted cautiously because only 12 re- spondents with this income level in the 1993 sample were assigned to this tax amount.
162 Land Economics May 1997
ducted closer to the time of the Exxon Valdez oil spill. As a result, our findings do not answer the fundamental question about when CV surveys should be conducted in relation to the timing of large, potentially controversial events like the Exxon Valdez spill. We can say that longer term averaging or trend analysis seems unwarranted in tests of the reliability of CV surveys.
References
Alberini, A. 1995. "Testing Willingness-to-Pay Models of Discrete Choice Contingent Valua- tion Survey Data." Land Economics 71 (Feb.):83-95.
Bockstael, N. B., and K. E. McConnell. 1993. "Public Goods as Characteristics of Nonmar- ket Commodities." Economic Journal 103 (9): 1244-57.
Cameron, T. A., and J. Quiggin. 1994. "Estima- tion Using Contingent Valuation Data from a 'Dichotomous Choice with Follow-up' Ques- tionnaire." Journal of Environmental Eco-nomics and Management 27 (3):218-34.
Carson, R. T., W. M. Hanemann, R. J. Kopp, J. A. Krosnick, R. C. Mitchell, S. Presser, P. A. Ruud, and V. K. Smith. 1994. "Prospective Interim Lost Use Value Due to DDT and PCB Contamination in the Southern Califor- nia Bight." Report to National Oceanic and Atmospheric Administration, Natural Re-source Damage Assessment, Inc., La Jolla, CA. September.
Carson, R. T., and R. C. Mitchell. 1993. "The Value of Clean Water: The Public's Willing- ness to Pay for Boatable, Fishable and Swimmable Quality Water." Water Resources Research 29 (7):2445-54.
Carson, R. T., R. C. Mitchell, W. M. Hanemann, R. J. Kopp, S. Presser, and P. A. Ruud. 1992. "A Contingent Valuation Study of Lost Pas- sive Use Values Resulting From the Exxon Valdez Oil Spill." Report to the Attorney General of the State of Alaska.
Carson, R. T., J. Wright, N. Carson, A. Alberini, and N. Flores. 1995. "A Bibliography of Con- tingent Valuation Studies and Papers." Natu- ral Resource Damage Assessment, Inc., La Jolla, CA.
Diamond, P., and J. A. Hausman. 1994. "Contin- gent Valuation: Is Some Number Better Than No Number?" Journal of Economic Perspec- tives 8 (4):45-64.
Haab, T. C., and K. E. McConnell. 1996. "Count Data Models and Recreational Demand." American Journal of Agricultural Economics 78 (1):89-102.
Hanemann, W. M. 1988. "Three Approaches to Defining 'Existence' or Nonuse Values Under Uncertainty." Department of Agricultural and Resource Economics, University of Califor- nia, Berkeley. July.
. 1994. "Contingent Valuation and Eco- nomics." Journal of Economic Perspectives 8 (4): 19-44.
Hanemann, W. M., J. B. Loomis, and B. J. Kan- ninen. 1991. "Statistical Efficiency of Double-Bounded Dichotomous Choice Con- tingent Valuation." American Journal of Agri- cultural Economics 72 (4):1255-63.
Jordan, Donald L. 1993. "Newspaper Effects on Policy Preferences." Public Opinion Quarterly 57:191-204.
Kanninen, B. J. 1995. "Bias in Discrete Response Contingent Valuation." Journal of Environ- mental Economics and Management 28 (1):114-25.
Kopp, R. J., and K. A. Pease. 1997. "Contingent Valuation: Economics, Law and Politics." In Determining the Value of Non-Marketed Goods: Economic, Psychological, and Policy Relevant Aspects of Contingent Valuation Methods, eds. R. J. Kopp, W. Pommerehne, and N. Schwarz. Boston: Kluwer-Nijhoff (forthcoming).
Krutilla, J. V. 1967. "Conversation Recon-sidered." American Economic Review 57 (4):777-86.
Ladd, Everett Carl, and Karlyn H. Bowman. 1995. Attitudes Toward the Environment: Twenty-five Years After Earth Day. Washington, DC: The American Enterprise Press.
Larson, Douglas. 1993. "On Measuring Existence Value." Land Economics 69 (Nov.):377-89.
Loomis, J. B. 1989. "Test-Retest Reliability of the Contingent Valuation Method: A Com- parison of General Population and Visitor Responses." American Journal of Agricultural Economics 71 (1):76-84.
. 1990. "Comparative Reliability of the Dichotomous Choice and Open-Ended Con- tingent Valuation Techniques." Journal of En- vironmental Economics and Management 18 (1):78-85.
McConnell, K. E. 1983. "Existence and Bequest Value." In Managing Air Quality and Scenic Resources at the National Parks and Wilderness Areas, eds. R. D. Rowe and L. G. Chestnut. Boulder, CO: Westview Press.
163 73(2) Carson et al.: Contingent Valuation
. 1990. "Models for Referendum Data: The Structure of Discrete Choice Models for Contingent Valuation." Journal of Environ- mental Economics and Management 78 (1):19-34.
Mitchell, Robert C., and Richard T. Carson. 1989. Using Surveys to Value Public Goods: The Con- tingent Valuation Method. Washington, DC: Resources for the Future.
Plourde, C. 1975. "Conservation of Extinguish- able Species." Natural Resources Journal 15 (4):791-97.
Randall, Alan. 1991. "Nonuse Benefits." In Mea-suring the Demand for Environmental Com-
modities, eds. J . B. Braden and C. D. Kolstad. Amsterdam: North Holland.
Smith, V. Kerry. 1987. "Nonuse Values in Bene- fit Cost Analysis." Southern Economic Journal 54 (July):19-26.
Turnbull, B. W. 1976. "The Empirical Distribu- tion Function with Arbitrarily Grouped, Cen- sored and Truncated Data." Journal of the Royal Stahtical Society B38:290-95.
U.S. Department of Commerce. 1966. Income Distribution in the United States, by Herman P . Miller, a 1960 Census Monograph. Washing- ton, DC: U.S. Government Printing Office.

You have printed the following article:
Temporal Reliability of Estimates from Contingent ValuationRichard T. Carson; W. Michael Hanemann; Raymond J. Kopp; Jon A. Krosnick; Robert C.Mitchell; Stanley Presser; Paul A. Rudd; V. Kerry Smith; Michael Conaway; Kerry MartinLand Economics, Vol. 73, No. 2. (May, 1997), pp. 151-163.Stable URL:
http://links.jstor.org/sici?sici=0023-7639%28199705%2973%3A2%3C151%3ATROEFC%3E2.0.CO%3B2-0
This article references the following linked citations. If you are trying to access articles from anoff-campus location, you may be required to first logon via your library web site to access JSTOR. Pleasevisit your library's website or contact a librarian to learn about options for remote access to JSTOR.
[Footnotes]
1 Nonuse Values in Benefit Cost AnalysisV. Kerry SmithSouthern Economic Journal, Vol. 54, No. 1. (Jul., 1987), pp. 19-26.Stable URL:
http://links.jstor.org/sici?sici=0038-4038%28198707%2954%3A1%3C19%3ANVIBCA%3E2.0.CO%3B2-L
1 On Measuring Existence ValueDouglas M. LarsonLand Economics, Vol. 69, No. 4. (Nov., 1993), pp. 377-388.Stable URL:
http://links.jstor.org/sici?sici=0023-7639%28199311%2969%3A4%3C377%3AOMEV%3E2.0.CO%3B2-Y
1 Public Goods as Characteristics of Non-Market CommoditiesN. E. Bockstael; K. E. McConnellThe Economic Journal, Vol. 103, No. 420. (Sep., 1993), pp. 1244-1257.Stable URL:
http://links.jstor.org/sici?sici=0013-0133%28199309%29103%3A420%3C1244%3APGACON%3E2.0.CO%3B2-3
2 Contingent Valuation: Is Some Number better than No Number?Peter A. Diamond; Jerry A. HausmanThe Journal of Economic Perspectives, Vol. 8, No. 4. (Autumn, 1994), pp. 45-64.Stable URL:
http://links.jstor.org/sici?sici=0895-3309%28199423%298%3A4%3C45%3ACVISNB%3E2.0.CO%3B2-O
http://www.jstor.org
LINKED CITATIONS- Page 1 of 4 -
NOTE: The reference numbering from the original has been maintained in this citation list.

2 Valuing the Environment Through Contingent ValuationW. Michael HanemannThe Journal of Economic Perspectives, Vol. 8, No. 4. (Autumn, 1994), pp. 19-43.Stable URL:
http://links.jstor.org/sici?sici=0895-3309%28199423%298%3A4%3C19%3AVTETCV%3E2.0.CO%3B2-5
9 Newspaper Effects on Policy PreferencesDonald L. JordanThe Public Opinion Quarterly, Vol. 57, No. 2. (Summer, 1993), pp. 191-204.Stable URL:
http://links.jstor.org/sici?sici=0033-362X%28199322%2957%3A2%3C191%3ANEOPP%3E2.0.CO%3B2-K
19 Testing Willingness-to-Pay Models of Discrete Choice Contingent Valuation Survey DataAnna AlberiniLand Economics, Vol. 71, No. 1. (Feb., 1995), pp. 83-95.Stable URL:
http://links.jstor.org/sici?sici=0023-7639%28199502%2971%3A1%3C83%3ATWMODC%3E2.0.CO%3B2-G
22 Count Data Models and the Problem of Zeros in Recreation Demand AnalysisTimothy C. Haab; Kenneth E. McConnellAmerican Journal of Agricultural Economics, Vol. 78, No. 1. (Feb., 1996), pp. 89-102.Stable URL:
http://links.jstor.org/sici?sici=0002-9092%28199602%2978%3A1%3C89%3ACDMATP%3E2.0.CO%3B2-D
References
Testing Willingness-to-Pay Models of Discrete Choice Contingent Valuation Survey DataAnna AlberiniLand Economics, Vol. 71, No. 1. (Feb., 1995), pp. 83-95.Stable URL:
http://links.jstor.org/sici?sici=0023-7639%28199502%2971%3A1%3C83%3ATWMODC%3E2.0.CO%3B2-G
http://www.jstor.org
LINKED CITATIONS- Page 2 of 4 -
NOTE: The reference numbering from the original has been maintained in this citation list.

Public Goods as Characteristics of Non-Market CommoditiesN. E. Bockstael; K. E. McConnellThe Economic Journal, Vol. 103, No. 420. (Sep., 1993), pp. 1244-1257.Stable URL:
http://links.jstor.org/sici?sici=0013-0133%28199309%29103%3A420%3C1244%3APGACON%3E2.0.CO%3B2-3
Contingent Valuation: Is Some Number better than No Number?Peter A. Diamond; Jerry A. HausmanThe Journal of Economic Perspectives, Vol. 8, No. 4. (Autumn, 1994), pp. 45-64.Stable URL:
http://links.jstor.org/sici?sici=0895-3309%28199423%298%3A4%3C45%3ACVISNB%3E2.0.CO%3B2-O
Count Data Models and the Problem of Zeros in Recreation Demand AnalysisTimothy C. Haab; Kenneth E. McConnellAmerican Journal of Agricultural Economics, Vol. 78, No. 1. (Feb., 1996), pp. 89-102.Stable URL:
http://links.jstor.org/sici?sici=0002-9092%28199602%2978%3A1%3C89%3ACDMATP%3E2.0.CO%3B2-D
Valuing the Environment Through Contingent ValuationW. Michael HanemannThe Journal of Economic Perspectives, Vol. 8, No. 4. (Autumn, 1994), pp. 19-43.Stable URL:
http://links.jstor.org/sici?sici=0895-3309%28199423%298%3A4%3C19%3AVTETCV%3E2.0.CO%3B2-5
Statistical Efficiency of Double-Bounded Dichotomous Choice Contingent ValuationMichael Hanemann; John Loomis; Barbara KanninenAmerican Journal of Agricultural Economics, Vol. 73, No. 4. (Nov., 1991), pp. 1255-1263.Stable URL:
http://links.jstor.org/sici?sici=0002-9092%28199111%2973%3A4%3C1255%3ASEODDC%3E2.0.CO%3B2-I
Newspaper Effects on Policy PreferencesDonald L. JordanThe Public Opinion Quarterly, Vol. 57, No. 2. (Summer, 1993), pp. 191-204.Stable URL:
http://links.jstor.org/sici?sici=0033-362X%28199322%2957%3A2%3C191%3ANEOPP%3E2.0.CO%3B2-K
http://www.jstor.org
LINKED CITATIONS- Page 3 of 4 -
NOTE: The reference numbering from the original has been maintained in this citation list.

Conservation ReconsideredJohn V. KrutillaThe American Economic Review, Vol. 57, No. 4. (Sep., 1967), pp. 777-786.Stable URL:
http://links.jstor.org/sici?sici=0002-8282%28196709%2957%3A4%3C777%3ACR%3E2.0.CO%3B2-V
On Measuring Existence ValueDouglas M. LarsonLand Economics, Vol. 69, No. 4. (Nov., 1993), pp. 377-388.Stable URL:
http://links.jstor.org/sici?sici=0023-7639%28199311%2969%3A4%3C377%3AOMEV%3E2.0.CO%3B2-Y
Test-Retest Reliability of the Contingent Valuation Method: A Comparison of GeneralPopulation and Visitor ResponsesJohn B. LoomisAmerican Journal of Agricultural Economics, Vol. 71, No. 1. (Feb., 1989), pp. 76-84.Stable URL:
http://links.jstor.org/sici?sici=0002-9092%28198902%2971%3A1%3C76%3ATROTCV%3E2.0.CO%3B2-W
Nonuse Values in Benefit Cost AnalysisV. Kerry SmithSouthern Economic Journal, Vol. 54, No. 1. (Jul., 1987), pp. 19-26.Stable URL:
http://links.jstor.org/sici?sici=0038-4038%28198707%2954%3A1%3C19%3ANVIBCA%3E2.0.CO%3B2-L
http://www.jstor.org
LINKED CITATIONS- Page 4 of 4 -
NOTE: The reference numbering from the original has been maintained in this citation list.