california innovation index - university of...
TRANSCRIPT

C A L I F O R N I A
I N N O V A T I O N I N D E X2 0 0 8 I N A U G U R A L I S S U E

desig
n –
3x3
| p
alo
alto
Next 10 is an independent, nonpartisan organization that educates,engages and empowers Californians to improve the State’s future.California was founded by pioneers driven by big dreams and unafraid to face difficult challenges. Like many of us, theycame to California to create a better life for themselves and their families. While this legacy of the California dreamcontinues today, many of us are concerned that the future will not be as bright as our children deserve.
Next 10 is focused on innovation and the intersection between the economy, the environment, and quality of life issuesfor our state. We create tools and provide information that fosters a deeper understanding of the critical issues affectingall Californians. Through education and civic engagement, we hope Californians will become empowered to affect change.
We call ourselves Next 10 because we are not here for the quick fix. Our sights are set on joining with others to improvethe state over the next ten years, and the ten years after that. The decisions we make together will affect California’seconomy, environment and quality of life for years to come. Together, we can create the brighter future we all want forourselves and our children.
ADVISORS TO THE CALIFORNIA GREEN INNOVATION INDEXNext 10 thanks the following expert Advisors for their generous time and guidance on this project:
Ralph Cavanagh Natural Resources Defense Council
Michael Hanemann California Climate Change Center, Goldman School of Public Policy, U.C. Berkeley
Hal Harvey The William and Flora Hewlett Foundation
Elliot Hoffman New Voice of Business
Van Jones Ella Baker Center
Dan Kammen Class of 1935 Distinguished Professor of EnergyDirector, Renewable & Appropriate Energy Laboratory, U.C. Berkeley
Bruce Klafter Applied Materials
Joel Makower Executive Editor, GreenBiz.com
Walter McGuire McGuire & Co., Inc./ Flex Your Power
Joe Nation Former State Assemblyman, District 6Lecturer in Public Policy, Stanford University
Manuel Pastor Professor of Geography and American Studies & Ethnicity, University of Southern California
Fran Pavley Assemblymember (2000-2006), Author AB 32: California Global Warming Solutions ActSenior Climate Advisor, NRDC
Wendy Pulling Pacific Gas & Electric Company
Carol Whiteside Great Valley Center
Tim Woodward Nth Power
PREPARED BY SURVEY CONDUCTED BY PRODUCED BYCollaborative Economics Field Research Corporation Next 10Doug Henton Deborah Jay F. Noel PerryJohn Melville Mark DiCamillo Sarah HenryTracey Grose Marcia PerryGabrielle Maor Rishell JordonBridget Gibbons

Dear Californians,
California has long played an international role as an incubator of innovation. From the integrated circuit to Web 2.0,recombinant DNA to genomics, world changing ideas and inventions have had their genesis in this state. Lesser known,however, is California’s role in “green” innovation, and the significant impact green innovation can make on the state’seconomic and environmental health.
Next 10, an independent, nonpartisan, nonprofit organization, is launching the California Green Innovation Indexto track the state’s green innovation as well as economic and environmental performance within the context of thelandmark California Global Warming Solutions Act (AB 32). The Index analyzes key indicators including energyconsumption and efficiency, economic growth and carbon emissions, to better understand the role green innovationplays in achieving two goals critical to California’s future: 1) reducing the absolute level of the greenhouse gas emissions thatcause global warming, and 2) increasing the state’s gross domestic product, which is the basis for our economic vitality.
This inaugural issue contains several important findings:• As a result of the first wave of green innovation, which began in the 1970s, California has become a world leader
in energy efficiency. In relative terms, California is more energy efficient and emits fewer greenhouse gas emissionsper person than the rest of the United States, Germany, the United Kingdom or Japan.
• California’s economy has grown as a result of this first wave of green innovation. • California may be at an inflection point between the first and second waves of green innovation driven by factors
similar to those that drove the first wave: policy, demand and investment.• While California has made enormous progress, the state’s rate of population growth requires that the next wave of
innovation be larger, faster and more powerful than the last to meet the mandate of AB 32.
Working with leading experts, Next 10 produced the California Green Innovation Index in support of our missionto educate and engage Californians on issues important to the state’s future. There is no more important issue todaythan addressing global warming while growing a vibrant economy.
Sincerely,
F. Noel PerryFounder, Next 10
575 High Street, Suite 310 | Palo Alto, California 94301 | tel: 650.321.5417 | www.next10.org

California’s PopulationPopulation Average Annual Growth Population Projections
2006 2000-2006 2020
37,195,240 2% 43,695,240
Source: California Department of Finance
California’s EconomyGross Domestic Product (GDP) is a way of measuring the size of an economy, and is calculated by summing the valueadded from all industries in the economy. This measure can be used for a country as well as a state, in which case it canalso be expressed as gross state product (GSP).
Total GDP Average Annual Growth Per Capita GDP GDP Projections
2006 2000-2006 2006 2020
$ 1,727,355,000,000 2% $46,440 $ 2,604,898,000,000
Inflation adjusted dollars (2006) Inflation adjusted dollars (2006)Sources: Bureau of Economic Analysis;California Department of Finance Source: Moody's Economy.com
Assembly Bill 32, the “California Global Warming Solutions Act of 2006”Assembly Bill 32 (AB 32) was signed into California law in 2006, mandating the first ever statewide cap on global warmingpollution. AB 32 has put California at the forefront of the fight against global warming by requiring the state to reduceits greenhouse gas (GHG) emissions to 1990 levels by 2020.
California’s Greenhouse Gas EmissionsGreenhouse gases include carbon dioxide, methane, nitrous oxide and various high global warming potential (GWP) gasesincluding perfluorocarbons, hydrofluorocarbons and sulfur hexafluoride (SF6).
AB 32 TargetsTotal GHG Emissions Average Annual Growth Per Capita GHG Emissions Total GHG Emissions (Million Metric Tons of CO2 Equivalent) (Metric Tons of CO2 Equivalent) (Million Metric Tons of CO2 Equivalent)
1990 2004 2000-2004 2004 2020411 479 1% 12.9 411
Sources: California Energy Commission, revision February 2, 2007 to "Inventory of California Greenhouse Gas Emissions and Sinks" Report (December 2006); California Department of Finance
California’s Carbon EconomyThe ratio of GHG emissions to GDP
Meeting AB 32 Targets1990 2004 20200.45 0.35 0.18Sources: California Energy Commission; Bureau of Economic Analysis
California Facts

Table of Contents CORE FINDINGS 4
1 INNOVATION IS THE DRIVER OF CALIFORNIA'S ECONOMIC AND ENVIRONMENTAL PROGRESS 81. California has relied on its innovative economy to provide growing economic, social,
and environmental benefits to its people 8
2. California has a history of policy innovation, which has helped stimulate technological innovation, producing economic and environmental benefits 10
3. California will need to build on its tradition of innovation if it is to reduce its absolute amount of carbon emissions and produce economic benefits in the years ahead 12
California's Story of Recycling 14
2 THE FIRST WAVE OF GREEN INNOVATION 161. California has one of the lowest per capita greenhouse gas emissions and highest
gross domestic products in the nation 16
2. California's economic growth has become less dependent on greenhouse gas emissions over time 17
3. California demonstrates that energy efficiency can translate into economic gain 20
4. Californians have experienced substantial and growing energy savings as a direct result of efficiency programs 22
3 TRACKING SIGNS OF THE NEXT WAVE OF GREEN INNOVATION 24ENVIRONMENT FOR CHANGE 251. Californians recognize the urgency of the problem-and believe a lot can be done about it 25
2. Californians believe that reducing emissions and growing the economy is both possible and desirable-and believe that new technologies will help solve the problem 25
ADOPTION OF GREEN PRODUCTS AND PRACTICES 261. Californians are accelerating their adoption of green products and practices to reduce electricity consumption 27
2. The commercial business sector-the largest consumer of electricity in California-has become more energy efficient in recent years 30
3. Gasoline sales and vehicle miles traveled have leveled off 31
4. Water consumption and pumping-responsible for about 20% of California's gross electricity use-are using less electricity than in the past 34
5. Californians are increasing their use of cleaner energy to reduce greenhouse gas emissions both at home and on the road 35
INNOVATION LIFECYCLE: CREATION OF NEW PRODUCTS AND PRACTICES 401. California is drawing increasing R&D investment for clean energy from a variety of public
and private sources 41
2. California is a leader in green technology innovation as measured by patents 42
3. California is top state for U.S. venture capital investment in green technology 43
4. California is home to a growing green industry, which is creating thousands of new companies, jobs, and products to help reduce emissions 46
4 THE CHALLENGE & PROSPECTS FOR THE FUTURE 51

CORE FINDINGSThe inaugural California Green Innovation Index
produced by Next 10 provides a comprehensive
look at the role of innovation in reducing greenhouse
gas emissions while growing the economy. The
Index measures progress toward green innovation—
green in the sense that it generates both
environmenta l and economic benef i t s .
California has been driven by waves of innovation
in information technology, biotechnology and now
energy. Building on a first wave of innovation based
on energy efficiency, the Index identifies a next wave
of innovation that could bring new breakthroughs
in both energy efficiency and clean energy.
4

Emissions and Gross Domestic ProductCarbon emissions per million people - Inflation adjusted GDP dollars per million people; Relative Trends since 1990
Inde
xed
to 1
990
1990 2004
90
95
100
105
110
115
120
125
Source: Energy Information Administration; Population Division, U.S. Census Bureau; Bureau of Economic Analysis; U.S. Department of Commerce
CA per capita emissions
CA per capita GDP
The growing separation illustrates thedeclining dependence of California's economicgrowth on environmental degradation
the first wave
THE FIRST WAVE OF GREEN INNOVATION
California has benefited both economically and environmentally from a first wave of green innovationas a result of increasing energy efficiency since the 1970s.
1. California has become a world leader in addressing global warming. In relative terms, California is more energyefficient and has lower greenhouse gas emissions than the United States as a whole and leads Germany, the United Kingdomand Japan (Chart 2).
2. California has one of the lowest per capita greenhouse gas emissions and highest gross domestic products inthe nation. California’s per capita emissions are less than one-half of the rest of the nation and are lower than they were15 years ago (Chart 1). Among states, California has the second lowest emissions per capita while generating the tenthhighest gross domestic product per capita in the nation.
3. California is more energy efficient than the nation and other comparable states resulting in significant savingsto consumers. Since 1970, California has greatly reduced its total energy consumption per capita (Chart 6). Averagemonthly residential bills for electricity are lower in California than Texas, Florida, and the nation (Chart 8). Moreover,California’s total annual electricity bill as a fraction of GDP is lower than Texas, Florida and the nation (Chart 7). Whatdoes this mean? If California’s annual statewide electricity bill was the same fraction of GDP as Texas, for example,Californians would be paying almost $25 billion more for electricity. Instead, these billions are available for investmentin other areas, generating economic benefits for California.
4. California utility programs and efficiency standards yield billions of dollars in savings and have reduced the needto build additional power plants. California utility efficiency programs and Title 20 and Title 24 (appliance and buildingstandards) have yielded tens of billions of dollars in savings and reduced the need for 24 power plants between 1975 and2003 (Chart 10). The net benefits of these programs continue to improve (Chart 11). The California Energy Commissionestimates that building and appliance standards alone have saved residents and businesses $56 billion through 2003 andare projected to save another $23 billion by 2013.
5

TRACKING SIGNS OF THE NEXT WAVE OF GREEN INNOVATION
Signs that California may be beginning the next wave of green innovation include continued progress inincreasing energy efficiency and the adoption and creation of clean energy.
5. Californians are at the forefront in recognizing that global warming is an urgent challenge that can be addressedby citizens and business as well as government. They also believe that California can reduce greenhouse gases andexpand jobs and prosperity at the same time, and that new technologies can help solve the challenge (Survey Results,pages 22 and 23).
6. Adoption of existing green products and practices is accelerating in California. Californians are adopting andplanning to adopt specific electricity-saving products and practices in homes and businesses (Page 28 and Charts 14, 15,16, 17 on CLF bulbs, appliances and buildings). Californians are also installing solar systems (Chart 28) and purchasinghybrid vehicles (Charts 30-35) at an increasing rate.
7. Creation of new green products and services is increasing in California. California is escalating its share of U.S.patents in solar energy, wind and battery technology (Chart 36). Venture capital investment in California clean energytechnology is growing rapidly (Charts 37, 38, 39). Green establishments and jobs are also increasing, especially in energygeneration and energy efficiency (Charts 41-43).
Milli
ons
of d
olla
rs in
vest
ed in
Cal
iforn
ia c
ompa
nies
1996 2006
900
Source: Nth Power
700
$1,000
0
800
600
Venture Capital Investment in Energy TechnologyInvestment in California companies
500
400
300
200
100
the next wave
6

THE CHALLENGE AND PROSPECTS FOR THE FUTURE
Much more green innovation will be needed if California is to meet the goal of AB 32 (California’s GlobalWarming Solutions Act of 2006 calls for reducing greenhouse gas emissions to the 1990 level by 2020) whilealso growing the economy.
8. California will need to rapidly increase its pace of change with breakthroughs in energy efficiency and the adoptionof clean energy alternatives. This requires significantly accelerating the adoption of clean energy by reducing coststhrough technological innovation (See solar energy cost curve, page 54). It means substantially reducing transportation-generated emissions, which currently make up 41% of total greenhouse gas emissions. Methods to reduce transportation-generated emissions include reducing vehicle miles traveled (Charts 21 & 22) and adopting clean transportation alternatives(Charts 23, 24, 30, 31).
9. California will need to continue to invest in research and commercialization that promotes the creation and adoptionof clean energy. Although federal investment is lagging, California is drawing increasing R&D investment for cleantechnology from a variety of public and private sources. The State has been investing its own resources in clean energythrough various avenues including the PIER program (page 41). The United States government, however, could do muchmore to support green innovation. While California’s share of U.S. patents in clean energy has been increasing, the UnitedStates may no longer be a leader in early stage development of green innovation: since 1998, foreign inventors haveregistered for more green technology patents than U.S. inventors (Chart 35).
10. California is taking steps to achieve the goals of AB 32 and the public supports taking action to address globalwarming. The California Climate Action Team has begun to identify strategies to meet the AB 32 goals (See ClimateAction Team Strategies, page 46), and an increasing number of California businesses are members of the California ClimateAction Registry (Chart 52). The public is very supportive of action to address global warming (Survey Results 55-57).
Milli
on M
etric
Ton
s of
CO
2 E
quiv
alen
t
Source: California Energy Commission
500
0
600
400
History of California Emissions and Future AB 32 Target
300
200
100
20202004
WithoutInnovation
1990
AB32 Emissions Limit
WithInnovation
the future
7

Num
ber
of tr
ansi
stor
s on
an
inte
grat
ed c
ircui
t
NUMBER OF TRANSITORS DOUBLING EVERY 24 MONTHS
Moore’s Law describes an important trend inthe history of information technology: thenumber of transistors that can be placed on anintegrated circuit increases exponentially,doubling approximately every two years.
This observation about continuing innovationin information technology was first made byIntel co-founder Gordon E. Moore in 1965.Moore’s Law has been a driving force oftechnological and social change throughoutthe late 20th century and early 21st century—not only in information technology, but alsoin biotechnology, nanotechnology and energytechnology.
Intel, Excerpts from a conversation with GordonMoore: Moore's Law, Video Transcript, 2005.
1971 1980 1980 2000 2004
10,000,000,000
2,300
10,000
1,000,000,000
100,000,000
10,000,000
1,000,000
500,000
Growth of transitor counts for Intel Processors (dots) and Moore's Law
innovation1
California has helped ignite innovation in areasas diverse as information technology (e.g.,integrated circuits), biotechnology (e.g.,recombinant DNA), agriculture (e.g., waterflow technology), entertainment (e.g., digitalmedia), and communications (e.g., wirelessinternet). Innovation improves efficiency inour economy and creates new sources of value.1
Gordon Moore, the co-founder of IntelCorporation, famously described the exponentialpower of innovation to drive efficiency in theinformation technology industry (see box).
Innovation happens incrementally, but alsocomes in bursts, producing breakthroughs thatrapidly increase efficiencies and value. As theillustration shows, California helped drive wavesof innovation in information technology—from defense to the integrated circuit to thepersonal computer to the internet and now to
Web 2.0. A similar series of waves is evidentwith biotechnology, from recombinant DNAto genomics and now to personalized medicine(i.e., translational genomics). Energy is nodifferent: California has helped drive a first waveof green innovation in energy efficiency thatbegan in the 1970s and continues to this day.
Today, a new wave of innovation that buildson the first wave of improvement in energyefficiency may be underway—one that isbeginning to focus growing dollars and talenton clean energy. This next wave may beemerging even as the first wave of greeninnovation continues delivering benefits toCalifornia. What could this next wave looklike? It could bring new breakthroughs in bothenergy efficiency and clean energy, reducingthe absolute amount of greenhouse gas emissionswhile g rowing the State’s economy.
INNOVATION IS THE DRIVER OF CALIFORNIA’S ECONOMIC AND ENVIRONMENTAL PROGRESS
California hasrelied on itsinnovativeeconomy toprovide growingeconomic,social, andenvironmentalbenefits toits people
MOORE’S LAW
8

1950 2000
PER
FOR
MAN
CE
1960 1970 1980 1990
DEFENSE
INTEGRATEDCIRCUIT
PERSONALCOMPUTER
INTERNET
WEB 2.0
RECOMBINANTDNA
GENOMICS
PERSONALIZEDMEDICINE
ENERGY EFFICIENCY
ENERGY EFFICIENCY &CLEAN ENERGY
TIME
“One of the most important lessons from California’s history of leadership in energy efficiencyis that innovation—technological, economic, and political—can take place at levels far beyondwhat is initially forecast if a strong commitment is made to advancing the sector.”2
Daniel Kammen, Founding Director, Renewable and Appropr iate Energy Laboratory,University of California, Berkeley
“Properly designed environmental standards can trigger innovations that lower the total cost ofa product or improve its value. Such innovations allow companies to use a range of inputs moreproductively—from raw materials to energy to labor—thus offsetting the costs of improvingenvironmental impact and ending the stalemate. Ultimately, this enhanced resource productivitymakes companies more competitive, not less.” 3
Michael Porter, Harvard Business School
“Rather than requiring subsidies, energy-productivity opportunities provide a positive rate ofreturn, freeing up resources that could be consumed elsewhere or invested for faster growth.”4
Diane Farrell, McKinsey Global Institute
OBSERVATIONS ABOUT INNOVATION, EFFICIENCY & THE ENVIRONMENT
WAVES OF INNOVATION
First Wave• Breakthroughs primarily in energy efficiency; growth in renewable energy
• Increasing energy efficiency and reducing emissions per capita while growing the economy
• Most progress in electricity efficiency in homes and workplaces; little progress in transportation
• California is the leader in adoption of innovative green practices
Next Wave• New breakthroughs in both energy efficiency and clean energyalternatives, an alignment of markets, policies, and technology
• Reducing absolute amount of emissions to 1990 levels whilegrowing the economy
• Major improvements in all areas, including transportation viabroad-based adoption of alternative fuel technologies and vehicles
• California is the leader in both creation and adoption of green innovations, serving statewide and global markets
9

5
First in United States
For decades California has been a nationalleader in innovative environmental policy.States have long been seen as the laboratoriesfor new policies, and in the realm ofenvironmental policy, California’s innovativeapproaches are replicated in other states and usedas a model for federal legislation as well as forother countries. According to the CongressionalResearch Service, “California has served as alaboratory for the demonstration of cutting-edge emission control technologies, which,after successfully demonstrated there, wereadopted in similar form at the national level.”5
Since the 1970s the State has boldly set standards,designed incentives, enforced disincentives, andreadjusted major drivers of market dynamicstoward improving energy efficiency andprotecting natural resources and public health.These policy innovations have been the productof combined efforts by public leaders, businessleaders, grassroots organizations, and the State’scutting-edge technology innovation community.
The OPEC oil embargo in 1973 served as amajor force in spurring policy and technologyinnovation relating to energy efficiency. Thenext year, the State established the CaliforniaEnergy Commission to implement energypolicy and planning, and Lawrence Berkeley
National Laboratory established the Center forBuilding Science to research means forimproving energy efficiency. In an earlycontribution to the cause, the Center developeda computer program that modeled the energyperformance of buildings. This programestablished the basis for the path-breakinglegislation on energy efficiency standards forappliances and buildings (Title 20 and Title24). Enactment in California was followed bythe enactment of similar standards across theUnited States and other countries. By 1987,a uniform national standard for efficiency inappliances was in place.
A pioneering effort led by a bold group ofefficiency advocates, utilities, and enlightenedleaders led to the realignment of investor-owned utilities’ financial incentives fromexpanding consumption to investing inefficiency. This was made possible through theimplementation of a decoupling mechanism ofelectricity and natural gas providers in 1982.This policy innovation removes the financialdisincentive for utilities to encourage energyefficiency and conservation by making theirprofits independent of their sales.6 FollowingCalifornia’s lead, other states and countries arepursuing similar mechanisms to unlink economicincentives from environmental degradation.
California hasa history ofpolicy innovation,which has helpedstimulatetechnologicalinnovation,producingeconomic andenvironmentalbenefits
innovation1
California Policy Innovations Over Time (Regulatory, Investment, Incetives)Set in Context with U.S. Policy Innovations and Other Historical Events
1977Clean Water Act
1986Emergency Planning andCommunity Right-to-KnowAct (EPCRKA)
1987National Appliance EnergyConservationAct (NAECA)
1980Comprehensive EnvironmentalResponse, Compensation, andLiability Act (CERCLA) createdthe Superfund program
1974Lawrence Berkeley Laboratory’s Centerfor Building Science Established
1976Statistical model illustratingenergy-savings potential throughbuilding efficiency is releasedto public
1978Efficiency Standardsfor new buildings(Title 24)
1982California PUCorders removalof financial barriersto utilities andenergy efficiencyinvestments
1977Efficiency Standardsfor appliances(Title 20)
1947Los Angeles Air PollutionControl District created;first air pollution agencyin the US.
1959California Motor VehiclePollution Control Boardcreated to test automobileemissions and set standards.
1955National Air PollutionControl Act
8/1973 - 9/1974OPEC Oil Embargo
1963Clean Air Act
1965National EmissionsStandards Act
1967Air Quality Act
1967California Air ResourcesBoard established
1980 - 1983Efficiency Standardsfor appliances - Florida,Kansas and New York
1986Efficiency Standardsfor appliances- Massachusetts
1974CA Energy Commissionis created
10

The energy crisis in 2000 and 2001 providedanother major force in spurring policy andtechnology innovation relating to energyefficiency. A result of the failed attempt atutility market deregulation, rolling black-outscharacterized the two-year period. As in 1973,this crisis provided a fresh impetus for policyand technology innovation targeting improvedenergy efficiency in California. Ensuing policyinnovations include broad-based energyefficiency campaigns, incentives for renewableenergy sources, investment in technologyresearch, and standards that reduce greenhousegas emissions. Recent novel approaches includethe following:
• Flex Your Power, the statewide energy conservationcampaign, was launched in 2001, funded primarilyby a Public Goods Charge of one percent added toinvestor-owned utility bills. This outreach effort aimsto inform residents, businesses, industry and public entitiesof methods for reducing energy use and of financialincentives that encourage adoption of such methods.
• California’s Renewable Portfolio StandardProgram was established with the goal of increasingthe percentage of renewable energy in the State'selectricity mix of investor-owned utilities (IOUs) to20% by 2017. This goal has since been acceleratedto be achieved by 2010.
• California’s Clean Cars Law of 2002 (AB 1493)requires carmakers to reduce global warming emissionsfrom new passenger cars and light trucks beginningin 2009. First in the world to reduce global warmingpollution from cars, this law has now been adoptedby 11 other states. Affecting nearly one-third of theU.S. market, global warming emissions in 2020 willbe reduced by more than 64 million tons of carbondioxide a year.
• The California Global Warming SolutionsAct of 2006 (AB 32) is the first law tocomprehensively limit greenhouse gas (GHG)emissions at the state level. Five Western states(Washington, Oregon, Utah, Arizona, New Mexico)have joined California to combine efforts towardreducing greenhouse gas emissions with the WesternRegional Climate Action Initiative.
California has the creative capacity through itsample assets of innovative technology, policy,and public outreach to make meaningful progresstoward reducing greenhouse gas emissions. Ashistory shows, the investment and risk-takingin innovation pays off beyond the State’s borders.
1990Clean Air Act Amendments of 1990 set newautomobile emissions standards, low-sulfur gas,required Best Available Control Technology (BACT)for toxins, reduction in CFCs.
5/2000- 9/2001California Energy Crisis
1989California Integrated WasteManagement Act (AB939)
1997California Energy Commission'sPublic Interest Energy Research(PIER) Program Established
1989Montreal Protocolon ozone-depletingchemicals implemented
1996Electric IndustryDeregulation Law
2003Governor's West CoastGlobal Warming Initiative(CA, OR, WA)
2006Film release:Who killed the electric car?An Inconvenient Truth
2007Commonwealthof Massachusetts v.EnvironmentalProtection Agency
2/2007Utah, Manitoba &British Columbiajoin Governor'sWest Coast GlobalWarming Initiative
2005Governor's ExecutiveOrder S-3-05 setgreenhouse gasemission reductiontargets
2007Western RegionalClimate Action Initiative
9/2007California PUCapproves incentivesfor investor-owned
energy savings goals
2004Governor’s GreenBuilding InitiativeExecutive Order(S-20-04)
9/2000CA Climate Action Registryestablished (SB1771)
9/2000Legislature approves 10-year,$7 billion utility sectorinvestments in energy
2006California Global WarmingSolutions Act of 2006 (AB 32)
2006California Greenhouse GasPerformance Standards forPower Plants (SB 1368)
8/2006California Solar Initiative
2001Flex Your Powerinitiated
2004Adopted by Idaho
2002California ClimateAction Registry ismandated (SB 812)
CA Renewable PortfolioStandard (RPS)
California AB 1493sets standards foremissions of CO2 andother greenhouse gasesfrom automobiles andlight duty trucks.
2001Adopted by Oregon
2007Adopted by Maryland
efficiency, renewables,technology R&D
utilities in meeting
11

If the past is a guide, California’s tradition ofinnovation could flow in both familiar andunpredictable ways—from breakthroughs inenergy efficiency to adoption of clean energyalternatives. It will need to be “greeninnovation”—green in the sense that it generatesboth environmental and economic benefits.
Green innovation is a shared responsibility. Itis the product of government, private sector,and individual actions. There are actions thatall these parties can take that can lead to positiveresults, but it is the result of the process ofinteractions among these parties that creates afar greater impact on reducing greenhouse gasemissions and generating economic benefits.As this process of action and reaction progresses,patterns of adoption (e.g. purchase of upgradedappliance) and creation (e.g. commercializationof new technology) continue and build uponeach other thereby increasing the speed ofinnovation and increasing the impact onreducing emissions and stimulating the economy.
The diagram below illustrates the three parties:People, Public Sector and Private Sector. Thecurved arrows represent the interaction betweeneach party, and this is where innovation takesplace. This interaction generates the exchangeof ideas, adoption of new behaviors and thecreation of new products and finally results ina larger impact on reducing emissions by eachof the parties.
Green innovation is a two-way street.Government plays a critical role in setting thepolicy environment, and the private sector andindividuals respond to mandates and incentives.However, the private sector and individuals canprovide catalysts for green innovation as well.
Government adopts policy innovations, whichcreates an environment that encourages bothprivate sector and individual innovation. At thesame time, government policy is influenced bythe emergence of new technologies, products,and business practices in the marketplace,which demonstrate what could be possible ona larger scale. Elected officials also pursuepolicy innovations in response to growingconcerns from the public—interests shaped bythe media, consumer experience, and personalvalues, as much as by government informationand incentives.
Private sector businesses respond togovernment mandates and incentives, but alsoto global market forces (like the price of oil).Businesses pursue innovations to meetemerging industry and consumer demand fornew green products and practices. Theseinnovations not only help the bottom line ofCalifornia businesses, but also create jobs, helpinform policy, and change individual behaviorby offering tangible applications of greeninnovation.
The private sector also includes a diverse mixof non-profit groups that promote changes ingovernment policy, business practices, andindividual behaviors. This “independent sector”of organizations is an important catalyst forgreen innovation.
Individuals not only respond to governmentincentives and availability of new products, butalso influence the direction of policy throughthe political process and generate demand fornew green products in the marketplace.
California will needto build on itstradition ofinnovation if it is toreduce its absoluteamount of carbonemissions toaddress globalwarming andproduce economicbenefits in theyears ahead
innovation1
12

INN
OV
AT
ION
I N
NO
VA
TIO
N
I N N O V A T I O N
STANDARDS
POLICYI N C E N T I V E S
GreenhouseGas Emissions
PERFORMANCEEconomy:
Jobs, Income
DYNAMICS OF GREEN INNOVATION
INVESTMENT
PRIVATESECTOR
B U S I N E S S
AT T I T U D E S
PEOPLEB E H AV I O R S
13

A government mandate with significant coordination with businesses and consumersSpecial Analysis prepared by Howard Chong, U.C. Berkeley
In the span of 20 years, California transformedrecycling from an industry of waste to one ofefficacy. California’s story of recycling—usinginnovation to turn waste into prosperity—mirrors the current challenges presented bygreenhouse gas emissions levels and meetingthe goals of AB 32.
In 1989, the waste diversion rate in Californiawas stuck at 10%, and California was runningout of places to put its trash. Recyclingrequirements were born out of the perceptionof a landfill crisis. Within 20 years, Californiadeveloped a new recycling infrastructure andmoved from a 10% diversion rate to a 50%diversion rate. This was not just a matter ofmandating reduction; success required significantcoordination with business consumers to create
“Buy Recycled” markets to integrate recycledmaterials into manufacturing processes andconsumer choices. Furthermore, there was aconcurrent effort to address regulation of landfillsand the pollution that they create despite theconventional wisdom that “more garbage equalseconomic prosperity.”
Recycling has similarities to, and offers potentiallessons on dealing with, the current issue ofclimate change. Energy use has historicallybeen linked to economic prosperity but is nowidentified as having environmental consequencesthat require public action. By combining policywith private industry and individual action,California has the opportunity to reduce theimpact of global warming, while simultaneouslystrengthening the economy.
MORE
CALIFORNIANS
RECYCLE
THAN VOTE
1989 2005
60%
Source: California Integrated Waste Management Board
0%
50%
California Statewide Diversion Rates
40%
30%
20%
10%
1990 1991 1992 1993 1994 1995 1996 1997 1998 1999 2000 2001 2002 2003 2004
C A L I F O R N I A ’ S S T O R Y
14

Similiarities and Potential Lessons between Recycling and Climate Change
O F R E C Y C L I N G
Recycling
More waste = more “stuff” = prosperity
Pollution from landfills,running out of landfill space
Generate less waste
AB 939 in 1989:Target of 50% diversion by 2000
Significant improvements in characterizingthe waste stream, including mandatoryreporting requirements
Did not sacrifice economic development;evidence shows that recycling hada positive impact on job creation andeconomic growth
Increased disposal costs;voluntary participation in sortingrecyclables from garbage
Extremely positive attitude to recycling,evidenced by high public participation
Climate Change
More energy use = prosperity
Global warming,energy shortages
Consume less energy
AB 32 in 2006: Target of reductionto 1990 levels by 2020(29.5% reduction from business as usual)
Significant improvements in characterizingGHG emissions, including mandatoryreporting requirements
Official State and private forecasts predicta net positive impact on job creation andeconomic growth, though some industriesmay suffer while others gain
Predicted increased energy costs,possibly mitigated or offset by a shifttoward less energy-intensive consumption;voluntary action otherwise
Concern about global warming and willingnessto make adjustments to decrease GHGemissions
Criteria
Conventional Wisdom
Impending Crisis
CorrectiveAction Needed
Government Action
Early Innovations
Effect onEconomicGrowth
Impact on Individuals
Public Attitude
15

1990 1992 1994 1996 1998 2000 2002 20040
5
10
15
20
25
30
35
40
1: GHG Emissions in California and Other StatesCO2 emissions from fossil fuel combustion – metric tons CO2 (MTCO2) per Capita
Met
ric T
ons
CO
2 pe
r C
apita
California
Florida
US w/o CA
Texas
Source: Energy Information Administration; Population Division, U.S. Census Bureau; Bureau of Economic Analysis; U.S. Department of Commerce
2004 National RankingLowest GHG Highest GDP GDP in Billions Share of Total
Emissions Per Capita Per Capita ($2004) U.S. GDP
California 2 10 $ 1,540 13%Texas 40 18 886 8%Florida 11 37 601 5%
34.5
21.4
14.5
12.2
30.6
21.5
14.7
11.0
Source: Energy Information Administration; Population Division, U.S. Census Bureau; Bureau of Economic Analysis; U.S. Department of Commerce
the first wave2
California has been at the forefront of the firstwave of green innovation that began in the1970s and continues to this day. This first waveproved that California could increase its energyefficiency and reduce its greenhouse gas emissionsper capita, while also growing its economy.
The first wave of green innovation was drivenby a confluence of many forces—includingrising oil prices, supportive state policies (asoutlined earlier), shifting attitudes and behaviorsabout energy and water conservation; andtechnological innovation in green building,materials, appliances, lighting, and other areas.It produced breakthroughs in energy efficiencyand stimulated growth in renewable energy inCalifornia. While it is difficult to discern howmuch each of the many different factorscontributed to this first wave, it is clear thatCalifornia today has one of the lowest per capitagreenhouse gas emissions and highest per capitagross domestic products in the nation.
On a per capita basis, the State’s economy hasbecome less dependent on emissions and hasused less energy to produce more economicgrowth over time. California’s situation moreclosely resembles that of Germany, the UnitedKingdom, and Japan than the rest of the UnitedStates—especially other large states with diverseeconomies like Texas and Florida.
California has one of the lowest per capitagreenhouse gas emissions and highestgross domestic products in the nation
California has some of the lowest per capitaGHG emissions in the U.S. In fact, per capitaCO2 emissions in Texas are double those ofCalifornia. Per capita emissions levels inCalifornia today are slightly lower than theywere 15 years ago, dropping from 12.2 to 11MMTCO2E7 (Chart 1).
THE FIRST WAVE OF GREEN INNOVATION
16

GOAL
25.0
20.0
15.0
10.0
5.0
00 0.5 1.0 1.5 2.0 2.5 3.0 3.5
25.0
0
20.0
15.0
10.0
5.0
GOAL0 1.00.5
California’seconomic growthhas becomeless dependenton greenhousegas emissionsover time
2: Global Fossil Fuel Combustion*
California
France
Japan
U.K.
Germany
U.S. w/o CA
United States
India
China
California
France
Japan U.K. Germany
U.S. w/o CA
United States
EFF
ICIE
NC
YE
mis
sion
s pe
r C
apita
(Met
ric T
ons
CO
2 E
quiv
alen
t per
Per
son)
INTENSITYEmissions per GDP Dollar
(Metric Tons CO2 Equivalent per Thousand, inflation adjusted U.S. Dollars GDP
*The combustion of fossil fuels accountsfor roughly 72% of total GHG emissions.
Sources: Energy Information Administration,International Energy Annual 2004;California Energy Commission;Bureau of Economic Analysis,U.S. Department of Commerce
Compared to other countries, California isamong the most advanced and efficienteconomies, which sets it apart from the rest ofthe U.S. Mainly due to structural changes inthe economy, the global economy is becomingless carbon intensive in terms of emissions pergross domestic product (GDP). Greaterdisparities exist in terms of efficiency, oremissions per capita. Resulting primarily fromelectricity generation and transportation, fossilfuel combustion (petroleum, natural gas & coal)makes up the largest category of carbon emissionsin the world. As economies such as China andIndia continue their rapid growth, absolute
emissions and emissions per capita will climb.In view of both emissions per dollar of GDPand emissions per capita, California is comparablewith Japan. Per capita emissions in the rest ofthe U.S. are twice California’s (Chart 2).
California is an example of how an innovativeeconomy can thr ive and grow whilesimultaneously reducing the environmentaldamage associated with growth. Breaking thelink between “environmental bads” and“economic goods” occurs when the growth rateof an environmental pressure is less than that ofeconomic expansion over a period of time.8
17

3: Emissions and Gross Domestic ProductCarbon emissions per million people - Inflation adjusted GDP dollars per million peopleRelative trends since 1990
Inde
xed
to 1
990
California’s GDP is a measurement of the State’seconomic output. Examining the growth inGDP alongside the growth in carbon emissionsillustrates the changing relationship betweenthe two over time. (Carbon emissions accountfor roughly 72% of all greenhouse gas emissions.)Chart 3 depicts the growth rates per capita ofGDP and emissions for California relative to
1990. The growing distance between the trendlines of GDP rising and emissions droppingrepresent the delinking of GHG emissions fromeconomic growth. (Per capita emissions representedhere are based on the California Energy Commission’sGHG Inventory and vary slightly from the federalGHG data represented in Chart 1.)
1990 1991 1992 1993 1994 1995 1996 1997 1998 1999 2000 2001 2002 20 03 2004
90
95
100
105
110
115
120
125
Source: Energy Information Administration; Population Division, U.S. Census Bureau; Bureau of Economic Analysis; U.S. Department of Commerce
CA per capita emissions
CA per capita GDP
The growing separation illustratesthe dec lining dependence ofCalifornia's economic growth onenvi ronmenta l degradat ion
the first wave2
18

1990 1992 1994 1996 1998 2000 2002 2004100
150
200
250
300
350
400
450
500
5: Total GHG Emissions in CaliforniaAnnual Emissions
Milli
on M
etric
Ton
s C
O2
Equ
ival
ent
1990 1992 1994 1996 1998 2000 2002 2004 Carbon Free Economy = 0
.02
.04
.06
.08
.10
4: The Carbon EconomyEmissions relative to GDP: California
Em
issi
ons/
GD
P
Illustrated as a ratio of emissions to GDP,Chart 4 depicts California’s carbon economyand its gradually decreasing carbon character.While improvements are evident, in order tomeet the requirements of AB 32, this decreasewill need to be steeper in the future. Asrepresented in Chart 5, the State’s absoluteemissions continue to rise.
*Gross GHG emissions including electricity importsSource: California Energy Commission; Bureau of Economic Analysis; U.S. Department of Commerce
Source: California Energy Commission
Note: Total Baseline greenhouse gas emissionsincludes fossil fuel CO2, with electric imports andinternational fuels (carbon dioxide only) and non-carbon ghg emissions (in CO2 equivalents). Non-carbon ghg emissions are made up of Agriculture(CH4 and N2O). Soils and Forests Carbon Sinks,ODS substitutes, Semi-conductor manufacture(PFCs), Electric Utilities (SF6). Cement, OtherIndustrial Processes, Solid Waste Management,Landfill Gas, and Wastewater, Methane from oiland gas systems, Methane and N2O from FossilFuel Combustion.
19

6: Total Energy Consumption Relative to 1970California and the Rest of the U.S.
Inde
xed
to 1
970
While California’s economy has grownsubstantially over the past several decades, theState has consistently improved its efficiencyin energy consumption (See pages 22-23).Since 1970, California has greatly reduced itstotal energy consumption per capita (Chart6); however, in absolute terms, the State’s totalenergy consumption continues to rise as itspopulation grows, underscoring the need forcontinued efforts to increase efficiency. Totalenergy consumption includes all of the following
sources: petroleum, natural gas, electricity retailsales, nuclear, coal and coal coke, wood, waste,ethanol, hydroelectric, geothermal, solar andwind energy.
The State has shown that it is possible to havelower electricity bills through greater energyefficiency than most states. This meansCalifornians have more to spend on otheruses—money that their counterparts in otherstates spend on energy.
Californiademonstrates thatenergy efficiencycan translate intoeconomic gain
1970 1975 1980 2004
100
120
Source: Energy Information Administration; U.S. Census
CA Per Capita
Rest of U.S. per Capita
1985 1990 1995 2000
110
130
140
150
160
90
80
CA Total Consumption
Rest of U.S. Total Consumption
Although total energy consumption relative to 1970 levelshas increased similarly in California and the rest of theUS, trends in per capita consumption (a measure ofefficiency) have taken very different paths. Since 1980,per capita consumption in California has continuedto decrease relative to 1970 levels.
the first wave2
20

7: Statewide Electricity Bill as a Fraction of GDP
Per
cent
age
of G
DP
8: Average Monthly Residential Gas & Electrical Bills2005
$49
$74
California
$43
$118
Florida
$50
$135
Texas
$84
$86
US w/o CA
In Chart 7, the state electricity bill is representedas a fraction of state GDP. As a fraction of thestate economy, the Texas electricity bill is almostdouble the California bill.
Looking at the most recent year, 2005,California’s bill represents 1.79% of GDP –about half the Texas bill which equates to 3.24%of GDP.8 The difference between the two statesof 1.45%, when put into terms of California’sGDP, translates into $24.7 billion thatCalifornians do not spend on electricity.
Since 1999, there has been little variation yearto year in California’s average residential electricbills. In 2005, the average monthly residentialelectricity bill in California was almost half thatof Texas and two-thirds the average bill inFlorida (Chart 8). In view of natural gas, whilesimilar to bills in Florida and Texas, California’saverage monthly residential bill is roughly half ashigh as bills in the rest of the country (Chart 9).
Recent work by researchers at U.C. Berkeleyconcludes that California's residential low energyuse is real. “From 1970 to 2004, Californiadecreased its annual residential energyconsumption by 35% while other statesincreased. Alternative explanations includingweather, income, prices and economic structureaccount for at most 15%.”10
1990 1991 2005
3.5%
Source: Energy Information Agency, U.S. Department of Energy; Bureau of Economic Analysis, U.S. Department of Commerce
2.0%
4.0%
4.5%
1.0%
0%1992 1993 1994 1995 1996 1997 1998 1999 2000 2001 2002 2003 2004
California
US without CA
Texas
Florida
1.79%
2.97%
2.54%
3.24%
3.0%
2.5%
1.5%
0
20
40
60
80
100
120
$160
140
Natural Gas
Electricity
Source: Energy Information Agency, U.S. Department of Energy
0.5%
21

10: Annual Energy Savings from Efficiency Programs and StandardsGigawatt-hours per year
Investor-OwnedUtility Efficiency
Programs
BuildingStandards
ApplianceStandards
GW
h/ye
ar
California has implemented efficiency programsand standards that have yielded increasingelectricity savings. In 2003, the State saved40,000 Gigawatt-hours through utility efficiencyprograms which equated to 15% of annualelectricity use in California that year (Chart10). Since 1975, this energy savings has supplantedthe need for 24 new, large-scale (500-megawatt)power plants.11 Although Chart 10 only includesprograms of investor-owned utilities, California'spublicly owned utilities have more than tripled
their energy savings targets, which cumulativelynow total about 120 MW per year (comparedto 500 MW for the three major investor-ownedutilities).
In addition, projected savings associated withrecently adopted updates to California’s energyefficiency standards for buildings and appliancesare expected to avoid the need for five giantpower plants in the next 10 years.12 (See page29 for description of Title 20 Appliance EfficiencyStandards and Title 24 Building Efficiency Standards.)
Californians haveexperiencedsubstantial andgrowing energysavings as a directresult of efficiencyprograms
1975 1977 2003
30,000
Source: California Energy CommissionNote: This dataset is part of a demand forecast output. As of October 2007, the CEC does not have 2004 and 2005 data available yet,as data for more recent years have not been normalized to this particular set of data.
20,000
40,000
50,000
10,000
01979 1981 1983 1985 1987 1989 1991 1993 1995 1997 1999 2001
~15% of Annual Electricity Usein California in 2003
the first wave2
22

Net
Dol
lar
Sav
ings
(Billi
ons
of In
flatio
n A
djus
ted
Dol
lars
)
Firs
t Yea
r N
et A
nnua
l Sav
ings
(GW
h)
First Year Net AnnualEnergy Savings (GWh)Net Dollar Savings
Source: Pacific Gas and Electric Company, Southern California Edison, and San Diego Gas & Electric, “Energy Efficiency Annual Reports,”May 1999–2005, filed at the California Public Utilities Commission.
*Note: Net benefits & energy savings includes Electricity & Natural Gas
1998 1999 2005
1.0B
.6B
1.4B
$1.6B
.2B
02000 2001 2002 2003 2004
.8B
.4B
1.2B2,500
1,500
3,500
500
0
2,000
1,000
3,000
11: Net Dollar Savings and GWh Saved from Utility Efficiency ProgramsInvestor-owned utility efficiency programs
Result of CPUC reinstating utilitymarket decoupling mechanism.
Utility efficiency programs are now generatingmore return on investment—electricity savingsare growing while the cost of funding theseprograms is getting lower (Chart 11). In termsof dollars saved, the California EnergyCommission estimates that building andappliance standards alone have saved residentsand businesses $56 billion through 2003 andare to save another $23 billion by 2013.13
Additionally, projected savings resulting fromnew appliance efficiency standards adopted in2004 are expected to reduce consumer utilitybills by $3.3 billion during the first 15 yearsthey are in effect.14
During the failed electricity deregulation periodin the late 1990s, the California Public UtilitiesCommission (CPUC) did away with“decoupling,” the regulatory mechanism thatenables the State’s investor-owned utilities(IOUs) to promote and provide energyefficiency programs to their customers, withoutcutting into utility profits. The elimination ofdecoupling accounts for the significant drop-off in energy savings from 1998-2000. Theup-tick in 2001 occurred once the CPUCreinstated decoupling.
23
California may be in the early stage of the nextwave of green innovation. A similar confluenceof forces from the first wave may be at work,ushering in this next wave—including risingoil prices, state policies promoting energyefficiency and emission reductions, shiftingattitudes and behaviors regarding global warmingand new technologies such as alternative fuelvehicles, and increasing innovation in energytechnology areas.
There are signs that in recent years the adoptionof existing green products and practices inCalifornia has accelerated. There are also signsthat much higher levels of investment arepouring into energy technology innovation inCalifornia, that the State is producing a growingshare of patents in areas such as solar andwind technology, and that a conservativeestimate of green jobs in California now tops20,000—reflecting growth by about 50%over the last decade.
While it is too early to tell what this new wavemight ultimately look like, the California GreenInnovation Index intends to track signs ofchange in three key areas.
The environment for change.The next wave of green innovation will need asupportive environment if it is to buildmomentum. At its most basic, this means thatlarge numbers of Californians will need torecognize the nature and urgency of the problemof global warming—and to be receptive toinnovation as a way to solve the problem andbring economic benefits to the State.
The adoption of existing greenproducts and practices.Green innovation takes place when residents,businesses, and governments adopt existingproducts and practices to improve energyefficiency or increase energy alternatives inways that reduce greenhouse gas emissionsand generate economic benefits (e.g., financialsavings available for re-investment in moreproductive activities).
The creation of new greenproducts and services.Green innovation also takes place whenbusinesses create new products and servicesthat improve energy efficiency or increaseenergy alternatives in ways that reducegreenhouse gas emissions and generateeconomic gains (e.g., new companies, newjobs, public revenues). This kind of innovationcan serve the needs not only of the Californiamarket, but also those of the globalmarketplace, generating additional economicbenefits for the State.
the next wave3TRACKING SIGNS OF THE NEXT WAVE OF GREEN INNOVATION
24

RECOGNITION OF THE PROBLEM AND RECEPTIVITY TO INNOVATION
Californians recognize the urgency of the problem—and believe a lot can be done about it
As a component of the inaugural California Green InnovationIndex, Next 10 commissioned the 2007 Field/Next 10 GlobalWarming Survey of Californians - a survey of Californiaresidents on their understanding of global warming and thesteps they are taking and willing to take for the purpose ofstemming the impacts of climate change.
More so than Americans in general, Californians recognizethat global warming is very real, urgent, and is having or willhave serious negative impacts—including environmentalimpacts (coastlines, snow pack), economic impacts (agriculture,the broader California economy), and social impacts (health,overall quality of life). But Californians also believe that thegeneral public, industry, and others can do a lot to successfullyaddress the problem.
SURVEY RESULTS:Californians’ Views on Global Warming
51% of Californians have heard “a great deal” aboutglobal warming, compared with 42% of Americans overall.14
70% of Californians say that the issue of global warmingis “extremely” or “very” important to them, compared with52% of Americans overall.15
75% of Californians agree that some action should betaken to combat global warming, compared with 61% ofAmericans overall.16 Moreover, 43% of Californians agreethat “global warming has been established as a serious problemand immediate action is necessary”, compared with 28% ofAmericans overall.17
ENVIRONMENT FOR CHANGE
Large percentages of Californians believe global warmingis a “very serious” threat to the State’s economy (41%),overall quality of life (49%), coastal communities (51%),farmers in the Central Valley (53%), the State’s snowpackand water supply (63%), and the health of Californiansliving where air quality is poor, such as near freeways,ports and industrial sites (66%).
Large percentages of Californians believe that the followinggroups can do “a lot” to reduce global warming: majorcorporations (67%), gas and electric utility companies(63%), government (U.S. 56%, other countries 51%,state and local 49%), and clean energy companies (52%).
57% also believe that the general public (“peoplelike you”) can do a lot about reducing global warming,compared with 27% of Amer icans overall. 1 8
Californians believe that reducing emissionsand growing the economy is both possibleand desirable—and believe that new technologieswill help solve the problem
SURVEY RESULTS:Californians Believe We Can Reduce Emissionsand Grow the Economy at the Same Time
85% agree that California can reduce greenhousegases that contribute to global warming and expand jobsand economic prosperity at the same time. More thanhalf (54%) agree “strongly” with this statement.
77% agree that firms and government researcherswill develop new technologies to solve the problem ofglobal warming; 39% agree “strongly” with this statement.
25

12: GHG Emissions by Source – 2004Includes electricity imports and excludes international bunker fuels
41%
22%
21%
8%8% Transportation
Electrical Power
Industrial
Agriculture& Forestry
Others
Source: California Energy Commission, Inventory of California Greenhouse Gas Emissions and Sinks: 1990-2004. Staff Final Report. CEC-600-2006-013-SF. December 2006.
the next wave3ADOPTION OF GREEN PRODUCTS AND PRACTICESThe combination of actions by individuals,businesses and government leaders that comprisegreen innovation in the forms of technology,preferences and policy, has a compoundingeffect. To measure green innovation in termsof the adoption of green products and practices,we focus on vehicles, homes, and workplaces—the major users of energy and, directly orindirectly, the major drivers of greenhouse gasemissions. As illustrated in Chart 12,
transportation accounts for the highestpercentage of gross greenhouse gas emissions(41%). Businesses and residences, by virtue oftheir electricity use, also drive needs for bothin-state electricity generation and electricityimports—which together account for 22% ofgross emissions. In addition, industrial activitiesproduce 21% of gross GHG emissions. Thus,adoption of green products and practices inhomes, workplaces, and vehicles is critical tothe reduction of greenhouse gas emissions.
26

Californians areaccelerating theiradoption of greenproducts andpractices to reduceelectricityconsumption
13: Electricity Consumption in CaliforniaTrends relative to 1990
Inde
xed
to 1
990
Electricity Consumption by Sector2005
There are signs that Californians have begunto adopt a less energy-intensive lifestyle.Throughout the past 15 years, per capitaelectricity consumption has not increased inCalifornia. In fact, electricity consumption percapita has consistently been lower than 1990levels, with the exception of a spike in 2000(Chart 13).
1990 1991 1992 2005
100
110
Source: California Energy Commission; U.S. Census Bureau
Total
Per Capita
1993 1994 1995 1996
100
115
120
125
130
95
90
1997 1998 1999 2000 2001 2002 2003 2004
While electricity consumption relativeto 1990 levels continues to rise, percapita consumption (except for 2000)has remained below 1990 levels.
40%
34%
18%
8%Commercial
Residential
Industrial
Agriculture
Source: California Energy Commission
27

Our survey results show that the majority ofhomeowners in California are already adoptingor are planning to adopt specific electricitysaving products and practices. Data shows thatan increasing number of Californians arepurchasing energy efficient light bulbs—evenmore so than in the rest of the country. Since2002, the share of Compact Fluorescent Lamps(CFLs) purchased in California has been steadilyon the rise. Although in 1999, the share of CFLspurchased was less than 1% in both Californiaas well as the rest of the U.S., in 2005, the shareof these energy efficient light bulbs purchasedin California was over double that of the restof the U.S. (Chart 14).
Energy Star Appliances are becomingincreasingly more pervasive in the Californiamarket. In 2005, approximately 90% of thedishwashers purchased in California were EnergyStar qualified. The adoption of green productsis helping Californians to reduce electricityconsumption, thereby also contributing to areduction in electricity bills (Chart 15).
the next wave3
SURVEY RESULTS:Large Percentages of Californians are adopting and planningto adopt specific electricity saving products and practices.
Already Likely in ConsideringBehavior Doing Coming Year For Future
Turn off computers, etc. 93% 3% 2%
Adjust heating/AC to save energy 84% 3% 2%
Buy/use CFL or LED bulbs 76% 10% 7%
Buy/use Energy Star appliances* 84% 6% 9%
Install water-saving devices* 76% 5% 12%
Insulate home, water heater, etc.* 75% 6% 12%
(* Share of homeowners only)
28

1999 2000 2001 2002 2003 2004 20050%
2%
4%
6%
8%
14: Market Share of CFL Light BulbsShare of CFLs purchased as a percent of all medium screw-based lamps
1998 2000 2001 2002 2003 2004 20050%
20%
40%
60%
100%
15: California Market Share of Energy Star Appliances
1999
80%
Title 20Appliance Efficiency StandardsIn 1980, the California Energy Commissionwas granted the right to adopt efficiencystandards for appliances. These standards, underthe California Code of Regulations, coverrefrigerators, freezers, washing machines, airconditioners and lighting.
Title 24California Building StandardsThe Energy Efficiency Standards for Residentialand Nonresidential Buildings were establishedin 1978 in response to a legislative mandate toreduce California's energy consumption.Periodically updated to allow for new energyefficiency technologies and methods, thesestandards include minimum requirements forbuilding insulation as well as heating, ventilating,air conditioning, and water heating equipment.California Energy Commission
Source: California Measurement Advisory Council (CALMAC)
California
Source: California Measurement Advisory Council (CALMAC)
Rest of US
Dishwashers
Refrigerators
Clothes Washers
29
29

1980 20030
0.4
0.8
1.2
2.4
16: Office Building Electricity ConsumptionConsumption per Square Foot
1.6
2.0
1990 2000 2001
0
30%
17: Commercial Office Building Electricity Consumption By Industry
-15%
25%
20%
15%
10%
5%
-10%
-5%
1980-1990
1990-2003
SURVEY RESULTS:Californians are reporting that theiremployer encourages specific behaviorsto improve energy efficiency
25% of working Californians say theiremployer provides incentives to employees totake public transit, work from home, or purchasehybrid, electric, or alternative fuel vehicles.
35% of working Californians say theiremployer has provided information about waysto conserve energy and reduce greenhouse gasemissions at the workplace.
Although the electricity intensity of thecommercial business sector increased between1980 and 1990, over the course of the followingdecade it has made gradual progress in becomingmore energy efficient (Chart 16). Overall,commercial electricity consumption per squarefoot declined slightly from 1990-2003 (Chart16). Looking at commercial sector electricity
consumption by industry shows that specificindustries have been making considerable stridesin reducing electricity use (Chart 17). Whilekey industry sectors such as retail, restaurants,food stores, and large offices experiencedsubstantial reductions in energy consumption,the commercial sector still has much potentialto become more energy efficient, as other keysectors continue to consume more electricity.
The commercialbusiness sector–the largestconsumer ofelectricity inCalifornia–has become moreenergy efficient inrecent years
Source: California Energy Commission
GW
h pe
r S
quar
e Fo
otP
erce
nt C
hang
e in
Ele
ctric
ity C
onsu
mpt
ion
per S
quar
e Fo
ot
Source: California Energy Commission
LargeOffices
1,075
All OtherBuildings
1,052
Retail
948
Warehouses
779
Schools
457
SmallOffices
354
Colleges
287
Hospitals
285
Hotels/Motels
284
FoodStores
247
Restaurants
163
RefrigeratedWarehouses
47TotalSq. Feet
(millions ofsquare feet)
the next wave3
30

1970100
90
120
130
18: Petroleum Consumption in CaliforniaTrends relative to 1970
1975
160
80
110
140
150
20041980 1985 1990 1995 2000
2000100
98
104
106
19: Gas Sales in CaliforniaTrends relative to 2000
2001
110
102
108
20062002 2003 2004 2005
199710M
20M
25M
20: Registered Vehicles and Emissions – California
1998
30M
15M
20051999 2000 2001 2002 2003 2004
600
0
500
400
300
200
100
To meet the needs of a rapidly growingpopulation in California, total consumption ofmany resources, including petroleum, has beengrowing accordingly. While there has been anincrease in total petroleum consumption, since
Gasoline salesand vehicle milestraveled haveleveled off
the 1980s per capita consumption has droppedbelow 1970 levels (Chart 18). Other observabletrends include the leveling off of gas sales since2004 relative to 2000 (Chart 19) and thecontinued increase in total CO2 emissions andnumber of vehicles (Chart 20).
While total petroleum consumption relativeto 1970 has continued to rise, per capitaconsumption since the 1980s has remainedbelow levels in 1970.
Total Consumption
per Capita Consumption
Inde
xed
to 1
970
Inde
xed
to 2
000
Total Gas Sales
Gas Sales per Capita
Source: Energy Information Administration, U.S. Census Bureau
Source: California Board of Equalization; U.S. Census Bureau
CO2 Emissions
CA Entire Vehicle Fleet
Tota
l Num
ber
of V
ehic
les
– in
Milli
ons
Source: California Air Resources Board
Thou
sand
s of
tons
of C
O2
emis
sion
s pe
r da
y
31

1995 1996 1997 1998 1999 2000 200598
102
104
106
114
21: Vehicle-Miles TraveledCalifornia & Rest of U.S., Per Capita trends relative to 1995
108
110
112
2001 2002 2003 2004
100
1995 1996 1997 1998 1999 2000 200580
100
110
120
160
22: California VMT & Gas PricesPer Capita trends relative to 1995
130
140
150
2001 2002 2003 2004
90
Source: U.S. Department of Transportation, Federal Highway Administration, Highway Statistics;California Department of Transportation Califorrnia Motor Vehicle Stock, Travel and Fuel Forecast
California
Rest of U.S.
Inde
xed
to 1
995
Vehicle-miles traveled (VMT) per capita havebegun to decrease since 2002, showing thatCalifornians are driving shorter distances onaverage. In the rest of the U.S., however, VMTper capita has grown much faster (Chart 21).
While there are signs that rising gas prices canimpact gas consumption, Chart 22 illustratesthe relative inelasticity of demand for gas inthe State as the rate of price increases far outpacethe drop in consumption. Gas prices alonehave not brought about change in behaviors.
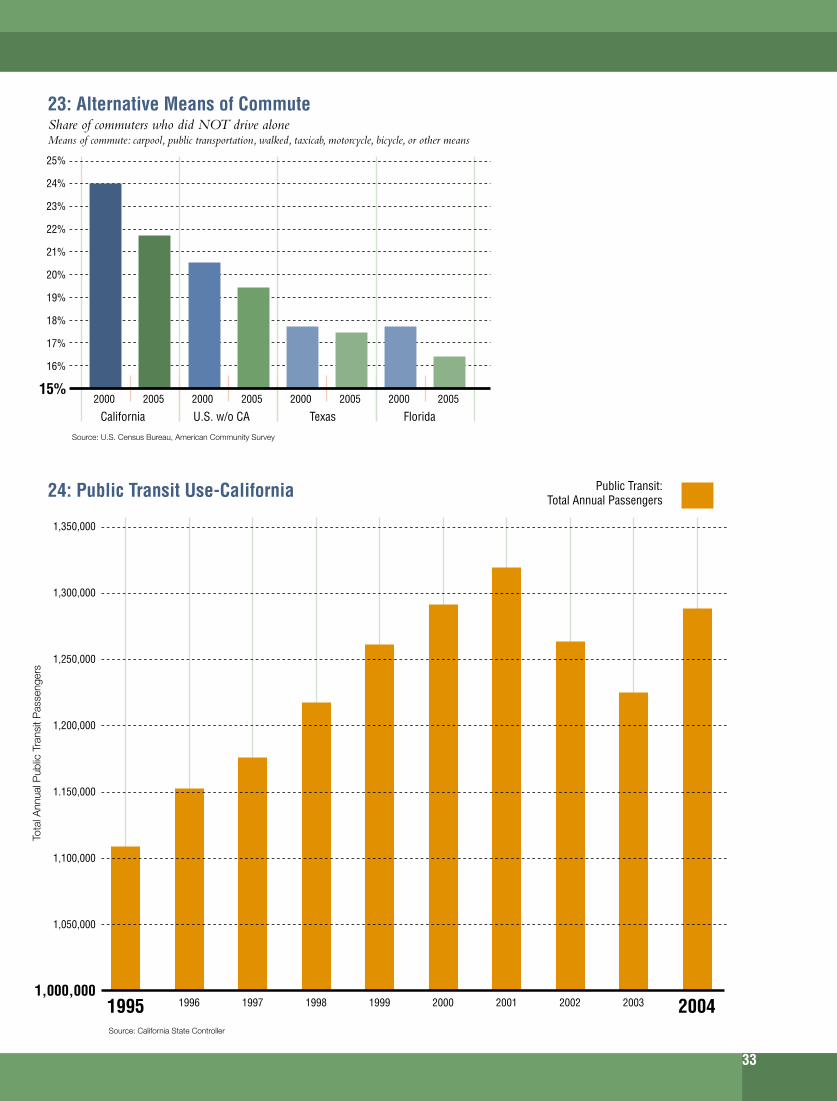
Although the share of the population usingalternative means of commute has beendecreasing in California and the rest of the U.S.alike (Chart 23), Californians are less likely todrive alone than other Americans. Over thepast decade, there has been a long-term trendof growing public transit use. Though dippingwith the economic contraction in 2002 and2003, transit ridership in 2004 was back tolevels seen in 2000 (Chart 24).
* Inflation adjusted to 2005 dollarsSource: U.S. Department of Transportation, Federal Highway Administration, Highway Statistics;
Enegy Information Administration, Petroleum Marketing Annual; California Department of Transportation,Califorrnia Motor Vehicle Stock, Travel and Fuel Forecast
Inde
xed
to 1
995
California VMT
CA Gas Prices
the next wave3
32
Tota
l Ann
ual P
ublic
Tra
nsit
Pas
seng
ers
200015%
19%
20%
21%
25%
23: Alternative Means of CommuteShare of commuters who did NOT drive aloneMeans of commute: carpool, public transportation, walked, taxicab, motorcycle, bicycle, or other means
22%
23%
24%
18%
17%
16%
2005 2000 2005 2000 2005 2000 2005
1,250,000
1.150,000
1,350,000
1,050,000
1,000,000
1,200,000
1,100,000
1,300,000
1995 1999 2004Source: California State Controller
2000 2001 2002 2003
24: Public Transit Use-California Public Transit:Total Annual Passengers
199819971996
Source: U.S. Census Bureau, American Community Survey
California U.S. w/o CA Texas Florida
33

California Energy Commission. 2005. California’s Water-Energy Relationship,Final Staff Report. Publication CEC-700-2005-011-SF (November 2005),Page 8.
California Electricity Use, 2001
Electricity (GWh)Total Water Pumping Electricity Use*5,500Total Water Related Electricity Use**48,012Total Electricity Use**250,494* See Chart 26, for year 2001.
California Energy Commission. 2005. California’sWater-Energy Relationship, Final Staff Report.Publication CEC-700-2005-011-SF (November2005), Page 9.
0
40,000
25: Water Consumption by SectorCalifornia
35,000
30,000
25,000
20,000
15,000
10,000
5,000
Thou
sand
Acr
e Fe
et
Water Consumptionin California - 2003Share of Water Use by Sector
Agricultural
Residential
Commercial 3%Landscape 3%
Industrial 1%
Source: California Department of Water Resources
1998 1999 2000 2001 2002 2003Agricultural Residential Commercial Industrial Landscape
16%
77%
the next wave3California’s water system accounts forapproximately 20% of the State’s gross electricityuse.20 Depicted in Chart 25, agricultural wateruse makes up almost 80% and residential 16%of total water use in California. In 2003(the most recent year available), total waterconsumption was lower than in the threepreceding years.
Conveyance of water across the state in 2001accounted for 11% of total electricity use relatedto water.21 Water use in California is particularly
energy-intensive because much of the State’swater demand is located far away from availablesources, and the process of moving the water(pumping) results in high energy costs.According to the Energy Commission, “Nearly70 percent of the state’s total stream runoff isnorth of Sacramento, but 80 percent of thewater demand is south of Sacramento.”21
Reducing consumption and improving theefficiency of California’s water-use system wouldyield high energy savings and thereby reducegreenhouse gas emissions.
Water consumptionand pumping—responsible forabout 20% ofCalifornia’s grosselectricity use—are using lesselectricity thanin the past
34

California Energy Commission. 2005. California’sWater-Energy Relationship, Final Staff Report.Publication CEC-700-2005-011-SF (November2005), Page 9.
1990 1996 1997 1998 1999 2000 20050
2500
3000
4500
3500
4000
2001 2002 2003 2004
2000
26: Energy Use Through Water PumpingCalifornia
1500
1000
500
19951994199319921991
Source: California Energy Commission
GW
h
Agricultural Water Pumping
Urban Water Pumping
Los Angeles’s Water Conservation SuccessPrompted by the drought of 1987-1992, the City of Los Angeles hasinvested over $100 million in conservation measures over the last decade.Even with steady population growth, these measures have slowed annualaverage demand growth from 2.1% in the pre-conservation period to1.3% projected over the next 20 years. Conservation efforts include apublic awareness program and education campaign that have resultedin the widespread installation of low-flow hardware devices (e.g. toiletsand showerheads) and change in use habits. Additionally, the City isimplementing water recycling for non-potable uses such as landscapingand industrial uses.Los Angeles Department of Water & Power
From 2004-2005, California reduced electricityuse attributed to water pumping, for both urbanand agricultural uses (Chart 26). In addition,public sector initiatives have been establishedto improve water efficiency through fundingprojects and research for new technology, suchas water recapture.
35

0
50,000
28: California Renewable Portfolio StandardActual and Forecasted RPS Generation from Investor-Owned Utilities (IOUs)
40,000
20,000
GW
h
10,000
30,000
0
35,000
27: Renewable Energy Generation in CaliforniaGigawatt hours by source
30,000
15,000
25,000
20,000
GW
h
10,000
5,000
In recent years, many steps have been taken toincrease the generation and procurement ofrenewable energy. From 2002 to 2006, totalrenewable energy generation in the State grewby 8%, with growth primarily in windgeneration23 (Chart 27). Over this period,electricity generation from renewable sourceshas accounted for 11% of California’s totalelectricity generation.
In 2002, the Renewable Portfolio Standard(RPS) was established to ensure that Californiansuse cleaner energy. Since the RPS wasintroduced, investor-owned utilities (IOUs)have been procuring a larger share of renewableenergy (Chart 28). As old contracts expire,the IOUs have new renewable energy contractsin the pipeline to help them attain the RPS targetof 20% renewable energy generation by 2010.
Californians areincreasing theiruse of cleanerenergy to reducegreenhouse gasemissions bothat home andon the road
*Note: Review of the 2007 bids is ongoing at each IOU, with sellers due to be notified in late June or early July as to whether their bids have been short-listed. The IOUs will then enter into negotiations withthose short-lived bidders who agree to post a deposit and withdraw any conflicting offers they had made to other solicitors. Negotiations will continue through 2007, and any resulting RPS contract should befilled with the CPUC for approval by the end of the year. Some of the short-listed bids may not receive contracts, but many represent viable projects that may receive contracts and contribute to the 2010 goal.Source: California Energy Commission
2003Pre-2002 Contracts
2004 2005 2006 2007 2008 2009 2010 2011 2012 2013
Target:20% of ExpectedIOU Retail Sales
2002 Contracts
2003 Contracts
2004 Contracts
2005 Contracts
2006 Contracts
Pending Approval
Short-listed Bids
Expired Contracts
RPS Target
Source: California Energy Commission
2002
Solar
2003 2004 2005 2006
Wind
Small Hydrogen
Biomass
Geothermal
the next wave3
36

0
225,000
29: Energy from Solar Installations in CaliforniaGrid-Connected Solar Photovoltaics
kilo
wat
ts a
dded
, cum
ulat
ive
200,000
175,000
150,000
125,000
100,000
75,000
50,000
25,000
California’sRenewablePortfolio Standard(RPS) is One of theMost AmbitiousRenewable EnergyStandards inthe Country
Since 2000, California has been experiencinga growing trend in solar installation, as depictedin Chart 29. Programs have been establishedto encourage solar installation and make solarenergy more accessible and affordable. TheState’s California Solar Initiative providesinformation on rebates and federal tax incentivesto help lower the cost of solar systems forCalifornians. Californians have already proven
receptive to these programs—in 2006, 58% ofresidential solar installation was added throughstate-sponsored incentive programs, theCalifornia Solar Initiative and the earlierEmerging Renewables Program and Self-Generation Incentive Program.23 From 1981-2006, approximately 200 MW of grid connectedsolar photovoltaic was installed in California,equivalent to 40% of the capacity of a largepower plant (500MW).
Established in 2002 under Senate Bill 1078 andaccelerated in 2006 under Senate Bill 107,California’s RPS obligates investor-ownedutilities, energy service providers andcommunity choice aggregators to procure anadditional 1% of retail sales per year fromeligible renewable sources until 20% is reached,no later than 2010. The California Public UtilitiesCommiss ion and Ca l i forn ia EnergyCommission are jointly responsible forimplementing the program.
California Public Utilities Commission, July 2007 Report to the Legislature
1981 20061984 1987 1990 1993 1996 1999 2002
Note: The Self-Generation Incentive Program and the Emerging Renewables Program were replaced by the California Solar Initiative in 2006.Source: California Energy Commission
Total kW addedin California
kW added throughState sponsoredincentive programs
37

0
1800
30: Alternative Fuel VehiclesGrowth in operational vehicles registered relative to 2000
100
= 2
000
Valu
es
1500
1200
900
600
300
100
0.0%
0.6%
31: Alternate Fuel Vehicles by TypeAs share of all operational vehicles in California
0.5%
0.4%
0.3%
0.2%
0.1%
Sha
re o
f all
oper
atio
nal v
ehic
les
An increasing number of Californians arepurchasing hybrid, compressed natural gas andelectric vehicles. From 2000 to 2005, registrationsof such alternative fuel vehicles increased by 18times (Chart 30). In contrast, the growth of allother vehicles purchased remained relativelyunchanged. There remains plenty of potentialfor improvement in the alternative vehiclemarket, as the share of alternative vehicles stillonly makes up less than 1% of all operationalvehicles in the State (Chart 31).
2000 2005*Note: Includes hybrid and electric vehicles as well as vehicles running on natural gas. Does not include diesel enginevehicles or vehicles running on all alcohol based and gaseous noncarbon fuels.Source: California Department of Motor Vehicles
2001 2002 2003 2004
Hybrid, Natural Gas& Electric Vehicles
Total Operational Vehicles
2000 2005*Note: Includes hybrid and electric vehicles as well as vehicles running on natural gas. Does not include diesel enginevehicles or vehicles running on all alcohol based and gaseous noncarbon fuels.Source: California Department of Motor Vehicles
2001 2002 2003 2004
Electric
Natural Gas
Hybrid
the next wave3SURVEY RESULTSCalifornians reporting past or potential purchaseof a hybrid/alternative fuel vehicleAs of 2005, according to the latest state vehicle registration figuresavailable, approximately 3% of households in California had purchaseda hybrid, electric, or alternative fuel car. Two years later, 6% ofrespondents to the 2007 Field/Next 10 Global Warming Survey ofCalifornians, said that they have purchased a vehicle of this kind. Another10% of Californians responded that they are likely to do so in the nextyear, and 50% said they are considering such a purchase in the future.
38

liquified petroleumbiodieselelectricliquified natural gascompressed natural gashydrogen
dots representative of themore than 900alternative fuel stations
ALTERNATIVE FUEL STATIONS
39
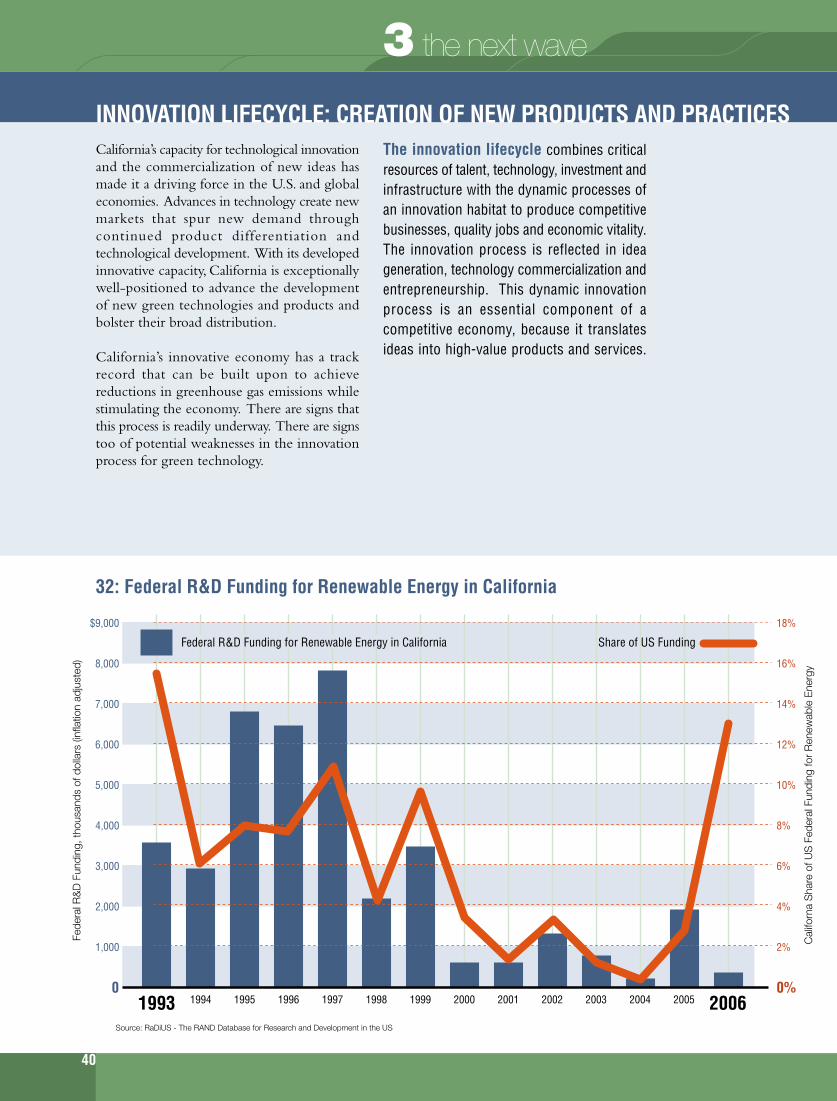
Fede
ral R
&D
Fun
ding
, tho
usan
ds o
f dol
lars
(inf
latio
n ad
just
ed)
Cal
iforn
a S
hare
of U
S F
eder
al F
undi
ng fo
r R
enew
able
Ene
rgy
Share of US FundingFederal R&D Funding for Renewable Energy in California
The innovation lifecycle combines criticalresources of talent, technology, investment andinfrastructure with the dynamic processes ofan innovation habitat to produce competitivebusinesses, quality jobs and economic vitality.The innovation process is reflected in ideageneration, technology commercialization andentrepreneurship. This dynamic innovationprocess is an essential component of acompetitive economy, because it translatesideas into high-value products and services.
California’s capacity for technological innovationand the commercialization of new ideas hasmade it a driving force in the U.S. and globaleconomies. Advances in technology create newmarkets that spur new demand throughcontinued product differentiation andtechnological development. With its developedinnovative capacity, California is exceptionallywell-positioned to advance the developmentof new green technologies and products andbolster their broad distribution.
California’s innovative economy has a trackrecord that can be built upon to achievereductions in greenhouse gas emissions whilestimulating the economy. There are signs thatthis process is readily underway. There are signstoo of potential weaknesses in the innovationprocess for green technology.
1993 1999 2006
8,000
Source: RaDiUS - The RAND Database for Research and Development in the US
6,000
$9,000
02000 2001 2002 2003 2004
7,000
5,000
32: Federal R&D Funding for Renewable Energy in California
4,000
3,000
2,000
1,000
200519981997199619951994
16%
12%
18%
0%
14%
10%
8%
6%
4%
2%
the next wave3INNOVATION LIFECYCLE: CREATION OF NEW PRODUCTS AND PRACTICES
40
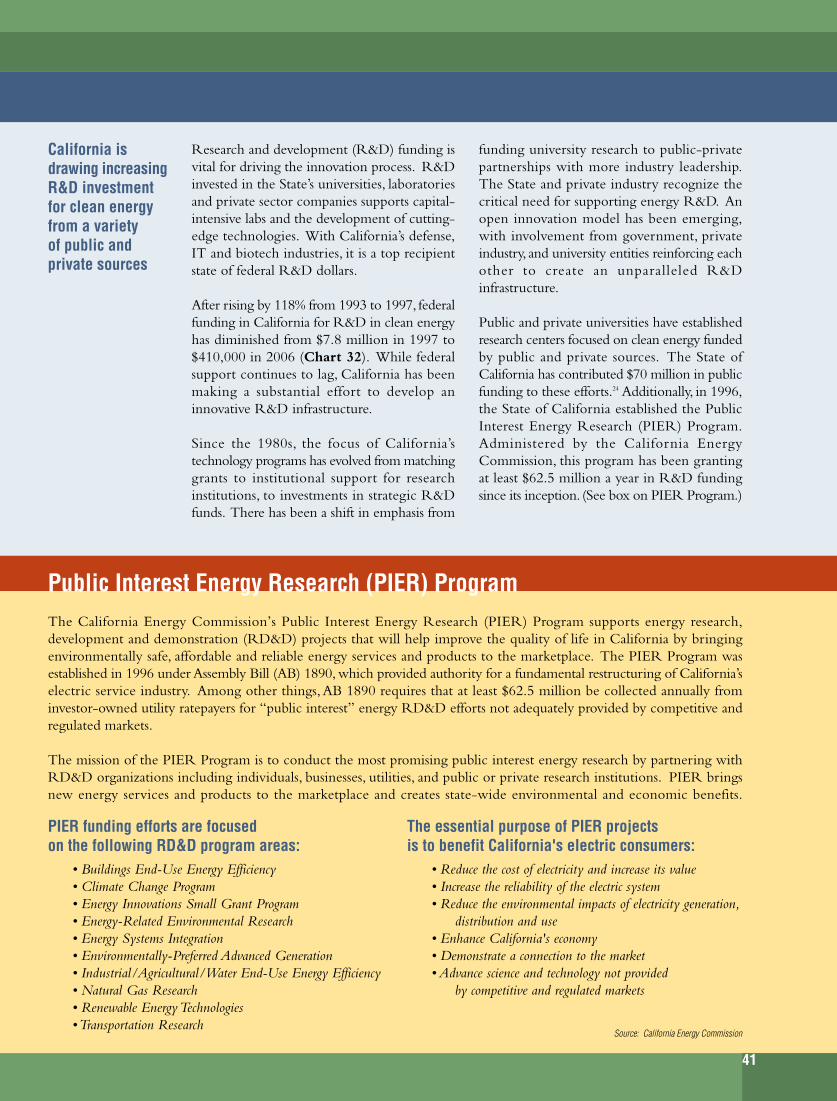
Research and development (R&D) funding isvital for driving the innovation process. R&Dinvested in the State’s universities, laboratoriesand private sector companies supports capital-intensive labs and the development of cutting-edge technologies. With California’s defense,IT and biotech industries, it is a top recipientstate of federal R&D dollars.
After rising by 118% from 1993 to 1997, federalfunding in California for R&D in clean energyhas diminished from $7.8 million in 1997 to$410,000 in 2006 (Chart 32). While federalsupport continues to lag, California has beenmaking a substantial effort to develop aninnovative R&D infrastructure.
Since the 1980s, the focus of California’stechnology programs has evolved from matchinggrants to institutional support for researchinstitutions, to investments in strategic R&Dfunds. There has been a shift in emphasis from
funding university research to public-privatepartnerships with more industry leadership.The State and private industry recognize thecritical need for supporting energy R&D. Anopen innovation model has been emerging,with involvement from government, privateindustry, and university entities reinforcing eachother to create an unparalleled R&Dinfrastructure.
Public and private universities have establishedresearch centers focused on clean energy fundedby public and private sources. The State ofCalifornia has contributed $70 million in publicfunding to these efforts.24 Additionally, in 1996,the State of California established the PublicInterest Energy Research (PIER) Program.Administered by the California EnergyCommission, this program has been grantingat least $62.5 million a year in R&D fundingsince its inception. (See box on PIER Program.)
California isdrawing increasingR&D investmentfor clean energyfrom a varietyof public andprivate sources
Public Interest Energy Research (PIER) ProgramThe California Energy Commission’s Public Interest Energy Research (PIER) Program supports energy research,development and demonstration (RD&D) projects that will help improve the quality of life in California by bringingenvironmentally safe, affordable and reliable energy services and products to the marketplace. The PIER Program wasestablished in 1996 under Assembly Bill (AB) 1890, which provided authority for a fundamental restructuring of California’selectric service industry. Among other things, AB 1890 requires that at least $62.5 million be collected annually frominvestor-owned utility ratepayers for “public interest” energy RD&D efforts not adequately provided by competitive andregulated markets.
The mission of the PIER Program is to conduct the most promising public interest energy research by partnering withRD&D organizations including individuals, businesses, utilities, and public or private research institutions. PIER bringsnew energy services and products to the marketplace and creates state-wide environmental and economic benefits.
PIER funding efforts are focusedon the following RD&D program areas:
• Buildings End-Use Energy Efficiency• Climate Change Program• Energy Innovations Small Grant Program• Energy-Related Environmental Research• Energy Systems Integration• Environmentally-Preferred Advanced Generation• Industrial/Agricultural/Water End-Use Energy Efficiency• Natural Gas Research• Renewable Energy Technologies• Transportation Research
Source: California Energy Commission
The essential purpose of PIER projectsis to benefit California's electric consumers:
• Reduce the cost of electricity and increase its value• Increase the reliability of the electric system• Reduce the environmental impacts of electricity generation,
distribution and use• Enhance California's economy• Demonstrate a connection to the market• Advance science and technology not provided
by competitive and regulated markets
41

0
1200
33: Green Technology Patent RegistrationBy primary inventors in U.S. and abroad
1000
800
600
400
200
Pat
ents
Reg
iste
red
with
US
Pat
ent &
Tra
de O
ffice
0%
55%
34: Patents by Green TechnologyCalifornia share of U.S. green technology patents
50%
45%
40%
35%
30%
Per
cent
age
of U
S G
reen
Tec
hnol
ogy
Pat
ents
25%
20%
15%
10%
5%
Patents reflect the initial discovery and registryof innovative ideas. Strong patent activityusually reflects significant R&D taking place.A key motivator to obtain patent protectionis the potential relevance to a marketableproduct or process. Patent activity can triggerhigh-impact discoveries that lead to newinnovation downstream. Further, the ability togenerate and protect new ideas, products andprocesses is an important source of regionalcompetitive advantage.
Among patents registered in the greentechnology areas of solar and wind energygeneration, energy storage, fuel cells and hybridsystems, since 1998, registrations by inventorslocated outside the U.S. have outpacedregistrations by U.S. inventors (Chart 33).These trends suggest that while U.S. investmentin green technology may be lagging, investmentin green technology by other countries is not.
Nationally, California continues to contributestrongly to U.S. patent registrations in greentechnology. Most recently, California accountedfor 44% of all U.S. patents in solar and 37% inwind technologies (Chart 34).
California is aleader in greentechnologyinnovation asmeasuredby patents
1976 2006Source: 1790 Analytics, Patent Search by Technology; US Patent & Trade OfficeAnalysis: Collaborative Economics
1981 1986 1991 1996
Green Technology includespatents in the areas of solarand wind energy generation,energy storage, fuel cells, andhybrid systems.
2001
Foreign InventorPatent Registration
US InventorPatent Registration
Beginning in 1998, inventors abroad haveregistered more patents in green technologythan inventors located in the U.S.
1990 2006Source: 1790 Analytics, Patent Search by Technology; US Patent & Trade Office Patent File
1991 1992 1993 1994 1995 1996 1997 1998 1999 2000 2001 2002 2003 2004 2005
Fuel Cells
Hybrid Systems
Batteries
Wind Energy
Solar Energy
the next wave3
42

Milli
ons
of d
olla
rs in
vest
ed in
Cal
iforn
ia c
ompa
nies
Cal
iforn
ia S
hare
of T
otal
US
Inve
stm
ent
New venture capital (VC) investment is aleading indicator of innovation and economicgrowth. Companies that have passed the screenof venture capitalists are innovative,entrepreneurial and have growth potential.The amount of venture capital invested andthe types of industries supported are predictorsof future job and revenue growth.
In 2006, 36% of VC investment in energytechnology26 invested in the U.S. went to firmslocated in California (Chart 35). Attracting$884 million in 2006, California is the toprecipient state for energy VC. Roughly a thirdof investment was in transportation and fuelsand 41% went into distributed energy, primarilyin solar.
California is topstate for U.S.venture capitalinvestment ingreen technology
1996 1999 2006
900
Source: Nth Power
700
$1,000
$02000 2001 2002 2003 2004
800
600
35: Venture Capital Investment in Energy TechnologyInvestment in California companies
500
400
300
200
200519981997
40%
0
35%
30%
25%
20%
15%
10%
5%
100
25%
22%
5%
4%
13%
6%
30%
32%
36%
38%
36%
CA Share of Total US InvestmentCA Investment Total
43

0
$450
36: Venture Capital Investment in Clean Technology, CaliforniaBy region
400
350
300
250
200
150
100
50
Dol
lars
Inve
sted
(inf
latio
n ad
just
ed) i
n M
illion
s
Across a broader scope of technology, Californiaattracted 49% of all cleantech VC investmentin the U.S. during the first half of 2007 (Chart36). The Cleantech Network describes cleantechas new technology and processes, spanning arange of industries that enhance efficiency,reduce or eliminate negative ecological impact,and improve the productive and responsibleuse of natural resources (See box of cleantechsegments). Within California, Silicon Valleydraws the greatest share of cleantech investment.In the first half of 2007, 53% of cleantech VCwas invested in companies focusing on energygeneration (Chart 37).
With assets exceeding $230 billion, California’sPublic Employees’ Retirement System has aseries of environmental investment initiativeswhich target investment in environmentaltechnology solutions that reduce pollution andimprove efficient use of natural resources.Contributing to VC funding in these areas,these investments grew from $206 million to$400 million from 2005 to 2006 (Chart 38).
Source: Cleantech Network, LLC
2005
2006
Q1/Q2 2007
Rest ofCalifornia
San DiegoRegion
Los AngelesRegion
San FranciscoRegion w/o SV
Silicon Valley
Q1/
Q2
2007
Q1/
Q2
2007
Q1/
Q2
2007
Q1/
Q2
2007
Q1/
Q2
2007
the next wave3
44

Energy Generation Transportation
Recycling & Waste
EnergyInfrastructure
EnergyStorage
Agriculture
MaterialsOther
37: Venture Capital Investment in Clean Technology, CaliforniaBy Cleantech Segment; Q1-Q2 2007
0
$450
38: California Pension Fund Investments in Cleantech Firms
400
350
300
250
200
150
100
50
Milli
ons
of d
olla
rs ($
2006
)
CleantechIndustrySegmentsEnergy Generation
WindSolarHydro/MarineBiofuelsGeothermalOther
Energy StorageFuel CellsAdvanced BatteriesHybrid Systems
Energy InfrastructureManagementTransmission
Energy EfficiencyLightingBuildingsGlassOther
TransportationVehiclesLogisticsStructuresFuels
Water & WastewaterWater TreatmentWater ConservationWastewater Treatment
Air & EnvironmentCleanup/SafetyEmissions ControlMonitoring/ComplianceTrading & Offsets
MaterialsNanoBioChemicalOther
Manufacturing/IndustrialAdvanced PackagingMonitoring & ControlSmart Production
AgricultureNatural PesticidesLand ManagementAquaculture
Recycling & WasteRecyclingWaste Treatment
Source: Cleantech Network™, LLC
53%
13%
9%
7%
7%
4%
4%3%
Source: CalPERS
Source: Cleantech Network™, LLC
2005
$2
06
2006
$4
00
45

Jobs
Est
ablis
hmen
ts
California’s innovative economy translates newideas into high-value products and services thatresult in new markets, industries, businesses andjobs. Evidence of this is emerging arounddevelopments in green technology. A recenteconomic analysis by researchers at theUniversity of California at Berkeley suggeststhat climate policies can provide broad basedeconomic stimulus and growth by providingincentives for investment in new technologies(see next page).
Based roughly on the range of business activitiesencompassed by “cleantech” described above,green establishments in the State have grownby 84% in number and have added more than10,000 jobs since 1990 (Chart 39). The bulkof these establishments and jobs are in the areasof energy generation and energy efficiency(Chart 40).
California is hometo a growing greenindustry, which iscreating thousandsof new companies,jobs, and productsto help reduceemissions
1990 1999 2006Source: National Establishment Time-Series Database
30,000
02000 2001 2002 2003 2004
25,000
39: Green Jobs & Establishments in California
20,000
15,000
10,000
5,000
200519981997
2000
0
1800
1600
1400
1200
1000
800
600
400
200
199619951994199319921991
EstablishmentsJobs
the next wave3
46

Jobs
1990 1999 2006Source: National Establishment Time-Series Database
9000
02000 2001 2002 2003 2004
8000
40: Employment by Green Sector in California
7000
6000
5000
4000
200519981997199619951994199319921991
3000
2000
1000
Energy Efficiency
Energy Generation
MACROECONOMIC ANALYSIS: THE IMPACT OF AB 32A 2006 economic analysis by researchers at U.C. Berkeley on economic growth and greenhouse gas mitigation in Californiafound that “climate policies that create direct incentives for industries to invest in new technologies can provide additionalstimulus for new employment and growth.” The macroeconomic analysis examined the impact of AB 32 as well as eightleading policy recommendations by the California Climate Action Team, and found that impacts of these eight climate actionteam policies plus the 2020 greenhouse gas emissions cap under AB 32 would be a $74 billion increase in GDP and wouldgenerate 89,000 additional jobs across all industries above a 2020 baseline (i.e., business as usual). The analysis states,“the findings indicate that California can establish global leadership in growth-oriented climate policy and energy innovation.Well-designed and implemented strategies can bring forth the state's innovation potential and apply it to one of the mostcompelling challenges of our era.”
David Roland-Holst, “Economic Growth and Greenhouse Gas Emissions in California” U.C. Berkeley, August 2006
47

0
41: Establishments in Energy Generation600
500
400
200
Est
ablis
hmen
ts
300
100
0
42: Establishments in Energy Efficiency400
200
Est
ablis
hmen
ts 300
100
0
43: Establishments in Green Transportation50
40
30
10
Est
ablis
hmen
ts
20
Growth in green establishments has beenstrongest in solar energy generationencompassing solar equipment manufacturersas well as system installers (Chart 41). Energyconservation consulting is a growing field ofservices (Chart 42). In the area of transportation(Chart 43), developers and distributors ofrenewable fuels have increased in number at anaverage annual rate of 8.9%, which is twice theaverage annual rate of 4% over this period forgreen businesses as a whole.
The geographic distr ibution of greenestablishments and employment across the Stateis widespread. As may be expected,concentrations are highest in the urban centers
of the San Francisco Bay Area, Los Angeles,Sacramento, and San Diego; however, greenestablishments are located throughout the State.
Without a formal definition of the greenindustry sector, it is not possible to preciselytrack employment and establishment growth.Using a set of companies identified as havingprimary activities that fall roughly within thedefinition of cleantech used by the CleantechNetwork described earlier, establishment andjob growth since 1990 were tracked using theNational Establishments Time-Series databasebased on Dun & Bradstreet establishment data.This sample offers a conservative estimate andis by no means a comprehensive accounting ofthe industry in California.
1990 2006Source: National Establishment Time-Series Database
1992 1994 2002 2004
Energy Conservation Consulting
1996 1998 2000
Measuring & Consulting Devices
Energy Efficiency Research
Energy Efficient Products(Lighting, Appliances/Machinery,
Building Materials)
1990 2006Source: National Establishment Time-Series Database
1992 1994 2002 2004
Renewable Fuels(Distributors and Manufacturers of Biodiesel, Biofuels, Hydrogen, Fuel Cells, Syngas and others)
1996 1998 2000
Electric & Hybrid Vehicles(Distributors and Manufacturers of Electric Vehicles, Bikes & Equipment)
1990 2006Source: National Establishment Time-Series Database
1992 1994 2002 2004
Solar Energy Systems(Equipment Manufacturers and Installers)
1996 1998 2000
Other Energy Sources(Equipment Manufacturers and Installers of Wind,Geothermal, Hydro and others as well as anycombination including with Solar)
Energy Infrastructure & Consulting
the next wave3
48

Del Norte
SiskiyouModoc
LassenShasta
TrinityHumboldt
Butte
Plumas
Sierra
NevadaPlacerYubaSutter
El Dorado
Amador
Calaveras
Alpine
Tuolumne
StanislausAlameda
Santa Clara
Merced
Mariposa
Madera
Monterey
Mono
San BenitoFresno
Tulare
Inyo
Kings
San Luis Obispo Kern
Santa Barbara
Ventura
San Bernardino
San Diego
Riverside
Imperial
Los Angeles
Orange
Tehama
Glenn
Mendocino
LakeColusa
Sonoma
Marin
Napa
Yolo
Solano
San Francisco
San Mateo
Santa Cruz
Sacra-mento
Contra Costa San Joaquin
Energy Generation
Energy Efficiency
Transportation
Others
1-9 10-49 50-99 100+
GREEN ESTABLISHMENTS
49

Milli
on M
etric
Ton
s of
CO
2 E
quiv
alen
t
Source: California Energy Commission
500
0
600
400
44: History of California Emissions and Future AB 32 Target
300
200
100
1990 20201995 2000 2004 2010
WithoutInnovation
WithInnovation
AB32 Emissions Limit
the next wave4THE CHALLENGE & PROSPECTS FOR THE FUTURECalifornia has helped drive, and has benefitedfrom, a first wave of green innovation thatdelivered breakthroughs in energy efficiency.There are growing signs that the State may beat the beginning of the next wave. However,it is also clear that the challenge facing Californiais substantial—and will require that the nextwave of green innovation grows well beyondwhat we see today.
It is unlikely that California will meet thechallenge of reducing emissions to 1990 targetswithout capitalizing on the opportunity to bothreduce emissions and stimulate the economythrough green innovation:
If meeting the challenge of reducingemissions means primarily painful lifestyleand industry changes, there is a greaterlikelihood of resistance to change.
If meeting the challenge of reducingemissions means changes that also producegrowing payoffs in terms of energy savings,economic growth, and job creation, thereis a greater likelihood of persistence—thekind of sustained change over many yearsrequired to achieve or exceed AB 32 targets.
If California is going to meet the challenge ofAB 32, it will need to grow and sustain thisnew wave of green innovation, extending andbuilding on earlier innovations. Tackling thechallenge of global warming will requirereductions in the absolute amount of carbonemissions by a variety of means. What couldthis new wave look like?
California would need to rapidly increaseits pace of change—from breakthroughsin energy efficiency to adoption of cleanerenergy alternatives.
California has a history of well-documentedbreakthroughs—in information technology,biotechnology, and other fields. This historyincludes breakthroughs in energy efficiencyand recycling—through the adoption of newgreen practices. In fact, breakthroughs can beeither leaps in new technology or in the useof existing technology. Both will likely beneeded for California to rapidly increase itspace of change.
50

To meet the requirements of AB 32, we mustreduce our CO2 emissions to 1990 levels by2020; however, if we continue emitting currentlevels, our emissions levels in 2020 will be thehighest they have ever been in history. Manyof the policy and behavioral innovations trackedin this index will contribute to reducingemissions from the “business-as-usual” level tothe AB 32 target. Although there have beensome dips in emission levels, none of the major
emitters has consistently reduced emissions.Despite gains in energy efficiency and emissionsreductions, there must be much greater energyefficiency and use of clean energy alternativesduring the next wave of green innovation. Thetable below provides the estimates by theClimate Action Team of the potential impactsof different strategies that if fully implementedwould help meet this challenge.
Strategies Underway in California that Reduce Greenhouse Gas Emissions
Estimated GHG Savings(Million Tons CO2 Equivalent)
Lead Agency Strategy 2010 2020
Air Resources BoardGHG Vehicle Standards (AB 1493) 1 30
Diesel Anti-idling 1 2
Energy Commission/ Accelerated Renewable Portfolio Standard
Public Utilities Commission (33% by 2020) 5 11
Million Solar Roofs (California Solar Initiative) 0.4 3
Integrated Waste Mgmt. Board Zero Waste/High Recycling Programs 7 10
Full cost-effective natural gas efficiency improvements 1 6
Energy CommissionAppliance Efficiency Standards* 3 5
Fuel-efficient Replacement Tires & Inflation Programs 3 3
Business Trans. & Housing Reduced Venting and Leaks in Oil & Gas Systems 1 1
State and Consumer Services Green Buildings Initiatives not yet estimated
Air Resources Board/CalEPA Hydrogen Vehicles not yet estimated
TOTAL POTENTIAL EMISSIONS REDUCTIONS 23** 70
The table below lists greenhouse gas (GHG) emission reduction strategies that are already underway in California. Thesestrategies, if fully implemented, would significantly reduce greenhouse gas emissions in the state. The strategies listed hereare considered “high-confidence” strategies and were evaluated by the California Climate Action Team to determinereasonable GHG targets. They will br ing California halfway towards meeting the 2010 target.
* Included in the baseline are the 2004 energy efficiency goals, which will result in an estimated reduction of 4 million tons of GHG emissions in 2010 and 13 million tons of GHG emissions in 2020.** Rounding may cause this number to be slightly different than the sum of the numbers for each strategy.
It should be noted that other strategies, such as the use of biofuels and landfill methane capture and use, are still beingevaluated and will be vetted internally by the agencies represented on the Climate Action Team. The Team will ultimatelybe responsible for determining which other strategies are most likely to be successful in the state as well as consideringany additional strategies not yet evaluated.
Source: California Climate Action Team, Fact Sheet: Greenhouse Gas Reduction Strategies, 2005-06
51

CO
2 E
quiv
alen
t G/K
M–c
onve
rted
to N
ED
C te
st c
ycle
100
280
260
2002
240
220
200
120
2004 2006 2008 2010 2012 2014 2016 2018
180
160
140
United States
California
Canada [1]
South Korea
Australia
China
Europe
Japan
United States
California
South Korea
Canada [1]
Australia
China
Europe
Japan
the next wave4Transportation is the largest source of GHGemissions, making up 41% of gross emissions in2004 (Chart 12). Current standards regulatingthe pollution emitted by vehicles in the U.S.are weaker than in other countries includingChina. More stringent fuel economy standardsand emissions standards in the U.S. could helpto drive the next wave of green innovation.
Using Vehicle Performance Standards to Reduce Greenhouse Gas Emissions
Automobile performance standards have proven to be one of the most effective tools in controlling oil demand andgreenhouse gas emissions from the transportation sector in many regions and countries around the world. Chart 45illustrates the relative stringency and implementation schedules of GHG emissions standards across the globe. (In orderto make comparisons, standards across countries have been normalized by converting to units of grams of carbon dioxideequivalent per kilometer traveled on the New European Drive Cycle (NEDC).) The emissions performance of the U.S.cars and light trucks—both historically and as projected based on current policies—lags behind most other nations.
While the U.S. relies on Corporate Average Fuel Economy (CAFE) standards, requiring manufacturers to meet specificfleet average fuel economy levels for light-duty passenger vehicles sold in the U.S., California has passed fleet average GHGemission standards for new vehicles sold in the State. While it has not been implemented due to litigation, passage ofthe Pavley Bill (AB 1493) makes California the first state to regulate motor vehicle GHG emissions. Twelve other stateshave adopted California’s regulation, and another three are in the process of adopting the regulation.
Note: Solid lines denote actual performance or projected performance due to adopted regulations; dotted lines denote proposed standards; values normalized to NEDC test cycle in grams of CO2-equivalent per km.[1] for Canada, the program includes in-use vehicles. The resulting uncertainty on new-vehicle fuel economy was not quantified.Source: Feng An, Deborah Gordon, Hui He, Drew Kodjak, and Daniel Rutherford. 2007. “Passenger Vehicle Greenhouse Gas and Fuel Economy Standards: A Global Update”
The International Council on Clean Transportation (July 2007).
45: Actual and Projected GHG Emissions for New Passenger Vehicles by CountryRelative to 2002
52

100
= 2
004
valu
esE
mis
sion
s/G
DP
2004
140
130
120
110
100
90
80
70
60
2005 2006 2007 2010 2015 2020
2004
0.40
0.30
0.25
0.20
0.15
0.10
0.05
02005 2006 2007 2010 2015 2020
0.35
GDP per Capita
GHG* per Capita
CarbonFree
Economy=
CALIFORNIA IN 2020California’s population is expected to grow by17% between 2007 and 2020, adding roughly6.5 million residents according to CaliforniaDepartment of Finance population projections.At an annual rate of 2.9%, California’s economyis projected to grow by 45% over the same period.
If California achieves the goals laid out inAB 32, the State’s economy will accelerate itsseparation of economic growth from GHGemissions. In terms of the carbon intensityof its economy, the State will achieve asignificant reduction of 46% in its ratio ofemissions per GDP.
46: California GDP & GHG in 2020Relative to 2004
47: The 2020 Carbon EconomyGHG* Emissions Relative to Gross Domestic Product
* Gross GHG emissions include electricity imports. Predictions based on California Energy Commission’s 2003 Integrated Energy Policy Report (2003 IEPR)Source: California Energy Commission; Moody’s Economy.com
* Gross GHG emissions include electricity imports. Predictions based on California Energy Commission’s 2003 Integrated Energy Policy Report (2003 IEPR)Source: California Energy Commission; Department of Finance; Moody’s Economy.com
53

Cos
t of P
V (2
002$
/W)
Cos
t of E
lect
ricity
Pro
duce
d ($
/kW
h)
Cumulative PV Electricity Production (GWh)
Figure 1: Scenarios comparing cost model,experience curves, and $1.00/W
Figure 2: U.S. electricity prices and leveledcost of electricity produced
102
101
100
10-1
10-2
1980 2000 2020 2040 2060
0.010.0001
$1,000.00
100.00
10.00
1.00
0.10
0.001 0.01 0.1 1.0 10 100 1000 10,000 100,000
200320001990
1980
1970
19601957
Cost of PV Electricity
U.S. Average Retail Electricity Prices
Slow ExpCurveCost Model ($1.00)
Fast ExpCurve$1.00 target
the next wave4California now depends on renewable energysources for about 11% of its total energy use.Growth in renewable energy has kept pace withthe increase in overall energy generation.Keeping pace, however, will not be enough tosubstantially impact greenhouse gas emissions.
The next wave of green innovation will haveto usher in a much higher share of clean energyalternatives. Solar energy could play a majorrole if innovation brings down the cost curveto “China prices” (see box below).
SOLAR COST CURVE: MOVING TOWARD THE CHINA PRICE OF ENERGY?
How is clean energy going to get down to the“China price” of energy? As Curtis Carlson,CEO of SRI and others suggest, this is essentialto both creating a world market for clean energyand dramatically reducing global warming.27
The “China price” is the price that is widelyaffordable in China, such as the price for coal-fired electricity today in China. The answermay be a Moore’s Law for energy (see page 8on Moore’s Law).
One of the challenges to the adoption of solarenergy has been its relative costs. However,the cost of photovoltaics (PV) has decreased bya factor of nearly 100 since the 1950s. As aresult of declining cost and favorable publicpolicies, markets have been expanding rapidly,growing at 40% per year.
Can we expect future dramatic decreases incost in PV or breakthrough solar technologiesin the future? One way to answer this questionis to examine potential future cost curves forPV. The cost curve is a function of experienceof firms’ increased capacity to serve growingmarkets as well as technology innovation.
Figure 1 portrays lines representing potentialsolar cost scenarios: the slow experience curveis based on current silicon technology and afast experience curve assumes moving beyondsilicon to new technologies such as thin-films.A $1.00/W target price would not achieve theChina price of energy. As depicted in Figure 2,while the cost curve will continue to bring thecost of PV electricity down to the U.S. averageretail price, there is still a significant gap.
Thus reaching the “China price of energy” willrequire significant technology innovation.However, as a result of venture funding, at leastfive new companies are now gearing upproduction lines in Silicon Valley to make ultra-
cheap solar cells from new materials such ascopper indium gallium selenide (CIGS) insteadof more traditional silicon including Nanosolarin San Jose, Miasole in Santa Clara andSoloPower in Milpitas. Moving beyondtraditional technologies will be essential forpushing down the solar cost curve – and thatis why innovation is so important.
Source: Gregory Nemet, “Behind thelearning curve: Quantifying the sourcesof cost reductions in photovoltaics,”June 1, 2006.
54

Californians would need to work together,and with the U.S. Government,to grow and sustain the next waveof green innovation.
There is much that needs to happen to growand sustain the next wave of green innovationin California. If the past is a guide, stategovernment will clearly need to play a criticalrole through policy innovations that bothreduce greenhouse gas emissions and stimulatethe economy.
The next wave would also benefit from a muchgreater commitment from the federalgovernment to innovation in energy efficiencyand clean energy alternatives. This would meana reversal in the trends of diminishing federalR&D investment in clean energy, as well as theadvantage foreign inventors have over U.S.inventors in patents (see Charts 35 and 36).But, as the past has shown, green innovationalso requires more than government policy byitself. It will require changes in how businessesoperate, how residents use energy at home andon the road, and how the independent non-profit sector helps promote energy efficiencyand clean energy alternatives. In fact, a majorityof Californians believe that public, private, andindependent sectors—as well as the generalpublic—can do “a lot” about global warming.Most Californians believe all these parties canmake some contribution to addressing thechallenge.
California would need to play a dual rolein adopting and creating green innovationsthat reduce emissions and stimulate theeconomy—both statewide and globally.
California is increasingly well-positioned toplay a dual role—as a leader in both the adoptionand creation of new products that help reduceemissions globally while stimulating the State’seconomy. Because of the size of the State’spopulation, consumer market, and economy,California can set an example for the adoptionof new green products and practices and spurtheir worldwide application.
With its strong technology base, entrepreneurialculture, world-class research institutions, globalcompanies, and venture capital, California maymake an even bigger contribution by creatinginnovative green products and services for useworldwide. In this way, California can helpaddress the challenge of global warming insideand outside the State, while producing economicbenefits for Californians.
Based on recent trends, California is becominga leader in creating and implementingbreakthrough clean energy technologies thatreduce emissions, drive the State’s economy,and serve a multibillion dollar global clean techmarket. Californians widely believe that theState could play a central role in the future:90% agree that “California can be a leader innew technologies to improve efficiency andreduce global warming”. Two-thirds (66%)agree “strongly” with this statement.
Estimate of the Global Marketfor Clean Energy Technology
According to the California EnvironmentalProtection Agency, worldwide demand for newtechnologies developed to reduce globalwarming emissions will create a global marketpotential of more than $180 billion annually.28
SURVEY RESULTS:Californians Believe Many CanDo A lot To Reduce Global Warming
Can Do Can DoA lot Some
Major Corporations 64% 21%Gas and Electric Utility Companies 63% 25%General Public 57% 29%U.S. Government 56% 28%Clean Technology Companies 52% 33%State and Local Government 49% 32%Non-Profits Dedicated to Reducing 44% 36%Global WarmingFarmers and Agricultural Companies 41% 37%
55

Number of Members0
*GovernmentElectric Power
Professional & Financial ServicesOil/Gas
Municipal UtilityManufacturing
NGOEducation
Food, Beverage, DairyWater
Solid WasteHealthcare
Metals & MiningInvestor-Owned Utiliy
Transportation ServicesTelecom
TechnologyRetailMedia
ForestryContruction
BiofuelsPrinting
PharmaceuticalsCogen Poower
ChemicalsAerospace
5 10 15 20 25 30 35 40
the next wave4California’s independent sector has an importantrole to play in promoting and supporting the nextwave of green innovation.
Californians tend to trust information from theindependent sector, as well as authorities such as researchscientists and medical professionals. Large percentagestrust both environmental protection groups as well asnon-profits that promote emission reductions in waysthat benefit the economy.
SURVEY RESULTS:Californians Trust the Independent SectorWhen it Comes to Global Warming,Energy Conservation, and the Environment
Total Trust TrustGroup Trust A lot Somewhat
Research Scientists 80% 45% 35%
Environmental 76% 40% 36%Protection Groups
Non-profits 76% 37% 39%promoting emissionreductions in waysthat benefitthe economy
Medical professionals 66% 31% 35%
California businesses will need to embrace innovationsthat reduce emissions, improve efficiency, and grow jobs.
The increasing number of businesses joining the CaliforniaClimate Action Registry illustrates that the businesscommitment is growing over time. Reflecting on their ownemployers, working Californians believe that much more canbe done—and they value companies and products that helpsave energy and reduce emissions.
SURVEY RESULTS:Californians Recognize and Value the ContributionBusiness Can Make to Reducing Emissions
73% of working Californians think their employer cantake action to save energy, reduce greenhouse gas emissions,and help the environment. 40% think their employer cando “a lot” in these areas.
61% of working Californians say that given job optionswith comparable pay and work responsibilities, a prospectiveemployer’s policies toward energy conservation andenvironmental protection would influence their decision totake the job. In fact, 26% say it would matter “a great deal”.
59% of Californians are “more likely” to buy productswith a carbon footprint documenting the amount of greenhousegases produced to create the product than comparable productswithout this information.
48: California Climate ActionRegistry Membership by IndustryTotal members as of August 2007
*Note: Government includes city, county, regional, state and federal entitiesSource: California Climate Action Registry
56

SURVEY RESULTS:Californians are Becoming Active on the Issueof Global Warming and Energy Conservation—and Expect to Become More Engaged in the Future
What Californians are saying:38% have sought out information on the internetabout global warming (GW) and energy conservation(EC), with another 11% likely to do so in the comingyear (and an additional 33% considering it for the future).12% have written a letter to the editor or posted acomment on the internet regarding GW/EC, with another12% likely to do so in the next year (and an additional24% considering it for the future).
21% have donated money to organizations concernedwith GW and EC, with another 10% likely to do so inthe coming year (and an additional 28% considering itfor the future).
16% are investing in environmentally or sociallyresponsible funds or companies, with another 10% likelyto do so in the coming year (and an additional 32%considering it for the future).
14% have contacted government officials about GWand EC, with another 13% likely to do so in the comingyear (and an additional 25% considering it for the future).
13% have attended meetings on GW and EC intheir community, with another 15% likely to do so (andan additional 28% considering it for the future).
11% have volunteered with organizations concernedwith GW/EC, with another 11% likely to do so in thecoming year (and an additional 33% considering it forthe future).
Californians themselves are becoming active on theissue of global warming and energy conservation—and expect to become more engaged in the future.
About four in ten Californians have sought information onthe internet about global warming and energy conservation.Another four in ten are likely to do so in the coming year orare considering it in the future. Whether it be donations,investing, contacting government officials, attending meetings,or volunteering with organizations involved with globalwarming and energy conservation, a large percentage ofCalifornians say they are involved or planning to get involvedin the future. Perhaps more than anything else, the growingcommitment of Californians to address global warming inways that reduce emissions and grow the economy is critical—because this support encourages innovation in both governmentand business.
57

1. This section is based on extensive research on innovation that examines the compound economic benefits of an innovative economy as well asthe key characteristics of an economy that creates new ideas and products and can commercialize them. James Utterbach, Mastering the Dynamicsof Innovation, Harvard Business School Press 1994, William Baumol, The Free Market Innovation Machine Princeton University Press 2002. Chong Moon-Lee, William F. Miller, Margerite Gong Hancock and Henry S. Rowen, ed. The Silicon Valley Edge: A Habitat for Innovation andEntrepreneurship Stanford Business School Books 2002: Paul Romer. "Endogenous Technological Change," Journal of Political Economy, Vol.98, No. 5, "Part ." (Oct. 1990), Ian Morrison, The Second Curve: Managing the Velocity of Change Ballantine Books 1996.
2. Testimony of Dr. Daniel M. Kammen before the August 11, 2005 Select Committee on Air & Water Quality Climate Hearing
3. Porter, M. and C. van der Linde. 1995. “Green & Competive.” On Competition. Harvard Business Review Book. page 352.
4. Farrell, D., S. Nyquist, M. Rogers. 2007. “Making the most of the world’s energy resources.”McKinsey Quarterly McKinsey & Company (Number1, 2007), page 29.
5. James McCarthy. 2007. “California’s Waiver Request to Control Greenhouse Gases under the Clean Air Act.” CRS Report for Congress.Congressional Research Service. (August 20, 2007).
6. Utility revenues have historically been tied to sales volumes, so companies were rewarded for selling more power and penalized for selling less.Therefore, there was a strong disincentive for utilities to encourage energy efficiency and conservation. The implementation of “decoupling”removes this barrier by assuring utilities (investor-owned) a fixed amount of revenues regardless of sales volumes. “The result of this simple, butprofound, change has been that utilities have been free to aggressively help consumers reduce energy usage without doing financial harm to theirbusiness. As a direct result of decoupling and the programs it made possible, California’s per capita energy usage has remained flat over the past30 years, compared with an increase of 50 percent for the rest of the country.” Pacific Gas and Electric Company. 2006. “Global Climate Change: Risks, Challenges, Opportunities and a Call to Action.” Page 5.
7. This data represents carbon dioxide emissions from fossil fuel combustion which make up over 70% of total greenhouse gas emissions. Thecomparison of California with other states in Chart 1is based on federal emissions data from the U.S. Energy Information Agency (EIA). TheEIA uses a slightly different methodology for calculating GHG emissions than the California Energy Commission (CEC). Unless otherwise noted,reported GHG emissions for California are based on CEC data.
8. Organization for Economic Cooperation and Development (OECD) Environment Programme. 2002. “Indicators to measure decoupling ofenvironmental pressure from economic growth.” SG/SD(2002)/FINAL (May 16, 2002).
9.Total Revenue
from Electricity Sales GDP Sales as Fraction(Million Dollars, $2006) (Million Dollars, $2006) of GDP
California $30,521 $1,705,861 1.79%
Texas $31,550 $973,797 3.24%
Difference 1.45%
Difference in Dollars $1,705,861 * 1.45% = $24.7 billion
Endnotes
58

10. Howard Chong & Michael Hanemann. 2007. “Executive Summary, Energy Use Analysis.” Unpublished study conducted on behalf of Next 10. Departmentof Agricultural and Resource Economics, University of California at Berkeley, (October 8, 2007).
11. California Energy Commission. 2005. Integrated Energy Policy Report. CEC-100-2005-007. Page 70.
12. Susan Brown. 2005. Global Climate Change. In Support of the 2005 Integrated Energy Policy Report. Staff Paper. California Energy Commission.Page 14. “The cumulative targets set for program years 2004-2013 are 26,508 Gigawatt-hours (Gwh), 6,892 Megawatts (MW), and 290 million therms[for natural gas].”
13. Ibid, page 13.
14. California Energy Commission, July 2005, Implementing California’s Loading Order for Electricity Resources, CEC-400-2005-043.
15. CBS/New York Times Survey, April 2007
16. ABC News/Washington Post/Stanford University Poll, April 2007
17. Massachusetts Institute of Technology Poll, March 2007
18. Ibid
19. CBS/New York Times Survey, April 2007
20. California Energy Commission. 2005. California’s Water-Energy Relationship, Final Staff Report. Publication CEC-700-2005-011-SF (November 2005),Page 8.
21.California Electricity Use, 2001
Electricity (GWh)
Total Water Pumping Electricity Use* 5,500
Total Water Related Electricity Use** 48,012
Total Electricity Use** 250,494
* See Chart 26, for year 2001.** California’s Water-Energy Relationship, 2005
22. California Energy Commission. 2005.California’s Water-Energy Relationship, Final Staff Report. Publication CEC-700-2005-011-SF (November 2005), Page 9.
23. The displayed variation from year to year in mini hydro power generation is due directly to the variability in snow pack.
24. These programs are funded through revenues collected from investor-owned utility rate payers. In 2008, publicly-owned utilities will adopt a similarprogram.
25. The State contributed $30 million to the Helios Project at the Lawrence Livermore National Lab and $40 million to the Energy Biosciences Institute atU.C. Berkeley.
26. Energy technology in this instance consists primarily of investment in solar, wind, fuel cells, engines, and alternative fuels.
27. “The Power of Green,” New York Times, April 15, 2007.
28. Office of the Governor. 2006. “Gov. Schwarzenegger, California Clean Energy Fund Announce $1 Million Grant to Build Nation's First Energy EfficiencyCenter.” Press Release 4/12/2006.http://www.governor.ca.gov/state/govsite/gov_htmldisplay.jsp?sCatTitle=Press+Release&sFilePath=/govsite/press_release/2006_04/20060412_GAAS22606_EnergyEfficiencyCenter.html
59

California Factbox
California’s PopulationData are from the California Department of Finance, “Table 1: E-4 Population Estimates for Counties and State, 2001-2007 with 2000 DRU Benchmark”.
California’s EconomyGross Domestic Product data come from “Table 5, Current-Dollar GDP by State, 2003-2006” by the Bureau of EconomicAnalysis, U.S. Department of Commerce. The California Department of Finance’s, “Table 1: E-4 Population Estimatesfor Counties and State, 2001-2007 with 2000 DRU Benchmark” were also used to derive per capita GDP.
California’s Greenhouse Gas EmissionsData are provided by the California Energy Commission (CEC), “Table F-2 -- California Greenhouse Gas Emissions(Revised) (Energy Commission's 1990 to 2004 GHG Inventory & 2005 IEPR for Projections)” This dataset is a revisionto the CEC’s December 2006 "Inventory of California Greenhouse Gas Emissions and Sinks" Report, and were providedby the CEC in September, 2007. Total Baseline GHG emissions include fossil fuel CO2, with electric imports andinternational fuels (carbon dioxide only) and non-carbon GHG emissions (in CO2 equivalents). Non-carbon GHGemissions are made up of: Agriculture (CH4 and N2O), Soils and Forests Carbon Sinks, ODS substitutes, Semi-conductormanufacture (PFCs), Electric Utilities (SF6), Cement, Other Industrial Processes, Solid Waste Management, Landfill Gas,and Wastewater, Methane from oil and gas systems, Methane and N20 from Fossil Fuel Combustion. The CaliforniaDepartment of Finance’s, “Table 1: E-4 Population Estimates for Counties and State, 2001-2007 with 2000 DRUBenchmark” were also used to derive per capita GHG emissions.
The First Wave of Green Innovation
Emissions in California and Other StatesEmissions data are from the U.S. Department of Energy, Energy Information Administration,"CO2 Emissions from FossilFuel Combustion Million Metric Tons CO2 (MMTCO2)." Emission estimates are based on energy consumption datafrom EIA's State Energy Consumption, Price, and Expenditure Estimates (SEDS) released June 1, 2007. Population estimatesfrom the U.S. Census Bureau, Population Distribution and Population Estimates Branches were used to compute per capitaanalysis.
Global Fossil Fuel CombustionFor U.S. and other countries, data for GHG emissions from the combustion of fossil fuels, gross domestic product (GDP),and population are from U.S. Department of Energy, Energy Information Administration, International Energy Annual2004. For California, GDP data come from “Table 5, Current-Dollar GDP by State, 2003-2006” by the Bureau ofEconomic Analysis, U.S. Department of Commerce. Population estimates are from California Department of Finance,“Table 1: E-4 Population Estimates for Counties and State, 2001-2007 with 2000 DRU Benchmark”. Carbon emissionsdata are provided by the California Energy Commission (CEC), “Table F-2 -- California Greenhouse Gas Emissions(Revised) (Energy Commission's 1990 to 2004 GHG Inventory & 2005 IEPR for Projections)” This dataset is a revisionto the CEC’s December 2006 "Inventory of California Greenhouse Gas Emissions and Sinks" Report, and were providedby the CEC in September, 2007. Total Baseline GHG emissions include fossil fuel CO2, with electric imports andinternational fuels (carbon dioxide only) and non-carbon GHG emissions (in CO2 equivalents). Non-carbon GHGemissions are made up of: Agriculture (CH4 and N2O), Soils and Forests Carbon Sinks, ODS substitutes, Semi-conductormanufacture (PFCs), Electric Utilities (SF6), Cement, Other Industrial Processes, Solid Waste Management, Landfill Gas,and Wastewater, Methane from oil and gas systems, Methane and N20 from Fossil Fuel Combustion.
APPENDIX
60

Emissions and Gross Domestic Product & The Carbon EconomyGross Domestic Product data come from “Table 5, Current-Dollar GDP by State, 2003-2006” by the Bureau of EconomicAnalysis, U.S. Department of Commerce. Carbon emissions data are provided by the California Energy Commission(CEC), “Table F-2 -- California Greenhouse Gas Emissions (Revised) (Energy Commission's 1990 to 2004 GHG Inventory& 2005 IEPR for Projections)” This dataset is a revision to the CEC’s December 2006 "Inventory of California GreenhouseGas Emissions and Sinks" Report, and were provided by the CEC in September, 2007. Total Baseline GHG emissionsinclude fossil fuel CO2, with electric imports and international fuels (carbon dioxide only) and non-carbon GHG emissions(in CO2 equivalents). Non-carbon GHG emissions are made up of: Agriculture (CH4 and N2O), Soils and Forests CarbonSinks, ODS substitutes, Semi-conductor manufacture (PFCs), Electric Utilities (SF6), Cement, Other Industrial Processes,Solid Waste Management, Landfill Gas, and Wastewater, Methane from oil and gas systems, Methane and N20 from FossilFuel Combustion. Population estimates are from California Department of Finance, “Table 1: E-4 Population Estimatesfor Counties and State, 2001-2007 with 2000 DRU Benchmark”.
Total GHG EmissionsGross GHG emissions (total baseline) data are provided by the California Energy Commission (CEC), “Table F-2 --California Greenhouse Gas Emissions (Revised) (Energy Commission's 1990 to 2004 GHG Inventory & 2005 IEPR forProjections)” This dataset is a revision to the CEC’s December 2006 "Inventory of California Greenhouse Gas Emissionsand Sinks" Report, and were provided by the CEC in September, 2007. Total Baseline GHG emissions include fossil fuelCO2, with electric imports and international fuels (carbon dioxide only) and non-carbon GHG emissions (in CO2equivalents). Non-carbon GHG emissions are made up of: Agriculture (CH4 and N2O), Soils and Forests Carbon Sinks,ODS substitutes, Semi-conductor manufacture (PFCs), Electric Utilities (SF6), Cement, Other Industrial Processes, SolidWaste Management, Landfill Gas, and Wastewater, Methane from oil and gas systems, Methane and N20 from Fossil FuelCombustion.
Energy Consumption Since 1970Energy data are from the U.S. Department of Energy, Energy Information Administration. Population estimates from theU.S. Census Bureau, Population Distribution and Population Estimates Branches were used to compute per capita analysis.Total energy consumption includes all of the following sources: petroleum, natural gas, electricity retail sales, nuclear, coaland coal coke, wood, waste, ethanol, hydroelectric, geothermal, solar and wind energy.
Total Revenue from Electricity Sales as Fraction of GDPElectricity sales revenue data comes from the U.S. Department of Energy, Energy Information Administration. GrossDomestic Product data come from “Table 5, Current-Dollar GDP by State, 2003-2006” by the Bureau of EconomicAnalysis, U.S. Department of Commerce.
Average Monthly Residential Electricity BillsThe data are from the U.S. Department of Energy, Energy Information Administration, Survey Form EIA-861, "AnnualElectric Power Industry Report." Data for all years are final.
Average Monthly Residential Natural Gas BillsResidential Price, Consumers, and Consumption data are from the U.S. Department of Energy, Energy InformationAdministration.
Annual Energy Savings from Efficiency Programs and StandardsCalifornia Energy Commission, Implementing California’s Loading Order for Electricity Resources, Staff Report,Publication CEC-400-2005-043, July 2005, Figure E-1, p. E-5.
Energy Savings from Utility Efficiency ProgramsData come from the Pacific Gas and Electric Company, Southern California Edison, and San Diego Gas & Electric, EnergyEfficiency Annual Reports, May 1999-2005, filed at the California Public Utilities Commission, and were compiled bythe Natural Resources Defense Council.
APPENDIX
61

Tracking Signs of the Next Wave of Green Innovation
GHG Emissions by Major SourceData are from the California Energy Commission., Inventory of California Greenhouse Gas Emissions and Sinks: 1990-2004, Staff Final Report. CEC-600-2006-013-SF, December 2006.
Electricity Consumption by SectorData are from the California Energy Commission, “2005 California Electricity Consumption by Sector - For residential,commercial, industrial and agricultural.”
Share of Compact Fluorescent Lamps Purchased as a Percent of All Medium Screw Based Lamps Purchased&Market Share of Energy Star AppliancesData are from the California Measurement Advisory Council (CALMAC).
Commercial Electricity ConsumptionData are from the California Energy Commission, “California Energy Demand 2003-2013 Forecast.” A detailed list ofthe types of buildings in the “All Other Buildings” category is available from the California Energy Commission, CaliforniaCommercial End Use Survey: Appendix A-J, March 2006.
Petroleum Consumption in California since 1970Data are from the U.S. Department of Energy, Energy Information Administration, "State Energy Consumption, Price,and Expenditure Estimates" Total consumption of all petroleum products is the sum of individual petroleum products,which include: aviation gasoline, distillate fuel, jet fuel (kerosene type), jet fuel (naphtha type), kerosene, liquefied petroleumgases, lubricants, motor gasoline, residential fuel, other petroleum products. Other petroleum products are made up ofcrude oil (including lease condensate), miscellaneous petroleum products, natural gasoline (including isopentane), petroleumfeedstocks (naphtha less than 401o F), petroleum feedstocks, (other oils equal to or greater than 401o F), petroleumfeedstocks (still gas), plant condensate, pentanes plus, special naphtha. Population estimates from the U.S. Census Bureau,Population Distr ibution and Population Estimates Branches were used to compute per capita analysis.
Gasoline Sales in California since 2000Data are from the California State Board of Equalization, "Taxable Gasoline Gallons 10 Year Report.” Population estimatesfrom the U.S. Census Bureau, Population Distribution and Population Estimates Branches were used to compute per capitaanalysis.
California Vehicle Fleet and EmissionsData is for California’s entire vehicle fleet and were provided by the California Air Resources Board, EMFAC 2007.
Vehicle-Miles Traveled and Gas PricesVehicle-Miles Traveled Data is from U.S. Department of Transportation, Federal Highway Administration, Highway Statistics,annual editions, Figure 5-1: Highway Vehicle-Miles Traveled, United States and California. “Table 1: E-4 PopulationEstimates for Counties and State, 2001-2007 with 2000 DRU Benchmark” were also used to derive per capita VMT inCalifornia. Data on gas prices came from the Energy Information Administration, Petroleum Marketing Annual. Populationestimates from the U.S. Census Bureau, Population Distribution and Population Estimates Branches were used to computeper capita VMT analysis for the rest of the U.S.
Alternative Means of CommuteData are from the U.S Census Bureau, American Community Survey. Alternative means of commute is made up of thosewho Carpooled (Car, truck, or van), Public transportation (excluding taxicab), Walked, used Taxicab, motorcycle, bicycle,or other means:, and Worked at home.
APPENDIX
62

Public Transit UsePublic Transit use is reported by the California State Controller, Transit Operators and Non-Transit Claimants AnnualReport, 1997-2005.
Water ConsumptionData are from the California Department of Water Resources, Water Use Database 2006.
Water PumpingData were provided by the California Energy Commission, and are for surface and groundwater pumping.
Renewable Energy Generation in CaliforniaData are from the California Energy Commission, "Net System Power Repor ts" 2002-2006.
California Renewable Portfolio StandardCalifornia Public Utilities Commission, July 2007 Report to the Legislature
Grid-Connected Solar Photovoltaics Installed in CaliforniaData are from the California Energy Commission, “Amount (MW) of Grid-Connected Solar Photovoltaics (PV) inCalifornia, 1981 to Present,” updated on April 18, 2007.
Alternative Fuel VehiclesStatistics are from the California Energy Commission, compiled using vehicle registration data from the CaliforniaDepartment of Motor Vehicle. Alternative fuel vehicles include all hybrids and electric vehicles as well as vehicles runningon natural gas. Diesel engine vehicles are not included in the analysis, because there is no differentiation given betweenvehicles running on carbon and those running on biological diesel fuels. Does not include vehicles running on all alcoholbased and gaseous noncarbon fuels.
Federal R&D Funding for Renewable Energy in CAData are from the RAND Database for Research and Development in the U.S. (RaDiUS), and were compiled using searchqueries of “renewable energy” and “alternative energy.”
Green Technology Patents1790 Analytics, Patent Search by Technology (solar & wind energy generation, energy storage, fuel cells, hybrid systems);U.S. Patents & Trade Office.
Venture Capital Investment in Clean TechnologyData provided by Nth Power Venture Capital Energy Technology Fund.
California Venture Capital Investment in Clean TechnologyData provided by Cleantech Network, LLC. For this analysis, venture capital is defined as disclosed cleantech investmentdeal totals.
Investment in Clean Technology by California Pension FundsInformation was provided through email correspondence with the CalPERS Office of Public Affairs.
Green Jobs and Establishments in CaliforniaUsing a set of companies identified as having primary activities that fall roughly within the definition of cleantech usedby the Cleantech Network described earlier, establishment and job growth since 1990 were tracked using the NationalEstablishments Time-Series database based on Dun & Bradstreet establishment data. This sample offers a conservativeestimate and is by no means a comprehensive accounting of the industry in California.
APPENDIX
63

The Challenge & Prospects for the Future
History of California Emissions and Future AB 32 TargetData are provided by the California Energy Commission (CEC), “Table F-2 -- California Greenhouse Gas Emissions(Revised) (Energy Commission's 1990 to 2004 GHG Inventory & 2005 IEPR for Projections)” This dataset is a revisionto the CEC’s December 2006 "Inventory of California Greenhouse Gas Emissions and Sinks" Report, and were providedby the CEC in September, 2007. Total Baseline GHG emissions include fossil fuel CO2, with electric imports andinternational fuels (carbon dioxide only) and non-carbon ghg emissions (in CO2 equivalents). Non-carbon GHG emissionsare made up of: Agriculture (CH4 and N2O), Soils and Forests Carbon Sinks, ODS substitutes, Semi-conductor manufacture(PFCs), Electric Utilities (SF6), Cement, Other Industrial Processes, Solid Waste Management, Landfill Gas, and Wastewater,Methane from oil and gas systems, Methane and N20 from Fossil Fuel Combustion.
California Climate Action Registry MembershipData were provided by the California Climate Action Registry, and include California Climate Action Registry membersas of 8/13/2007.
2007 California Green Innovation Index Survey ResultsAll survey results, unless otherwise noted, are from the 2007 Field/Next 10 Global Warming Survey of Californians.
Field Research Corporation (Field), a San Francisco-based independent public opinion research organization, was responsiblefor overseeing all phases of the research effort. The survey was developed in partnership with Collaborative Economics,a strategic consulting group based in Mountain View, California.
The findings in this report are based on a random sample survey of 1,003 California adults. All interviewing was conductedby telephone in English and Spanish from a central location telephone interviewing facility during the period of August10 – 28, 2007. In order to cover a broad range of issues and still minimize possible respondent fatigue, the overall samplewas divided into two sub-samples, Forms A and B on several questions. Households in the survey were sampled using arandom digit dial methodology, which randomly selects operating landline telephone exchanges within all area codesserving California households in proportion to population. Within each exchange, telephone numbers were created byadding random digits within each selected telephone exchange. This method gives each phone listing an equal chanceof being selected and permits access to all landline telephone numbers statewide, both listed and unlisted.
APPENDIX
64

AcknowledgementsSpecial thanks to the following people and organizations that contributed data and expertise:
Josh Bushinsky, Pew Center on Climate ChangeMorry CaterHoward ChongSusan ClarkOrion FultonChristina HaroEric HeitzJason MarkLeon PanettaBeau PerryKristin ReedRoxanna SmithJustin SternbergAndy TaylorSteve TiellMary Jo Waits, Director of the Pew Center on StatesAdam Wiskind
1790 AnalyticsCalifornia Air Resources BoardCalifornia Board of EqualizationCalifornia Climate Action RegistryCalifornia Climate Action TeamCalifornia Department of FinanceCalifornia Department of Motor VehiclesCalifornia Department of Water ResourcesCalifornia Energy CommissionCalifornia Integrated Waste Management BoardCalifornia Measurement Advisory Council (CALMAC)California Public Utilities CommissionCalifornia State ControllerCalPERSCleantech Network, LLCNational Establishment Time-Series DatabaseNatural Resources Defense CouncilNth PowerThe RAND CorporationU.S. Census BureauU.S. Department of CommerceU.S. Department of Energy, Energy Information AdministrationU.S. Department of Transportation

Contact Us:
Next [email protected]
Collaborative [email protected]
Printed on 100% recycled paper, using soy-based inks©2007 Next 10