temporal and sex-specific variability in rhinoceros auklet...
TRANSCRIPT

Seediscussions,stats,andauthorprofilesforthispublicationat:https://www.researchgate.net/publication/273369208
Temporalandsex-specificvariabilityinRhinocerosAukletdietinthecentralCaliforniaCurrentsystem
ArticleinJournalofMarineSystems·September2014
DOI:10.1016/j.jmarsys.2014.08.020
CITATION
1
READS
18
4authors,including:
RyanDavidCarle
OikonosEcosystemKnowledge
2PUBLICATIONS1CITATION
SEEPROFILE
MichelleM.Hester
Oikonos-EcosystemKnowledge
12PUBLICATIONS278CITATIONS
SEEPROFILE
Allin-textreferencesunderlinedinbluearelinkedtopublicationsonResearchGate,
lettingyouaccessandreadthemimmediately.
Availablefrom:RyanDavidCarle
Retrievedon:21August2016

Journal of Marine Systems 146 (2015) 99–108
Contents lists available at ScienceDirect
Journal of Marine Systems
j ourna l homepage: www.e lsev ie r .com/ locate / jmarsys
Temporal and sex-specific variability in Rhinoceros Auklet diet in thecentral California Current system
Ryan D. Carle a,b,⁎, Jessie N. Beck b, David M. Calleri b, Michelle M. Hester b
a Moss Landing Marine Laboratories, 8272 Moss Landing Road, Moss Landing, CA, 95039, USAb Oikonos Ecosystem Knowledge, PO Box 2570, Santa Cruz, CA, 95063, USA
⁎ Corresponding author at: Oikonos Ecosystem KnowlCA, 95063, USA. Tel.: +1 760 709 1179.
E-mail addresses: [email protected] (R.D. Carle), [email protected] (D.M. Calleri), [email protected]
http://dx.doi.org/10.1016/j.jmarsys.2014.08.0200924-7963/© 2014 Elsevier B.V. All rights reserved.
a b s t r a c t
a r t i c l e i n f oArticle history:Received 1 August 2014Received in revised form 25 August 2014Accepted 29 August 2014Available online 4 September 2014
Keywords:Cerorhinca monocerataIsotopesForaging behaviorMarine birdsForage fishPacific saury
We used stable isotopes (δ15N and δ13C) and compared prey provided to chicks by each sex to evaluate seasonaland sex-specific diets inRhinoceros Auklets (Cerorhincamonocerata) in the central California Current systemdur-ing 2012–2013. Mixing models indicated northern anchovy (Engraulis mordax) were important prey for adultsduring fall/winter and juvenile rockfishes (Sebastes spp.) were important prey during incubation both years.Adult trophic level increased between incubation and chick-rearing periods in both years. During 2012, δ15Nand δ13C of chick-rearing males and females differed significantly; mixing models indicated that females atemore Pacific saury (Cololabis saira) and less market squid (Doryteuthis opalescens) than males. Likewise, femalesdelivered significantly more Pacific saury and less market squid to chicks than males during 2012. Chick growth(g d−1) and chick survival tofledgingwere significantly lower during 2012 than 2013, likely because chickswerefed lesser quality prey or fed less frequently in 2012. Lesser body mass of females during incubation in 2012indicated sex-specific diet differences may have been related to female energetic constraints. The observedvariability in Rhinoceros Auklet diet underscores the importance of managing multiple prey populations in thissystem so that generalist predators have sufficient resources through changing conditions.
© 2014 Elsevier B.V. All rights reserved.
1. Introduction
Many seabirds live in environmentswhere primary productivity andprey availability vary seasonally and inter-annually (e.g., polar ecosys-tems and eastern boundary upwelling currents). In these environments,interactions between seasonal energetic constraints and seasonal preyavailability influence the survival and reproductive success of seabirdsand other marine predators (Ainley et al., 1995; Frederiksen et al.,2006; Soto et al., 2004). Often, seabird life history constraints(e.g., molt, central place foraging during breeding) result in decreasedmobility and/or foraging range concurrent with increased energetic de-mands. Periods when changes in availability of prey coincide with life-history constraints therefore can be critical to fitness (Nelson, 1980).
During energetically demanding periods, seabirds may change theway they target and partition prey resources in response to competition(Gonzalez-Solis et al., 2000; Phillips et al., 2011) or seasonal behavioralroles (Paredes et al., 2008; Welcker et al., 2009). Additionally, sex-specific differences in chick provisioning (Quillfeldt et al., 2004;Wagner, 1997; Wiggins and Morris, 1987), foraging behavior (Lewiset al., 2002; Peck and Congdon, 2006), and diet (Bearhop et al., 2006;
edge, PO Box 2570, Santa Cruz,
@oikonos.org (J.N. Beck),g (M.M. Hester).
Phillips et al., 2011) have been observed during the breeding season.Diet or foraging differences between sexes often occur in species withpronounced sexual dimorphism (e.g., N10% difference in body mass;Kato et al., 2000; Lewis et al., 2005; Phillips et al., 2011) and may resultfromcompetitive exclusion of the smaller sex by the larger (Forero et al.,2005; Gonzalez-Solis et al., 2000). Alternatively, sex differences mayarise from morphological or physiological differences that allow onesex access to different foraging niches (e.g., larger bill size allowingone sex to handle larger prey (Koffijberg and Van Eerden, 1995) or larg-er body mass of one sex allowing greater dive depth and/or duration(Bearhop et al., 2006)). Sex-specific diets or behaviors among mono-morphic seabirds occur less frequently (Phillips et al., 2011), and maybe related to differing energetic constraints imposed by sex-specificroles during the breeding season, such as egg formation (Welckeret al., 2009) or nest defense (Fraser et al., 2002; Paredes et al., 2008).Studies reporting sex-specific differences in seabird diet and behaviorwere primarily conducted during the breeding season (Phillips et al.,2011). Thus, little is known about sex-specific patterns during non-breeding periods, although recent studies have found sexual segrega-tion in foraging ranges during the pre-breeding period in someProcellariforms (Chiu Werner et al., 2014; Hedd et al., 2014), likelydriven by differing nest defense and egg production roles. Furtherinvestigation of intra-annual variation in seabird diet is necessary forunderstanding whether sex-specific differences in seabird diets occuroutside of the breeding period.

100 R.D. Carle et al. / Journal of Marine Systems 146 (2015) 99–108
We studied seasonal and sex-specific diet and chick provisioning inRhinoceros Auklets (Cerorhinca monocerata; Family Alcidae), a burrow-nesting seabird in the puffin tribe (Gaston and Jones, 1998).Male Rhinoc-eros Auklets are larger than females in bodymass (i.e. in British Columbia,chick-rearing male body mass = 510 ± 49 SD g, n = 20; femalebody mass = 456 ± 45 SD g, n = 25; Vermeer, 1979) and billdepth (i.e. male bill depth = 17.1–20.1 mm, n = 100; female bill-depth = 15.2–17.7 mm, n = 100; Pyle, 2008). Rhinoceros Aukletsnest predominantly on islands and spend winter mainly over shelf wa-ters in the North Pacific Ocean from California to Japan (Gaston andJones, 1998). In central California, Rhinoceros Auklets lay and incubateeggs from April through May, and parents provision young from ~ Junethrough August, after which birds depart breeding colonies (Hester,1998). Females lay a single egg and both parents contribute to incubationand chick-rearing (Richardson, 1961). Parents carry whole fishes andcephalopods in their bills and deliver them to chicks (termed provision-ing; Richardson, 1961). Adult males and females may consume similarprey as they provide to chicks, but results of observational and trophicstudies have been mixed (Davoren and Burger, 1999; Hipfner et al.,2013; Ito et al., 2009), with no clear sex-specific differences in diet orchick provisioning patterns. Isotopic studies of blood, however, haveshown a consistent pattern of adult trophic level increase after chickshatch (Davies et al., 2009; Hipfner et al., 2013; Ito et al., 2009).
We used stable isotopes (δ15N and δ13C) to compare RhinocerosAuklet diet between seasons, sexes, and adult vs. chick age classes, aswell as prey species delivered to chicks by each sex, at AñoNuevo Island,CA, during 2 years with differing oceanographic conditions. Our goalswere to determine whether Rhinoceros Auklet diet varies according toseason or sex, and to investigate the relationship between potentialseasonal and sex-specific diet patterns.
2. Methods
2.1. Study site and field methods
Año Nuevo Island (ANI; 37° 06′ N, 122° 20′ W) is located 1 km offcentral California, within the central California Current upwellingsystem (Hayward and Venrick, 1998; Lynn and Simpson, 1987). In thissystem, primary productivity and prey abundance peak during springand summer in response to wind-forced upwelling (Chavez et al.,2002). ANI is adjacent to an upwelling center at Pt. Año Nuevo, wherecold, salty water is upwelled, typically during April through June, andadvected equatorward (Garcia-Reyes and Largier, 2012; Schwing et al.,1991). During the spring and summer breeding period, RhinocerosAuklets in the region typically occur from the mid-shelf to beyond theouter shelf-break, with concentrations around breeding colonies at theFarallon Islands and ANI (Santora et al., 2012).
2.2. Rhinoceros Auklet fall/winter, pre-breeding, and incubation isotopes
During the incubation period we collected blood, breast feathers,and facial plume feathers from Rhinoceros Auklet pairs nesting in artifi-cial nest sites (n = 42 in 2012, n = 34 in 2013). These samples consti-tuted all accessible nests and ~15% of the ANI breeding population ineach year (Hester et al., 2013). We banded all birds with a metal U.S.Fish and Wildlife Service leg band, determined mass of each bird(±5.0 g using a 600 g spring scale; Pesola, Baar, Switzerland), and sam-pled tissues within 7 to 14 days of egg lay (1–30 May 2012, 25 April–5June 2013). The expected isotopic turn-over rate in blood for equivalentsized birds is ~20 days (Carleton and Martinez del Rio, 2005; Hipfneret al., 2013); therefore, isotope values of blood sampled duringincubation represented adult diet in April or May (hereafter termedincubation). Blood (~1 ml per bird) was frozen at −20 °C for isotopeanalysis, and stored on FTA cards (Fast Technology for Analysis ofnucleic acids; Whatman, General Electric, Fairfield, Connecticut, USA)for DNA sex analysis.
We plucked 2 breast feathers that appeared freshly grown andclipped b1 cm of facial plume feathers from incubating birds. Featherδ15N and δ13C reflect diet at the time of their formation (Hobson andClark, 1992). Some breast feathers are grown during February andMarch, whereas facial plume feathers are grown slowly betweenOctober and January (Pyle, 2008). Therefore, isotope values offresh breast feathers represented adult diet during February–March (hereafter pre-breeding), whereas plume feathers repre-sented adult diet during the previous October–January (hereafterfall/winter).
To evaluate chick diet, we sampled chick whole blood (as describedfor adults; n=16 in 2012, n=9 in 2013) at 5 weeks of age (10–31 July2012, 27 June–25 July 2013), when blood isotope values should reflectonly the chick's post-hatching diet (Quillfeldt et al., 2008; Sears et al.,2009).
2.3. Reproductive metrics
To compare reproductive success between years, we checkedartificial nest sites and natural burrows weekly during the laying andchick-rearing periods. We monitored a randomly selected subsampleof natural burrows (n = 56 in 2012, n = 34 in 2013) using a burrowcamera on a flexible hose (Pukamanu 2.2, Abyssal Hawaii, Kailua, Ha-waii, USA). We weighed all chicks (±1.0 g or ± 5.0 g using a 300 or600 g spring scale; Pesola, Baar, Switzerland) in artificial nest sitesevery 7 days from hatch to fledging and quantified annual chick growth(g d−1 from the linear growth stage, days 14 to 35; methods describedin Thayer and Sydeman, 2007). We quantified annual hatching success(ratio of chicks hatched to first eggs laid), chick survival to fledging(ratio of chicks hatched to chicks fledged), and total productivity(ratio of chicks fledged to first eggs laid).
2.4. Rhinoceros Auklet chick diet, chick-rearing isotopes, and prey isotopes
To obtain isotope values for prey and quantify a sex-specific metricof chick provisioning, we caught provisioning adults in mist nets andcollected dropped prey items during June–July of each year. We deter-mined mass (±0.1 g using an electronic scale; Acculab EC-211, DataWeighing Systems, Elk Grove, Illinois, USA) and standard length (fishes)or mantle length (cephalopods; both ± 1.0 mm) of each prey item.We quantified chick meals according to bill-load — a statistically in-dependent unit representing one load of prey carried by one adult.We measured total bill-load mass (±0.1 g), and percent mass(%M), percent number (%N), and percent frequency of occurrence(%FO) for each prey species per bill-load. We analyzed stable iso-topes of prey that were at least 2%M of chick diet. In 2013, we also an-alyzed stable isotopes of prey reported from past studies (Vermeer,1980; Thayer and Sydeman, 2007; Ito et al., 2009) that were notpresent in chick diet samples (i.e. the euphausiid Thysanoessaspinifera, market squid [Doryteuthis opalescens], and Pacific sand lance[Ammodytes hexapterus]). Euphausiid and market squid samples werecollected in May 2013 near ANI during National Marine Fisheries Ser-vice (NMFS) rockfish trawl surveys (Wells et al., 2013), and one Pacificsand lance was opportunistically collected outside a Rhinoceros Aukletburrow in 2013.
We sampled tissues (whole blood, breast feathers, and plumefeathers, usingmethods described previously) from confirmed breedingadults caught inmist nets (n=26 in 2012, n=24 in 2013) to obtain anisotope signature during chick-rearing and to augment pre-breedingand fall/winter stable isotope sample sizes. In each year, we sampledsome individuals twice for bill-loads (n = 4 of 23 birds in 2012, n = 3of 22 birds in 2013). All repeat sampling events of individuals were atleast a week apart, and 6 of 7 had differing prey species or a differentmajority of prey species in each bill-load. Thus, we considered individu-al preference an unlikely confounding bias and included all bill-loads inan analysis of sex differences.

101R.D. Carle et al. / Journal of Marine Systems 146 (2015) 99–108
2.5. DNA sex analysis
We determined sex for all birds sampled (n= 90 adults, 24 chicks)using DNA extracted from blood or feathers (Fridolfsson and Ellegren,1999). Sex analysis was performed at the University of Hawaii Centerfor Conservation Research and Training, Manoa, Hawaii, USA. Duplicateblood samples were tested each year (n=6 in 2012, n=10 in 2013) toassess sex-identification accuracy. In both years, 100% of duplicatesmatched the originally identified sex.
2.6. Stable isotope analysis
We measured δ13C and δ15N of Rhinoceros Auklet and prey tissues.We dried whole blood and prey (~1 g white muscle) at 60 °C for 24 hand powdered them (Pinnegar and Pulanin, 1999). We soaked euphau-siids for 3 h in 10% HCL to remove calcified parts before lipid extraction(Jacob et al., 2005). We lipid extracted prey by agitating in a sonicatorfor 30 min in repeated solutions of 2:1 chloroform:methanol (Blighand Dyer, 1959; Logan et al., 2008; Ruiz-Cooley et al., 2011), and dryingunder a fume hood for 24 h. We did not lipid extract whole blood (seeBearhop et al., 2000; Cherel et al., 2005). We repeatedly rinsed feathersin 2:1 chloroform:methanol and dried themunder a fumehood for 24h.We homogenized plume feathers and the distal 2 cm of each breastfeather in a grinder.
Stable isotope analysis was performed at the Idaho State UniversityInterdisciplinary Laboratory for Elemental and Isotopic Analysis,Pocatello, Idaho, USA. Aliquots of 0.5 mg of tissues were placed in tincapsules. Samples were combusted and analyzed using Elemental Com-bustion System 4010 interfaced to a Delta V advantage mass spectrom-eter through the ConFlo IV system. Isotope ratios of δ13C are reported as‰ values relative to the Vienna PeeDee Belemnite scale, whereas δ15Nvalues are reported as ‰ values relative to air-N2. Based on replicatesof an in-house standard, instrument error (SD) was ± 0.17‰ for δ15Nand ± 0.06‰ for δ13C.
2.7. Stable isotope fractionation rates
We estimated year-specific rates for chick whole blood δ15N andδ13C fractionation by comparing observed isotope values of chickwhole blood with isotopes of prey observed during bill-load sampling(following Davies et al., 2009; Hipfner et al., 2014). We used featherfractionation literature values of +3.7‰ for δ15N and +1.0‰ for δ13C,from a study on Common Murres (Uria aalge; Becker et al., 2007b), aclose relative of Rhinoceros Auklets.
2.8. Mixing model
We used the dual isotope (δ15N and δ13C) mixing model Isosource(Phillips and Gregg, 2003) to estimate adult diet during each periodand chick diet, and to compare male vs. female diet during periods inwhich sex-specific isotope differences occurred. Isosource examines allpossible combinations of contributions for up to 10 sources (Phillipsand Gregg, 2003). We considered solutions feasible if they summed toobserved Rhinoceros Auklet isotope values within a tolerance level of0.1‰ (Phillips and Gregg, 2003). Model assumptions were that 1) weincluded all relevant sources, 2) fractionation rates were accurate, and3) prey isotope values did not change seasonally. We used year-specific mean isotope values of prey that were ≥5%M of chick diet inat least one year as sources. For 2012, we included euphausiids as asource, but used isotope values of T. spinifera sampled in 2013. For2013, we included prey that did not appear in our chick diet samplethat year as sources (i.e. market squid, T. spinifera, and Pacific sandlance sampled by other means in 2013). Euphausiids were not includedas a source in chick diet models because Rhinoceros Auklets feed exclu-sively fish to chicks (Bedard, 1969). It is possible that seasonal changesin prey isotopes affected mixing model accuracy for periods several
months from prey sampling dates (i.e. pre-breeding, fall/winter). How-ever, the year-specific prey sampling in our study represents a finer atemporal scale than that used by many previous isotopic mixingmodel studies examining seasonal seabird diet (e.g., Becker et al.,2007a; Hedd et al., 2010; Sorensen et al., 2009).
2.9. Statistics
We used the statistical package JMP (SAS Institute, Cary, NorthCarolina, USA) for all statistical tests except bootstrap tests, for whichwe used Resampling Stats for Excel (Statistics.com, Arlington, Virginia,USA). We used likelihood ratio χ2 tests to test differences betweenyears in hatching success, chick survival, total productivity, and sex-specific differences in the %FO of common prey species in bill-loads.We tested differences in chick growth between years using two-tailedt-tests. We tested differences in fractionation-adjusted δ15N and δ13Cbetween each tissue and year using a full-factorial MANOVA. We used10,000 iteration bootstrap tests to test differences in δ15N and δ13C be-tween sexes for each tissue, and to test sex-specific differences in theproportions (%N) of common prey species in bill-loads. We tested dif-ferences in log-transformed bill-load masses between sexes and yearsusing a full-factorial ANOVA. We tested differences among δ15N andδ13C of prey using full-factorial ANCOVAs,with species and year as inde-pendent variables and prey length as an independent covariate. Finally,we tested correlations between prey proportions in adult mixingmodelestimates vs. chick bill-loads and chick mixing model estimates vs.chick bill-loads using linear regressions. We conducted post-hoc two-tailed t-tests or F tests to investigate significant effects. We testedresiduals for normality with Shapiro–Wilk tests and for homoscedastic-ity by plotting residuals vs. expected values and assessing symmetry.
Following the advice of Nakagawa (2004) and others (Garamszegi,2006; Moran, 2003; Perneger, 1998), we did not use Bonferroni correc-tions for multiple comparisons. Instead, for each pair-wise test we re-port the test statistic, the exact p value, and the absolute value ofCohen's dmetric of standardized effect size, where a d of≤0.2 is consid-ered a “small effect,” ≥0.5 is considered a “medium effect,” and ≥0.8 isconsidered a “large effect” (Cohen, 1988). We defined statistical signif-icance as p≤ 0.5 with d≥ 0.5 for pair-wise tests and as p≤ 0.5 for mul-tivariate tests. Values are reported as x ± 1 SE unless otherwise noted.
3. Results
3.1. Reproductive success
Hatching success did not differ between years (90% in 2012, n=78;86% in 2013, n = 66; χ21 = 0.4, n = 144, p = 0.53, d = 0.1). Chickgrowth was significantly lower during 2012 (5.1 ± 0.6 g d−1, n = 15)than during 2013 (6.9 ± 0.6 g d−1, n = 10; t23 = 2.1, p = 0.05, d =0.9). Chick survival to fledging was significantly lower during 2012(65%, n = 66) than during 2013 (86%, n = 43; χ21 = 6.2, n = 109,p = 0.01, d = 0.5). Overall productivity was lower during 2012(54%, n = 79) than during 2013 (73%, n = 51; χ21 = 4.4, n = 130,p = 0.04, d = 0.4).
3.2. Adult mass during incubation
Mass of males during incubation did not differ between years(540 ± 26 g in 2012 vs. 546 ± 34 g in 2013, n = 16 both years; t30 =0.5, p = 0.62, d = 0.2). Mass of females during incubation was 17 gless in 2012 (504 ± 8 g, n = 23) than in 2013 (521 ± 5 g, n = 17;t38 = 1.7, p = 0.10, d = 0.6), though this trend was not significant. Asa metric of body condition, we compared the mass of individuals thatwere weighed both years. There was no difference between years inmass of serially weighed males (% change in mass = 0.0008 ± 1%,1 ± 7 g heavier in 2013, n = 8; paired t-test, t7 = 0.1, p = 0.90, d =0.1), but serially weighed females were significantly heavier in 2013
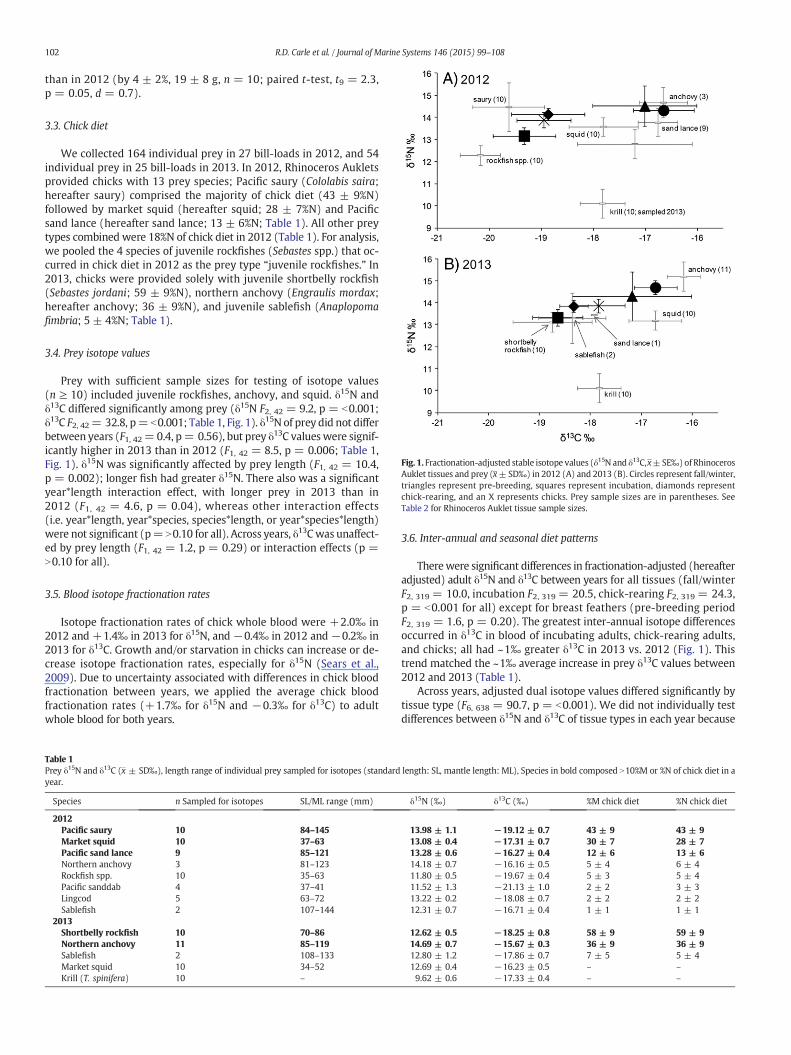
Fig. 1. Fractionation-adjusted stable isotope values (δ15N and δ13C,x±SE‰) of RhinocerosAuklet tissues and prey (x±SD‰) in 2012 (A) and 2013 (B). Circles represent fall/winter,triangles represent pre-breeding, squares represent incubation, diamonds representchick-rearing, and an X represents chicks. Prey sample sizes are in parentheses. SeeTable 2 for Rhinoceros Auklet tissue sample sizes.
102 R.D. Carle et al. / Journal of Marine Systems 146 (2015) 99–108
than in 2012 (by 4 ± 2%, 19 ± 8 g, n = 10; paired t-test, t9 = 2.3,p = 0.05, d = 0.7).
3.3. Chick diet
We collected 164 individual prey in 27 bill-loads in 2012, and 54individual prey in 25 bill-loads in 2013. In 2012, Rhinoceros Aukletsprovided chicks with 13 prey species; Pacific saury (Cololabis saira;hereafter saury) comprised the majority of chick diet (43 ± 9%N)followed by market squid (hereafter squid; 28 ± 7%N) and Pacificsand lance (hereafter sand lance; 13 ± 6%N; Table 1). All other preytypes combined were 18%N of chick diet in 2012 (Table 1). For analysis,we pooled the 4 species of juvenile rockfishes (Sebastes spp.) that oc-curred in chick diet in 2012 as the prey type “juvenile rockfishes.” In2013, chicks were provided solely with juvenile shortbelly rockfish(Sebastes jordani; 59 ± 9%N), northern anchovy (Engraulis mordax;hereafter anchovy; 36 ± 9%N), and juvenile sablefish (Anaplopomafimbria; 5 ± 4%N; Table 1).
3.4. Prey isotope values
Prey with sufficient sample sizes for testing of isotope values(n ≥ 10) included juvenile rockfishes, anchovy, and squid. δ15N andδ13C differed significantly among prey (δ15N F2, 42 = 9.2, p = b0.001;δ13C F2, 42= 32.8, p= b0.001; Table 1, Fig. 1). δ15N of prey did not differbetween years (F1, 42= 0.4, p= 0.56), but prey δ13C valueswere signif-icantly higher in 2013 than in 2012 (F1, 42 = 8.5, p = 0.006; Table 1,Fig. 1). δ15N was significantly affected by prey length (F1, 42 = 10.4,p = 0.002); longer fish had greater δ15N. There also was a significantyear*length interaction effect, with longer prey in 2013 than in2012 (F1, 42 = 4.6, p = 0.04), whereas other interaction effects(i.e. year*length, year*species, species*length, or year*species*length)were not significant (p= N0.10 for all). Across years, δ13Cwas unaffect-ed by prey length (F1, 42 = 1.2, p = 0.29) or interaction effects (p =N0.10 for all).
3.5. Blood isotope fractionation rates
Isotope fractionation rates of chick whole blood were +2.0‰ in2012 and +1.4‰ in 2013 for δ15N, and −0.4‰ in 2012 and −0.2‰ in2013 for δ13C. Growth and/or starvation in chicks can increase or de-crease isotope fractionation rates, especially for δ15N (Sears et al.,2009). Due to uncertainty associated with differences in chick bloodfractionation between years, we applied the average chick bloodfractionation rates (+1.7‰ for δ15N and −0.3‰ for δ13C) to adultwhole blood for both years.
Table 1Prey δ15N and δ13C (x ± SD‰), length range of individual prey sampled for isotopes (standardyear.
Species n Sampled for isotopes SL/ML range (mm)
2012Pacific saury 10 84–145Market squid 10 37–63Pacific sand lance 9 85–121Northern anchovy 3 81–123Rockfish spp. 10 35–63Pacific sanddab 4 37–41Lingcod 5 63–72Sablefish 2 107–144
2013Shortbelly rockfish 10 70–86Northern anchovy 11 85–119Sablefish 2 108–133Market squid 10 34–52Krill (T. spinifera) 10 –
3.6. Inter-annual and seasonal diet patterns
Therewere significant differences in fractionation-adjusted (hereafteradjusted) adult δ15N and δ13C between years for all tissues (fall/winterF2, 319 = 10.0, incubation F2, 319 = 20.5, chick-rearing F2, 319 = 24.3,p = b0.001 for all) except for breast feathers (pre-breeding periodF2, 319 = 1.6, p = 0.20). The greatest inter-annual isotope differencesoccurred in δ13C in blood of incubating adults, chick-rearing adults,and chicks; all had ~1‰ greater δ13C in 2013 vs. 2012 (Fig. 1). Thistrend matched the ~1‰ average increase in prey δ13C values between2012 and 2013 (Table 1).
Across years, adjusted dual isotope values differed significantly bytissue type (F6, 638 = 90.7, p = b0.001). We did not individually testdifferences between δ15N and δ13C of tissue types in each year because
length: SL, mantle length: ML), Species in bold composed N10%M or %N of chick diet in a
δ15N (‰) δ13C (‰) %M chick diet %N chick diet
13.98 ± 1.1 −19.12 ± 0.7 43 ± 9 43 ± 913.08 ± 0.4 −17.31 ± 0.7 30 ± 7 28 ± 713.28 ± 0.6 −16.27 ± 0.4 12 ± 6 13 ± 614.18 ± 0.7 −16.16 ± 0.5 5 ± 4 6 ± 411.80 ± 0.5 −19.67 ± 0.4 5 ± 3 5 ± 411.52 ± 1.3 −21.13 ± 1.0 2 ± 2 3 ± 313.22 ± 0.2 −18.08 ± 0.7 2 ± 2 2 ± 212.31 ± 0.7 −16.71 ± 0.4 1 ± 1 1 ± 1
12.62 ± 0.5 −18.25 ± 0.8 58 ± 9 59 ± 914.69 ± 0.7 −15.67 ± 0.3 36 ± 9 36 ± 912.80 ± 1.2 −17.86 ± 0.7 7 ± 5 5 ± 412.69 ± 0.4 −16.23 ± 0.5 – –
9.62 ± 0.6 −17.33 ± 0.4 – –

Table 2Meanand range (1st–99th percentile, in parentheses) of feasible solutions for prey contributions to adult Rhinoceros Auklet diet fromdual isotope (δ15N and δ13C)mixingmodel IsoSource(Phillips and Gregg, 2003). Results are for both sexes pooled for fall/winter, pre-breeding, incubation, and chick-rearing periods of 2012 and 2013. Values for which the 99th percentilesolution was greater than 25% are bolded. Euphausiids were not included as a potential source in chick diet models.
Fall/winter Pre-breeding Incubation Chick-rearing Chicks
2012 n = 52 n = 55 n = 38 n = 26 n = 16
Pacific saury 0 (0–1) 8 (1–13) 44 (33–59) 65 (56–73) 42 (30–55)Market squid 0 (0–4) 4 (0–16) 6 (0–21) 8 (0–30) 15 (0–49)Pacific sand lance 24 (1–46) 5 (0–19) 4 (0–14) 7 (0–22) 10 (0–33)Rockfish spp. 0 (0–1) 1 (0–6) 34 (19–45) 3 (0–11) 7 (0–23)Northern anchovy 71 (52–90) 79 (68–89) 4 (0–14) 9 (0–23) 11 (0–34)Sablefish 3 (0–12) 2 (0–9) 4 (0–15) 5 (0–18) 10 (0–30)Euphausiid (T. spinifera) 2 (0–5) 1 (0–3) 4 (0–16) 2 (0–7) –
2013 n = 49 n = 55 n = 34 n = 24 n = 9
Market squid 3 (0–11) 3 (0–11) 3 (0–12) 0 (0–1) 1 (0–4)Pacific sand lance 8 (0–25) 19 (0–42) 12 (0–42) 2 (0–5) 7 (0–21)Shortbelly rockfish 7 (0–20) 16 (0–36) 51 (6–81) 65 (55–70) 39 (10–58)Northern anchovy 73 (68–79) 53 (46–60) 5 (0–13) 29 (28–30) 33 (30–35)Sablefish 8 (0–23) 15 (0–41) 28 (0–85) 4 (0–17) 20 (0–57)Euphausiid (T. spinifera) 1 (0–4) 01 (0–4) 1 (0–5) 0 (0–0) –
Fig. 2. Prey provided to chicks by male and female Rhinoceros Auklets, calculated as x%number (y axes) and % frequency of occurrence (scaled on x axes) of species per bill-load for A) females in 2012, B) males in 2012, C) females in 2013, and D) males in 2013.
103R.D. Carle et al. / Journal of Marine Systems 146 (2015) 99–108
differenceswere visually apparentwhen graphed (Fig. 1). Anchovy like-ly was the dominant prey of adult Rhinoceros Auklets during fall/winterand pre-breeding periods of both years (Table 2). Adjusted δ15N andδ13C was lesser during incubation than during pre-breeding of bothyears (Fig. 1). During incubation in 2012, primary prey of adults likelywere Pacific saury (1st–99th percentile 33–59%) and juvenile rockfishes(19–45%; Table 2). During incubation 2013, primary prey of adults likelywas juvenile rockfishes (6–81%) and/or juvenile sablefish (0–85%;Table 2). δ15N and δ13C were greater during chick-rearing than duringincubation in both years (Fig. 1). In 2012, saury likely was the primaryprey of chick-rearing adults (56–73%),with a potentially important con-tribution of squid (0–30%; Table 2). During 2013, juvenile shortbellyrockfish (55–70%) and anchovy (28–30%) likely were the primaryprey of chick-rearing adults (Table 2). Mixing model estimates ofmean prey proportions in chick-rearing adult diet (Table 2) were signif-icantly correlated with prey proportions in chick diet (%M) observed inbill-loads in 2012 (β= 1.16, p = 0.05, r2 = 0.66) and 2013 (β= 1.06,p = 0.003, r2 = 0.97; Table 1). Likewise, chick diet mean prey propor-tions estimated bymixing models (Table 2) were significantly correlat-ed with chick diet prey proportions (%M) observed in bill-loads in2012 (β = 0.68, p = 0.02, r2 = 0.76) and 2013 (β = 0.59, p = 0.02,r2 = 0.87; Table 1).
3.7. Sex-specific chick provisioning
In 2012, bill-loads of females contained significantly more saury(%N = 65 ± 14%, n = 12) than bill-loads of males (%N = 26 ± 10%,n=15; 2 sample bootstrap, p= 0.04, d=0.9; Fig. 2A, B). Saury also oc-curredmore frequently in bill-loads of females (%FO=66%) thanmales(%FO= 40%), but the difference was not significant (χ21 = 1.9, n=27,p = 0.17, d = 0.6; Fig. 2A, B). In 2012, bill-loads of females containedsignificantly less squid (%N = 10 ± 6%) than those of males (%N =42 ± 10%; 2 sample bootstrap, p = 0.02, d = 1.0; Fig. 2A, B). Squidalso occurred significantly less frequently in bill-loads of females(%FO = 25%) than males (%FO = 73%; χ21 = 6.5, n = 27, p = 0.02,d=1.1; Fig. 2A, B). In 2013, bill-loads of females (n=10) contained sig-nificantly less anchovy than those of males (n=15; %N=15± 11% fe-males vs. 50 ± 13% males; 2 sample bootstrap, p = 0.05, d = 0.8;Fig. 2C, D). Bill-loads of females also contained anchovy less frequentlythan those of males in 2013, but the difference was not significant(females %FO = 20% vs. males %FO = 53%; χ21 = 2.9, n = 25, p =0.09, d = 0.7; Fig. 2C, D). In 2013, bill-loads of females had greater %Nand %FO of shortbelly rockfish than bill-loads of males, but these differ-ences were not significant (%N, 2 sample bootstrap, p = 0.15, d = 0.6;%FO, χ21 = 1.9, n = 25, p = 0.16, d = 0.6; Fig. 2C, D).
Bill-load masses of females (n = 22) and males (n = 30) did notdiffer across years (females = 25.0 ± 3.5 g vs. males = 25.4 ± 0.4 g;F1, 48 = 0.3, p = 0.61, d = 0.2) or within years (2012 t48 = −0.8,p= 0.42, d= 0.28; 2013 t48= 1.5, p= 0.14, d= 0.6). Bill-loadmassesof both sexes together were significantly greater in 2012 (28.6 ± 3.0 g,n = 27) than in 2013 (21.5 ± 2.3 g, n = 25; F1, 48 = 6.0, p = 0.02,

104 R.D. Carle et al. / Journal of Marine Systems 146 (2015) 99–108
d = 0.5). This trend was driven by significantly heavier bill-loads offemales in 2012 (31.1 ± 9.0 g, n = 12) than in 2013 (17.6 ± 2.8 g,n = 10; t48 = −2.7, p = 0.01, d = 1.5), whereas bill-load masses ofmales did not differ between years (26.6 ± 3.1 g in 2012, n = 15;24.1 ± 3.2 g in 2013, n = 15; t48 = −0.7, p = 0.53, d = 0.2).
Fig. 4. Fractionation-adjusted chick-rearing period isotope values (δ15N and δ13C, ‰) ofindividual adult male and female Rhinoceros Auklets and chicks, and individual andmean values (±1 SD‰) of dominant prey during the 2012 (A) and 2013 (B). Prey samplesizes are in parentheses.
3.8. Sex-specific diet
Stable isotope values of males and females did not differ (2 samplebootstraps, p = N0.10, d = b0.5 for all; Fig. 3), except during thechick-rearing periods of both years and fall winter 2011–12. Thegreatest magnitude difference between sexes occurred during the2012 chick-rearing period, when δ13C of males (−18.37 ± 0.16) wassignificantly greater than that of females (−18.97 ± 0.19; 2 samplebootstrap, p = 0.02, d = 1.0, Figs. 3, 4). There was no difference inδ15N between sexes during the same period (2 sample bootstrap, p =0.71, d= 0.2; Figs. 3, 4). Mixing model mean estimates of prey propor-tions in female diet during the 2012 chick-rearing period were signifi-cantly correlated with %N of prey delivered to chicks by females thatyear (β= 1.15, p= 0.0001, r2 = 0.98), with saury being the dominantprey item in bothmetrics (Fig. 2A, Table 3).Whereasmixingmodels es-timated that saury made up the majority of male diet (mean 56%;Table 3) during the 2012 chick-rearing period, the dominant prey inmales' bill-loads that year was squid (42%N; Fig. 2B). Mixing model es-timates of prey proportions in male diet during this period and %N ofprey delivered by males were not correlated (β = 0.46, p = 0.48,r2 = 0.13). However, mixing model estimates of males and femalediet during the 2012 chick-rearing period (Table 3) were consistentwith the trend observed in bill-loads of females delivering more sauryand males more squid to chicks (Fig. 2A, B).
During the 2013 chick-rearing period, δ15N of males was significant-ly greater than that of females (by 0.23‰; 2 sample bootstrap, p= 0.02,
Fig. 3. Fractionation-adjusted stable isotope values (δ15N and δ13C,x±SE‰) of RhinocerosAuklet adult male and female and chick tissues in 2012 (A) and 2013 (B). Black shapesrepresent adult females, white shapes represent adult males, and an X represents chicks.Sample sizes are in parentheses (m = male, f = female).
d = 1.0), whereas δ13C did not differ between sexes (2 samplebootstrap, p = 0.12, d = 0.7; Figs. 3, 4). Mixing models indicatedthat during the 2013 chick-rearing period females consumed 1–70%shortbelly rockfish and 10–26% anchovy, whereas males consumed3–63% shortbelly rockfish and 23–35% anchovy (Table 3). This wasconsistent with bill-loads in 2013, when males delivered more anchovyand females delivered more shortbelly rockfish (Fig. 2C, D). During fall/winter of 2011–2012, δ15N and δ13C of males were greater than those offemales by 0.19‰ (Fig. 3). This differencewas significant for δ15N (2 sam-ple bootstrap, p = 0.003, d = 0.9) but not δ13C (p = 0.27, d = 0.3).Mixing models indicated that males may have taken up to 30% moreanchovy (99th percentile) than females during fall/winter 2011–12(Table 3). However, we considered diet differences between sexes duringthe 2013 chick-rearing and 2011–12 fall/winter periods inconclusivegiven the small magnitude differences in isotope values and the uncer-tainty inherent in mixing model estimates.
4. Discussion
Using stable isotopes, we found both seasonal and sex-specific pat-terns in Rhinoceros Auklet diet. Rhinoceros Auklet adult diet underwentsimilar seasonal shifts in 2 consecutive years with different oceano-graphic conditions. δ15N and δ13C of adult male and female RhinocerosAuklets did not differ (p≥ 0.10) except during the chick-rearing periodboth years and fall/winter 2011–12. Sex-specific diet and chick provi-sioning differences were significant and conclusive only during the2012 chick-rearing period. During this period, female diet and bill-loads contained proportionally more saury and less squid than malediet and bill-loads.
Rhinoceros Auklet chick growth (g d−1), survival to fledging, andoverall productivity were lower in 2012 than in 2013, whereas hatchingsuccess did not differ between years. Rhinoceros Auklet chick growth

Table 3Mean and range (1st–99th percentile, in parentheses) of feasible solutions for prey contributions adult female andmale Rhinoceros Auklet diets from dual isotope (δ15N and δ13C)mixingmodel IsoSource (Phillips and Gregg, 2003). Results are shown for periods during which male and female δ15N or δ13C mean values differed significantly (2 sample bootstraps, p ≤ 0.02and d ≥ 0.80 for all). Values for which the 99th percentile solution was greater than 25% are bolded. Pacific saury was not included as a potential source in 2013 models.
Fall/winter 2012 Chick-rearing 2012 Chick-rearing 2013
Femalesn = 28
Malesn = 24
Femalen = 13
Malesn = 13
Femalesn = 11
Malesn = 13
Pacific saury 0 (0–1) 1 (0–4) 75 (66–83) 56 (46–63) – –
Market squid 1 (0–4) 3 (0–12) 6 (0–21) 8 (0–32) 3 (0–10) 2 (0–7)Pacific sand lance 27 (1–63) 10 (0–30) 4 (0–14) 9 (0–31) 13 (0–48) 9 (0–32)Rockfish spp. 0 (0–1) 1 (0–3) 5 (0–12) 3 (0–11) 39 (1–70) 40 (3–63)Northern anchovy 67 (34–90) 80 (64–92) 4 (0–15) 17 (1–33) 18 (10–26) 29 (23–35)Sablefish 3 (0–13) 4 (0–14) 2 (0–08) 2 (0–07) 27 (0–76) 21 (0–67)Euphausiid(T. spinifera)
2 (0–6) 0 (0–5) 4 (0–15) 5 (0–18) 1 (0–4) 0 (0–2)
105R.D. Carle et al. / Journal of Marine Systems 146 (2015) 99–108
and survival to fledging have been linkedwith the abundance and qual-ity of prey available during chick-rearing (Vermeer, 1980; Takahashiet al., 2001; Thayer and Sydeman, 2007). Poorer chick growth and sur-vival tofledging in 2012mayhave resulted fromchicks being fedmainlysaury and squid, which typically have lower nutritional quality thanjuvenile rockfishes or anchovy (Beaubier and Hipfner, 2013; Beckeret al., 2007a; Thayer and Sydeman, 2007). In a previous study in centralCalifornia, Rhinoceros Auklet chicks grew faster when they were fedmore juvenile rockfishes and anchovy and slower when they were fedmore saury (Thayer and Sydeman, 2007). Furthermore, chick survivalto fledging depended more strongly on the overall mass of bill-loadsthan the species of prey provided to chicks (Thayer and Sydeman,2007). In our study, however, bill-loads were significantly heavier in2012, when chick survival to fledging was significantly less (65% in2012 vs. 86% in 2013). Therefore, adults may have fed chicks lessfrequently in 2012, so that chicks received less food overall despitebeing provided larger meals.
Thayer and Sydeman (2007) found that annual bill-load composi-tion of Rhinoceros Auklets at ANI reflected actual abundance of juvenilerockfishes and anchovy in the environment. NMFS trawl surveys con-ducted near ANI indicated that juvenile rockfish abundance was nearthe long-term average (1990–2013) in 2012, butwas the greatest on re-cord in 2013 (Wells et al., 2013). Trawls also indicated that anchovyabundance was well below average in 2012 and slightly below averagein 2013, whereas squid abundance was above average in both years,particularly 2012 (Wells et al., 2013). Thus, Rhinoceros Auklets mayhave selected saury and squid for chicks in 2012 because high-qualityalternate prey was unavailable that year. However, abundanceestimates for anchovy and squid from these night trawls must beinterpreted with caution because both species are fast and patchy andthus able to avoid sampling gear designed for juvenile rockfishes. Nodirect survey data exist on saury distribution or abundance in the regionduring the study. Saury are often associated with warm (i.e. 15–17 °C),deep waters (Hughes, 1974; Smith et al., 1970), but distribution andabundance is highly variable (Hughes, 1974; Tian et al., 2004; Tsenget al., 2013). Sea surface temperature, upwelling, and chlorophyll-a con-centrations around ANI were greater in spring of 2013 than 2012(Bjorkstedt et al., 2011; Wells et al., 2013), potentially creating betterenvironmental conditions for juvenile rockfishes during 2013 (Ralstonet al., 2013).
Mixing models indicated that adult diet in fall/winter of both yearswas composed primarily of anchovy with lesser contributions by sandlance (Table 2). Whereas Rhinoceros Auklet stomachs sampled duringwinter in Monterey Bay in the 1970s contained primarily squid andanchovy (Baltz and Morejohn, 1977), squid was not an important fall/winter diet item during our study (99th percentile 4% in 2012, 11% in2014; Table 2). Although this difference could be related to methodolo-gy (i.e. stomach sampling vs. stable isotopes), it seems more likely thatRhinoceros Auklets responded to inter-annual variability in prey
resources during fall/winter, as has been shown during the chick-rearing period (Vermeer, 1980; Thayer and Sydeman, 2007). Anchovyare energetically rich (Becker et al., 2007a), and may be importantprey during fall/winter, when Rhinoceros Auklets undergo an energeti-cally costly molt to replace most body feathers (Pyle, 2008). Whereassand lance was an important prey for breeding and non-breeding Rhi-noceros Auklets in Washington state and British Columbia (Vermeer,1980; Bertram and Kaiser, 1993; Lance and Thompson, 2005), sandlance have historically been absent from Rhinoceros Auklet adult andchick diet in California (Baltz and Morejohn, 1977; Thayer andSydeman, 2007). Rhinoceros Auklets are typically found in offshore wa-ters in California during winter (Briggs et al., 1987), but sand lance arefound in shallow (b60 m), nearshore waters (Ostrand et al., 2005).Thus, it seems unlikely that Rhinoceros Auklets preyed heavily onsand lance during fall/winter, and the 1st percentile mixingmodel esti-mates for sand lance (1% in 2012, 0% in 2013) may be most accurate.
Adults appeared to switch from eating primarily anchovy duringnon-breeding periods to prey with lesser δ13C values (i.e. juvenilerockfishes and/or saury) during the breeding season (Fig. 1). Juvenileshortbelly rockfish were the most frequently occurring rockfish inchick diet during both years. Shortbelly rockfish are born in winterand early spring (Wylie Echevarria, 1987) and probably become largeenough for seabirds to eat around March–April (Ainley et al., 1990). Itappeared that adults fed heavily on juvenile rockfishes during incuba-tion in both years (Fig. 1 and Table 2). Therefore, the heavier bodymass of incubating females during 2013 could have been related tothe greater availability of juvenile rockfishes that year (Wells et al.,2013).
δ13C has been used as an indicator of nearshore vs. offshore feeding,with lesser δ13C values representing a more “offshore” signal (Burtonand Koch, 1999; Hobson et al., 1994). It was therefore unexpected thatRhinoceros Auklet δ13C was lesser during the breeding season, whenbirds at ANI regularly return to the nearshore breeding colony. Rhinoc-eros Aukletsmay have acquired greater δ13C duringwinter by eating an-chovies. Anchovies move offshore in thewinter (Mais, 1974), but mightmaintain a relatively greater δ13C signal acquiredwhen theywere locat-ed nearshore during summer (Santora et al., 2012). Alternatively, base-line isotopic shifts may occur seasonally in relation to upwelling orother environmental factors (Michener and Kaufman, 2007). Wefound inter-annual shifts in prey δ13C of ~1‰ (Fig. 1 and Table 1), butassumed formixingmodels that prey isotope values did not change sig-nificantly within years. These inter-annual differences in prey isotopesunderscore the necessity of sampling predator and prey tissues in thesame year or concurrently to ensure accurate results for stable isotopestudies involving forage fish.
In other regions (i.e. Alaska, British Columbia, and Japan), euphau-siids were an important pre-breeding diet item for adult RhinocerosAuklets (Davies et al., 2009; Hobson et al., 1994; Ito et al., 2009).Euphausiids, however, were not a major component of adult diet at

106 R.D. Carle et al. / Journal of Marine Systems 146 (2015) 99–108
ANI during any period sampled (mean b5% for all periods; Table 2).Rhinoceros Auklets at ANI may not have fed heavily on euphausiids, orit is possible that breast feather isotopes did not accurately reflect pre-breeding diet. Breast feathers had the greatest isotopic variability ofany tissue sampled (Fig. 1), and Rhinoceros Auklets do not molt allbreast feathers during the February–March pre-alternate molt (Pyle,2008). Pre-breeding and fall/winter isotope values were relatively sim-ilar (Fig. 1), indicating that some sampled breast feathers may havebeen grown during the pre-basic molt (August–January, Pyle, 2008).Therefore, we recommend caution when using breast feather isotopesto estimate seasonal Rhinoceros Auklet diet, because of the limitedpre-alternate molt and difficulty of visually selecting breast feathersby age in the field.
Adult δ15N and δ13C increased between incubation and chick-rearing(Fig. 1), reinforcing a pattern observed in other populations of Rhinocer-os Auklets and puffins (Hedd et al., 2010; Hipfner et al., 2013; Ito et al.,2009). Increasing trophic level may result from adults switching afterchicks hatch from self-feeding on low trophic level prey to larger, ener-getically rich fish required by chicks (Hipfner et al., 2013). Our resultssupport this theory, indicating that chick-rearing adults and chickshad relatively similar diets (Fig. 1). At ANI, shifting proportions of preyspecies in adult diet between incubation and chick-rearing (Table 2)could have been related to seasonal changes in prey availability (Itoet al., 2009). However, the dominant prey species during incubation(saury in 2012, shortbelly rockfish in 2013) continued to be dominantduring chick-rearing in both years (Table 2). Prey δ15N increased withprey length; therefore, Rhinoceros Auklet trophic level likely increasedbecause birds ate larger individual prey later in the breeding season.Thus, a combination of selection, seasonal prey availability, and preygrowth was likely responsible for observed increases in adult trophiclevel between incubation and chick-rearing.
Adult male and female isotopes values did not significantly differ, ordifferences were inconclusive, during all periods except the 2012 chick-rearing period, and both sexes' isotope values changed seasonally insimilar directions andmagnitudes (Fig. 3). Therefore,males and femaleslikely used similar habitats and exploited similar niches during most ofthe year. Females, however, had significantly lesser δ13C values thanmales during the chick-rearing period of 2012 (Figs. 3, 4). The sex-specific difference in δ13C likely was due to diet, because δ13C was notaffected by metabolic processes in a captive study of Rhinoceros Aukletchicks (Sears et al., 2009). The δ13C difference corresponded to a greaterproportion of saury and a lesser proportion of squid in female vs. malediet (Table 3). During the same period, females provisioned chickswith more saury and less squid than males (Fig. 2A, B). Together,these results suggested that males and females targeted different preyduring the chick-rearing period of 2012. Similar but weaker trends oc-curred during chick-rearing in 2013, when female bill-loads containedless anchovy andmore juvenile rockfish thanmale bill-loads (Fig. 2C, D).
While this study was not designed to determine the mechanismdriving sex-specific differences, multiple metrics provided clues to po-tential causes of differences during the 2012 chick-rearing period.Niche separation deriving from physiological differences betweensexes seems unlikely, because male and female diet was similar duringother seasons. Intra-specific competitive exclusion also seems unlikelybecause of the small breeding population at ANI (~260 breeding birds;Hester et al., 2013). However, the biogeography of prey taken duringthe 2012 chick-rearing period indicated that males and females mayhave foraged in different locations. Saury most frequently occur from40–160 km offshore (Leet et al., 1992; Smith et al., 1970), and are typi-cally associated with relatively warm (i.e. 15–17 °C), deep waters andthermal fronts (Hughes, 1974). Market squid typically occur in the im-mediate vicinity (i.e. b10 km) of ANI during spring and summer(Santora et al., 2012). Average foraging trip length of Rhinoceros Aukletsin Japan was 87 km (Kato et al., 2003) and presumably RhinocerosAuklets at ANI travel similar distances. Thus, females may have takenmore saury than males because they foraged farther offshore more
often. In British Columbia, Rhinoceros Auklets foraged over a largerarea and spent more time engaged in solitary foraging and less time inforaging flocks when prey was in lesser densities (Davoren, 2000).Thus, it is plausible that females foraged over greater distances in2012 in response to lesser availability of preferred prey that year.
In other alcids such as Cassin's Auklets (Ptychoramphus aleuticus),and Dovekies (Alle alle), chick-rearing females foraged farther fromthe breeding colony than males, which may have been related to sex-specific energetic constraints (Adams et al., 2004; Welcker et al.,2009). Hypothetically, females need to recover body condition lost dur-ing egg formation and/or incubation and consequently may take longerforaging trips than males in order to self-feed (Adams et al., 2004;Bradley et al., 2002; Welcker et al., 2009). Serially-weighed females inour study weighed less during incubation in 2012 than 2013, whereasmales displayed no difference. Thus, females in poorer body conditionduring incubation in 2012 may have invested greater effort to self-feed in more predictable or productive areas farther from the breedingcolony that year (Jakubas et al., 2012; Weimerskirch, 1998, 2007).
Heavier bill-loadmasses of females in 2012, compared with those ofmales during both years and females in 2013, may also have indicatedmore distant foraging trips by females that year. Many seabirds, includ-ing bill-loading species that deliver frequently (e.g., Common Murres[Uria aalge; Uttely et al., 1994] and Common Terns [Sterna hirundo;Burness et al., 1994]), increased food-loads for chicks and decreasedmeal frequency when foraging farther from the colony (Granadeiroet al., 1998; Gray and Hamer, 2001; Weimerskirch, 1998). However,Rhinoceros Auklets in Japan maintained consistent bill-load masses de-spite changes in foraging distance (Deguchi et al., 2010). In our study,greater bill-load masses of females in 2012 indicated that RhinocerosAuklets did adjustmeal sizes, though the relationshipwith foraging dis-tance is not known. However, poor chick growth and survival to fledg-ing despite heavier bill-loads in 2012 indicated that chicks may havebeen fed less frequently. Thus, we hypothesize that because femaleshad lesser body condition during the 2012 breeding season, they prior-itized feeding themselves and foraged farther from the colony thanmales, potentially influencing observed poorer overall reproductivesuccess during 2012. Diet and provisioning differences between sexesmay have been less pronounced during 2013 because energeticallysufficient preywere abundant and femaleswere in superior body condi-tion. Further study on sex-specific foraging areas, dive behavior, andchick-feeding frequency is needed to better resolve sex-based differ-ences in foraging strategies.
In conclusion, we found that the diets of adult Rhinoceros Aukletsunderwent consistent seasonal shifts across 2 years with differing envi-ronmental conditions, and that sex-specific differences in diet and preydelivered to chicks were likely related to energetic constraints, preyavailability, or both. Furthermore, Rhinoceros Auklet diet was com-posed of a mixture of commercially fished and un-fished species, ofboth the classic “forage” category (i.e. anchovy, squid, saury) and juve-nile ground-fishes (i.e. shortbelly rockfish, sablefish, lingcod). The ob-served temporal and demographic variability in Rhinoceros Aukletdiet underscores the importance of understanding andmanagingmulti-ple prey populations in the central California Current region so that gen-eralist marine predators have sufficient resources through changingenergetic and oceanic conditions.
Acknowledgements
We gratefully acknowledge the staff of Año Nuevo State Park for ac-cess to Año Nuevo Island and logistical support. Thanks to David Ainleyand an anonymous reviewer for providing helpful comments on thismanuscript, and to Jim Harvey, Josh Adams, Scott Hamilton, AlayneMeeks, David Carle, Jonathan Felis, and Emily Golson for reviewingdrafts. Thanks to AlainaValenzuela, Dana Page, and numerous other vol-unteer “rhino wranglers” for help with field work. Thanks to KeithSakuma, Tom Laidig, and John Field at the NOAA Southwest Fisheries

107R.D. Carle et al. / Journal of Marine Systems 146 (2015) 99–108
Science Center, who generously identified juvenile rockfishes and pro-vided samples. Thanks to Bruce Finney for helpwith stable isotope anal-ysis, Norine Yeung for help with DNA sex analysis, and Jocelyn Douglasand Charlotte Cumberworth for helpwith lab work. Funding came fromthe Robert and Patricia Switzer Foundation, the Michael Lee Environ-mental Foundation, and the Earl and Ethel Myers Oceanographic Trust.
References
Adams, J., Takekawa, J.Y., Carter, H.R., 2004. Foraging distance and home range of Cassin'sAuklets nesting at two colonies in the California Channel Islands. Condor 106,618–637.
Ainley, D.G., Strong, C.S., Penniman, T.M., Boekelheide, R.J., 1990. The feeding ecology ofFarallon seabirds. In: Ainley, D.G., Boekelheide, R.J. (Eds.), Seabirds of the FarallonIslands: ecology, dynamics, and structure of an upwelling-system community.Stanford University Press, Stanford, CA, USA, pp. 51–127.
Ainley, D.G., Sydeman, W.J., Norton, J., 1995. Upper trophic level predators indicate inter-annual negative and positive anomalies in the California Current food web. Mar. Ecol.Prog. Ser. 118, 69–79.
Baltz, D.M., Morejohn, G.V., 1977. Food habits and niche overlap of seabirds wintering onMonterey Bay, California. Auk 94, 526–543.
Bearhop, S., Teece, M.A., Waldron, S., Furness, R.W., 2000. Influence of lipid and uric acidon δ13C and δ15N values of avian blood: implications for trophic studies. Auk 117,504–507.
Bearhop, S., Phillips, R.A., McGill, R., Cherel, Y., Dawson, D.A., Croxall, J.P., 2006. Stableisotopes indicate sex-specific and long-term individual foraging specialisation indiving seabirds. Mar. Ecol. Prog. Ser. 311, 157–164.
Beaubier, J., Hipfner, J.M., 2013. Proximate composition and energy density of forage fishdelivered to Rhinoceros Auklet Cerorhinca monocerata nestlings at Triangle Island,British Columbia. Mar. Ornithol. 41, 35–39.
Becker, B.H., Newman, S.H., Inglis, S., Beissinger, S.R., 2007a. Diet-feather stable isotope(δ15N and δ13C) fractionation in Common Murres and other seabirds. Condor 109,451–456.
Becker, B.H., Peery, M.Z., Beissenger, S.R., 2007b. Ocean climate and prey availability affectthe trophic level and reproductive success of the Marbled Murrelet, an endangeredseabird. Mar. Ecol. Prog. Ser. 329, 267–279.
Bedard, J., 1969. Adaptive radiation in Alcidae. Ibis 111, 189–198.Bertram, D.F., Kaiser, G.W., 1993. Rhinoceros Auklet (Cerorhinca monocerata) nestling diet
may gauge Pacific sand lance (Ammodytes hexapterus) recruitment. Can. J. Fish. Aquat.Sci. 50, 1908–1915.
Bjorkstedt, E.P., Goericke, R., McClatchie, S., Weber, E., Watson, W., Lo, N., Peterson, B.,Emmett, B., Brodeur, R., Peterson, J., Litz, M., et al., 2011. State of the California Current2011–2012: ecosystems respond to local forcing as La Niña wavers and wanes. Calif.Coop. Ocean. Fish. Investig. Rep. 53, 41–76.
Bligh, E.G., Dyer, W.J., 1959. A rapid method of total lipid extraction and purification. Can.J. Biochem. Physiol. 37, 911–917.
Bradley, R.W., Tranquilla, L.A.M., Vanderkist, B.A., Cooke, F., 2002. Sex differences in nestvisitation by chick-rearing Marbled Murrelets. Condor 104, 178–183.
Briggs, K.T., Tyler, W.B., Lewis, D.B., Carlson, D.R., 1987. Bird communities at sea offCalifornia: 1975 to 1983. Stud. Avian Biol. 11, 1–74.
Burness, G.P., Morris, R.D., Bruce, J.P., 1994. Seasonal and annual variation in broodattendance, prey type delivered to chicks, and foraging patterns of male CommonTerns (Sterna hirundo). Can. J. Zool. 72, 1243–1251.
Burton, R.K., Koch, P.L., 1999. Isotopic tracking of foraging and long-distance migration innortheastern Pacific pinnipeds. Oecologia 119, 578–585.
Carleton, S.A., Martinez del Rio, C., 2005. The effect of cold-induced increased metabolicrate on the rate of 13C and 15N incorporation in House Sparrows (Passer domesticus).Oecologia 144, 226–232.
Chavez, F.P., Pennington, J.T., Castro, C.G., Ryan, J.P., Michisaki, R.P., Schlining, B., Walz, P.,Buck, K.R., McFadyen, A., Collins, C.A., 2002. Biological and chemical consequences ofthe 1997–1998 El Niño in central California waters. Prog. Oceanogr. 54, 205–232.
Cherel, Y., Hobson, K.A., Hassani, S., 2005. Isotopic discrimination between food and bloodand feathers of captive penguins: implications for dietary studies in the wild. Physiol.Biochem. Zool. 78, 106–115.
Chiu Werner, A., Paiva, V.H., Ramos, J.A., 2014. On the “real estate market”: individualquality and the foraging ecology of male Cory's Shearwaters. Auk 131, 265–274.
Cohen, J., 1988. Statistical Power Analysis for the Behavioral Sciences. Lawrence ErlbaumAssociates, Hillsdale, NJ, USA.
Davies, W.E., Hipfner, J.M., Hobson, K.A., Ydenberg, R.C., 2009. Seabird seasonaltrophodynamics: isotopic patterns in a community of Pacific alcids. Mar. Ecol. Prog.Ser. 382, 211–219.
Davoren, G.K., 2000. Variability in foraging in response to changing prey distributions inRhinoceros Auklets. Mar. Ecol. Prog. Ser. 198, 283–291.
Davoren, G.K., Burger, A.E., 1999. Differences in prey selection and behaviour during self-feeding and chick provisioning in Rhinoceros Auklets. Anim. Behav. 58, 853–863.
Deguchi, T., Wada, A., Watanuki, Y., Osa, Y., 2010. Seasonal changes of the at-sea distribu-tion and food provisioning in Rhinoceros Auklets. Ecol. Res. 25, 123–137.
Forero, M.G., González-Solís, J., Hobson, K.A., Donázar, J.A., Bertellotti, M., Blanco, G.,Bortolotti, G.R., 2005. Stable isotopes reveal trophic segregation by sex and age inthe Southern Giant Petrel in two different food webs. Mar. Ecol. Prog. Ser. 296,107–113.
Fraser, G.S., Jones, I.L., Hunter, F.M., 2002. Male-female differences in parental care inmonogamous Crested Auklets. Condor 104, 413–423.
Frederiksen, M., Edwards, M., Richardson, A.J., Halliday, N.C., Wanless, S., 2006. Fromplankton to top predators: bottom‐up control of a marine food web across fourtrophic levels. J. Anim. Ecol. 75, 1259–1268.
Fridolfsson, A.K., Ellegren, H., 1999. A simple and universal method for molecular sexingof non-ratite birds. J. Avian Biol. 30, 116–121.
Garamszegi, L.Z., 2006. Comparing effect size across variables: generalization without theneed for Bonferroni correction. Behav. Ecol. 17, 682–687.
Garcia-Reyes, M., Largier, J.L., 2012. Seasonality of coastal upwelling off central and north-ern California: new insights, including temporal and spatial variability. J. Geophys.Res. 117, C03028.
Gaston, A.J., Jones, I.L., 1998. The Auks. Oxford University Press, New York, NY, USA.Gonzalez-Solis, J., Croxall, J.P., Wood, A.G., 2000. Sexual dimorphism and sexual
segregation in foraging strategies of Northern Giant Petrels, Macronectes halli, duringincubation. Oikos 90, 390–398.
Granadeiro, J.P., Nunes, M., Silva, M.C., Furness, R.W., 1998. Flexible foraging strategy ofCory's Shearwater, Calonectris diomedea, during the chick-rearing period. Anim.Behav. 56, 1168–1176.
Gray, C.M., Hamer, K.C., 2001. Food-provisioning behaviour of male and female Manxshearwaters, Puffinus puffinus. Anim. Behav. 62, 117–121.
Hedd, A., Fifield, D.A., Burke, C.M., Montevecchi, W.A., Tranquilla, L.M., Regular, P.M.,Buren, A.D., Robertson, G.J., 2010. Seasonal shift in the foraging niche of AtlanticPuffins Fratercula arctica revealed by stable isotope (δ15N and δ13C) analyses.Aquat. Biol. 9, 13–22.
Hedd, A., Montevecchi, W.A., Phillips, R.A., Fifield, D.A., 2014. Seasonal sexual segregationby monomorphic Sooty Shearwaters Puffinus griseus reflects different reproductiveroles during pre-laying period. PLoS One 9, e85572. http://dx.doi.org/10.1371/journal.pone.0085572 (1 Aug 2014).
Hayward, T.L., Venrick, E.L., 1998. Nearsurface pattern in the California Current: couplingbetween physical and biological structure. Deep-Sea Res. II 45, 1617–1638.
Hester, M.M., 1998. Abundance, reproduction, and prey of Rhinoceros Auklet, Cerorhincamonocerata, on Año Nuevo Island, California(M.S. thesis) Moss LandingMar. Lab., SanFrancisco State Univ., San Francisco, USA.
Hester, M.M., Carle, R.D., Beck, J.N., Calleri, D., 2013. Seabird conservation and habitatrestoration: 2013. Unpubl. Rep. to Calif. Dep. Parks and Rec., Año Nuevo State Park.
Hipfner, J.M., McFarlane-Tranquilla, L., Addison, B., Hobson, K.A., 2013. Trophic responsesto the hatching of offspring in a central-place foraging seabird. J. Ornithol. 154,965–970.
Hipfner, J.M., Mcfarlane-Tranquilla, L., Addison, B., Hobson, K.A., 2014. Seasonal variationin the foraging ecology of a zooplanktivorous seabird assessed with stable isotopeanalysis. Mar. Biol. Res. 10, 383–390.
Hobson, K.A., Clark, R.G., 1992. Assessing avian diets using stable isotopes II: factorsinfluencing diet-tissue fractionation. Condor 94, 189–197.
Hobson, K.A., Piatt, J.F., Pitocchelli, J., 1994. Using stable isotopes to determine seabirdtrophic relationships. J. Anim. Ecol. 63, 786–798.
Hughes, S.E., 1974. Stock composition, growth, mortality, and availability of Pacific saury,Cololabis saira, of the northeastern Pacific Ocean. Fish. Bull. 72, 121–131.
Ito, M., Minami, H., Tanaka, Y., Watanuki, Y., 2009. Seasonal and inter-annual oceano-graphic changes induce diet switching in a piscivorous seabird. Mar. Ecol. Prog. Ser.393, 273–284.
Jacob, U., Mintenbeck, K., Brey, T., Knust, R., Beyer, K., 2005. Stable isotope food webstudies: a case for standardized sample treatment. Mar. Ecol. Prog. Ser. 287, 251–253.
Jakubas, D., Iliszko, L., Wojczulanis-Jakubas, K., Stempniewicz, L., 2012. Foraging by LittleAuks in the distant marginal sea ice zone during the chick-rearing period. Polar Biol.35, 75–81.
Kato, A., Watanuki, Y., Nishiumi, I., Kuroki, M., Shaughnessy, P., Naito, Y., 2000. Variationin foraging and parental behavior of King Cormorants. Auk 117, 718–730.
Kato, A., Watanuki, Y., Naito, Y., 2003. Foraging behaviour of chick-rearing RhinocerosAuklets Cerorhinca monocerata at Teuri Island, Japan, determined by acceleration-depth recording micro data loggers. J. Avian Biol. 34, 282–287.
Koffijberg, K., Van Eerden, M.R., 1995. Sexual dimorphism in the cormorant Phalocrocoraxcarbo sinensis: possible implications for differences in structural size. Ardea 83,37–46.
Lance, M.M., Thompson, C.W., 2005. Overlap in diets and foraging of Common Murres(Uria aalge) and Rhinoceros Auklets (Cerorhinca monocerata) after the breedingseason. Auk 122, 887–901.
Leet, W.S., Dewees, C.M., Haugen, C.W., 1992. California's living Marine Resourcesand their Utilization. Sea Grant Ext. Progr., Dep. of Wildl. and Fish. Biol., Univ.of Calif.
Lewis, S., Benvenuti, S., Dall-Antonia, L., Griffiths, R., Money, L., Sherratt, T.N., Wanless, S.,Hamer, K.C., 2002. Sex-specific foraging behaviour in a monomorphic seabird. Proc. R.Soc. Lond. Ser. B Biol. Sci. 269, 1687–1693.
Lewis, S., Schreiber, E.A., Daunt, F., Schenk, G.A., Orr, K., Adams, A.,Wanless, S., Hamer, K.C.,2005. Sex-specific foraging behaviour in tropical boobies: does size matter? Ibis 147,408–414.
Logan, J.M., Jardine, T.D., Miller, T.J., Bunn, S.E., Cunjak, R.A., Lutcavage, M.E., 2008. Lipidcorrections in carbon and nitrogen stable isotope analyses: comparison of chemicalextraction and modelling methods. J. Anim. Ecol. 77, 838–846.
Lynn, R.J., Simpson, J.J., 1987. The California Current system: the seasonal variability of itsphysical characteristics. J. Geophys. Res. 92, 12947–12966.
Mais, K.F., 1974. Pelagic fish surveys in the California Current. Calif. Dep. Fish Game FishBull. 162, 1–79.
Michener, R.H., Kaufman, L., 2007. Stable isotope ratios as tracers in marine food webs: anupdate. In: Michener, R.H., Lajtha, K. (Eds.), Stable Isotopes in Ecology and Environ-mental Science. Blackwell Publishing, Malden, MA, USA, pp. 238–282.
Moran, M.D., 2003. Arguments for rejecting the sequential Bonferroni in ecologicalstudies. Oikos 100, 403–405.
108 R.D. Carle et al. / Journal of Marine Systems 146 (2015) 99–108
Nakagawa, S., 2004. A farewell to Bonferroni: the problems of low statistical power andpublication bias. Behav. Ecol. 15, 1044–1045.
Nelson, B., 1980. Seabirds: Their Biology and Ecology. Hamlyn Publishing Group, London,UK.
Ostrand, W.D., Gotthardt, T.A., Howlin, S., Robards, M.D., 2005. Habitat selection modelsfor Pacific sand lance (Ammodytes hexapterus) in Prince William Sound, Alaska.Northwest. Nat. 86, 131–143.
Paredes, R., Jones, I.L., Boness, D.J., Tremblay, Y., Renner, M., 2008. Sex-specific differencesin diving behaviour of two sympatric Alcini species: thick-billed Murres andRazorbills. Can. J. Zool. 86, 610–622.
Peck, D.R., Congdon, B.C., 2006. Sex-specific chick provisioning and diving behavior in theWedge-tailed Shearwater Puffinus pacificus. J. Avian Biol. 37, 245–251.
Perneger, T.V., 1998. What's wrong with Bonferroni adjustments. Br. Med. J. 316,1236–1238.
Phillips, D.L., Gregg, J.W., 2003. Source partitioning using stable isotopes: coping with toomany sources. Oecologia 136, 261–269.
Phillips, R.A., McGill, R.A.R., Dawson, D.A., Bearhop, S., 2011. Sexual segregation indistribution, diet, and trophic level of seabirds: insights from stable isotope analysis.Mar. Biol. 158, 2199–2208.
Pinnegar, J.K., Pulanin, N.V.C., 1999. Differential fractionation of δ13C and δ15N amongfish tissues: implications for the study of trophic interactions. Funct. Ecol. 13,225–231.
Pyle, P., 2008. Identification Guide to North American Birds, Part 2. Slate Creek Press,Bolinas, CA, USA.
Quillfeldt, P., Masello, J.F., Hamer, K.C., 2004. Sex differences in provisioning rules andhonest signaling of need in Manx Shearwaters, Puffinus puffinus. Anim. Behav. 68,618–620.
Quillfeldt, P., Bugoni, L., McGill, R.A., Masello, J.F., Furness, R.W., 2008. Differences in stableisotopes of blood and feathers in seabirds are consistent across species, age, andlatitude: implications for food web studies. Mar. Biol. 155, 593–598.
Ralston, S., Sakuma, K.M., Field, J.C., 2013. Interannual variation in juvenile rockfish(Sebastes spp.) abundance—going with the flow. Fish. Oceanogr. 22, 288–308.
Richardson, F., 1961. Breeding biology of the Rhinoceros Auklet on Protection Island,Washington. Condor 63, 456–473.
Ruiz-Cooley, R.I., Garcia, K.Y., Hetherington, E.D., 2011. Effects of lipid removal and preser-vatives on carbon and nitrogen stable isotope ratios of squid tissues: implications forecological studies. J. Exp. Mar. Biol. Ecol. 407, 101–107.
Santora, J.A., Field, J.C., Schroeder, I.D., Sakuma, K.M., Wells, B.K., Sydeman,W.J., 2012. Spa-tial ecology of krill, micronekton and top predators in the central California Current:implications for defining ecologically important areas. Prog. Oceanogr. 106, 154–174.
Schwing, F.B., Husby, D.M., Garfield, N., Tracy, D.E., 1991. Mesoscale oceanic response towind events off central California in spring 1989: CTD surveys and AVHRR imagery.Calif. Coop. Ocean. Fish. Investig. Rep. 32, 47–62.
Sears, J., Hatch, S.A., O'Brien, D.M., 2009. Disentangling effects of growth and nutritionalstatus on seabird stable isotope ratios. Oecologia 159, 41–48.
Smith, P.E., Ahlstrom, E.H., Casey, H.D., 1970. The saury as a latent resource of theCalifornia Current. Calif. Coop. Ocean. Fish. Investig. Rep. 14, 88–130.
Soto, K.H., Trites, A.W., Arias-Schreiber, M., 2004. The effects of prey availability on pupmortality and the timing of birth of South American sea lions (Otaria flavescens) inPeru. J. Zool. 264, 419–428.
Sorensen, M.C., Hipfner, J.M., Kyser, T.K., Norris, D.R., 2009. Carry-over effects in a Pacificseabird: stable isotope evidence that pre-breeding diet quality influences reproduc-tive success. J. Anim. Ecol. 78, 460–467.
Takahashi, A., Kuroki, M., Niizuma, Y., Kato, A., Saitoh, S., Watanuki, Y., 2001. Importanceof the Japanese anchovy (Engraulis japonicus) to breeding Rhinoceros Auklets(Cerorhinca monocerata) on Teuri Island, Sea of Japan. Mar. Biol. 139, 361–371.
Thayer, J.A., Sydeman, W.J., 2007. Spatio-temporal variability in prey harvest and repro-ductive ecology of a piscivorous seabird, Cerorhinca monocerata, in an upwellingsystem. Mar. Ecol. Prog. Ser. 329, 253–265.
Tian, Y., Ueno, Y., Suda, M., Akamine, T., 2004. Decadal variability in the abundance ofPacific saury and its response to climatic/oceanic regime shifts in the northwesternsubtropical Pacific during the last half century. J. Mar. Syst. 52, 235–257.
Tseng, C., Su, N., Sun, C., Punt, A.E., Yeh, S., Liu, D., Su, W., 2013. Spatial and temporalvariability of the Pacific saury (Cololabis saira) distribution in the northwesternPacific Ocean. J. Mar. Sci. 70, 991–999.
Uttely, J.D., Walton, P., Monaghan, P., Austin, G., 1994. The effects of food abundance onbreeding performance and adult time budgets of Guillemots Uria aalge. Ibis 136,205–213.
Vermeer, K., 1979. Nesting requirements, food and breeding distribution of RhinocerosAuklets, Cerorhinca monocerata and Tufted Puffins, Lunda cirrhata. Ardea 67, 101–110.
Vermeer, K., 1980. The importance of timing and type of prey to reproductive success ofRhinoceros Auklets Cerorhinca monocerata. Ibis 122, 343–350.
Wagner, R.H., 1997. Differences in prey species delivered to nestlings by male and femaleRazorbills Alca torda. Seabird 19, 58–59.
Weimerskirch, H., 1998. How can a pelagic seabird provision its chick when relying on adistant food resource? Cyclic attendance at the colony, foraging decision, and bodycondition in Sooty Shearwaters. J. Anim. Ecol. 67, 99–109.
Weimerskirch, H., 2007. Are seabirds foraging for unpredictable resources? Deep-Sea Res.II 54, 211–223.
Welcker, J., Steen, H., Harding, A.M., Gabrielsen, G.W., 2009. Sex-specific provisioningbehaviour in a monomorphic seabird with a bimodal foraging strategy. Ibis 151,502–513.
Wells, B.K., Schroeder, I.D., Santora, J.A., Hazen, E.L., Bograd, S.J., Bjorkstedt, E.P., Loeb, V.J.,McClatchie, S., Weber, E.D., Watson, W., Thompson, A.R., et al., 2013. State of theCalifornia Current 2012–13: no such thing as an “average” year. Calif. Coop. Ocean.Fish. Investig. Rep. 54, 37–71.
Wiggins, D.A., Morris, R.D., 1987. Parental care of the Common Tern Sterna hirundo. Ibis129, 533–540.
Wylie Echevarria, T., 1987. Thirty-four species of California rockfishes: maturity andseasonality of reproduction. Fish. Bull. 85, 229–250.