evaluating the feasibility of crested auklet … report – 2009 summer field activity evaluating...
TRANSCRIPT
Summary report – 2009 summer field activity
Evaluating the feasibility of Crested Auklet enhancement via habitat restoration at Gareloi Island, Aleutian Islands For
Keesal, Young & Logan & Polaris Applied Sciences Melinda Conners1 and Ian L. Jones2
1 [email protected], Center for Ocean Health, Long Marine Lab, University of California
Santa Cruz, CA 91321
2 [email protected], Department of Biology, Memorial University
St. John's, Newfoundland, A1B 3X9, CANADA
The Selendang Ayu Trustee Council has requested advise on mitigation actions to restore
seabirds impacted directly by the Selendang Ayu oil spill of December 8, 2004. Thousands of
Crested Auklets (Aethia cristatella) are believed to have died as a result of the spill. Improving
Crested Auklet breeding habitat is a possible option for restoring natural resources damaged
by the spill.
This report discusses an experiment to evaluate the effectiveness of direct enhancement of
breeding habitat structure at an active auklet colony. Auklets (Aethia spp.) nest in rock
crevices produced by coastal erosion (talus slopes and beaches) and in blocky and porous
lava flows (http://www.mun.ca/serg/AAHab.html). In the Aleutian Islands, where most of
Alaska’s Crested Auklets nest, colony sites occur on recent lava flows and talus. Re-
vegetation of exposed rock (plant succession - http://www.mun.ca/serg/succession1.html)
occurs within decades of a lava flow or seismic event, covering and eventually rendering a
site unsuitable for auklet nesting activity. Auklets are therefore limited by the amount of
freshly exposed rock with suitable crevices (they are unable to dig their own breeding sites),
especially in the Aleutians that are at the southern limit of their breeding range and subject to
a mild wet climate that facilitates plant growth. Kiska Island (major lava dome eruption
1966-1968) has the largest patch of fresh lava of any auklet colony in the Aleutians, but has
introduced Norway rats (Rattus norvegicus) that predate auklets, sometimes severely. Rat-free
Gareloi Island (many auklets nesting in lava from a 1938 eruption) has the next largest
amount of suitable habitat, mostly covered with advancing vegetation Jones and Hart 2006).
This report describes the first phase of a project to test the effectiveness of direct modification
of habitat at the Gareloi Island auklet colony – i.e., by creating new rock crevice habitat at a
colony affected by advanced plant succession. An assumption is that breeding habitat is
limited at Gareloi due to encroachment of vegetation, preventing some Crested Auklets from
nesting. We are testing the hypothesis that provision of new suitable breeding habitat at the
colony site will produce extra Crested Auklets to replace those killed by the oil spill.
This report briefly summarizes fieldwork at Gareloi Island during June 12 – August 11, 2009.
The aims of this part of the project included: 1) find and mark Crested Auklet study plots at
the Southeast Colony for experimental habitat restoration; 2) measure Crested Auklet activity
on the study plots, including surface attendance, estimate of number of individuals breeding
and number of visible breeding sites, and 3) describe the vegetative characteristics and auklet
nesting densities within the study plots. Ultimate aims of the project (future work in 2010
and onwards) will be 4) to measure relative movement of breeding and non-breeding Crested
Auklets from the existing colony to the experimentally modified habitat, 5) to measure the
(net) number of new Crested Auklet breeding opportunities created, 6) (using population
models) infer the number (bird-years) created, and 7) to thereby determine the viability, form
and extent of habitat enhancement required to replace the Crested Auklet bird-years lost due
to the Selendang Ayu oil spill.
Methods
A. Study Plot Establishment
To establish study areas in which Created Auklet responses to vegetation
manipulation could be maximally assessed, four 10m x 20m ‘moderate density’ study plots
were established along the edges of the Gareloi SE colony in areas of moderate bird density,
each divided into two halves and delineated so that both halves were similar to each other in
terms of vegetation and surface characteristics, as well appearing to have a similar occupation
by Crested Auklets (based on preliminary observations of surface activity). One half of each
plot (randomly selected) was experimentally de-vegetated by the manipulation crew during
autumn 2009, and the other half (left undisturbed) will serve as the control. To attempt to
identify unoccupied sites areas that would maximally benefit from vegetation manipulation,
an additional four 10m x 10m plots were delineated on areas of the hillside and valley
adjacent to the colony in areas that were 100% vegetated and that had little to no auklets
using the area for breeding (‘unoccupied plots’). Small portions of vegetation were stripped
away to check for suitable breeding habitat under the vegetation, and all four plots were set
up in areas that appeared to contain some lava substrate with potential nesting habitat. These
10m x 10m plots were also divided into quadrants to quantify vegetation characteristics.
Additionally, the plots were assessed for the percentage of habitat within the plot that could
have potentially been used by breeding auklets the 2009 breeding season.
B. Nest Mapping
To quantify Crested Auklet breeding activity inside each moderate density plot, we located
Crested and Least Auklet active breeding sites (‘nests’, indicated by the presence of an
incubating adult or an egg in an appropriate location) within the plot boundaries and marked
these on hand drawn maps. Nests were found by checking every accessible crevice inside the
plot from early June through late-July. ‘See Snake’ devices (handheld video/camera hose)
were used to view difficult-to-see crevices. As the colony substrate is composed of porous
lava rock, we suspected that only a small proportion of nests on any plot would be directly
visible, but that the number and location of nests found would provide a valuable measure
for before/after comparisons.
C. Capture-Mark-Recapture: Banding
In order to quantify numbers of individuals using the ‘moderate density’ study plots before
manipulation, Crested Auklets were trapped with noose carpets as early as possible in the
study period. Trapped birds were fitted with a unique combination of three Darvic colored
plastic leg bands and assessed for sex, age and breeding status (via the presence or absence of a
brood patch). Basic morphometrics (culmen length and bill depth) were also recorded to infer the
sex of the bird (Jones 1993). We aimed to trap and band approximately the same number of
Crested Auklets in both halves of each ‘moderate density’ plot.
Capture-Mark-Recapture: Surface Counts
In order to estimate the population of Crested Auklets using each plot, we measured the ratio
of banded to unbanded birds seen on the surface of each plot (Table 5). Since the number of
marked birds present was known, this ratio may provide an estimate of the number of
individual birds using an area. We conducted as many counts as possible on each plot, to
obtain a mean value of the ratio that best reflected the true proportion of Crested Auklets on
each plot. Counts of banded to unbanded individuals were taken every 10 minutes for a
typical span of 3-6 hours during the morning or evening activity period (and sometimes
both). The number of Crested Auklet individuals using the surface of each plot Nsurface was
then estimated as:
Nsurface = number marked and resighted at least once x (1/(mean decimal proportion
observed marked during resighting activity))
Capture-Mark-Recapture: Count of Breeders
In order to estimate the number of breeding individuals using each plot, we measured the
ratio of banded to unbanded breeders. ‘Breeders’ were identified as Crested Auklets arriving
at each study plot with a chick meal (distended throat pouch and ‘choking’ behavior), which
were easily identified through scope or binoculars (note that this method does not detect
breeding individuals whose effort failed during the incubation or early chick-rearing stage).
Any marked individual seen delivering food at least once was identified as a ‘breeder’, and
the total number of breeding individually marked birds was determined for each plot by
watches through the chick rearing period. Cumulative counts were performed continuously
for three hours during the morning and evening activity periods. The number of Crested
Auklet individuals that reached the chick rearing stage Nbreeders on each plot was then
estimated as:
Nbreeders = number of marked birds seen delivering food at least once x 1/(mean decimal
proportion of marked to unmarked birds delivering a chick meal)
For each plot, the number of active breeding sites (i.e., breeding pairs) that reached the chick
rearing stage was thus estimated as half the number of individuals delivering chick meals
(Table 5).
Capture-Mark-Recapture: Resighting Band Combinations
Banded auklets were resighted (i.e., bands read and all band combinations observed noted
down) for three hours daily during the morning or evening activity periods in conjunction
with surface counts. We noted which plot half each banded bird was sighted for each resight.
This information in combination with resights from next season (after the manipulation) will
help quantify movement of birds between the control and manipulated halves of each study
plot as well as movement among plots.
D. Surface Activity: Reconyx Images
A time-lapse Reconyx camera was set up outside each plot (4 total) to record surface activity.
The cameras were programmed to take photos every 5 min. from 1000 – 1700 h from July 5 to
14, 2009 and from 1000 h – 0000 h from July 16 to 28, 2009. The maximum number of Crested
Auklets on the surface of each plot was recorded, along with a timestamp, for each day in
each plot.
Results
A. Study Plot Establishment
To establish study areas in which Created Auklet responses to vegetation manipulation could
be maximally assessed, four 10m x 20m ‘moderate density’ study plots (A, B, C, and D, Fig. 1)
were established (no areas of low density were found within the colony close to the beach): A
51.7544ºN 178.7567ºW (all in datum WGS 84), B 51.7540ºN 178.7569ºW, C 51.7543ºN
178.7581ºW, D 51.7540ºN 178.7586ºW (coordinates are for the northeast corner of each plot).
Plots were chosen to include the most highly vegetated areas found, but there were no areas
in the SE colony close to the beach (accessible to the manipulation crew) that were 100%
covered in vegetation, due to the exposed sides of some large rocks and hummocks. Despite
this, vegetation cover was substantial and each chosen plot was between 86% and 91%
covered in vegetation (Table 1). Each plot half was divided into quadrants (eight 5m by 5m
sections) for both vegetation and nest surveys. The majority of the vegetation in the study
plots comprised of a tall grass of the Calamagrostis or Poa genus, and with compacted areas of
short grass (Puccinellia spp.), the surface of the latter used as socializing, landing and take-off
pads for both Crested and Least Auklets (Table 1). To attempt to identify unoccupied sites
areas that would maximally benefit from vegetation manipulation, an additional four 10m x
10m plots (E, F, G, and H) were delineated on areas of the hillside and valley adjacent to the
colony in areas that were 100% vegetated and that had little to no auklets using the area for
breeding: E 51.75445ºN 178.7567ºW, F 51.7547ºN 178.7572ºW, G 51.7547ºN 178.7578ºW, H
51.7544ºN 178.7581ºW (‘unoccupied plots’, coordinates from the northeast corner of each
plot). Small portions of vegetation were stripped away to check for suitable breeding habitat
under the vegetation, and all four plots were set up in areas that appeared to contain some
lava substrate with potential nesting habitat. These 10m x 10m plots were also divided into
quadrants to quantify vegetation characteristics (Table 2). Additionally, the plots were
assessed for the percentage of habitat within the plot that could have potentially been used by
breeding auklets the 2009 breeding season. These plots were set up at the end of the field
season (late-July) after most of the chicks had already fledged, so it was not possible to
conduct a thorough nest search, but the majority of the area of all of these plots was too
vegetated to be currently occupied by any nesting auklets (Table 2).
B. Nest Mapping
Nests were found by checking every accessible crevice inside the plot from early June
through late-July (Plots A and D were not checked by See Snake as one of our units failed due
to electrical problems). As the colony substrate is composed of porous lava rock, we
encountered a honeycomb-like matrix of tunnels and crevices in the lava rock, so obviously
not every crevice could be accessed. It was likely that there were numerous nests as far as 5-8
m below the surface of the colony in this area, so only a small proportion of nests on any plot
were directly visible. At each located nest, species (Least or Crested Auklet), nest content and
nest substrate was recorded (Table 3) and the nest was mapped onto a plot map (Appendix
1). Number of visible nests provides a measure of occupancy that will be used for before and
after manipulation comparisons.
C. Capture-Mark-Recapture: banding, resighting, surface counts and ratios
A total of 614 Crested Auklets was trapped with noose carpets and color-banded during the
period June 22 to July 2, 2009 (on plot A: 153, B: 154, C: 152, D:155) (Table 4). Forty six percent
of the marked birds were later resighted at least once.
Surface counts of banded and unbanded Crested Auklets were performed as soon as banding
was completed (July 3, 2009) until the surface activity dropped so low as to make the count
unproductive (July 26, 2009). The mean proportion of banded (marked) birds standing on the
surface of each plot was as follows: A: 0.02, B: 0.03, C: 0.03, D: 0.03. Thus the number of
individuals using each plot (Nsurface) was estimated as: A: 4600, B: 2033, C: 1967, D: 2333 (Table
4).
To obtain an estimate of the proportion of breeding birds that were marked, cumulative
counts or Crested Auklets (banded and unbanded) delivering chick meals were performed
continuously for three hours during the morning and evening activity periods (sometimes
both) from July 3, 2009 until July 26, 2009. The mean proportion of banded (marked) birds
among Crested Auklets delivering food was as follows: A: 0.05, B: 0.04, C: 0.06, D: 0.04. Thus
the number of individuals ‘breeding’ on each plot (Nbreeders) was estimated as: A: 1100, B: 750,
C: 600, D: 375 (Table 4) and number of nests (pairs) as: A: 550, B: 375, C: 300, D: 188.
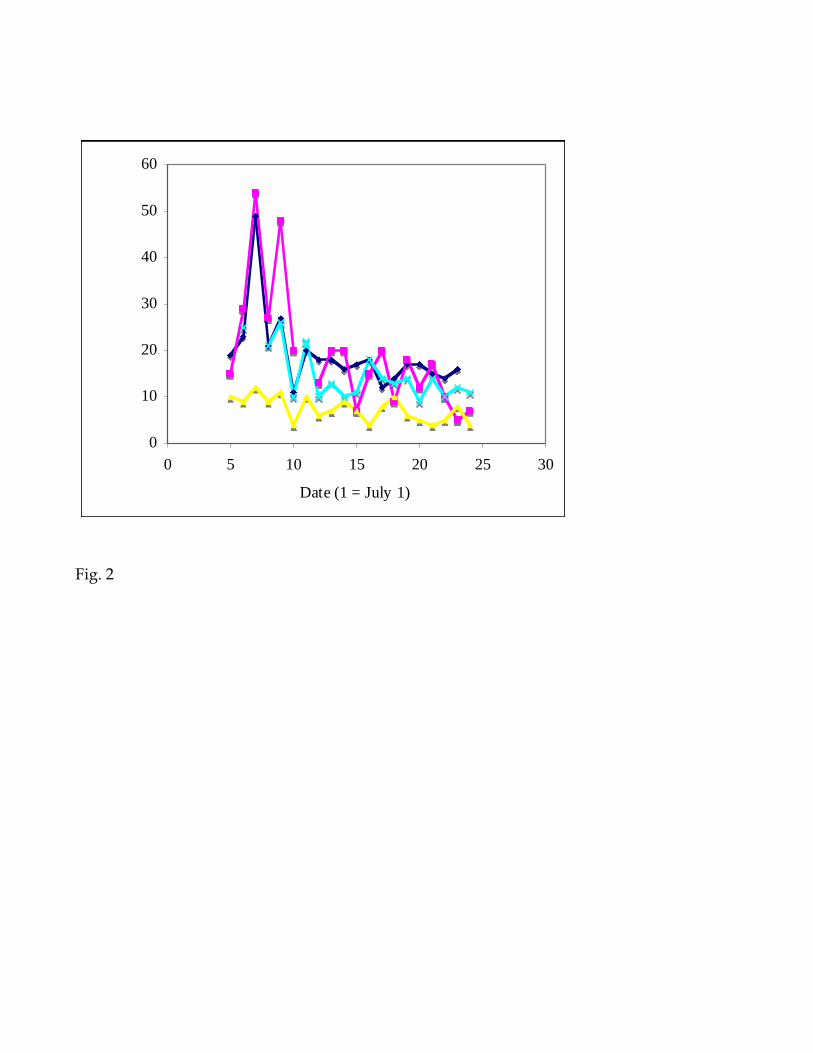
D. Surface Activity: Reconyx Images
The maximum number of Crested Auklets on the surface of each plot for each day (Fig. 2)
dropped off colony-wide starting about July 12, 2009. There was also a two-week bout of
inclement weather with very strong winds and rain in mid to late July that was associated
with lower surface activity.
Discussion
The field crew successfully delineated eight study plots (four referred to as ‘moderate
density’ and four ‘unoccupied’) according to the protocol developed with input from our
collaborators. The area of the southeast colony chosen for plot selection was that close to the
shoreline, overlapping and within the eastern limits of the high density (red dots on plot
map, Jones and Hart 2006, Fig. 1). The rationale for selection of this area emphasized two
objectives: 1) ease of access to the shoreline and a potential landing beach for equipment that
might be used in habitat modification, and 2) presence of nesting Crested Auklets in areas of
moderate to complete overgrowth of the colony site by vegetation. Areas of heavy vegetation
overgrowth blocking Crested Auklet access to underlying porous lava (or other geological
features providing crevices suitable for nesting) would provide optimal opportunity for
habitat modification to restore Crested Auklets.
Among the four ‘moderate density’ plots selected, two (A and B) were located close to survey
plots (Jones and Hart 2006) classed as medium auklet density (11-100 active nests per 100 m2),
one (C) was close to the colony boundary delineated in 2006 and approximately equidistant
from a high density (>100 active nests per 100 m2) and low density (1-10 active nests per 100
m2), and one (D) was located almost exactly at the location of a high density plot (>100 active
nests per 100 m2) from the 2006 survey.
Forty six % of the 614 Crested Auklets color-marked on the four plots were resighted at least
once on the plots. This proportion reflects the proportion of birds marked that were plot
residents, and also was likely to be affected by observer effort and tendency of birds to stand
visibly on the surface (and thus have their color marks read). A resight rate of 46% was
somewhat lower that the proportion expected based on studies at Buldir and Kiska (ILJ), but
probably reflects two factors present at Gareloi: 1) deep complex porous underlying habitat
with a lack of suitable display rocks on the surface for birds to stand around on and show
their marks, and 2) limited time for the four observers to deploy resighting effort (more effort
= higher resight proportion expected). The Reconyx camera data suggest the first factor may
have been most important, as peak numbers recorded standing (e.g., 49 birds for Plot A) were
low relative to the total numbers of individuals present. Nevertheless, the capture-mark-
resight (CMR) data obtained was of sufficient quality to estimate numbers of birds present on
the four plots (A: 4600, B: 2033, C: 1967, D: 2333, Table 4). These numbers suggest the study
plots all had high densities of Crested Auklets. Estimated numbers of breeding pairs (A: 550,
B: 375, C: 300, D: 188) were also indicative of high densities of nesting Crested Auklets.
Comparing the estimated number of breeding pairs to nests actually found during nest
searches suggested that about ¼ of nests on each plot were visible, except for plot D in which
more nests were found than predicted by CMR (A: 550/138 (25% of ‘nests’ found), B: 375/97
(26% of ‘nests’ found), C: 300/84 (28% of ‘nests’ found), D: 188/216 (more nests found than
CMR prediction!)). The observation of more nests found than predicted by CMR at plot D
suggests the presence of nocturnally active or otherwise unmarkable and unresightable
individuals – hence the use of multiple methods of estimatin Crested Auklet numbers.
At a productivity level (chicks fledged per nest per breeding season) of 0.5, Crested Auklet
chick production at the study plots would be A: 275, B: 188, C: 150, D: 94 (based on CMR
derived estimates on nest number. Expressed as chicks produced per 100 m2 of colony
surface area this is A: 138, B: 94, C: 75, D: 47, or on average 88 fledged chicks per 100 m2 of
colony surface area in this area of the Southeast Colony, Gareloi Island. This shows
remarkable correspondence to the density estimates from Jones and Hart’s (2006) survey.
Crested Auklet density at the four capture-mark-resight (CMR) plots was very high – these
turned out to be as high density areas as are thought to occur at any Aleutian Auklet colony.
Are such sites likely to benefit (in terms of increased Crested Auklet chick production) from
habitat modification? If removal of surface vegetation and soil allows birds access to crevices
previously inaccessible then numbers of birds nesting would be expected to increase in 2010.
If removal of surface vegetation and soil destroyed some nest sites, failed to give access to
new sites, or indirectly caused disturbance to breeding birds then numbers of birds nesting
would be expected to decrease in 2010. Our BACI experimental design was devised to test
which of these possibilities is correct for the plots selected and habitat modification employed
– the answer will be available upon completion of 2010 fieldwork, with the following
measures for before-after comparisons for each of plots ABCD:
Maximum daily surface counts of Crested Auklets (Reconyx cameras)
Count of visible Crested Auklet active nest sites (nest search)
CMR estimate of number of individual Crested Auklets using each plot (Nsurface)
CMR estimate of number of Crested Auklets nesting on plot (Nbreeding)
CMR estimate of movement onto manipulated half of plot
As an additional option:
Productivity (chicks fledged per nest)
If habitat modification turns out to increase chick production by 5%, then an extra
production of 4 chicks per 100 m2 of habitat modified per year would be expected, based on
all the assumptions made for the calculations above. We believe habitat modification is likely
to be more effective if employed at sites with greater vegetation/soil cover and lower auklet
nesting densities (i.e., 1-10 breeding pairs per 100 m2) than plots ABCD. Habitat modification
at the unoccupied plots EFGH would be expected to be more effective, if these sites’
underlying geology includes crevices suitable for Crested Auklet nesting.
Acknowledgements
We thank Joshua Cripps, Caroline Poli, and Nathan Banfield for assistance with fieldwork,
and the many folk who made useful suggestions regarding study design, especially Gary
Mauseth and George Divoky. Randy Henry, Howard Hile, Greg Challenger and Nancy
Gudonis provided crucial assistance with the technical preparations. Vessel support was
provided by the captain and crew of the ‘F/V North Pacific’ based at Adak.
References
Jones, I.L. 1993. Sexual differences in bill shape and external measurements of the Crested
Auklet. Wilson Bulletin 105: 525-529.
Jones, I.L. and K.A. Hart. 2006. A survey of inland Least and Crested Auklet breeding
colonies at Gareloi Island in the Delarof Islands, Aleutian Islands, Alaska during 2006.
Unpublished report for AMNWR, 31 pp. (downloadable at:
http://www.mun.ca/serg/Gareloi_REPORT.pdf)
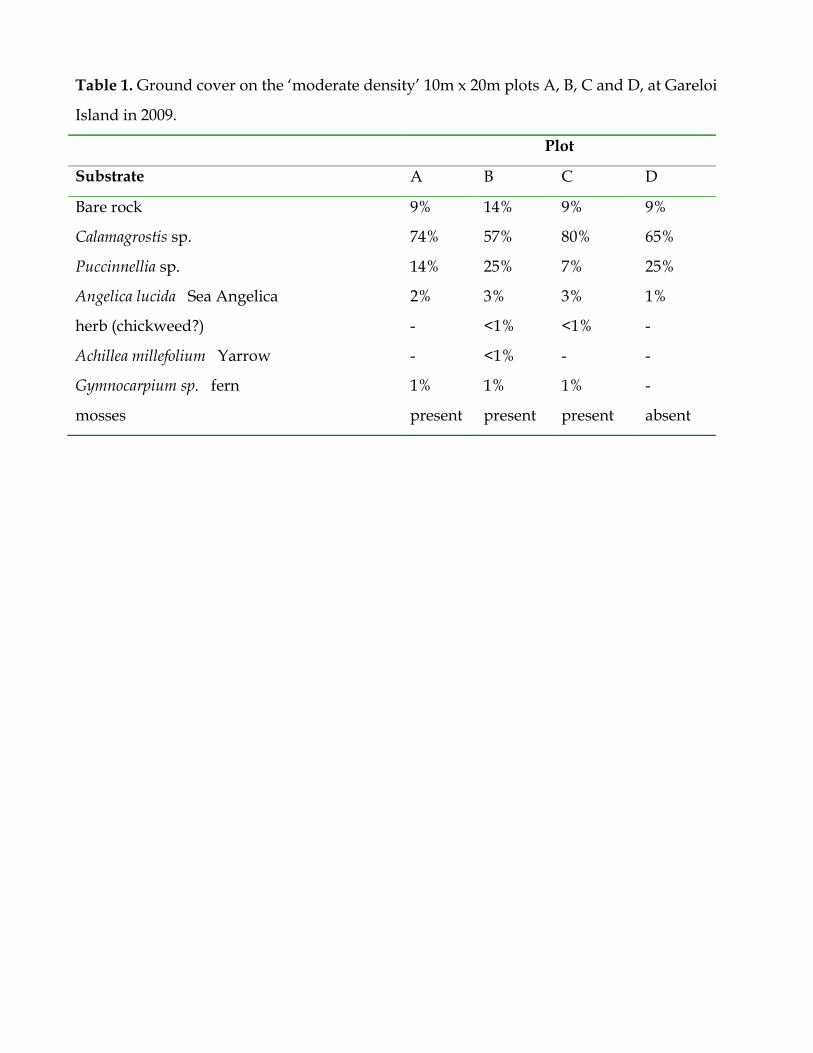
Table 1. Ground cover on the ‘moderate density’ 10m x 20m plots A, B, C and D, at Gareloi
Island in 2009.
Plot
Substrate A B C D
Bare rock 9% 14% 9% 9%
Calamagrostis sp. 74% 57% 80% 65%
Puccinnellia sp. 14% 25% 7% 25%
Angelica lucida Sea Angelica 2% 3% 3% 1%
herb (chickweed?) - <1% <1% -
Achillea millefolium Yarrow - <1% - -
Gymnocarpium sp. fern 1% 1% 1% -
mosses present present present absent
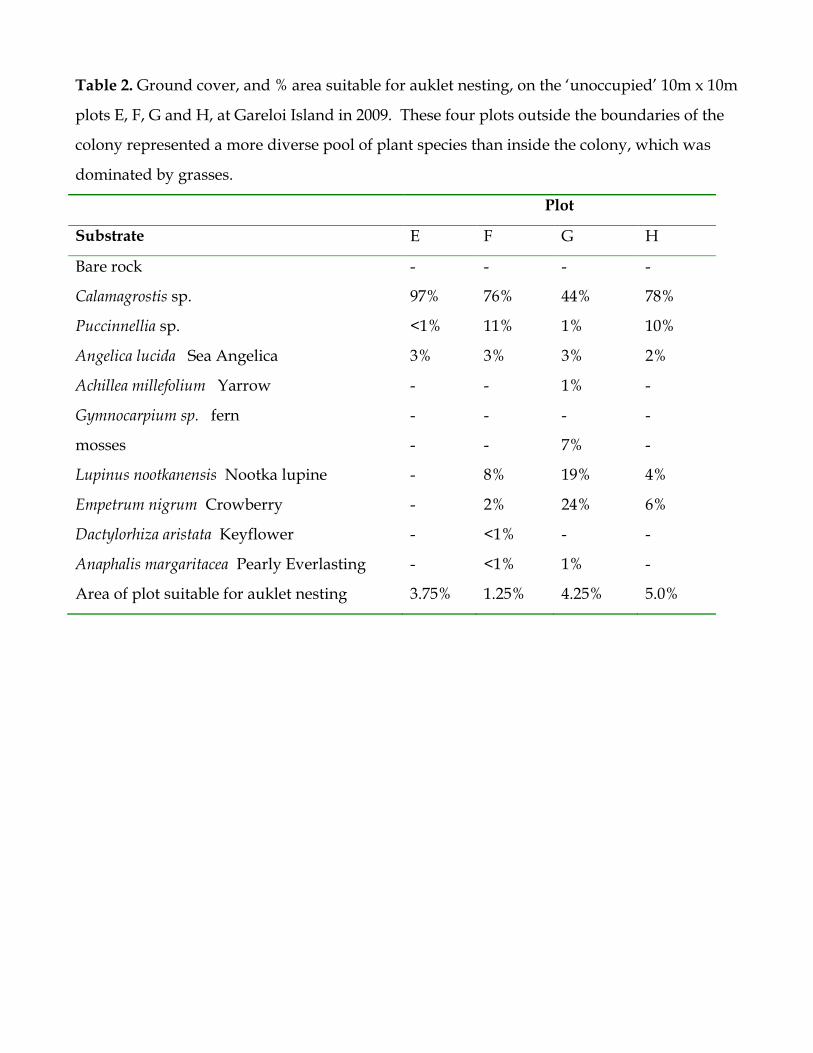
Table 2. Ground cover, and % area suitable for auklet nesting, on the ‘unoccupied’ 10m x 10m
plots E, F, G and H, at Gareloi Island in 2009. These four plots outside the boundaries of the
colony represented a more diverse pool of plant species than inside the colony, which was
dominated by grasses.
Plot
Substrate E F G H
Bare rock - - - -
Calamagrostis sp. 97% 76% 44% 78%
Puccinnellia sp. <1% 11% 1% 10%
Angelica lucida Sea Angelica 3% 3% 3% 2%
Achillea millefolium Yarrow - - 1% -
Gymnocarpium sp. fern - - - -
mosses - - 7% -
Lupinus nootkanensis Nootka lupine - 8% 19% 4%
Empetrum nigrum Crowberry - 2% 24% 6%
Dactylorhiza aristata Keyflower - <1% - -
Anaphalis margaritacea Pearly Everlasting - <1% 1% -
Area of plot suitable for auklet nesting 3.75% 1.25% 4.25% 5.0%
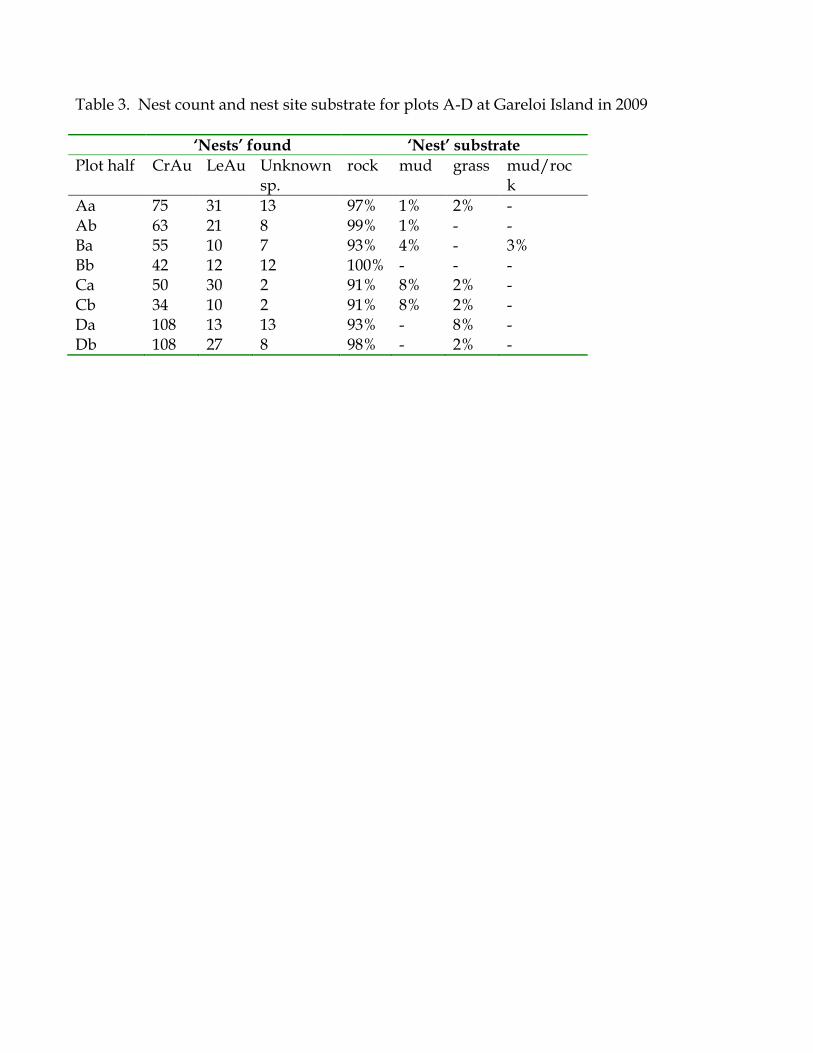
Table 3. Nest count and nest site substrate for plots A-D at Gareloi Island in 2009
‘Nests’ found ‘Nest’ substrate
Plot half CrAu LeAu Unknown sp.
rock mud grass mud/rock
Aa 75 31 13 97% 1% 2% - Ab 63 21 8 99% 1% - - Ba 55 10 7 93% 4% - 3% Bb 42 12 12 100% - - - Ca 50 30 2 91% 8% 2% - Cb 34 10 2 91% 8% 2% - Da 108 13 13 93% - 8% - Db 108 27 8 98% - 2% -


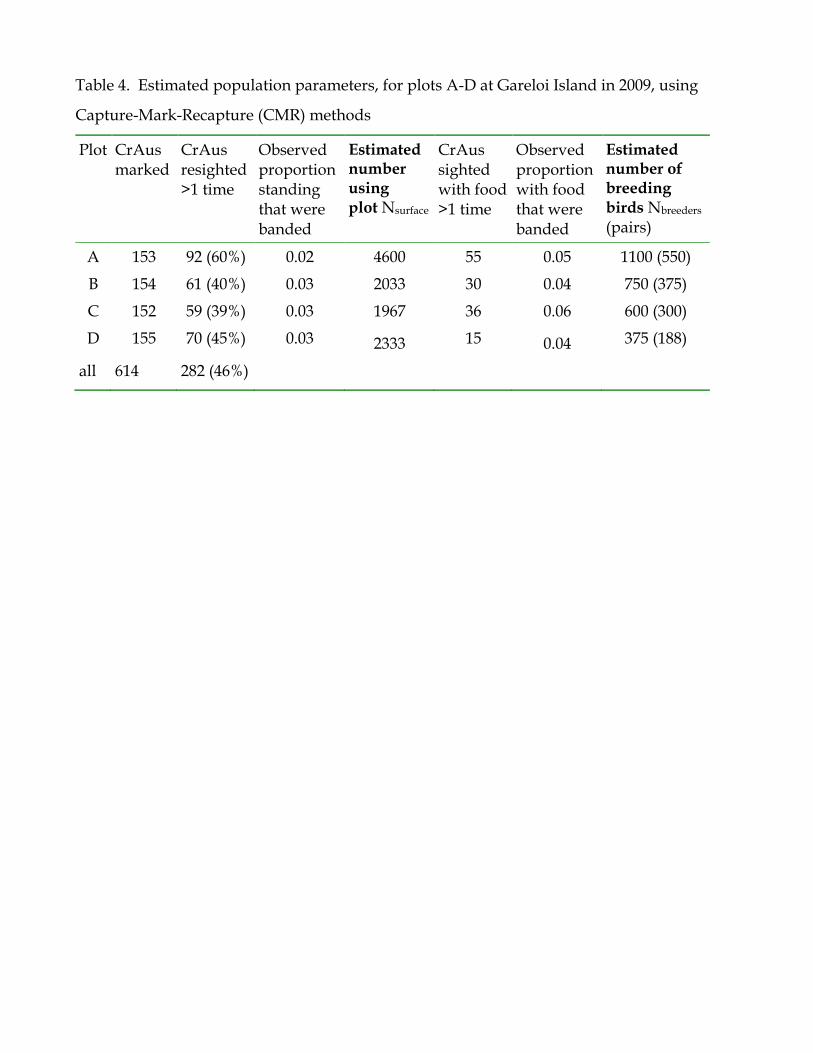
Table 4. Estimated population parameters, for plots A-D at Gareloi Island in 2009, using
Capture-Mark-Recapture (CMR) methods
Plot CrAus marked
CrAus resighted >1 time
Observed proportion standing that were banded
Estimated number using plot Nsurface
CrAus sighted with food >1 time
Observed proportion with food that were banded
Estimated number of breeding birds Nbreeders
(pairs)
A 153 92 (60%) 0.02 4600 55 0.05 1100 (550)
B 154 61 (40%) 0.03 2033 30 0.04 750 (375)
C 152 59 (39%) 0.03 1967 36 0.06 600 (300)
D 155 70 (45%) 0.03 2333 15 0.04 375 (188)
all 614 282 (46%)
Figure Captions
Fig. 1. Map showing locations of ‘moderate density’ plots A-D (black dots and lettering) and
‘unoccupied’ plots F-I (purple dots and lettering) at Gareloi Island, Alaska, superimposed on
the Southeast Colony auklet colony map from Jones and Hart (2006, red dots - high density,
orange - medium density, yellow - low density, small black dots – absent).
Fig. 2. Maximum daily surface counts for Crested Auklets at plots A (dark blue), B (purple),
C (yellow), D (light blue) at Gareloi Island, Alaska during July 5 - 25, 2009. Maximum surface
counts were obtained from Reconyx images every 5 min. from 1000 h to 1700 h daily. Study
plots were divided into two equal halves and surface counts for each half were also recorded
(not shown).
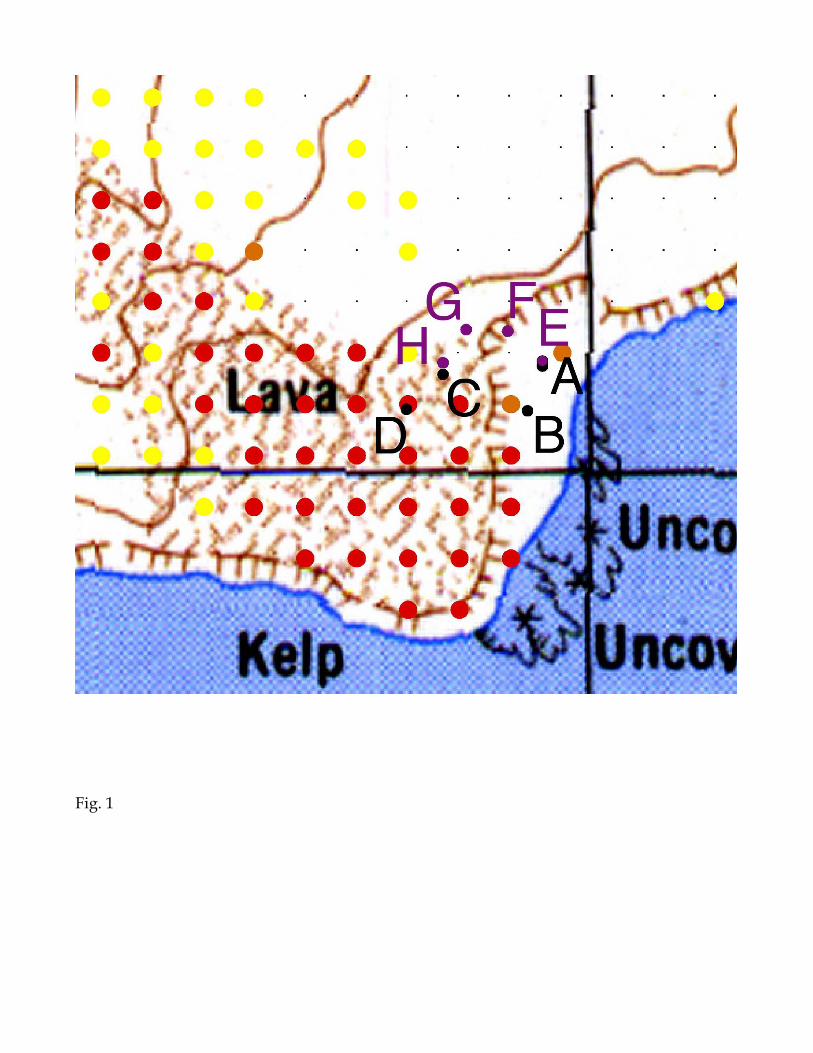
Fig. 1
0
10
20
30
40
50
60
0 5 10 15 20 25 30
Date (1 = July 1)
Max
imum
dai
ly C
rest
ed A
ukle
t
surf
ace
count
Fig. 2
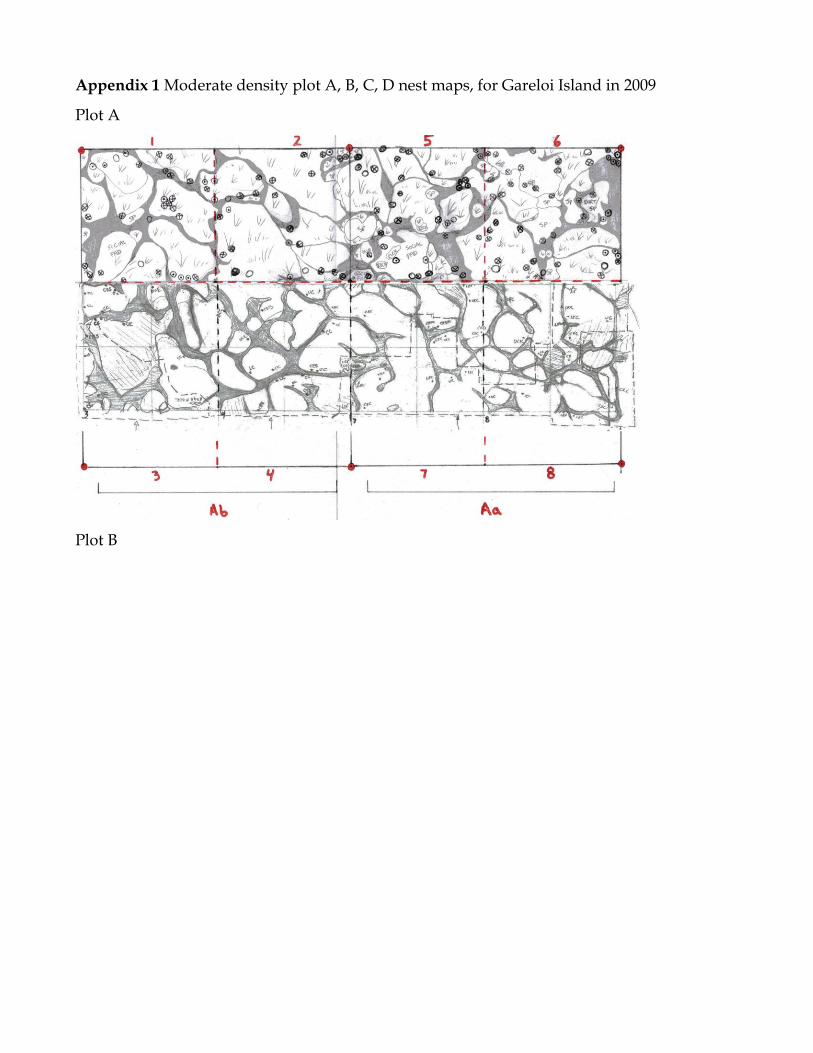
Appendix 1 Moderate density plot A, B, C, D nest maps, for Gareloi Island in 2009
Plot A
Plot B
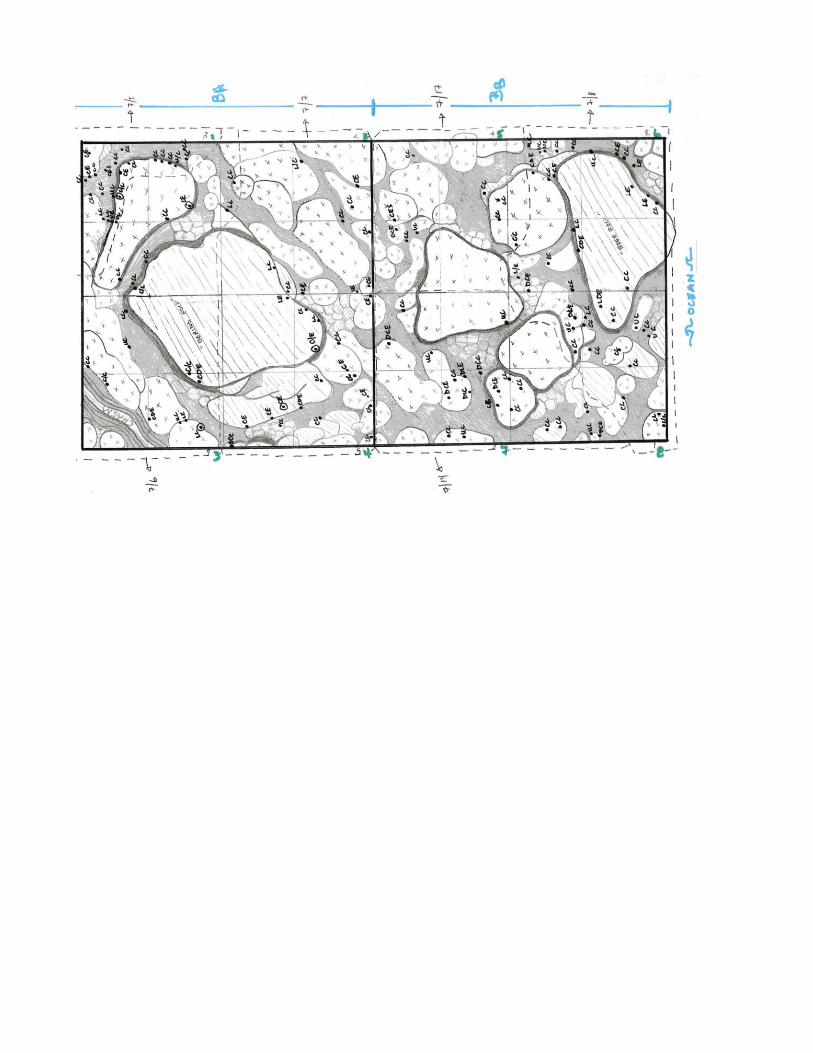
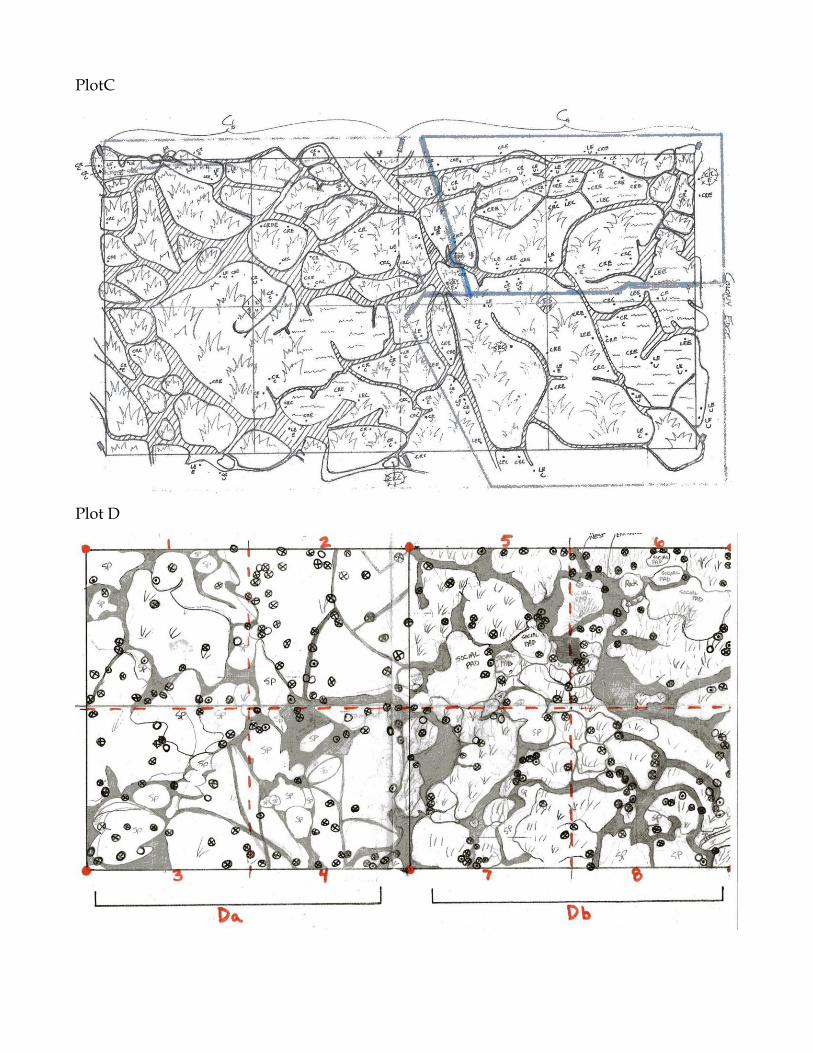
PlotC
Plot D
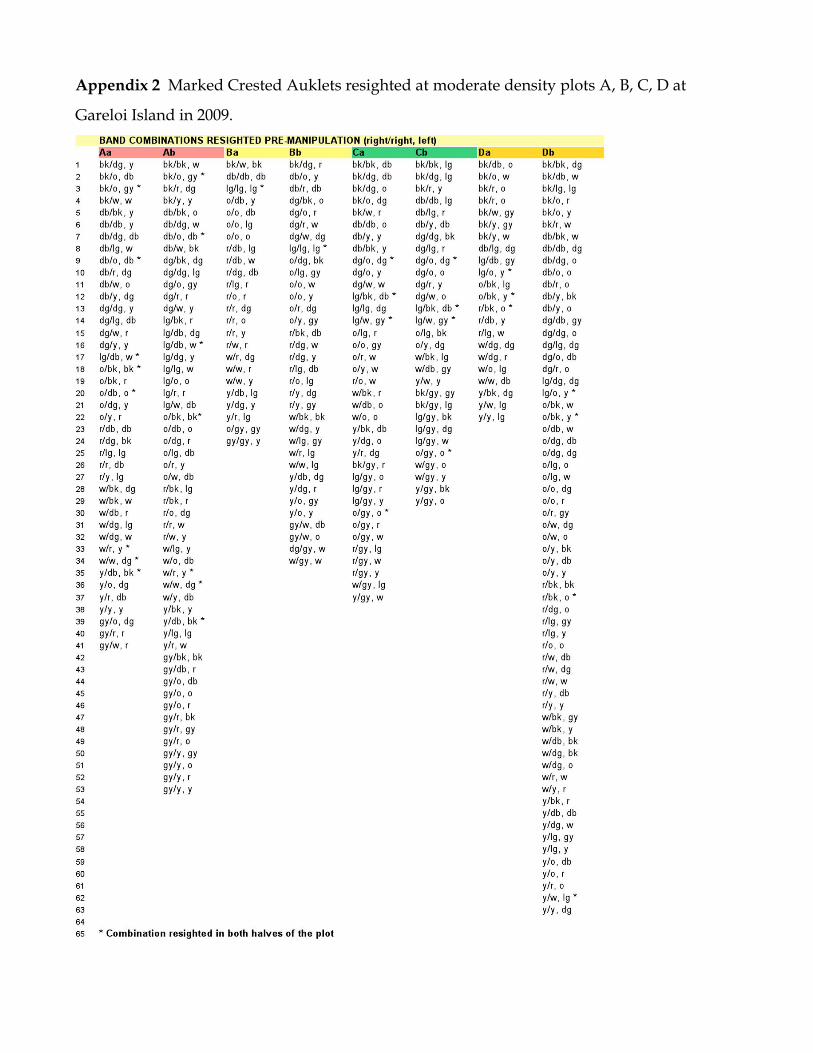
Appendix 2 Marked Crested Auklets resighted at moderate density plots A, B, C, D at
Gareloi Island in 2009.
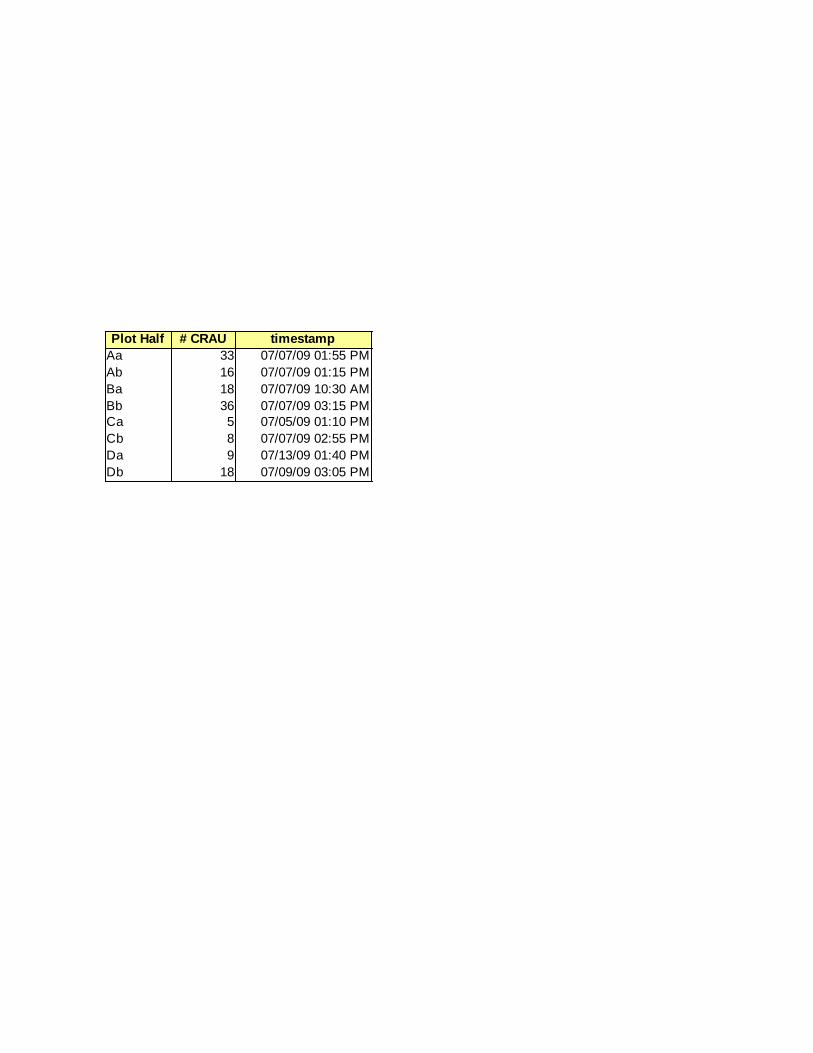
Plot Half # CRAU timestamp
Aa 33 07/07/09 01:55 PM
Ab 16 07/07/09 01:15 PM
Ba 18 07/07/09 10:30 AM
Bb 36 07/07/09 03:15 PM
Ca 5 07/05/09 01:10 PM
Cb 8 07/07/09 02:55 PM
Da 9 07/13/09 01:40 PM
Db 18 07/09/09 03:05 PM