temperature and storage age-dependence of olive … temperature and storage age-dependence of olive...
TRANSCRIPT

An-Najah National University Faculty of Graduate Studies
Temperature and Storage Age-Dependence of Olive Oil Viscosity in Different Locations in Palestine
By
Tajweed Hashim Nierat
Supervisor
Prof. Issam Rashid Abdel-Raziq Dr. Sharif Mohammad Musameh
This Thesis is Submitted in Partial Fulfillment of the Requirements for the Degree of Master of Physics, Faculty of Graduate Studies, An-Najah National University - Nablus, Palestine.
2012

ii
Temperature and Storage Age-Dependence of Olive Oil Viscosity in Different Locations in Palestine
By
Tajweed Hashim Nierat
This thesis was successfully defended on 24/5/2012, and approved by:
Defense Committee Members Signature
Prof. Issam Rashid Abdel-Raziq / Supervisor ……..………… Dr. Sharif Mohammad Musameh / Co-supervisor ……..………… Dr.Abedel-Rahman Abu-Lebda / External Examiner…....……….. Dr. Mohammad Abu-Jafar / Internal Examiner …..…………… Dr. Nidal Zatar / Internal Examiner …..……………

iii
Dedication
This thesis is dedicated to my father and mother, as well as,
to my brothers and sisters.
With respect and love.
This thesis is also dedicated to Mr. Sameeh Abed Al – Azeez for his
support.

iv
Acknowledgement
I'd like to express my sincere appreciation to my supervisors,
Prof. Issam Rashid Abdel-Raziq for his helpful efforts and continual
encouragement, Dr. Sharif Mohammed Musameh, for his cooperation
which helped me in the completion of this research.
Special thanks are addressed to Chemistry Department: Dr.
Nidal Zatar, Dr. Sammar Al-Shakshir and Mr. Derar Smadi. In
addition, the members working in the laboratories of the Faculty of
Science for their cooperation, whom contributed considerably to the
completion of this work, Mr. Omir Nabulsi, Mr. Mohammad Bahjat,
Mr. Sameeh Abed Al-Azeez , Mr. Ameed Amirah, Mr. Mohammad Al-
Masri, Mr. Mohammad Al-Qareene, Mr. Nafeth Zakrea, Ms. Hana
Hanani and Ms. Ruba Awayes.
I would like to thank Dr. Mohammad Dwikat from the IT
Department and the managers of the Palestinian Meteorological
Authority in the Ministry of Transport: Issam Al-Saifee and Issam Isa,
for their cooperation in providing the required data to the completion
of this thesis. In addition thanks to Mr. Tareq sha'ar from the Public
Relations Department at Al - Najah University for his assistance in
editing the study's language. I'll not forget thanking Directorate of
Agriculture-Nablus, and Dr. Ziad Fadda, Mr. Fares Al - Jabi former
Director of the Directorate of Agriculture – Nablus.

v
اABCار
: الرسالة التي تحمل العنوانة أدناه مقدمةأنا الموقع
Temperature and Storage Age-Dependence of Olive Oil Viscosity in Different Locations in Palestine
لزوجة زيت الزيتون على درجة الحرارة اعتماد وعلى عمر التخزين في أماكن مختلفة في فلسطين
تمـت مـا باستثناء ، الخاص جهدي نتاج هو إنما الرسالة هذه عليه اشتملت ما بان اقر
درجة أية لنيل قبل من يقدم لم منها جزء أو من ككل الرسالة هذه وان ورد، حيثما إليه اإلشارة
.أخرى بحثية أو تعليمية مؤسسة أية لدى بحثي أو علمي بحث أو
Declaration
The work provided in this thesis, unless otherwise referenced, is the
researcher's own work, and has not been submitted elsewhere for any other
degree or qualification.
:Student's name :اسم الطالبة
:Signature :التوقيع
:Date :التاريخ

vi
List of Abbreviations
AAD%
ANOVA
CGS
cP
cSt
Ea
Eq.
EVOO
FFA
Fig.
IOOC
N
P
Pa
P-value
R
R2
rpm
SD
SI
SMC
SP
T
VOO
L1
L2
L3
L4
L5
L6
L7
L8
ρ
η
ν
ηcal
ηexp
percentage of average absolute deviation
Analysis of Variance
Centimeter-Gram-Second
Centipoise
Centistokes
Activation Energy
Equation
Extra Virgin Olive Oil
Free Fatty Acids
Figure
International Olive Oil Council
Newton
poise
Pascal
Probability
Gas Constant
Coefficient of Determination
Revolution Per Minute
Standard Deviation
Système International d'Unités
Spindle Multiplier Constant
Spindle
Temperature in Kelvin
Virgin Olive Oil
Jeet
saida
Alyamun
Beita
jenin
Arraba
Meithaloon
Asira Al-Shamaliyeh
Density
Dynamic Viscosity
Kinematic Viscosity
Calculated Dynamic Viscosity
Measured Dynamic Viscosity

vii
Table of Contents
Contents Page Dedication iii
Acknowledgement iv
Declaration v
List of abbreviations vi
Table of Contents vii
List of Tables ix
List of Figures xii
Abstract xiv
Chapter One: Introduction 1 1.1 Olive Oil 1
1.2 Previous Studies 1
1.2.1Viscosity as Quality Factor 1
1.2.2Acidity as Quality Factor 5
1.3 Objectives of the Study 8
Chapter Two: Theory of Viscosity 9 2.1 Viscosity Units 11
2.2 Pure-Liquid Viscosity Theories 11
2.2.1 Two-Constant Equations 13
2.2.2 Three Constant Equations 15
2.2.3 Multi-Constant Equations 16
Chapter Three: Methodology 18 3.1Experimental Apparatus 19
3.1.1Viscosity Apparatus 19
3.1.1.I Calibration of Brookfield Viscometer Model DV-I+ 19
3.1.1.II Determination of Viscosity 20
3.1.2 Temperature Apparatus 21
3.1.3 Determination of Acid Value of Olive Oil (Titrimetric
Method) 21
3.1.4 Density Apparatus 23
3.2 Quality of Olive Oil 23
3.2.1 Fatty Acid Composition of Olive Oil 24
3.2.2 Esters of fatty alcohols with fatty acids (waxes) 25
3.2.3 Trans Fatty Acids 25
3.2.4 Classification of Fatty Acids According to Chain
Length 25
3.2.5 Free Fatty Acids Percent (%FFA) or the Acidity. 26
3.3 Statistical Analysis 27
Chapter Four: Results and Analysis 30 4.1 Density Results 30

viii
Contents Page 4.2Viscosity Results 30
4.2.1 Temperature-Dependence of Dynamic Viscosity 30
4.2.1 I Yearly Basis 30
4.2.1 II weekly basis 41
4.2.1 III Olive oil Crop 2010 52
4.2.2 Storage Age-Dependence of Dynamic Viscosity 61
4.2.2 I Yearly Basis 61
4.2.2 IIWeekly Basis 64
4.3Acidity Results 66
4.3.1 Olive oil crop 2010 66
4.3.2 Storage Age Dependence of Olive Oil Acidity 68
4.3.2 I Yearly Basis 68
4.3.2 II Weekly Basis 71
Chapter Five: Discussion 75 Chapter six: Conclusion and future works 81 References 83 Appendix 89
HاIJKL ب

ix
List of Tables
No. Table Page
Table (2.1) Constants of equations 2.7 and 2.8, with temperature
range from 298.15 K to 328.15 K. 14
Table (2.2) Constants of Andrade equations given by Abramovic. 15
Table (2.3) Constants of the Antoine type equation given by
equation (2.12). 16
Table (2. 4) Constants of equation 2.14 were given by Poling. 17
Table (3. 1) Limits of free fatty acidity, as oleic acid percent, fixed
by IOOC for each olive oil category. 26
Table (3. 2) Properties and information of olive oil determined by
many studies 27
Table (4. 1) The density measurements of some olive oil samples
of this work. 30
Table (4. 2) The measured values of dynamic viscosity of olive oil
samples of two locations (L1 and L2) as a function of
temperature.
31
Table (4. 3) Our experimental values and the calculated values of
dynamic viscosity at different temperatures, using
Abramovic's formula of two-constant.
33
Table (4. 4) AAD% and SD using Abramovic's formula of two-
constant. 33
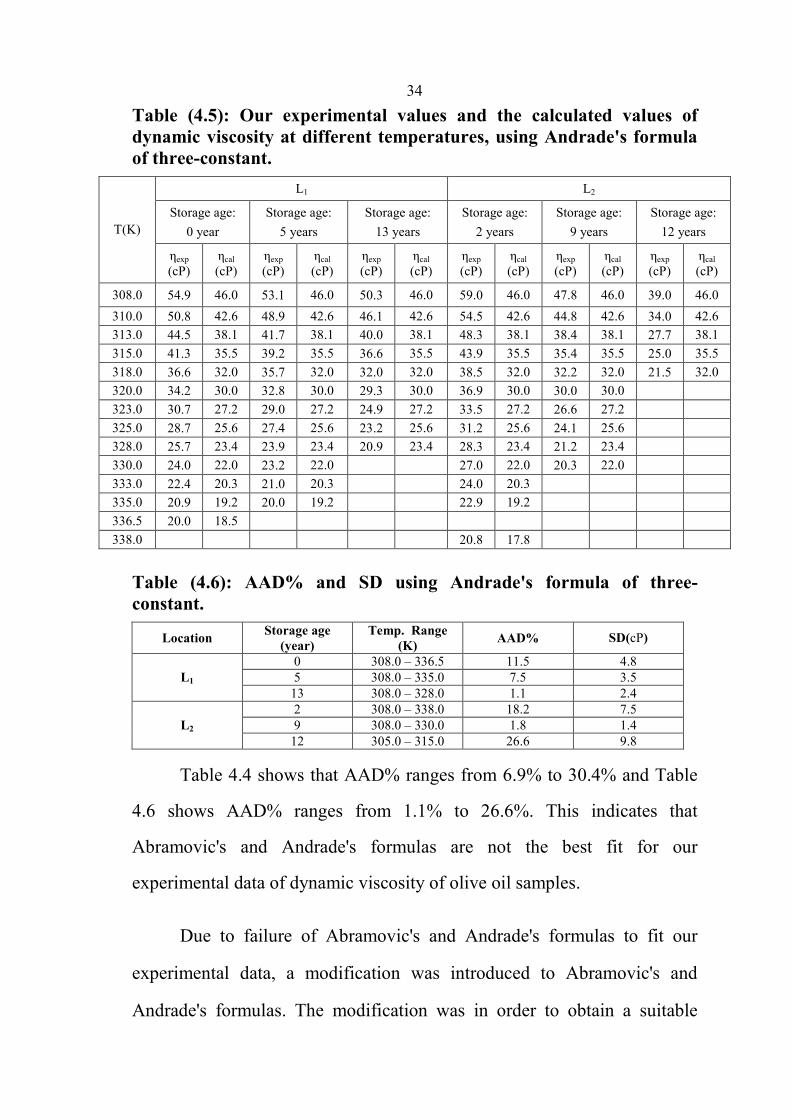
Table (4. 5) Our experimental values and the calculated values of
dynamic viscosity at different temperatures, using
Andrade's formula of three-constant.
34
Table (4. 6) AAD% and SD using Andrade's formula of three-
constant. 34
Table (4. 7) Our experimental values and our calculated values of
dynamic viscosity at different temperatures, using the
modified Abramovic's formula of two-constant.
35
Table (4. 8) Values of A, B, AAD% and SD using the modified
Abramovic's formula of two-constant. 35
Table (4. 9) Our experimental values and our calculated values of
dynamic viscosity at different temperature using the
modified Andrade's formula of three-constant.
36
Table (4. 10) Our values of A, B, C, AAD% and SD using the
modified Andrade's formula of three-constant. 36
Table (4.11) The constants given by the Abramovic using
Abramovic's and Andrade's formulas. 37
Table (4.12) Our values of A, B, C, AAD% and SD using our
proposed two-constant formula. 38
Table (4.13) Our values of A, B, C, D, E, AAD% and SD using our
proposed multi-constant formula. 38
x
No. Table Page
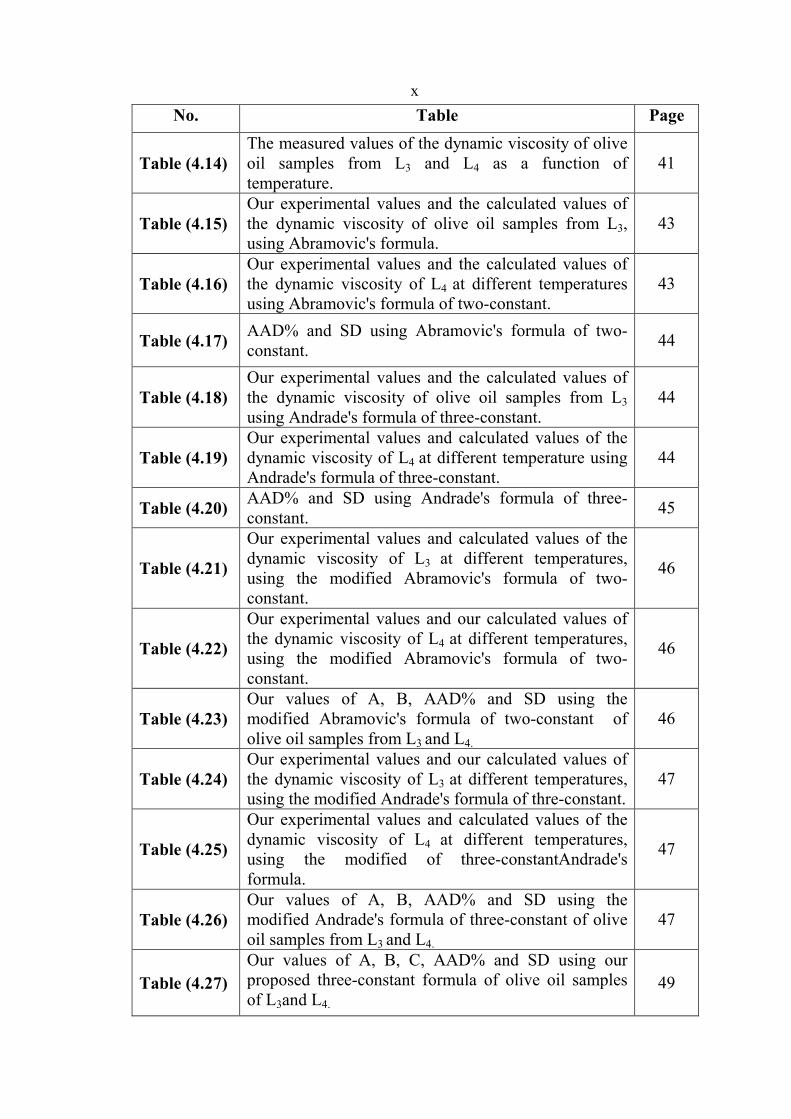
Table (4.14) The measured values of the dynamic viscosity of olive
oil samples from L3 and L4 as a function of
temperature.
41
Table (4.15) Our experimental values and the calculated values of
the dynamic viscosity of olive oil samples from L3,
using Abramovic's formula.
43
Table (4.16) Our experimental values and the calculated values of
the dynamic viscosity of L4 at different temperatures
using Abramovic's formula of two-constant.
43
Table (4.17) AAD% and SD using Abramovic's formula of two-
constant. 44
Table (4.18) Our experimental values and the calculated values of
the dynamic viscosity of olive oil samples from L3
using Andrade's formula of three-constant.
44
Table (4.19) Our experimental values and calculated values of the
dynamic viscosity of L4 at different temperature using
Andrade's formula of three-constant.
44
Table (4.20) AAD% and SD using Andrade's formula of three-
constant. 45
Table (4.21)
Our experimental values and calculated values of the
dynamic viscosity of L3 at different temperatures,
using the modified Abramovic's formula of two-
constant.
46
Table (4.22)
Our experimental values and our calculated values of
the dynamic viscosity of L4 at different temperatures,
using the modified Abramovic's formula of two-
constant.
46
Table (4.23) Our values of A, B, AAD% and SD using the
modified Abramovic's formula of two-constant of
olive oil samples from L3 and L4.
46
Table (4.24) Our experimental values and our calculated values of
the dynamic viscosity of L3 at different temperatures,
using the modified Andrade's formula of thre-constant.
47
Table (4.25)
Our experimental values and calculated values of the
dynamic viscosity of L4 at different temperatures,
using the modified of three-constantAndrade's
formula.
47
Table (4.26) Our values of A, B, AAD% and SD using the
modified Andrade's formula of three-constant of olive
oil samples from L3 and L4.
47
Table (4.27)
Our values of A, B, C, AAD% and SD using our
proposed three-constant formula of olive oil samples
of L3and L4.
49

xi
No. Table Page
Table (4.28) Our values of A, B, C, D, E, AAD% and SD using our proposed multi-constants formula.
49
Table (4.29) The measured values of dynamic viscosity of olive oil from L5 olive oil as a function of temperature.
52
Table (4.30) Our experimental values and calculated values of dynamic viscosity at different temperatures, using Abramovic's formula of two-constant.
54
Table (4.31) AAD% and SD of the data using Abramovic's formulas of two-constant.
55
Table (4.32) Our experimental values and calculated values of dynamic viscosity at different temperatures, using Andrade's formula of three-constant.
55
Table (4.33) AAD% and SD of the data using Andrade's formula of three-constant.
56
Table (4.34) Our experimental values and calculated values of dynamic viscosity at different temperatures, using the modified Abramovic’s formula of two-constant.
57
Table (4.35) Our values of A, B, AAD% and SD using the modified Abramovic’s formula of two-constant.
57
Table (4.36) Our experimental values and our calculated values of dynamic viscosity at different temperatures, using the modified Andrade’s formula of three-constant.
58
Table (4.37) Our values of A, B, C, AAD% and SD using the modified Andrade’s formula of three-constant.
59
Table (4.38) Our values of A, B, C, D and E, AAD% and SD using our proposed formula.
60
Table (4.39) The measured values of dynamic viscosity of olive oil samples from L1 and L2 as a function storage age.
61
Table (4.40) Our values of A, B, C, D and E, AAD% and SD using our proposed formula.
63
Table (4.41) The measured values of dynamic viscosity of olive oil samples from two different locations (L3 and L4) as a function storage age.
64
Table (4.42) Our values of A, B, C, D and E, AAD% and SD using our proposed formula.
65
Table (4.43) The measured values of acidity of olive oil samples of crop 2010 from different locations.
67
Table (4.44) The measured acidity values of olive oil samples from L1, L2, L6 and L7 of different storage ages.
68
Table (4.45) Our values of A, B, C, D and E, AAD% and SD using our proposed formula.
70
Table (4.46) The measured acidity values of olive oil samples from L3, L4 and L7 at different storage ages.
72
Table (4.47) Our values of A, B, C, D, E and F, AAD% and SD using our proposed formula.
73
xii
List of Figures
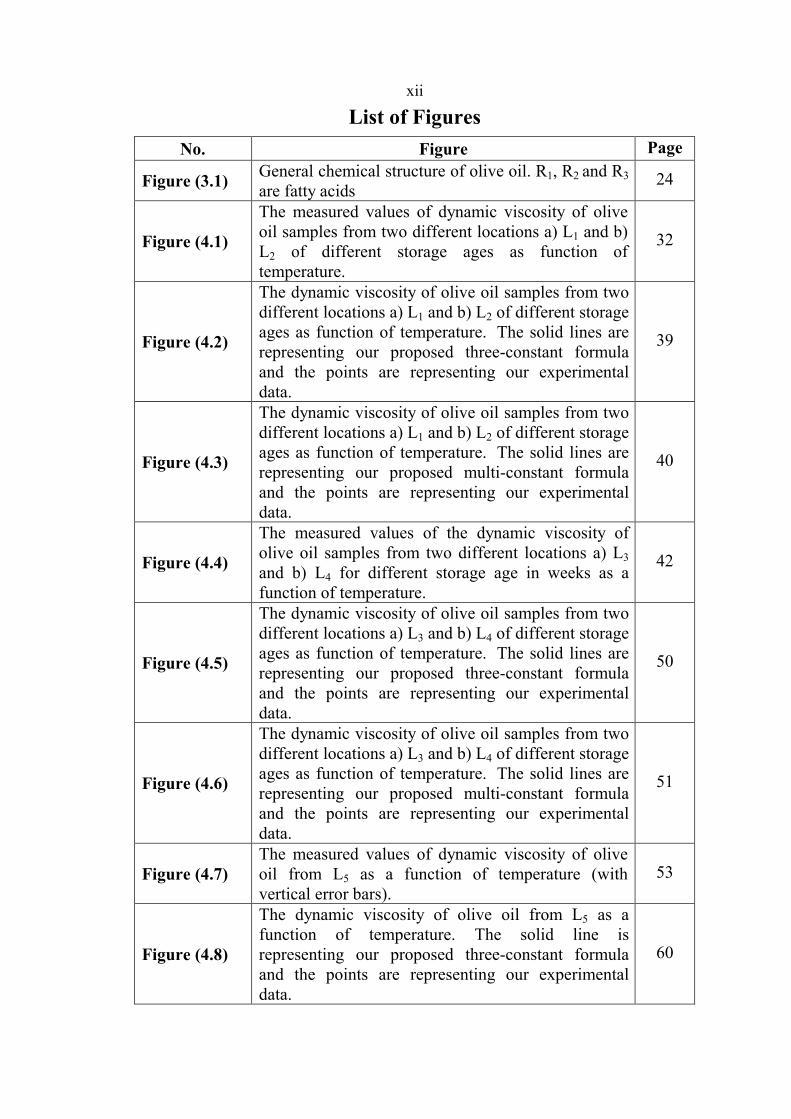
No. Figure Page
Figure (3.1) General chemical structure of olive oil. R1, R2 and R3
are fatty acids 24
Figure (4.1)
The measured values of dynamic viscosity of olive
oil samples from two different locations a) L1 and b)
L2 of different storage ages as function of
temperature.
32
Figure (4.2)
The dynamic viscosity of olive oil samples from two
different locations a) L1 and b) L2 of different storage
ages as function of temperature. The solid lines are
representing our proposed three-constant formula
and the points are representing our experimental
data.
39
Figure (4.3)
The dynamic viscosity of olive oil samples from two
different locations a) L1 and b) L2 of different storage
ages as function of temperature. The solid lines are
representing our proposed multi-constant formula
and the points are representing our experimental
data.
40
Figure (4.4)
The measured values of the dynamic viscosity of
olive oil samples from two different locations a) L3
and b) L4 for different storage age in weeks as a
function of temperature.
42
Figure (4.5)
The dynamic viscosity of olive oil samples from two
different locations a) L3 and b) L4 of different storage
ages as function of temperature. The solid lines are
representing our proposed three-constant formula
and the points are representing our experimental
data.
50
Figure (4.6)
The dynamic viscosity of olive oil samples from two
different locations a) L3 and b) L4 of different storage
ages as function of temperature. The solid lines are
representing our proposed multi-constant formula
and the points are representing our experimental
data.
51
Figure (4.7) The measured values of dynamic viscosity of olive
oil from L5 as a function of temperature (with
vertical error bars).
53
Figure (4.8)
The dynamic viscosity of olive oil from L5 as a
function of temperature. The solid line is
representing our proposed three-constant formula
and the points are representing our experimental
data.
60
xiii
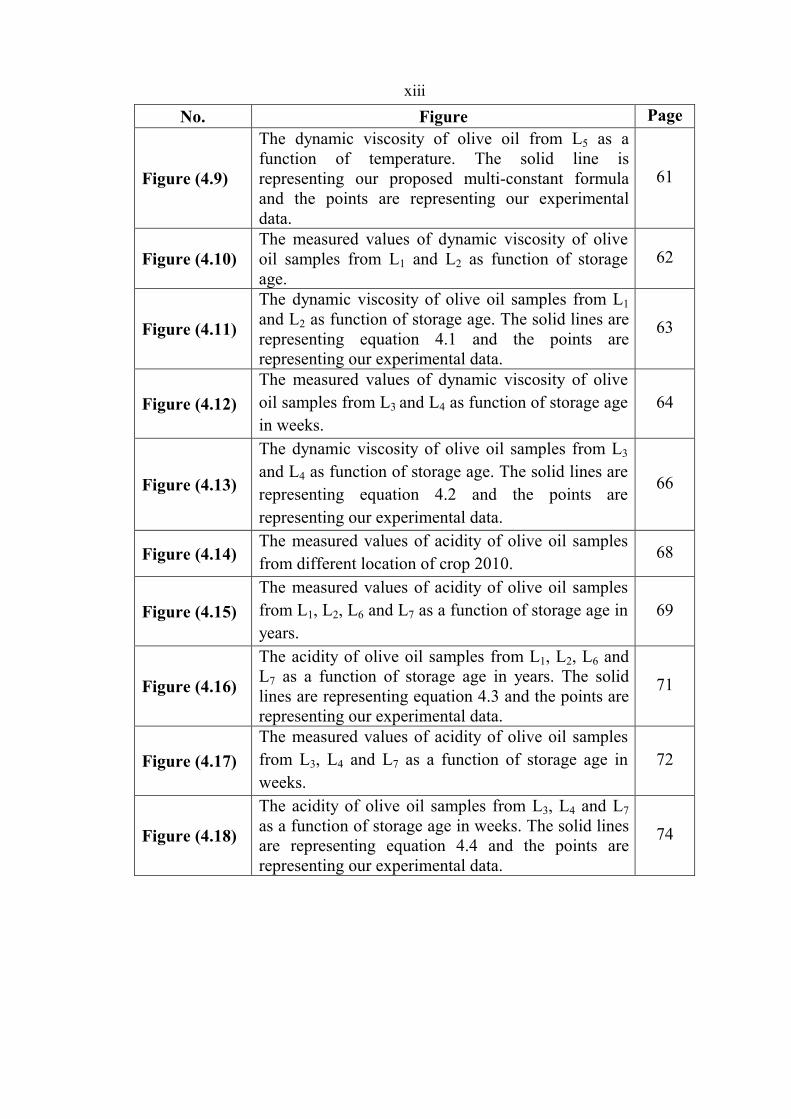
No. Figure Page
Figure (4.9)
The dynamic viscosity of olive oil from L5 as a
function of temperature. The solid line is
representing our proposed multi-constant formula
and the points are representing our experimental
data.
61
Figure (4.10) The measured values of dynamic viscosity of olive
oil samples from L1 and L2 as function of storage
age.
62
Figure (4.11)
The dynamic viscosity of olive oil samples from L1
and L2 as function of storage age. The solid lines are
representing equation 4.1 and the points are
representing our experimental data.
63
Figure (4.12)
The measured values of dynamic viscosity of olive
oil samples from L3 and L4 as function of storage age
in weeks.
64
Figure (4.13)
The dynamic viscosity of olive oil samples from L3
and L4 as function of storage age. The solid lines are
representing equation 4.2 and the points are
representing our experimental data.
66
Figure (4.14) The measured values of acidity of olive oil samples
from different location of crop 2010. 68
Figure (4.15)
The measured values of acidity of olive oil samples
from L1, L2, L6 and L7 as a function of storage age in
years.
69
Figure (4.16)
The acidity of olive oil samples from L1, L2, L6 and
L7 as a function of storage age in years. The solid
lines are representing equation 4.3 and the points are
representing our experimental data.
71
Figure (4.17)
The measured values of acidity of olive oil samples
from L3, L4 and L7 as a function of storage age in
weeks.
72
Figure (4.18)
The acidity of olive oil samples from L3, L4 and L7
as a function of storage age in weeks. The solid lines
are representing equation 4.4 and the points are
representing our experimental data.
74

xiv
Temperature and Storage Age-Dependence of Olive Oil Viscosity in Different Locations in Palestine
By Tajweed Hashim Nierat
Supervisor Prof. Issam Rashid Abdel-Raziq
Co-Supervisor Dr. Sharif Mohammad Musameh
Abstract
The dynamic viscosity of olive oil samples of different storage ages
in yearly and weekly basis from different locations was measured as a
function of temperature. In this study, the overall results of the effect of
dynamic viscosity as a function of storage age in yearly and weekly basis
indicate a decrease of dynamic viscosity. This study, shows that
Abramovic's and Andrade's formulas that describe the dynamic viscosity of
olive oil as a function of temperature don't fit our experimental data.
Accordingly, our experimental data have been fitted to our proposed two-
constant formula. As a result the best coefficient of determination (R2) has
been found to be 0.999. The P-value of dynamic viscosity for all olive oil
samples is ≤ 0.05. This work, also propose three and multi-constant
formulas to obtain more suitable prediction of temperature dependence of
dynamic viscosity of olive oil samples from different location in Palestine.
The best AAD% (percentage of average absolute deviation) was calculated
using our proposed formulas to be 0%.
The acidity of olive oil samples of different locations and different
storage ages in yearly and weekly basis was measured.
xv
In this work, the overall results of the effect of acidity as a function
of storage age in yearly basis indicate a deterioration of oil quality. The
acidity results for some olive oil samples suggest that the oil can be stored
for a period not more than 12 years without deterioration.
The overall results of weekly basis of this study indicate that the
acidity increased incrementally as a function of storage age.
The relationships between the viscosity of olive oil samples with
temperature and storage age, and the acidity with storage age, have been
found by fitting equations.
1
Chapter One
Introduction
1.1 Olive Oil
Olive originated in the countries of South Asia and was carried by
birds to the Mediterranean via the Middle East. The most ancient oleaster
traces in Greece are fossilized leaves found in the caldera on the island of
Santorini dating back some 50,000 – 60,000 years ago (Boskou D., 2006).
Olive oil is used throughout the world, especially in the
Mediterranean, it is a staple food in the warmer regions around the
Mediterranean Sea. It is now becoming popular throughout Europe, the
United States, Canada and other countries. This is due to its highly
characteristic flavor in addition to the promotion of the health benefits of
Mediterranean dietary patterns. Olive oil has a remarkable stability and can
be stored for 18 months or more (Boskou D., 2006). It is commonly used in
cooking, cosmetics, pharmaceuticals, soaps and as a fuel for traditional oil
lamps.
1.2 Previous Studies
1.2.1 Viscosity as Quality Factor
Viscosity is a fundamental characteristic property of all liquids and it
is one of the most important parameters required in the design of
technological processes. Additionally, viscosity is an important factor that
determines the overall quality and stability of food systems. Viscosity is

2
influenced by different factors such as catalyst, temperature, shear rate,
storage age, molecular weight, pressure and concentration.
There were numerous researchers who worked to propose alternative
equations to describe the effect of temperature on dynamic viscosity. An
equation to replace the well-known Arrhenius-type relationship was
derived by Giap. Giap tested his model using six vegetable oils and proved
its accuracy (Giap S. G. E., 2010). Barnett proposed a functional form for
the variation of liquid viscosity (η) in cP with temperature (t) in ºC (Barnett
R. et al, 1897). De Guzman proposed three-constant form to represent
liquid viscosity as a function of temperature (de Guzman J., 1913). Vogel
also proposed a three-constant representation (Vogel H., 1921). Goletz then
applied the temperature dependence proposed by Vogel over the full range
from the normal boiling temperature to the freezing point and developed a
generalized form (Goletz E. et al, 1977). Poling presented power law form
of liquid viscosity as a function of temperature (Poling B. et al, 1987).
Poling also represented liquid viscosity in the polynomial form (Poling B.
et al, 1987). Bu then presented Reid form in logarithm equation to the base
10 instead of the natural logarithm for liquid viscosity between the melting
and critical points (Bu L. et al, 1994). Danner utilized a new formula to
represent the dynamic viscosity data as a function of temperature for a
large number of substances (Danner R. et al, 1994). Natarajan utilized a
similar form for both absolute and kinematic viscosities and the constants
of their equations are presented (Natarajan G. et al, 1989). Dutt in his study
3
obtained the constants of Natarajan form for 100 liquids substances (Dutt
N. et al, 2004).
Qun-Fang proposed a two-parameter formula (Qun-Fang L. et al,
1997). Abramovic described the effect of temperature on dynamic
viscosities for a number of vegetable oils by using modified versions of the
Andrade equation (Andrade E. N. C., 1930). In addition, Abramovic
suggested a new form to describe the effect of temperature on viscosity
which has been also used by several investigators (Clements L. D. et al,
1992; Abramovic H. et al, 1998; Hsieh F.H. et al, 1999; Rao M. A., 1999;
Calligaris S. et al, 2005).
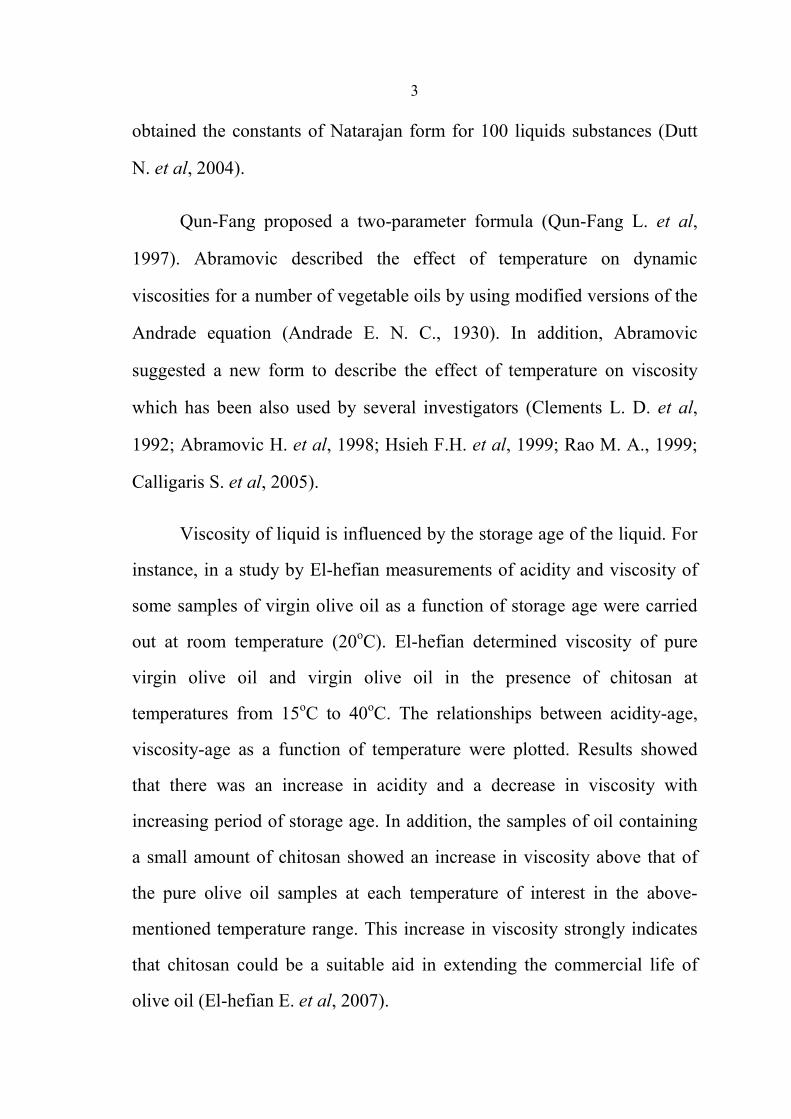
Viscosity of liquid is influenced by the storage age of the liquid. For
instance, in a study by El-hefian measurements of acidity and viscosity of
some samples of virgin olive oil as a function of storage age were carried
out at room temperature (20oC). El-hefian determined viscosity of pure
virgin olive oil and virgin olive oil in the presence of chitosan at
temperatures from 15oC to 40
oC. The relationships between acidity-age,
viscosity-age as a function of temperature were plotted. Results showed
that there was an increase in acidity and a decrease in viscosity with
increasing period of storage age. In addition, the samples of oil containing
a small amount of chitosan showed an increase in viscosity above that of
the pure olive oil samples at each temperature of interest in the above-
mentioned temperature range. This increase in viscosity strongly indicates
that chitosan could be a suitable aid in extending the commercial life of
olive oil (El-hefian E. et al, 2007).
4
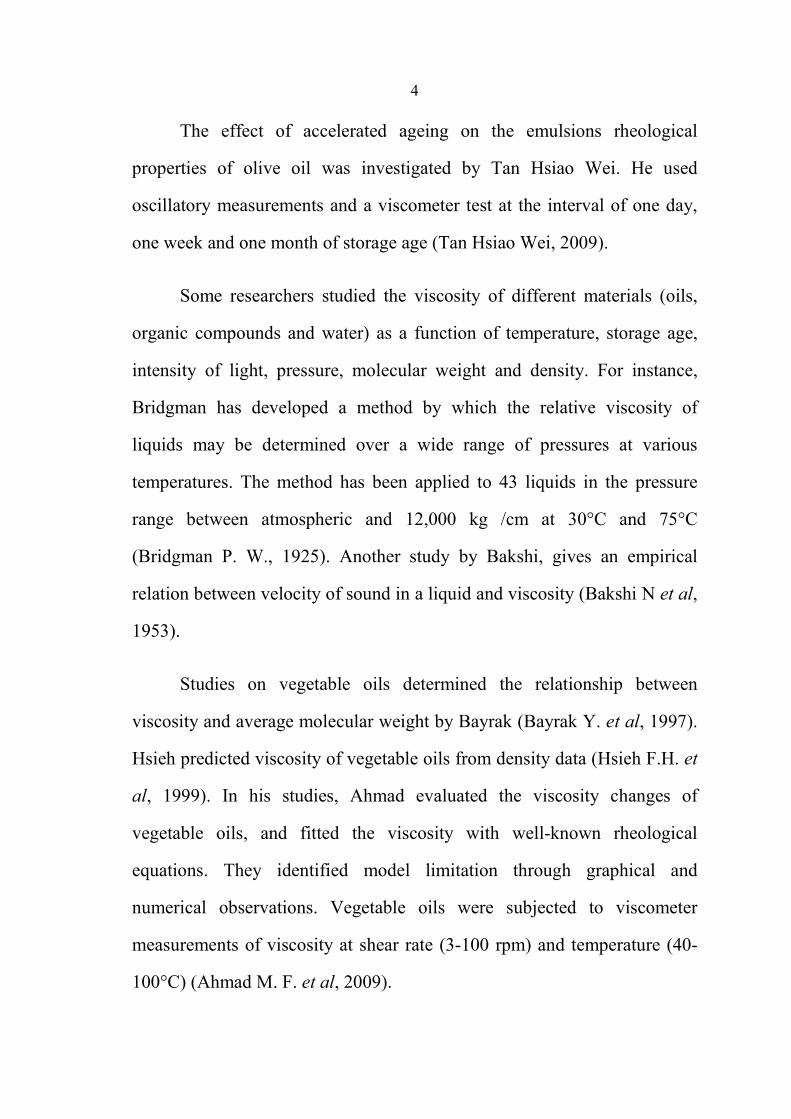
The effect of accelerated ageing on the emulsions rheological
properties of olive oil was investigated by Tan Hsiao Wei. He used
oscillatory measurements and a viscometer test at the interval of one day,
one week and one month of storage age (Tan Hsiao Wei, 2009).
Some researchers studied the viscosity of different materials (oils,
organic compounds and water) as a function of temperature, storage age,
intensity of light, pressure, molecular weight and density. For instance,
Bridgman has developed a method by which the relative viscosity of
liquids may be determined over a wide range of pressures at various
temperatures. The method has been applied to 43 liquids in the pressure
range between atmospheric and 12,000 kg /cm at 30°C and 75°C
(Bridgman P. W., 1925). Another study by Bakshi, gives an empirical
relation between velocity of sound in a liquid and viscosity (Bakshi N et al,
1953).
Studies on vegetable oils determined the relationship between
viscosity and average molecular weight by Bayrak (Bayrak Y. et al, 1997).
Hsieh predicted viscosity of vegetable oils from density data (Hsieh F.H. et
al, 1999). In his studies, Ahmad evaluated the viscosity changes of
vegetable oils, and fitted the viscosity with well-known rheological
equations. They identified model limitation through graphical and
numerical observations. Vegetable oils were subjected to viscometer
measurements of viscosity at shear rate (3-100 rpm) and temperature (40-
100°C) (Ahmad M. F. et al, 2009).

5
The variation of vegetable oils quality as a result of thermal
treatment was evaluated by Dumitru (Dumitru A. et al; 2010). The
evaluation is based on the measurement of some important phisyco-
chemical properties of vegetable oils, before and after thermal treatment
including: density, viscosity, refractive index and acid number (Dumitru A.
et al; 2010). The results of these researches gave some empirical relations
that describe the dependence of viscosity on different parameters.
1.2.2 Acidity as Quality Factor
The acidity is the oldest parameter used for evaluating the olive oil
quality since it is tightly related to the quality of raw material and
represents the extent of hydrolytic activities.
The excellent quality of virgin olive oil is the culmination of a
process that begins with the tree and ends in the bottle. Thus, it is necessary
to care for each step of the process and of the factors that can affect its
commercial life (oxygen, light, temperature and metals) leading to a
deterioration in quality as a consequence of oxidative and hydrolytic
degradations. Similar to other products that are produced in a limited
period of time, but that are consumed throughout the year, it must be
stored, and these storage and packing conditions are going to determine the
commercial life of the olive oil. Moreover, during storage of olive oil,
hydrolysis, especially a partial loss in the minor constituents, considered
primarily responsible for its beneficial health effects (Buszewski B., 2008).
To assess the role of the different modes of storage on the quality of olive
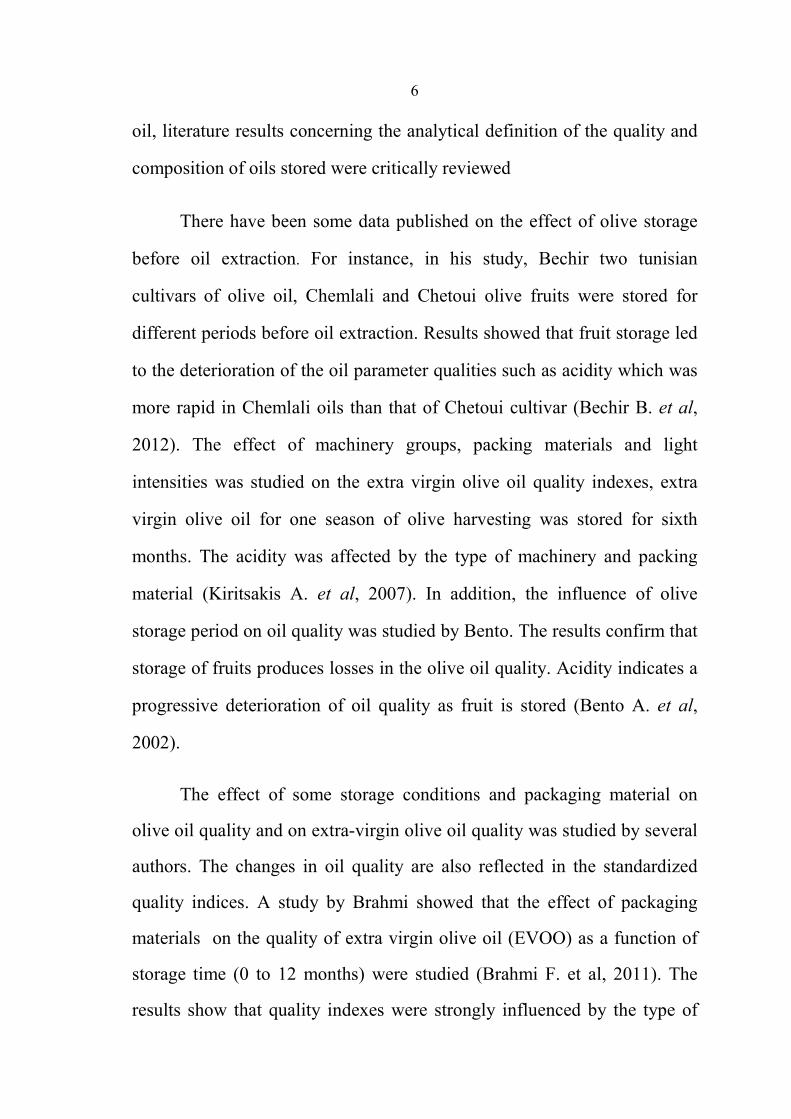
6
oil, literature results concerning the analytical definition of the quality and
composition of oils stored were critically reviewed
There have been some data published on the effect of olive storage
before oil extraction. For instance, in his study, Bechir two tunisian
cultivars of olive oil, Chemlali and Chetoui olive fruits were stored for
different periods before oil extraction. Results showed that fruit storage led
to the deterioration of the oil parameter qualities such as acidity which was
more rapid in Chemlali oils than that of Chetoui cultivar (Bechir B. et al,
2012). The effect of machinery groups, packing materials and light
intensities was studied on the extra virgin olive oil quality indexes, extra
virgin olive oil for one season of olive harvesting was stored for sixth
months. The acidity was affected by the type of machinery and packing
material (Kiritsakis A. et al, 2007). In addition, the influence of olive
storage period on oil quality was studied by Bento. The results confirm that
storage of fruits produces losses in the olive oil quality. Acidity indicates a
progressive deterioration of oil quality as fruit is stored (Bento A. et al,
2002).
The effect of some storage conditions and packaging material on
olive oil quality and on extra-virgin olive oil quality was studied by several
authors. The changes in oil quality are also reflected in the standardized
quality indices. A study by Brahmi showed that the effect of packaging
materials on the quality of extra virgin olive oil (EVOO) as a function of
storage time (0 to 12 months) were studied (Brahmi F. et al, 2011). The
results show that quality indexes were strongly influenced by the type of

7
packaging material and the time of storage. Free fatty acids increased with
storage time (Brahmi F. et al, 2011). Another study by Falque agreed with
Brahmi study. In Falque study, four commercial samples of extra-virgin
olive oil were analyzed in order to evaluate the influence of storage time on
quality. The quality parameters were determined after 3 and 6 months of
storage acidity. The results showed a gradual loss of quality during storage
that included increase in acidity (Falque E. et al, 2007).
In his study, Ayadi has analyzed olive oil samples in order to
evaluate the influence of storage time on their quality. Six months storage
at 50 ºC in the dark revealed a loss in oil stability. This finding was
reflected by the greater increase in peroxide value and a decrease of sterol
content. During oil storage, in Ayadi study there was no significant
variation in fatty acid composition (Ayadi M. et al, 2008).
Chemical analyses (acidity, peroxide value, specific extinction
coefficient at 232 and 270 nm, fatty acid composition, pigments, total
phenols, oxidative stability, etc) were carried out by numerous researchers
in order to evaluate the effect of storage age on oil quality. The results of
researchers showed that quality indexes were strongly influenced by the
time of storage (Bechir B. et al, 2012; Brahmi F. et al, 2011; Ayadi M. et
al, 2008; Falque E. et al, 2007; Kiritsakis A. et al, 2007; Bento A. et al,
2002).
It has been known that olive oil quality and behavior can be
influenced by the cultivars, the degree of ripeness, and the industrial
processes employed for oil extraction, as well as environmental conditions
8
(mineral nutrition, room temperature, light and availability of water) and
cultural practices ( Bechir B. et al, 2012; Bento A. et al, 2002).
1.3 Objectives of the Study
The main goal of this work is to study the dependence of dynamic
viscosity of olive oil samples from different location in Palestine on
temperature and compare our results with the standard values. In addition,
the dependence of the dynamic viscosity and the acidity of olive oil on
storage age will be studied. The relationship between the viscosity of olive
oil with temperature and storage age, and the acidity with storage age will
be found by fitting equations using SPSS (Statistical Package for Social
Sciences) program.
9
Chapter Two
Theory of Viscosity
Viscosity is a measure of the resistance to flow or shear. Viscosity
can also be termed as a drag force and is a measurement of the frictional
properties of the fluid. It can be expressed in two distinct forms:
a. Dynamic viscosity (η)
b. Kinematic viscosity (ν)
Dynamic viscosity is defined as the ratio of shear stress (force over
cross section area) to the rate of deformation (the difference of velocity
over a sheared distance), and it is presented as:
u
x
τη =
∂∂
(2.1)
Where, η is the dynamic viscosity in Pascal-second (Pa.s); τ is shear
stress (N/m2); and,
u
xγ
∂=
∂ is rate of deformation or velocity gradient or
better known as shear rate (1/s) (Dutt N. et al, 2007).
The Kinematic viscosity requires knowledge of mass density of the
liquid (ρ) at that temperature and pressure. It is defined as:
ην
ρ=
(2.2)
Where, ν is kinematic viscosity in centistokes (cSt), ρ is in g/cm3
(Dutt N. et al, 2007).
10
The flow characteristics of liquids are mainly dependent on viscosity
and are broadly divided into two categories:
1. Newtonian fluids:
These fluids have the same viscosity at different shear rates
(different revolution per minute) (rpm). These fluids are called Newtonian
over the shear rate range they are measured. Water is an example of these
fluids (James F., 1996).
2. Non-Newtonian fluids:
These fluids have different viscosity at different shear rates (different
rpm). They fall into two groups:
a) Time Independent
Time Independent means that the viscosity behavior does not change
as a function of time when it is measuring at a specific shear rate.
Pseudoplastic materials are an example of that fluid which displays a
decrease in viscosity with an increase in shear rate. It is also known as
"shear thinning". If viscometer readings for a material are taken from a low
to a high rpm and then back to the low rpm, and the readings fall upon
themselves, the material is time independent pseudoplastic and shear
thinning (James F., 1996). Olive oil is classified to be pseudoplastic
materials (Ahmad M. et al, 2009; Adnan Q. at al, 2009).

11
b) Time Dependent
Time Dependent means that the viscosity behavior changes as a
function of time when measuring at a specific shear rate (the duration for
which the fluid has been subjected to shearing as well as their previous
kinematic history). A thixotropic material is an example of that fluid which
has decreasing viscosity under constant shear rate. Many gels are classified
to be thixotropic material. If a viscometer is set at a constant speed and the
viscosity values are found to decrease with time, the material is thixotropic
(James F., 1996).
2.1 Viscosity Units
The unit for dynamic viscosity is used to be CentiPoise (cP) which is
the most convenient unit to report dynamic viscosity of liquids. cP is 10-2
of
Poise.
In the SI System (Système International d'Unités) the dynamic
viscosity units are N·s/m2
≡ Pa·s, where N is Newton and Pa is Pascal. The
dynamic viscosity is often expressed in the centimeter-gram-second system
(CGS) as g/cm·s, dyne·s/cm2 or poise (P) where, 1 poise = dyne·s/cm
2 =
g/cm·s = 10-1
Pa·s (Dutt N. et al, 2007).
2.2 Pure-Liquid Viscosity Theories
The effect of temperature on dynamic viscosity is normally fitted with
the Arrhenius-type relationship (Clements C. et al., 2006). Which has the
form given by:
12
,
aE
RTT eη η∞=
(2.3)
Where η is the dynamic viscosity in Pa.s, η ∞,T is the viscosity at
infinite-temperature in Pa.s, Ea is the exponential constant that is known as
activation energy (J/mol); R is the gas constant (J/mol.K) and T is the
absolute temperature Kelvin (Clements C. et al.; 2006, Ahmad M. F.; 2009,
Giap S. G. E.; 2010).
Equation (2.3) has failed to provide a good representation of real
phenomena for all fluids. It indicates the presence of scientific gap for
which new equation is needed.
There has been no comprehensive theory of viscosity for liquids
because of its complex nature. Theoretical methods of calculating liquid
viscosities give results in large deviations from the measured viscosity data.
Empirical methods are used to find relationships between viscosity and
other properties, by means of mathematical expressions that provide the
best fit of the experimental data. The variation of liquid viscosity with
temperature will be discussed. For practical purposes, it is often sufficient
to know the viscosity of liquids at atmospheric pressure as a function of
temperature. Available experimental data reveal that the viscosity of liquids
generally decreases with temperature in a rapid and non-linear fashion and
is not significantly dependent on pressures up to several atmospheres (Dutt
N. et al, 2007).
Simple as well as complex expressions have been proposed for the
representation of liquid viscosity as a function of temperature with the main
13
objective of representing the available experimental data. Some of the
different forms of temperature dependence of viscosity proposed under
correlation methods are given. There were numerous researchers who
responded to propose alternative equations.
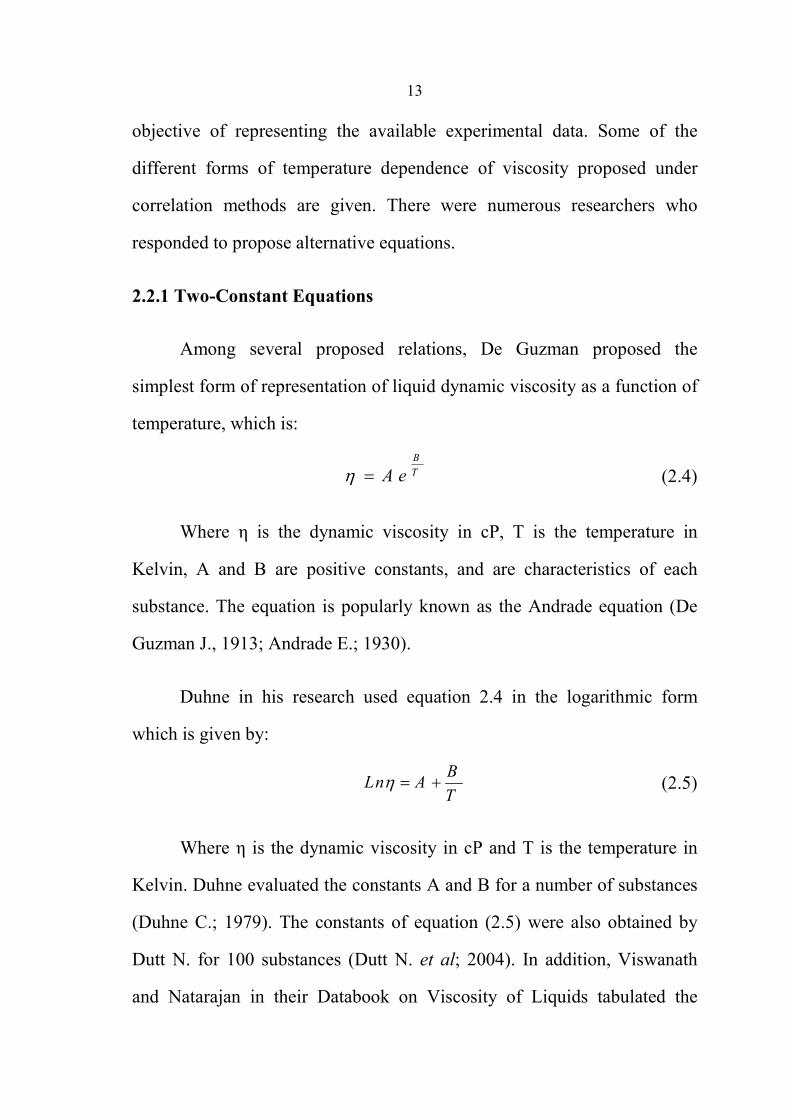
2.2.1 Two-Constant Equations
Among several proposed relations, De Guzman proposed the
simplest form of representation of liquid dynamic viscosity as a function of
temperature, which is:
B
TA eη = (2.4)
Where η is the dynamic viscosity in cP, T is the temperature in
Kelvin, A and B are positive constants, and are characteristics of each
substance. The equation is popularly known as the Andrade equation (De
Guzman J., 1913; Andrade E.; 1930).
Duhne in his research used equation 2.4 in the logarithmic form
which is given by:
BLn A
Tη = + (2.5)
Where η is the dynamic viscosity in cP and T is the temperature in
Kelvin. Duhne evaluated the constants A and B for a number of substances
(Duhne C.; 1979). The constants of equation (2.5) were also obtained by
Dutt N. for 100 substances (Dutt N. et al; 2004). In addition, Viswanath
and Natarajan in their Databook on Viscosity of Liquids tabulated the
14
constants of equation (2.5). They also tabulated the constants of the
following equation which is given by Natrajan (Natarajan G. et al, 1989):
DCTη = (2.6)
Where η is the dynamic viscosity in cP, T is the temperature in
Kelvin, C and D are constants.
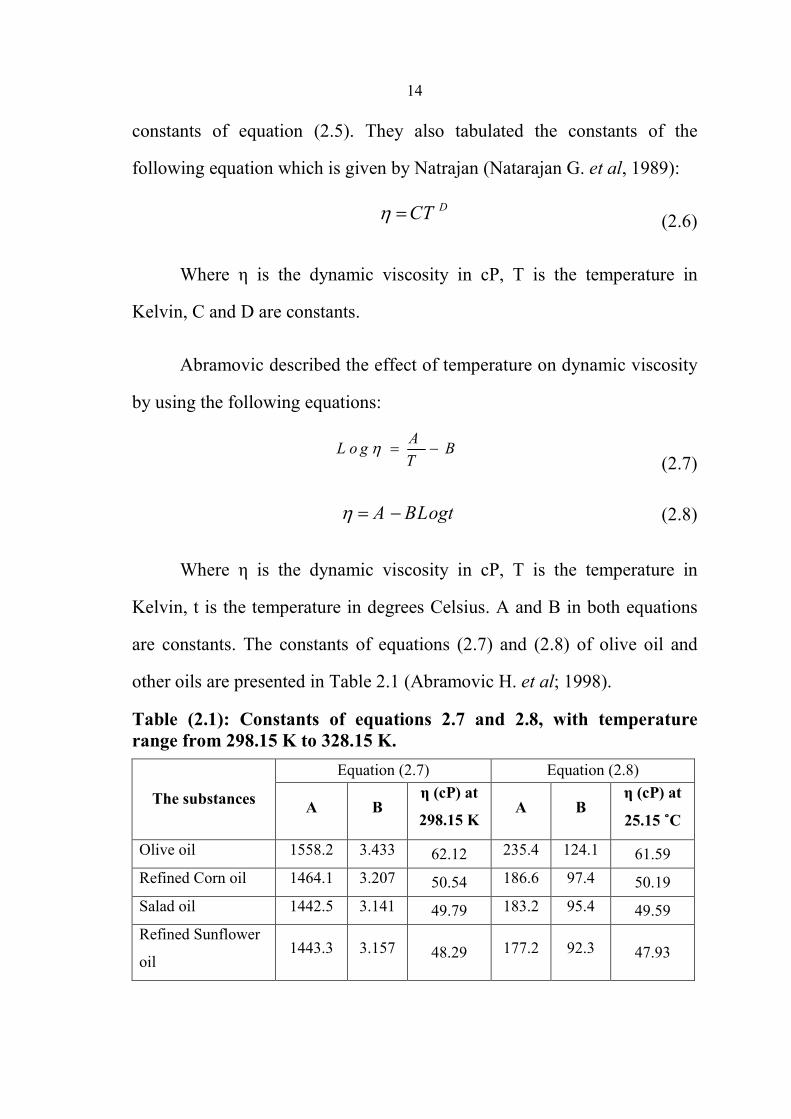
Abramovic described the effect of temperature on dynamic viscosity
by using the following equations:
AL o g B
Tη = −
(2.7)
A BLogtη = − (2.8)
Where η is the dynamic viscosity in cP, T is the temperature in
Kelvin, t is the temperature in degrees Celsius. A and B in both equations
are constants. The constants of equations (2.7) and (2.8) of olive oil and
other oils are presented in Table 2.1 (Abramovic H. et al; 1998).
Table (2.1): Constants of equations 2.7 and 2.8, with temperature range from 298.15 K to 328.15 K.
Equation (2.7) Equation (2.8)
The substances A B
η (cP) at
298.15 K A B
η (cP) at
25.15 ˚C
Olive oil 1558.2 3.433 62.12 235.4 124.1 61.59
Refined Corn oil 1464.1 3.207 50.54 186.6 97.4 50.19
Salad oil 1442.5 3.141 49.79 183.2 95.4 49.59
Refined Sunflower
oil 1443.3 3.157 48.29 177.2 92.3 47.93
15
2.2.2 Three Constant Equations
A three-constant representation proposed originally by Vogel of the
form
BLn A
t Cη = +
+ (2.9)
Wher η is the dynamic viscosity in cP, t is the temperature in °C. A,
B and C are constants. This form of the equation is more accurate than the
two-constant form. It is often preferred for engineering design purposes
(Vogel H., 1921).
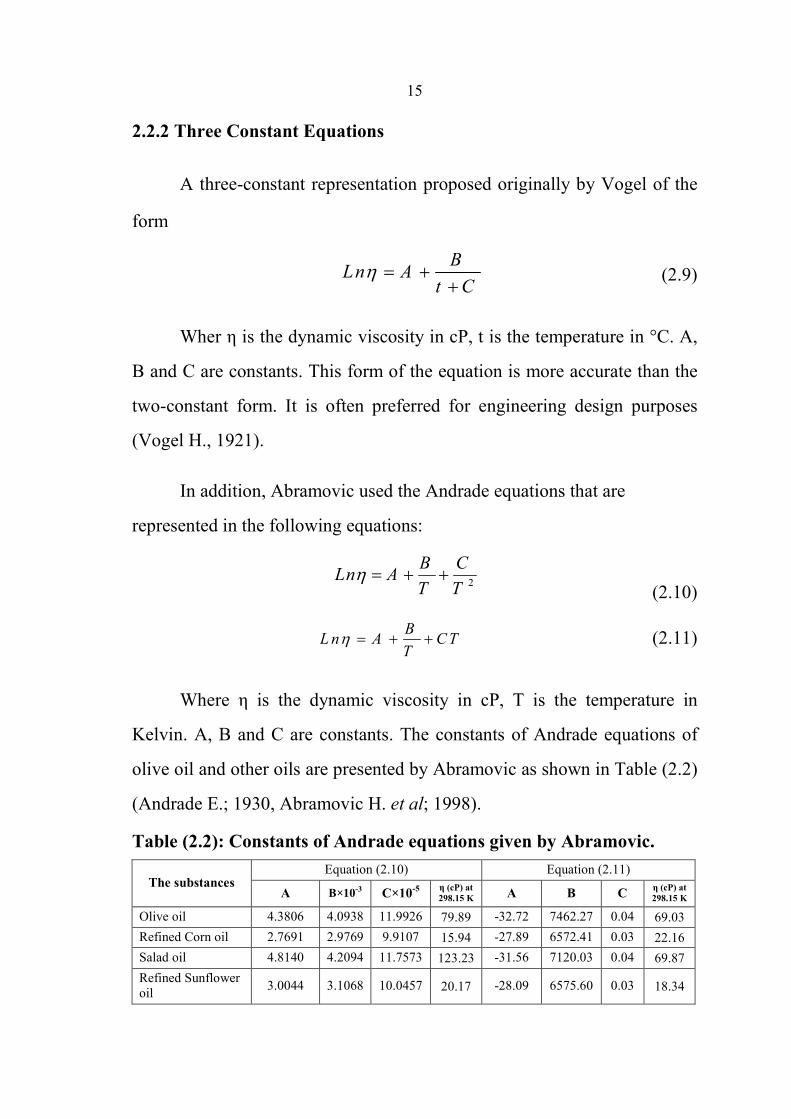
In addition, Abramovic used the Andrade equations that are
represented in the following equations:
2
B CLn A
T Tη = + +
(2.10)
BL n A C T
Tη = + +
(2.11)
Where η is the dynamic viscosity in cP, T is the temperature in
Kelvin. A, B and C are constants. The constants of Andrade equations of
olive oil and other oils are presented by Abramovic as shown in Table (2.2)
(Andrade E.; 1930, Abramovic H. et al; 1998).
Table (2.2): Constants of Andrade equations given by Abramovic.
Equation (2.10) Equation (2.11) The substances
A B×10-3 C×10-5 η (cP) at 298.15 K A B C η (cP) at
298.15 K
Olive oil 4.3806 4.0938 11.9926 79.89 -32.72 7462.27 0.04 69.03
Refined Corn oil 2.7691 2.9769 9.9107 15.94 -27.89 6572.41 0.03 22.16
Salad oil 4.8140 4.2094 11.7573 123.23 -31.56 7120.03 0.04 69.87
Refined Sunflower
oil 3.0044 3.1068 10.0457 20.17 -28.09 6575.60 0.03 18.34
16
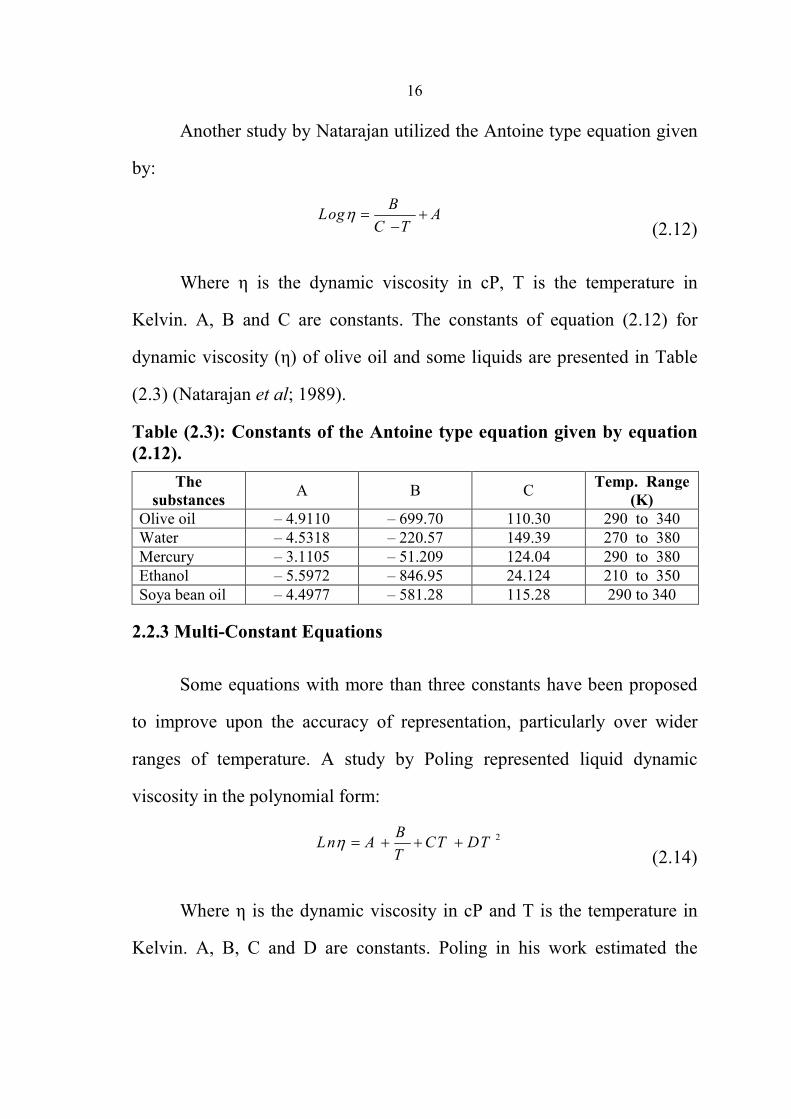
Another study by Natarajan utilized the Antoine type equation given
by:
BLog A
C Tη = +
− (2.12)
Where η is the dynamic viscosity in cP, T is the temperature in
Kelvin. A, B and C are constants. The constants of equation (2.12) for
dynamic viscosity (η) of olive oil and some liquids are presented in Table
(2.3) (Natarajan et al; 1989).
Table (2.3): Constants of the Antoine type equation given by equation (2.12).
The substances
A B C Temp. Range
(K) Olive oil – 4.9110 – 699.70 110.30 290 to 340
Water – 4.5318 – 220.57 149.39 270 to 380
Mercury – 3.1105 – 51.209 124.04 290 to 380
Ethanol – 5.5972 – 846.95 24.124 210 to 350
Soya bean oil – 4.4977 – 581.28 115.28 290 to 340
2.2.3 Multi-Constant Equations
Some equations with more than three constants have been proposed
to improve upon the accuracy of representation, particularly over wider
ranges of temperature. A study by Poling represented liquid dynamic
viscosity in the polynomial form:
2BLn A CT DT
Tη = + + +
(2.14)
Where η is the dynamic viscosity in cP and T is the temperature in
Kelvin. A, B, C and D are constants. Poling in his work estimated the
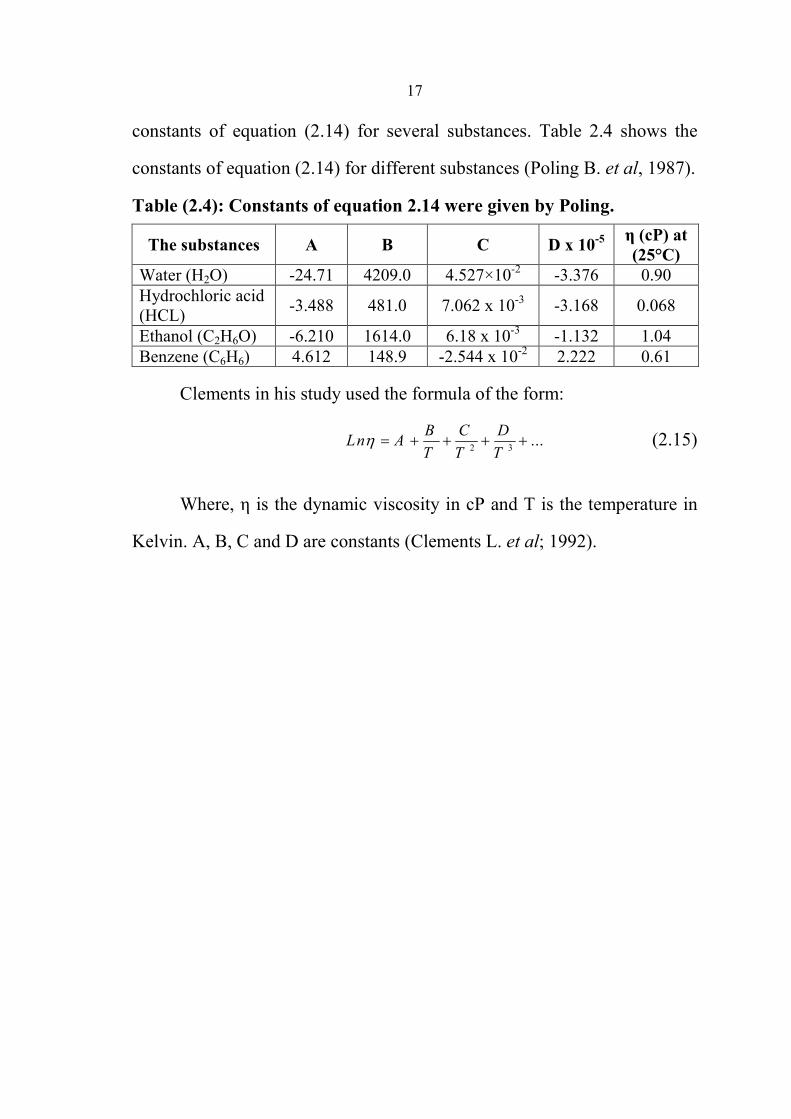
17
constants of equation (2.14) for several substances. Table 2.4 shows the
constants of equation (2.14) for different substances (Poling B. et al, 1987).
Table (2.4): Constants of equation 2.14 were given by Poling.
The substances A B C D x 10-5 η (cP) at (25°C)
Water (H2O) -24.71 4209.0 4.527×10⁻²
-3.376 0.90
Hydrochloric acid
(HCL) -3.488 481.0 7.062 x 10
-3 -3.168 0.068
Ethanol (C2H6O) -6.210 1614.0 6.18 x 10⁻³
-1.132 1.04
Benzene (C6H6) 4.612 148.9 -2.544 x 10⁻²
2.222 0.61
Clements in his study used the formula of the form:
2 3...
B C DLn A
T T Tη = + + + + (2.15)
Where, η is the dynamic viscosity in cP and T is the temperature in
Kelvin. A, B, C and D are constants (Clements L. et al; 1992).

18
Chapter Three
Methodology
The samples of extra virgin olive oil and virgin olive oil were used
from different regions in Palestine. They were collected from 1997 to 2010,
from different locations. The olive oil samples were obtained from a
Palestinian quality assured industrial oil mill, from the crop of 1997 until
the crop of 2010. These samples were kept under the same conditions (in
closed glass bottles were placed in dark place at room temperature). The
viscosity of olive oil samples of different ages and different locations was
measured. The experimental data were fitted and the correlation constants
of the best fits were estimated.
The viscosity of olive oil samples of crop 2010 from two different
locations (AL yamun (L3) and Beta (L4)) at different temperature was
measured weekly during the period from June 2011 till August 2011.
The viscosity of olive oil samples of crop 2010 from Jenin (L5) was
measured as a function of temperature.
The acidity of olive oil samples of different location and different
storage ages were measured by using the titration method. The acidity of
olive oil samples (2010) from three locations (meithaloon (L7), AL yamun
(L3) and Beita (L4)) were measured weekly during the period from June
2011 till January 2012. The experimental data were fitted and the
correlation constants of the best fit were estimated.
19
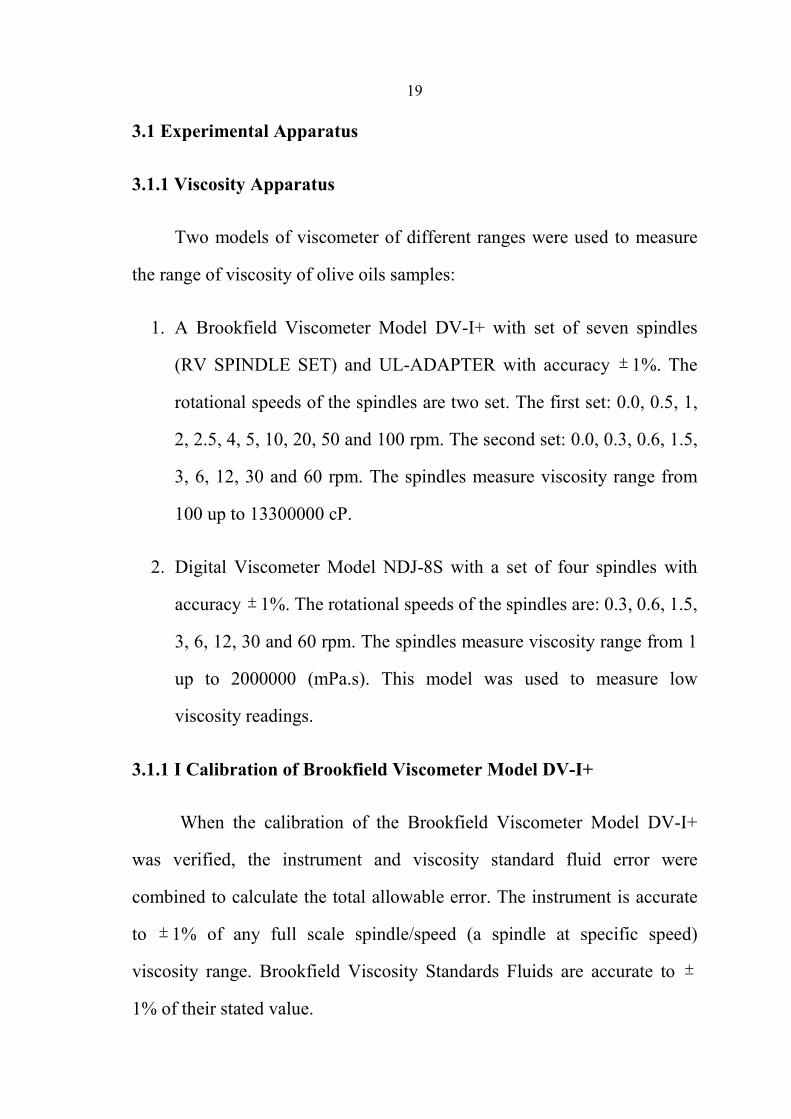
3.1 Experimental Apparatus
3.1.1 Viscosity Apparatus
Two models of viscometer of different ranges were used to measure
the range of viscosity of olive oils samples:
1. A Brookfield Viscometer Model DV-I+ with set of seven spindles
(RV SPINDLE SET) and UL-ADAPTER with accuracy ± 1%. The
rotational speeds of the spindles are two set. The first set: 0.0, 0.5, 1,
2, 2.5, 4, 5, 10, 20, 50 and 100 rpm. The second set: 0.0, 0.3, 0.6, 1.5,
3, 6, 12, 30 and 60 rpm. The spindles measure viscosity range from
100 up to 13300000 cP.
2. Digital Viscometer Model NDJ-8S with a set of four spindles with
accuracy ± 1%. The rotational speeds of the spindles are: 0.3, 0.6, 1.5,
3, 6, 12, 30 and 60 rpm. The spindles measure viscosity range from 1
up to 2000000 (mPa.s). This model was used to measure low
viscosity readings.
3.1.1 I Calibration of Brookfield Viscometer Model DV-I+
When the calibration of the Brookfield Viscometer Model DV-I+
was verified, the instrument and viscosity standard fluid error were
combined to calculate the total allowable error. The instrument is accurate
to ± 1% of any full scale spindle/speed (a spindle at specific speed)
viscosity range. Brookfield Viscosity Standards Fluids are accurate to ±
1% of their stated value.
20
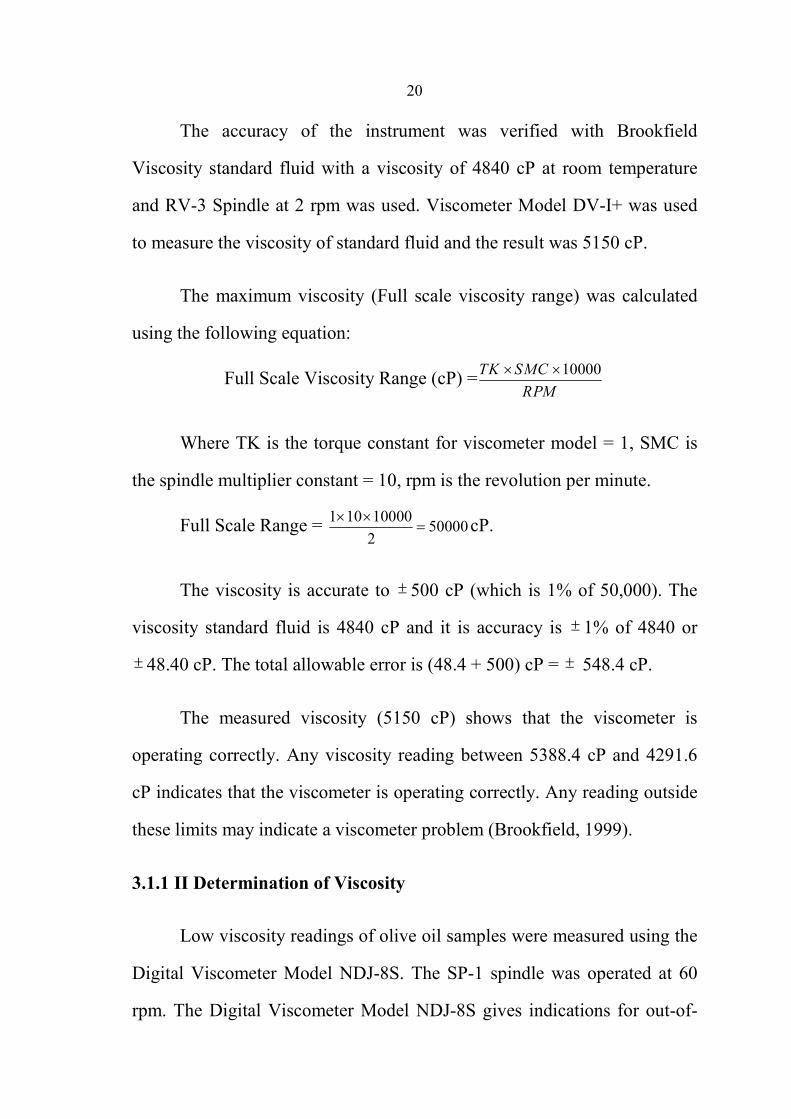
The accuracy of the instrument was verified with Brookfield
Viscosity standard fluid with a viscosity of 4840 cP at room temperature
and RV-3 Spindle at 2 rpm was used. Viscometer Model DV-I+ was used
to measure the viscosity of standard fluid and the result was 5150 cP.
The maximum viscosity (Full scale viscosity range) was calculated
using the following equation:
Full Scale Viscosity Range (cP) =10000TK SMC
RPM
× ×
Where TK is the torque constant for viscometer model = 1, SMC is
the spindle multiplier constant = 10, rpm is the revolution per minute.
Full Scale Range = 1 10 10000
500002
× ×= cP.
The viscosity is accurate to ± 500 cP (which is 1% of 50,000). The
viscosity standard fluid is 4840 cP and it is accuracy is ± 1% of 4840 or
± 48.40 cP. The total allowable error is (48.4 + 500) cP = ± 548.4 cP.
The measured viscosity (5150 cP) shows that the viscometer is
operating correctly. Any viscosity reading between 5388.4 cP and 4291.6
cP indicates that the viscometer is operating correctly. Any reading outside
these limits may indicate a viscometer problem (Brookfield, 1999).
3.1.1 II Determination of Viscosity
Low viscosity readings of olive oil samples were measured using the
Digital Viscometer Model NDJ-8S. The SP-1 spindle was operated at 60
rpm. The Digital Viscometer Model NDJ-8S gives indications for out-of-
21
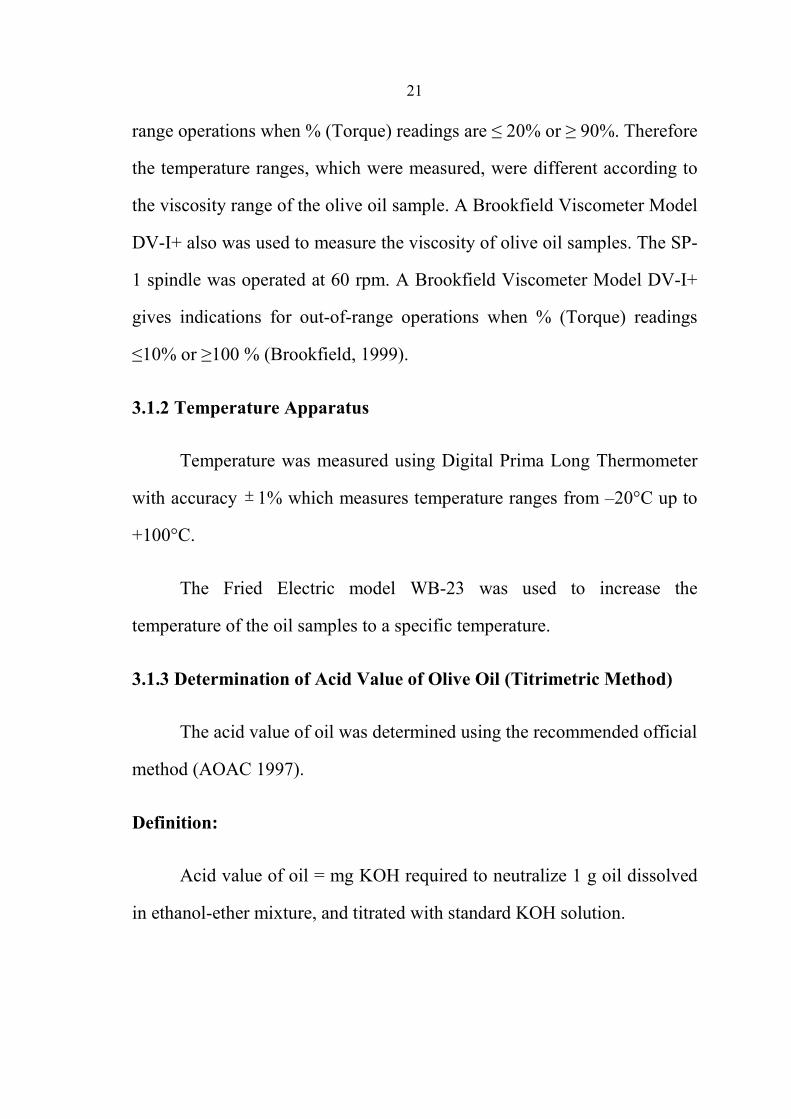
range operations when % (Torque) readings are ≤ 20% or ≥ 90%. Therefore
the temperature ranges, which were measured, were different according to
the viscosity range of the olive oil sample. A Brookfield Viscometer Model
DV-I+ also was used to measure the viscosity of olive oil samples. The SP-
1 spindle was operated at 60 rpm. A Brookfield Viscometer Model DV-I+
gives indications for out-of-range operations when % (Torque) readings
≤10% or ≥100 % (Brookfield, 1999).
3.1.2 Temperature Apparatus
Temperature was measured using Digital Prima Long Thermometer
with accuracy ± 1% which measures temperature ranges from –20°C up to
+100°C.
The Fried Electric model WB-23 was used to increase the
temperature of the oil samples to a specific temperature.
3.1.3 Determination of Acid Value of Olive Oil (Titrimetric Method)
The acid value of oil was determined using the recommended official
method (AOAC 1997).
Definition:
Acid value of oil = mg KOH required to neutralize 1 g oil dissolved
in ethanol-ether mixture, and titrated with standard KOH solution.
22
Procedure:
A) Preparation and standardization of 0.1 M ethanolic KOH solution:
1- Transfer about 0.56 g of solid KOH into a 100-mL volumetric flask and
dissolve in absolute ethanol.
2- Weigh out accurately 0.204 g of dry primary standard KHP (Molar mass
= 204.23 g/mol) into a 250 mL conical flask and dissolve in ~ 50 mL of
distilled water.
3- Add 3 drops of phenolphthalein and titrate drop wise in the vicinity of
the end point with KOH until the color change from colorless to pink color
and persists for 30 seconds.
4- Repeat steps 2 and 3 three times.
5- Calculate the average molar concentration of KOH solution.
2 2K HP K OH K P H O+ → +
weight of KHP (g) × 1000molarity of KOH =
204.23 × mL of KOH
B) Preparation of ethanol-ether mixture:
1- Mix 50 mL absolute ethanol and 50 mL ether in a conical flask.
2- Add 3 drops of phenolphthalein solution, and add ethanolic KOH
solution, (A), to faint pink color.
23
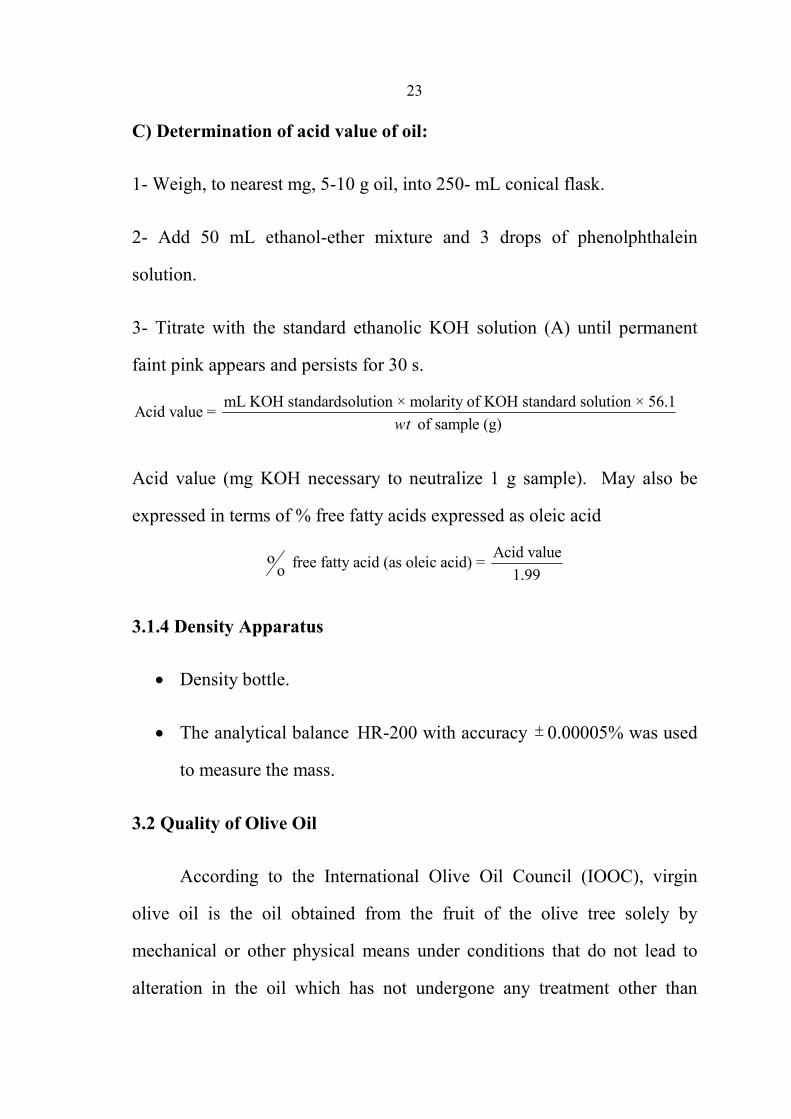
C) Determination of acid value of oil:
1- Weigh, to nearest mg, 5-10 g oil, into 250- mL conical flask.
2- Add 50 mL ethanol-ether mixture and 3 drops of phenolphthalein
solution.
3- Titrate with the standard ethanolic KOH solution (A) until permanent
faint pink appears and persists for 30 s.
mL KOH standardsolution × molarity of KOH standard solution × 56.1Acid value =
of sample (g)wt
Acid value (mg KOH necessary to neutralize 1 g sample). May also be
expressed in terms of % free fatty acids expressed as oleic acid
Acid valueo free fatty acid (as oleic acid) = o 1.99
3.1.4 Density Apparatus
• Density bottle.
• The analytical balance HR-200 with accuracy ± 0.00005% was used
to measure the mass.
3.2 Quality of Olive Oil
According to the International Olive Oil Council (IOOC), virgin
olive oil is the oil obtained from the fruit of the olive tree solely by
mechanical or other physical means under conditions that do not lead to
alteration in the oil which has not undergone any treatment other than

24
washing, decantation, centrifugation, or filtration, to the exclusion of oils
obtained using solvents or using adjuvant having a chemical or biochemical
action. The composition of olive oil is primarily triacylglycerols (~99%)
and secondarily free fatty acids, mono- and diacylglycerols, and an array of
lipids such as hydrocarbons, sterols, aliphatic alcohols, tocopherols, and
pigments. Fig. (3.1) shows the structure of olive oil.
Figure (3.1): General chemical structure of olive oil. R1, R2 and R3 are fatty acids
3.2.1 Fatty Acid Composition of Olive Oil
The major fatty acids in olive oil are: Oleic Acid (C18:1), a
monounsaturated fatty acid. The oleic acid, the most representative fatty
acid of olive oil, ranges from 55% to 83% of olive oil. Linoleic Acid
(C18:2), a polyunsaturated fatty acid. That makes up about 3.5 to 21% of
olive oil. Palmitic Acid (C16:0) is a saturated fatty acid that makes up 7.5
to 20% of olive oil. Stearic Acid (C18:0) is a saturated fatty acid that makes
up 0.5 to 5% of olive oil. Linolenic Acid (C18:3) (specifically alpha-
Linolenic Acid) is a polyunsaturated fatty acid that makes up 0 to 1.5% of
olive oil.
25
The fatty acid composition of olive oil varies widely depending on
the cultivar, maturity of the fruit, altitude, climate, and several other factors
(Bechir B. et al, 2012; Boskou D., 2006).
3.2.2 Esters of Fatty Alcohols with Fatty Acids (Waxes)
Esters of fatty alcohols with fatty acids (waxes) are important minor
olive oil constituents because they can be used as a criterion to differentiate
various olive oil types. The main waxes detected in olive oil are esters of
oleic or palmitic acid with 36, 38, 40, 42, 44, and 46 carbon atoms. The
wax content and composition is affected by cultivar, crop year, and
processing (Boskou D., 2006).
3.2.3 Trans Fatty Acids
Olive oil has no trans fatty acids. Olive oil is not a trans fatty acid
because it has not been partially hydrogenated in a factory to make it solid
at room temperature like margarine has (Boskou D., 2006).
3.2.4 Classification of Fatty Acids according to Chain Length
Long chain fatty acids have 12 to 22 carbon atoms. Medium chain
fatty acids have 8 to 12 carbon atoms. Short chain fatty acids have 4 to 8
carbon atoms. The primary fatty acids in olive oil are all long chain fatty
acids. Very long-chain fatty acids have greater than 20 carbon atoms. The
oils having greater chain length have greater viscosity (Adnan Q. et al;
2009).

26
3.2.5 Free Fatty Acids Percent (%FFA) or the Acidity
The "acidity" in olive oil is the result of the degree of breakdown of
the triacylglycerols, due to a chemical reaction called hydrolysis or
lipolysis, in which free fatty acids are formed. These "broken off" fatty
acids are called Free Fatty Acids. Table (3.1) shows the maximum levels
have been fixed by the International Organization (IOOC) to establish the
category (IOOC, 2000).
Table (3.1): Limits of free fatty acidity, as oleic acid percent, fixed by IOOC for each olive oil category
Category FFA% Extra virgin olive oil ≤ 0.8
Virgin olive oil ≤ 2.0
Ordinary virgin olive oil ≤ 3.3
Lampante oil >3.3
Refined olive oil ≤0.3
Oils obtained from healthy fruits, regardless of the cultivar,
processed just after harvesting, show very low values of free acidity well
under 0.5% FFA. If fruits are damaged hydrolytic enzymes become active
and the free acidity of the oil slightly increases. The increase in the acidity
also might be due to delays between harvesting and extraction (especially if
the fruit has been bruised or damaged during harvesting). The prolonged
contact between oil and vegetation water (after extraction) increase the
acidity. The careless extraction methods, as well as storing olives in heaps
or silos also leads to increase the acidity of olive oil. The free fatty acidity
is thus a direct measure of the quality of the oil and reflects the care taken
right from blossoming and fruit set to the eventual sale and consumption of
the oil.
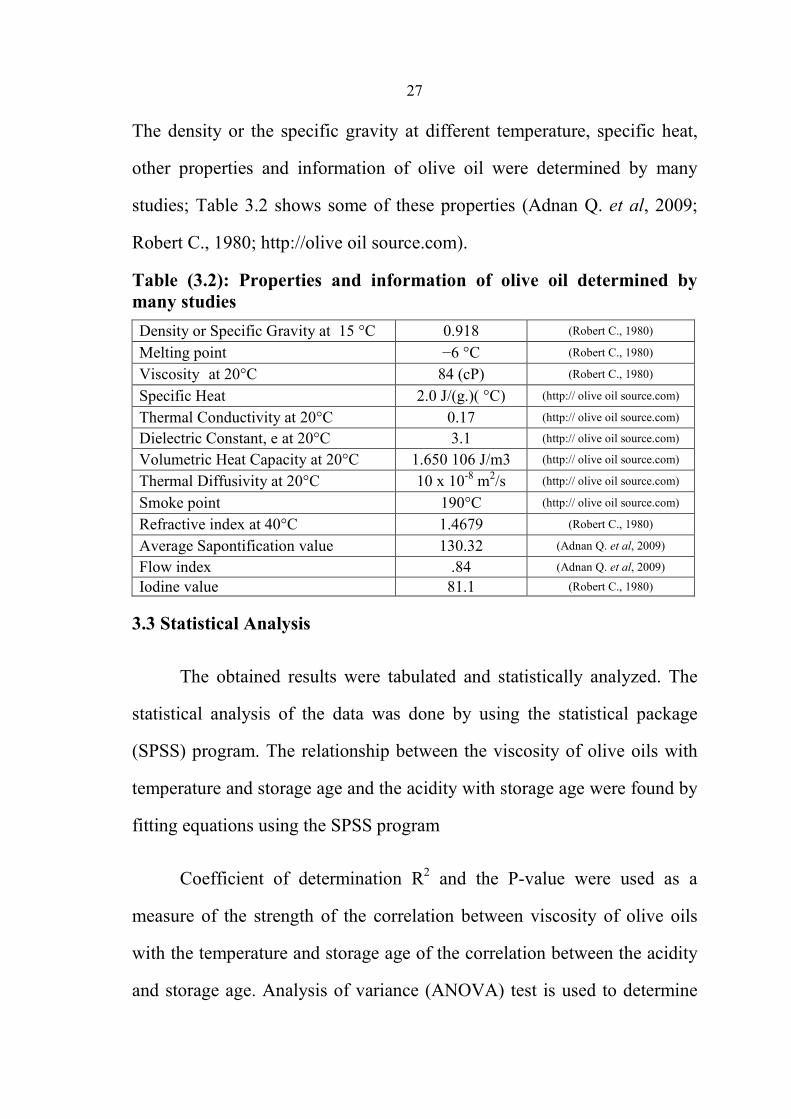
27
The density or the specific gravity at different temperature, specific heat,
other properties and information of olive oil were determined by many
studies; Table 3.2 shows some of these properties (Adnan Q. et al, 2009;
Robert C., 1980; http://olive oil source.com).
Table (3.2): Properties and information of olive oil determined by many studies
Density or Specific Gravity at 15 °C 0.918 (Robert C., 1980)
Melting point −6 °C (Robert C., 1980)
Viscosity at 20°C 84 (cP) (Robert C., 1980)
Specific Heat 2.0 J/(g.)( °C) (http:// olive oil source.com)
Thermal Conductivity at 20°C 0.17 (http:// olive oil source.com)
Dielectric Constant, e at 20°C 3.1 (http:// olive oil source.com)
Volumetric Heat Capacity at 20°C 1.650 106 J/m3 (http:// olive oil source.com)
Thermal Diffusivity at 20°C 10 x 10-8
m2/s (http:// olive oil source.com)
Smoke point 190°C (http:// olive oil source.com)
Refractive index at 40°C 1.4679 (Robert C., 1980)
Average Sapontification value 130.32 (Adnan Q. et al, 2009)
Flow index .84 (Adnan Q. et al, 2009)
Iodine value 81.1 (Robert C., 1980)
3.3 Statistical Analysis
The obtained results were tabulated and statistically analyzed. The
statistical analysis of the data was done by using the statistical package
(SPSS) program. The relationship between the viscosity of olive oils with
temperature and storage age and the acidity with storage age were found by
fitting equations using the SPSS program
Coefficient of determination R2 and the P-value were used as a
measure of the strength of the correlation between viscosity of olive oils
with the temperature and storage age of the correlation between the acidity
and storage age. Analysis of variance (ANOVA) test is used to determine
28
significant differences between viscosity of olive oils and temperature. The
P-value has two hypotheses:
1. Null hypothesis (Ho): there is no significant relationship between the
dynamic viscosity and temperature.
2. Alternative hypothesis (Ha): there is significant relationship between the
dynamic viscosity and temperature.
The P-value is the probability that the results observed in a study
could have occurred by chance if the null hypothesis was true. The P-
values do not simply provide researchers with a yes or no answer; it
provides a sense of the strength of the evidence against the null hypothesis.
The P-value ranged from zero to one, the lower the P-value, the stronger
the evidence. The P-value ranged as follows:
Range I: 0.000 ≤ P ≤ 0.050 strong significance (Alternative hypothesis).
Range II: P = 0.050 the threshold of statistical significance
Range III: 0.050 < P ≤ 1.000 no significance (null hypothesis) (Brian S. at
al, 2004).
The coefficient of determination R2 gives the proportion of the
variance of one variable that is predictable from the other variable. It is a
measure that allows determining how certain one can be in making
predictions from a certain model.
29
R2 represents the percent of the data that is the closest to the line of
best fit. For example, if R2 = 0.850, which means that 85% of the total
variation in y can be explained by the linear relationship between x and y.
The other 15% of the total variation in y remains unexplained (Brian S. at
al, 2004).
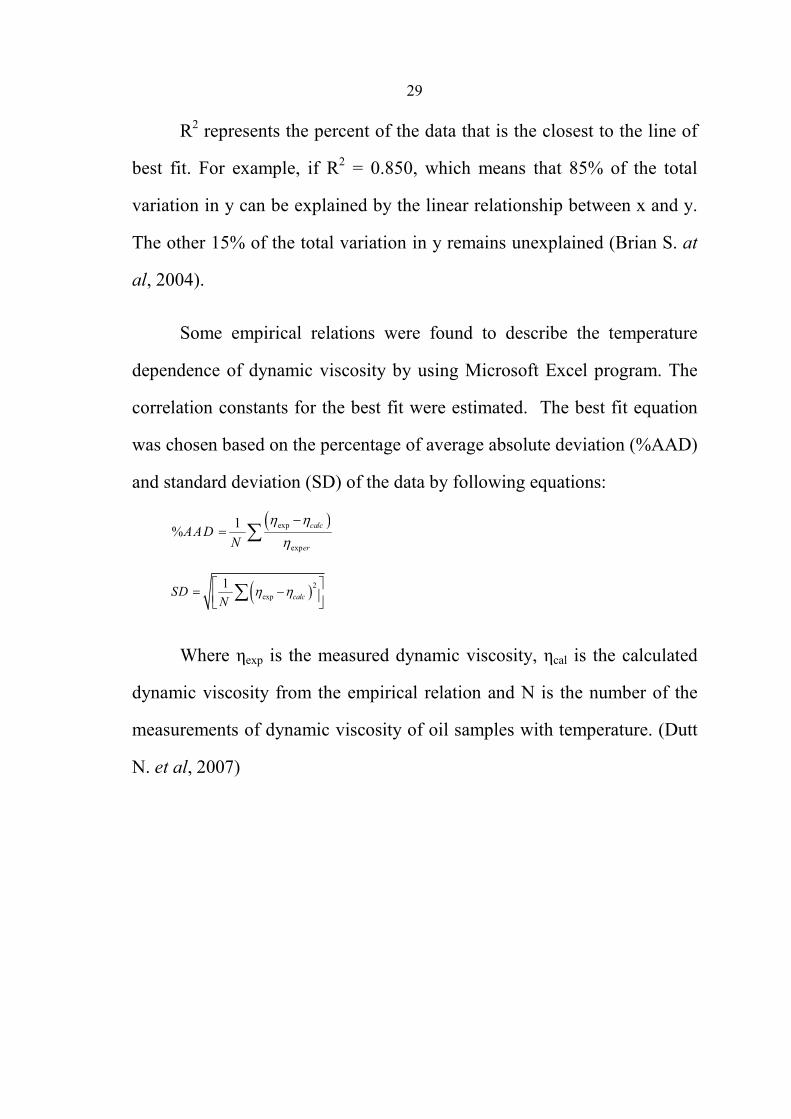
Some empirical relations were found to describe the temperature
dependence of dynamic viscosity by using Microsoft Excel program. The
correlation constants for the best fit were estimated. The best fit equation
was chosen based on the percentage of average absolute deviation (%AAD)
and standard deviation (SD) of the data by following equations:
)( exp
exp
1%
calc
er
AADN
η η
η
−= ∑
)( 2
exp
1calcSD
Nη η = −
∑
Where ηexp is the measured dynamic viscosity, ηcal is the calculated
dynamic viscosity from the empirical relation and N is the number of the
measurements of dynamic viscosity of oil samples with temperature. (Dutt
N. et al, 2007)

30
Chapter Four
Results and Analysis
4.1 Density Results
The density values of olive oil samples of different locations and
different storage ages were measured at 15 ºC as given in Table 4.1.
Table (4.1): The density measurements of some olive oil samples of this work.
Density (g/cm3) Storage age (year) Location 0.91287 0 Meithaloon
0.91384 0 Jenin
0.90982 0 Al-yamun
0.91176 0 Beita
0.91228 0 Sabastiya
0.91279 0 Ti'innik
0.91266 0 Saida
0.9124 1 Jeet
0.91259 5 Jeet
0.91174 5 Meithaloon
0.91166 13 Jeet
According to density measurements in Table 4.1 the average value of
density of olive oil samples of crop 2010 is 0.91229 g/cm3.
4.2 Viscosity Results
4.2.1 Temperature-Dependence of Dynamic Viscosity
4.2.1 I Yearly Basis
The dynamic viscosity of olive oil samples from two different
locations (L1 and L2) and different storage ages in years were measured as a
function of temperature. The measured data are given in Table 4.2.
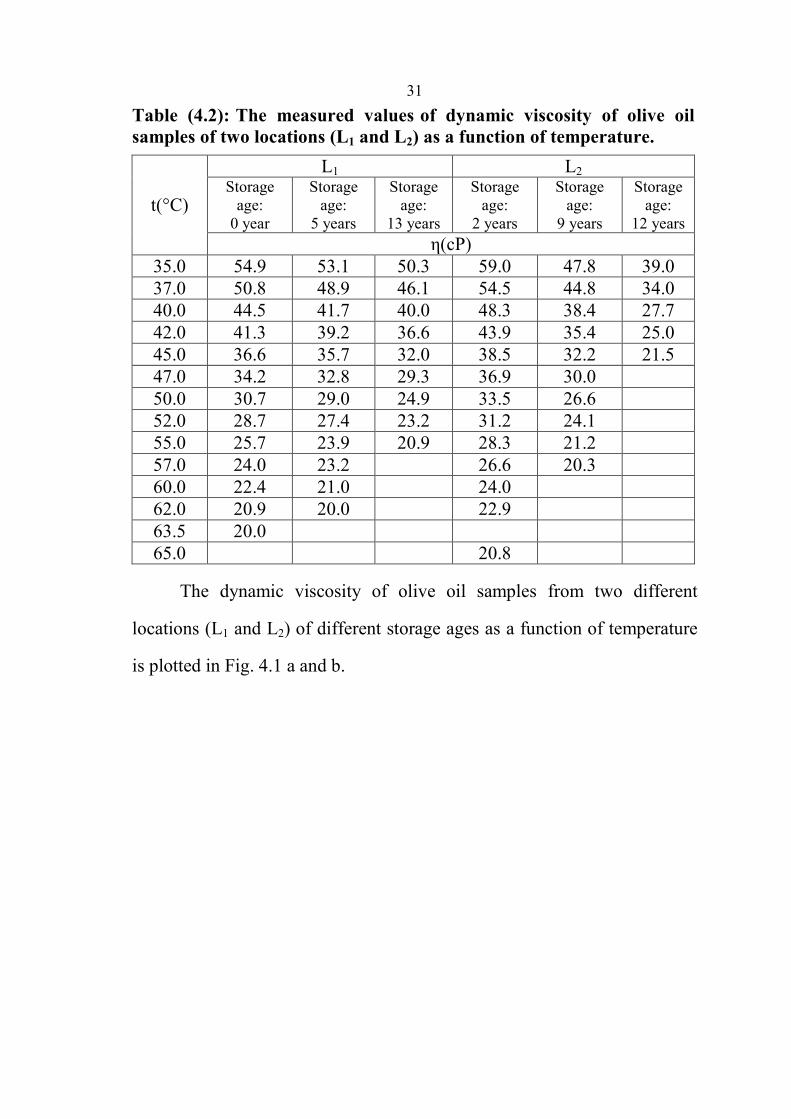
31
Table (4.2): The measured values of dynamic viscosity of olive oil samples of two locations (L1 and L2) as a function of temperature.
L2 L1 Storage
age:
12 years
Storage
age:
9 years
Storage
age:
2 years
Storage
age:
13 years
Storage
age:
5 years
Storage
age:
0 year
η(cP)
t(°C)
39.0 47.8 59.0 50.3 53.1 54.9 35.0
34.0 44.8 54.5 46.1 48.9 50.8 37.0
27.7 38.4 48.3 40.0 41.7 44.5 40.0
25.0 35.4 43.9 36.6 39.2 41.3 42.0
21.5 32.2 38.5 32.0 35.7 36.6 45.0
30.0 36.9 29.3 32.8 34.2 47.0
26.6 33.5 24.9 29.0 30.7 50.0
24.1 31.2 23.2 27.4 28.7 52.0
21.2 28.3 20.9 23.9 25.7 55.0
20.3 26.6 23.2 24.0 57.0
24.0 21.0 22.4 60.0
22.9 20.0 20.9 62.0
20.0 63.5
20.8 65.0
The dynamic viscosity of olive oil samples from two different
locations (L1 and L2) of different storage ages as a function of temperature
is plotted in Fig. 4.1 a and b.

32
Figure (4.1): The measured values of dynamic viscosity of olive oil samples from two different locations a) L1 and b) L2 of different storage ages as function of temperature.
Our experimental results of dynamic viscosity of olive oil samples
(ηexp) were compared with the previous calculated values (ηcal) found by
using Abramovic’s formula of two-constant η = A - BLogt (Table 4.3) and
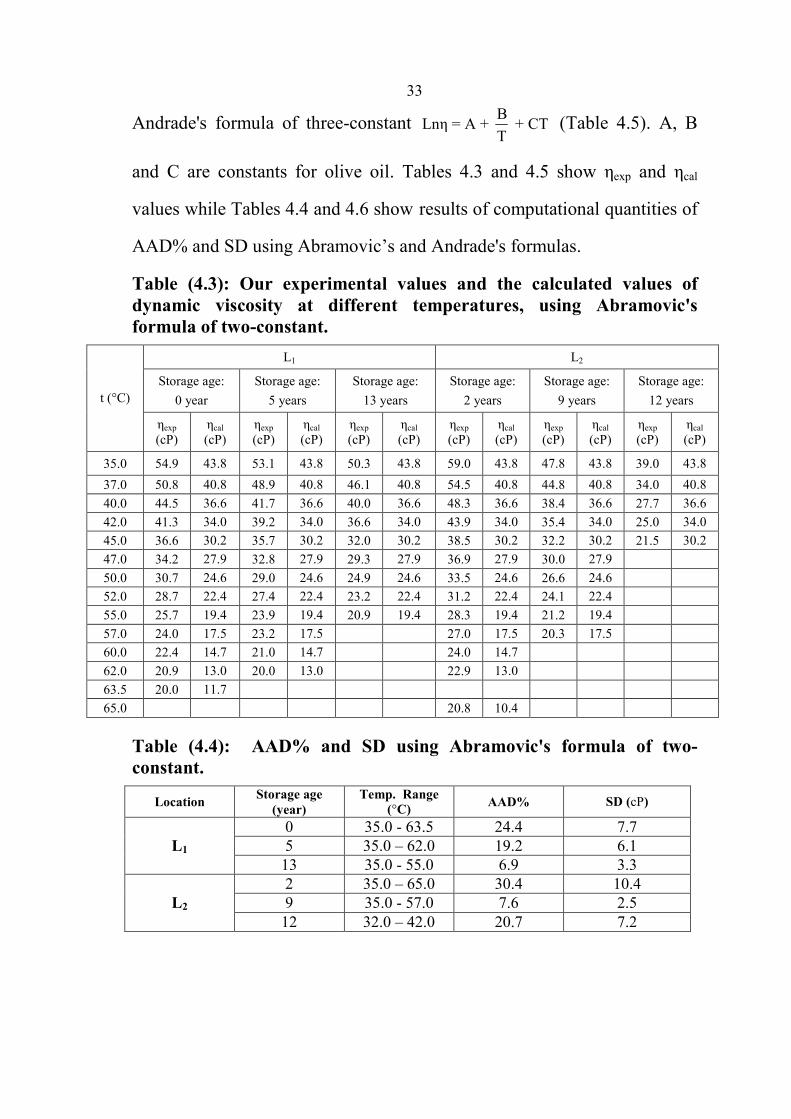
33
Andrade's formula of three-constant B
Lnη = A + + CTT
(Table 4.5). A, B
and C are constants for olive oil. Tables 4.3 and 4.5 show ηexp and ηcal
values while Tables 4.4 and 4.6 show results of computational quantities of
AAD% and SD using Abramovic’s and Andrade's formulas.
Table (4.3): Our experimental values and the calculated values of dynamic viscosity at different temperatures, using Abramovic's formula of two-constant.
L2 L1
Storage age:
12 years
Storage age:
9 years
Storage age:
2 years
Storage age:
13 years
Storage age:
5 years
Storage age:
0 year
ηcal
(cP)
ηexp
(cP)
ηcal
(cP)
ηexp
(cP)
ηcal
(cP)
ηexp
(cP)
ηcal
(cP)
ηexp
(cP)
ηcal
(cP)
ηexp
(cP)
ηcal
(cP)
ηexp
(cP)
t (°C)
43.8 39.0 43.8 47.8 43.8 59.0 43.8 50.3 43.8 53.1 43.8 54.9 35.0
40.8 34.0 40.8 44.8 40.8 54.5 40.8 46.1 40.8 48.9 40.8 50.8 37.0
36.6 27.7 36.6 38.4 36.6 48.3 36.6 40.0 36.6 41.7 36.6 44.5 40.0
34.0 25.0 34.0 35.4 34.0 43.9 34.0 36.6 34.0 39.2 34.0 41.3 42.0
30.2 21.5 30.2 32.2 30.2 38.5 30.2 32.0 30.2 35.7 30.2 36.6 45.0
27.9 30.0 27.9 36.9 27.9 29.3 27.9 32.8 27.9 34.2 47.0
24.6 26.6 24.6 33.5 24.6 24.9 24.6 29.0 24.6 30.7 50.0
22.4 24.1 22.4 31.2 22.4 23.2 22.4 27.4 22.4 28.7 52.0
19.4 21.2 19.4 28.3 19.4 20.9 19.4 23.9 19.4 25.7 55.0
17.5 20.3 17.5 27.0 17.5 23.2 17.5 24.0 57.0
14.7 24.0 14.7 21.0 14.7 22.4 60.0
13.0 22.9 13.0 20.0 13.0 20.9 62.0
11.7 20.0 63.5
10.4 20.8 65.0
Table (4.4): AAD% and SD using Abramovic's formula of two-constant.
Location Storage age
(year) Temp. Range
(°C) AAD% SD (cP)
0 35.0 - 63.5 24.4 7.7
5 35.0 – 62.0 19.2 6.1 L1
13 35.0 - 55.0 6.9 3.3
2 35.0 – 65.0 30.4 10.4
9 35.0 - 57.0 7.6 2.5 L2 12 32.0 – 42.0 20.7 7.2
34
Table (4.5): Our experimental values and the calculated values of dynamic viscosity at different temperatures, using Andrade's formula of three-constant.
L2 L1
Storage age:
12 years
Storage age:
9 years
Storage age:
2 years
Storage age:
13 years
Storage age:
5 years
Storage age:
0 year
ηcal
(cP)
ηexp
(cP)
ηcal
(cP)
ηexp
(cP)
ηcal
(cP)
ηexp
(cP)
ηcal
(cP)
ηexp
(cP)
ηcal
(cP)
ηexp
(cP)
ηcal
(cP)
ηexp
(cP)
T(K)
46.0 39.0 46.0 47.8 46.0 59.0 46.0 50.3 46.0 53.1 46.0 54.9 308.0
42.6 34.0 42.6 44.8 42.6 54.5 42.6 46.1 42.6 48.9 42.6 50.8 310.0
38.1 27.7 38.1 38.4 38.1 48.3 38.1 40.0 38.1 41.7 38.1 44.5 313.0
35.5 25.0 35.5 35.4 35.5 43.9 35.5 36.6 35.5 39.2 35.5 41.3 315.0
32.0 21.5 32.0 32.2 32.0 38.5 32.0 32.0 32.0 35.7 32.0 36.6 318.0
30.0 30.0 30.0 36.9 30.0 29.3 30.0 32.8 30.0 34.2 320.0
27.2 26.6 27.2 33.5 27.2 24.9 27.2 29.0 27.2 30.7 323.0
25.6 24.1 25.6 31.2 25.6 23.2 25.6 27.4 25.6 28.7 325.0
23.4 21.2 23.4 28.3 23.4 20.9 23.4 23.9 23.4 25.7 328.0
22.0 20.3 22.0 27.0 22.0 23.2 22.0 24.0 330.0
20.3 24.0 20.3 21.0 20.3 22.4 333.0
19.2 22.9 19.2 20.0 19.2 20.9 335.0
18.5 20.0 336.5
17.8 20.8 338.0
Table (4.6): AAD% and SD using Andrade's formula of three-constant.
Location Storage age
(year) Temp. Range
(K) AAD% SD(cP)
0 308.0 – 336.5 11.5 4.8
5 308.0 – 335.0 7.5 3.5 L1
13 308.0 – 328.0 1.1 2.4
2 308.0 – 338.0 18.2 7.5
9 308.0 – 330.0 1.8 1.4 L2 12 305.0 – 315.0 26.6 9.8
Table 4.4 shows that AAD% ranges from 6.9% to 30.4% and Table
4.6 shows AAD% ranges from 1.1% to 26.6%. This indicates that
Abramovic's and Andrade's formulas are not the best fit for our
experimental data of dynamic viscosity of olive oil samples.
Due to failure of Abramovic's and Andrade's formulas to fit our
experimental data, a modification was introduced to Abramovic's and
Andrade's formulas. The modification was in order to obtain a suitable

35
description of our experimental measurements of dynamic viscosity as a
function of temperature. As a result of this modification, the constants A, B
for Abramovic's formula, and A, B and C for Andrade's formula were
determined using Abramovic's and Andrade's formulas. Tables 4.7 and 4.9
show our experimental values (ηexp) and our calculated values (ηcal) using
the modified form of Abramovic’s and Andrade's formula of dynamic
viscosity at different temperatures. Tables 4.8 and 4.10 tabulate AAD% and
SD values.
Table (4.7): Our experimental values and our calculated values of dynamic viscosity at different temperatures, using the modified Abramovic's formula of two-constant.
L2 L1
Storage age:
12 years
Storage age:
9 years
Storage age:
2 years
Storage age:
13 years
Storage age:
5 years
Storage age:
0 year
ηcal
(cP)
ηexp
(cP)
ηcal
(cP)
ηexp
(cP)
ηcal
(cP)
ηexp
(cP) ηcal (cP)
ηexp
(cP)
ηcal
(cP)
ηexp
(cP)
ηcal
(cP)
ηexp
(cP)
t(°C)
39.1 39.0 47.5 47.8 56.9 59.0 49.8 50.3 51.3 53.1 53.1 54.9 35.0
34.9 34.0 44.4 44.8 53.5 54.5 46.2 46.1 48.1 48.9 49.9 50.8 37.0
29.0 27.7 39.9 38.4 48.8 48.3 41.0 40.0 43.6 41.7 45.3 44.5 40.0
25.3 25.0 37.1 35.4 45.8 43.9 37.7 36.6 40.8 39.2 42.5 41.3 42.0
20.0 21.5 33.2 32.2 41.6 38.5 33.1 32.0 36.9 35.7 38.5 36.6 45.0
30.7 30.0 38.9 36.9 30.3 29.3 34.4 32.8 36.0 34.2 47.0
27.2 26.6 35.2 33.5 26.2 24.9 30.8 29.0 32.4 30.7 50.0
25.0 24.1 32.8 31.2 23.5 23.2 28.6 27.4 30.1 28.7 52.0
21.8 21.2 29.4 28.3 19.8 20.9 25.4 23.9 26.9 25.7 55.0
19.7 20.3 27.2 27.0 23.3 23.2 24.8 24.0 57.0
24.1 24.0 20.4 21.0 21.9 22.4 60.0
22.1 22.9 18.5 20.0 20.0 20.9 62.0
18.6 20.0 63.5
19.2 20.8 65.0
Table (4.8): Our values of A, B, AAD% and SD using the modified Abramovic's formula of two-constant.
Location Storage age
(year) A(cP) B (cP)
Temp. Range (°C)
AAD% SD (cP)
0 259.0 133.3681 35.0 - 63.5 1.2 1.4
5 255.0 131.9373 35.0 – 62.0 1.7 1.4 L1
13 286.0 152.9451 35.0 – 55.0 1.5 0.9
2 273.5 140.2751 35.0 – 65.0 1.5 1.6
9 250.4 131.3744 35.0 -57.0 1.9 1.0 L2 12 308.7 174.6107 32.0 – 42.0 1.3 1.0

36
Table (4.9): Our experimental values and our calculated values of dynamic viscosity at different temperature using the modified Andrade's formula of three-constant.
L2 L1
Storage age:
12 years
Storage age:
9 years
Storage age:
2 years
Storage age:
13 years
Storage age:
5 years
Storage age:
0 year
ηcal
(cP)
ηexp
(cP)
ηcal
(cP)
ηexp
(cP)
ηcal
(cP)
ηexp
(cP)
ηcal
(cP)
ηexp
(cP)
ηcal
(cP)
ηexp
(cP)
ηcal
(cP)
ηexp
(cP)
T(K)
39.1 39.0 48.6 47.8 56.9 59.0 51.4 50.3 51.6 53.1 55.2 54.9 308.0
34.5 34.0 44.7 44.8 52.7 54.5 46.8 46.1 47.6 48.9 51.0 50.8 310.0
28.6 27.7 39.5 38.4 47.0 48.3 40.6 40.0 42.3 41.7 45.4 44.5 313.0
25.3 25.0 36.4 35.4 43.6 43.9 37.1 36.6 39.2 39.2 42.1 41.3 315.0
21.2 21.5 32.3 32.2 39.1 38.5 32.4 32.0 34.9 35.7 37.6 36.6 318.0
29.8 30.0 36.4 36.9 29.6 29.3 32.4 32.8 35.0 34.2 320.0
26.6 26.6 32.7 33.5 25.9 24.9 29.0 29.0 31.4 30.7 323.0
24.6 24.1 30.5 31.2 23.8 23.2 26.9 27.4 29.2 28.7 325.0
22.0 21.2 27.5 28.3 20.9 20.9 24.2 23.9 26.3 25.7 328.0
20.4 20.3 25.7 27.0 22.5 23.2 24.5 24.0 330.0
23.2 24.0 20.3 21.0 22.1 22.4 333.0
21.7 22.9 18.9 20.0 20.7 20.9 335.0
19.7 20.0 336.5
19.7 20.8 338.0
Table (4.10): Our values of A, B, C, AAD% and SD using the modified Andrade's formula of three-constant.
.Location Storage
age (year)
A B (K) C (1/K)
×10-5
Temp. Range
(K) AAD%
SD (cP)
0 -07.72 3677.985 -69.00 308.0 – 336.5 1.2 0.6
5 -08.00 3750.927 -76.00 308.0 – 335.0 1.5 0.8 L1
13 -10.84 4545.880 6.83 308.0 – 328.0 1.8 0.7
2 -07.38 3592.578 -79.00 308.0 – 338.0 2.6 1.1
9 -09.21 4023.601 9.98 308.0 – 330.0 1.4 0.6 L2
12 -15.30 5932.681 -96.00 305.0 – 315.0 1.5 0.6
37
The modified forms of Abramovic's and Andrade's formulas give
AAD% ≤1.9% and ≤ 2.6%, respectively (Table 4.8 and 4.10). This shows
that the modified form of Abramovic's and Andrade's formulas don’t fit
exactly our experimental data.
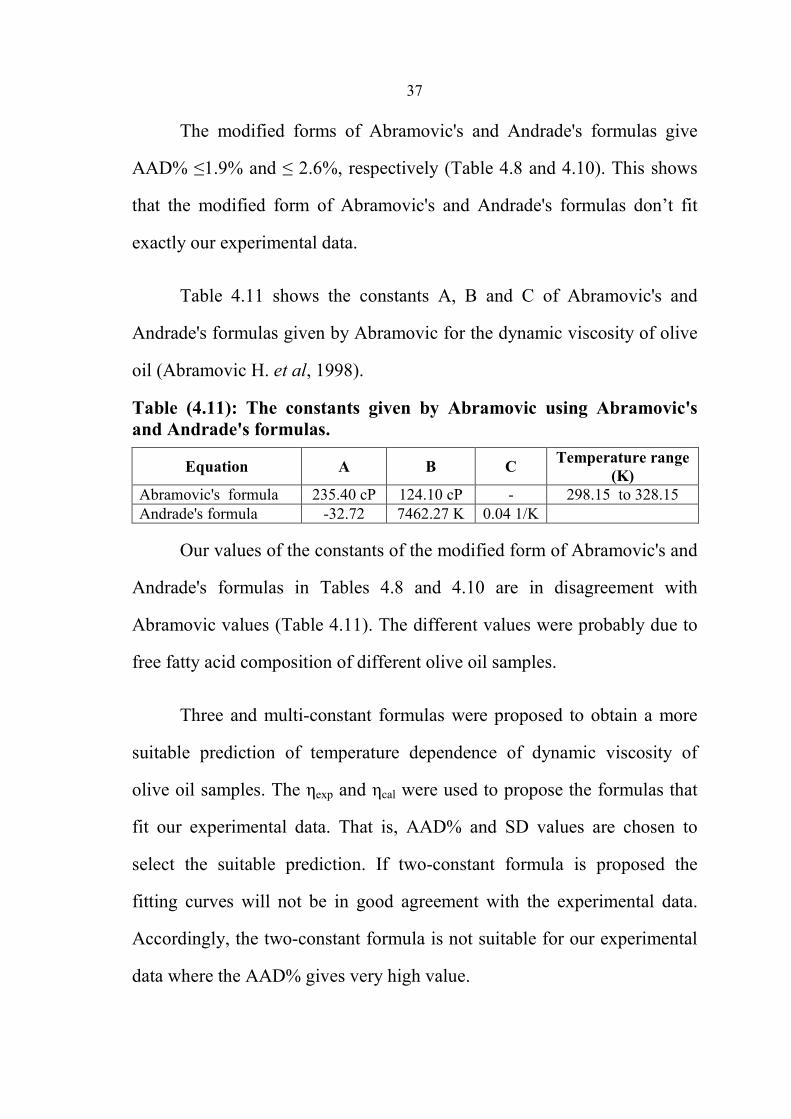
Table 4.11 shows the constants A, B and C of Abramovic's and
Andrade's formulas given by Abramovic for the dynamic viscosity of olive
oil (Abramovic H. et al, 1998).
Table (4.11): The constants given by Abramovic using Abramovic's and Andrade's formulas.
Equation A B C Temperature range
(K) Abramovic's formula 235.40 cP 124.10 cP - 298.15 to 328.15
Andrade's formula -32.72 7462.27 K 0.04 1/K
Our values of the constants of the modified form of Abramovic's and
Andrade's formulas in Tables 4.8 and 4.10 are in disagreement with
Abramovic values (Table 4.11). The different values were probably due to
free fatty acid composition of different olive oil samples.
Three and multi-constant formulas were proposed to obtain a more
suitable prediction of temperature dependence of dynamic viscosity of
olive oil samples. The ηexp and ηcal were used to propose the formulas that
fit our experimental data. That is, AAD% and SD values are chosen to
select the suitable prediction. If two-constant formula is proposed the
fitting curves will not be in good agreement with the experimental data.
Accordingly, the two-constant formula is not suitable for our experimental
data where the AAD% gives very high value.
38
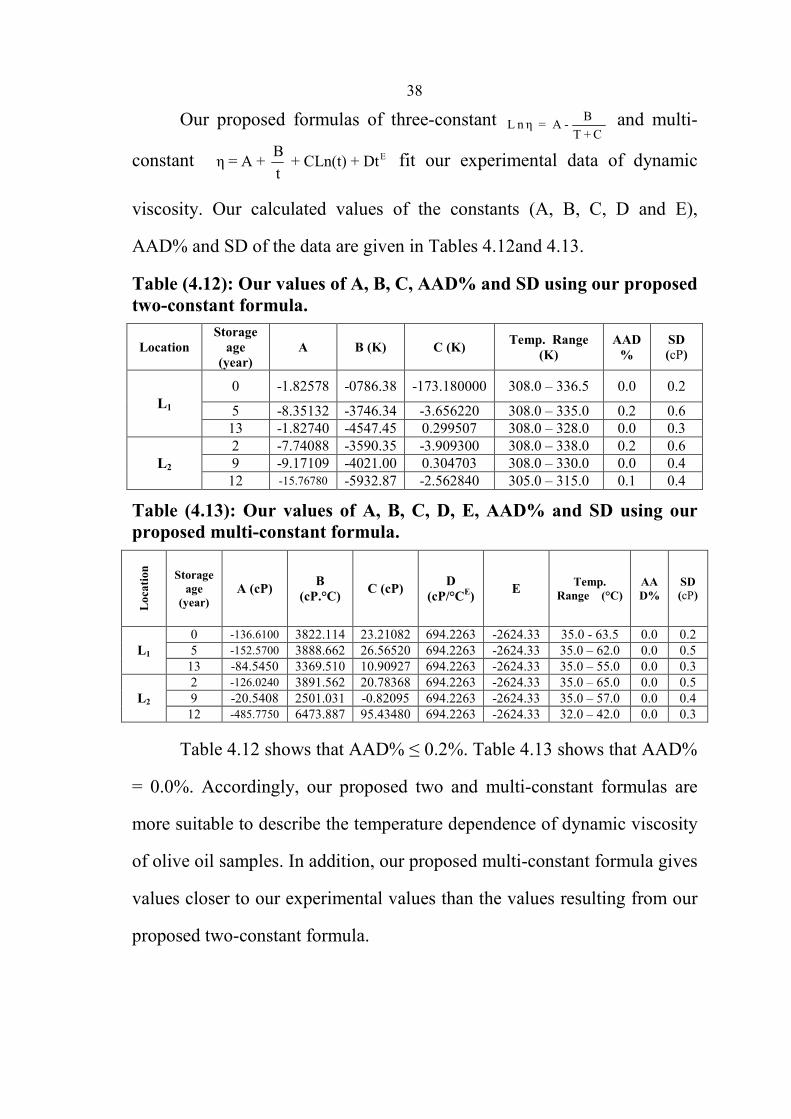
Our proposed formulas of three-constant BL n η = A -
T + C and multi-
constant EBη = A + + CLn(t) + Dt
t fit our experimental data of dynamic
viscosity. Our calculated values of the constants (A, B, C, D and E),
AAD% and SD of the data are given in Tables 4.12and 4.13.
Table (4.12): Our values of A, B, C, AAD% and SD using our proposed two-constant formula.
Location Storage
age (year)
A B (K) C (K) Temp. Range
(K) AAD
% SD (cP)
0 -1.82578 -0786.38 -173.180000 308.0 – 336.5 0.0 0.2
5 -8.35132 -3746.34 -3.656220 308.0 – 335.0 0.2 0.6 L1
13 -1.82740 -4547.45 0.299507 308.0 – 328.0 0.0 0.3
2 -7.74088 -3590.35 -3.909300 308.0 – 338.0 0.2 0.6
9 -9.17109 -4021.00 0.304703 308.0 – 330.0 0.0 0.4 L2 12 -15.76780 -5932.87 -2.562840 305.0 – 315.0 0.1 0.4
Table (4.13): Our values of A, B, C, D, E, AAD% and SD using our proposed multi-constant formula.
Loc
atio
n
Storage age
(year) A (cP)
B (cP.°C)
C (cP) D
(cP/°CE) E
Temp. Range (°C)
AAD%
SD (cP)
0 -136.6100 3822.114 23.21082 694.2263 -2624.33 35.0 - 63.5 0.0 0.2
5 -152.5700 3888.662 26.56520 694.2263 -2624.33 35.0 – 62.0 0.0 0.5 L1
13 -84.5450 3369.510 10.90927 694.2263 -2624.33 35.0 – 55.0 0.0 0.3
2 -126.0240 3891.562 20.78368 694.2263 -2624.33 35.0 – 65.0 0.0 0.5
9 -20.5408 2501.031 -0.82095 694.2263 -2624.33 35.0 – 57.0 0.0 0.4 L2 12 -485.7750 6473.887 95.43480 694.2263 -2624.33 32.0 – 42.0 0.0 0.3
Table 4.12 shows that AAD% ≤ 0.2%. Table 4.13 shows that AAD%
= 0.0%. Accordingly, our proposed two and multi-constant formulas are
more suitable to describe the temperature dependence of dynamic viscosity
of olive oil samples. In addition, our proposed multi-constant formula gives
values closer to our experimental values than the values resulting from our
proposed two-constant formula.
39
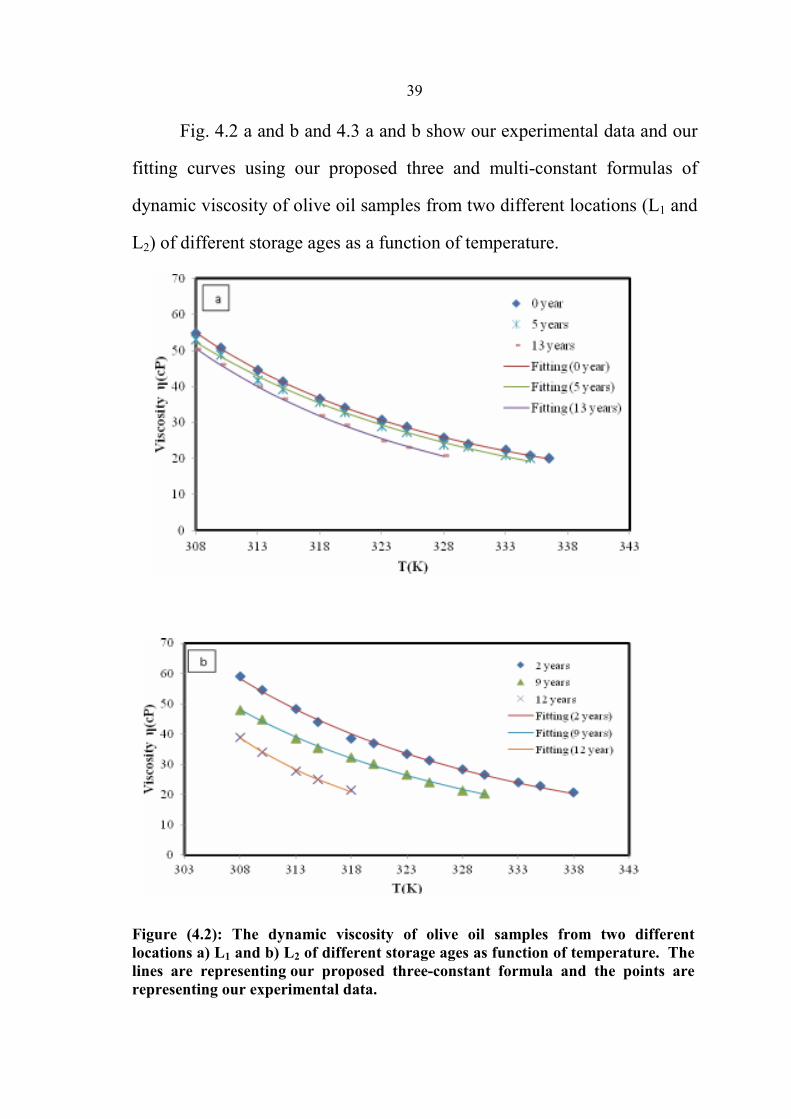
Fig. 4.2 a and b and 4.3 a and b show our experimental data and our
fitting curves using our proposed three and multi-constant formulas of
dynamic viscosity of olive oil samples from two different locations (L1 and
L2) of different storage ages as a function of temperature.
Figure (4.2): The dynamic viscosity of olive oil samples from two different locations a) L1 and b) L2 of different storage ages as function of temperature. The lines are representing our proposed three-constant formula and the points are representing our experimental data.
40
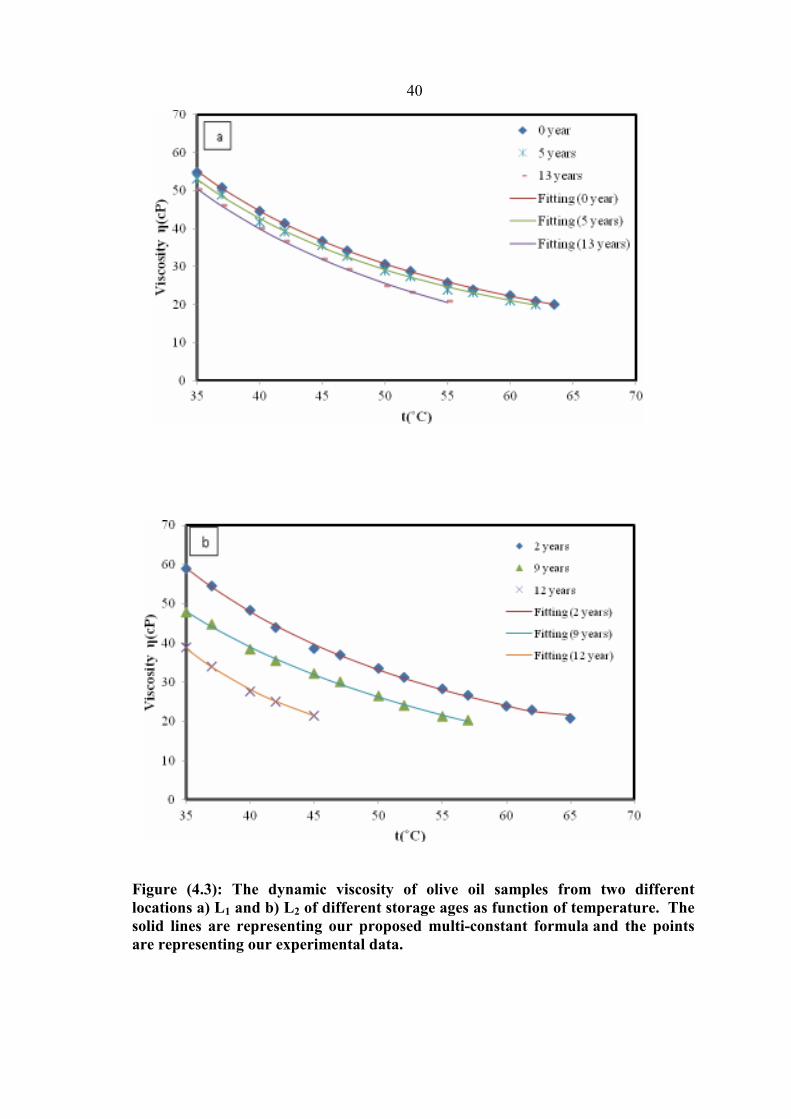
Figure (4.3): The dynamic viscosity of olive oil samples from two different locations a) L1 and b) L2 of different storage ages as function of temperature. The solid lines are representing our proposed multi-constant formula and the points are representing our experimental data.

41
4.2.1 II Weekly Basis
The dynamic viscosity of olive oil samples of the crop 2010 from
two different locations (L3 and L4) at different temperatures was measured
at different stages of storage in weeks, as given in Table 4.14.
Table (4.14): The measured values of the dynamic viscosity of olive oil samples from L3 and L4 as a function of temperature.
L4 L3 Storage
age:
7 weeks
Storage
age:
6 weeks
Storage
age:
3 weeks
Storage
age:
1 week
Storage
age:
8 weeks
Storage
age:
3 weeks
Storage
age:
1week
η (cP)
t(°C)
32.9 33.1 37.4 39.9 35.9 36.6 37.7 42.0
28.3 29.3 32.9 35.6 31.9 33.1 33.2 45.0
26.0 26.6 30.7 32.1 29.0 30.6 30.9 47.0
23.0 23.6 27.6 28.4 26.1 27.5 27.6 50.0
20.6 22.3 25.9 26.6 23.5 25.0 25.7 52.0
23.2 24.2 21.7 22.5 23.2 55.0
22.2 23.1 20.2 21.5 21.6 57.0
20.4 60.0
The dynamic viscosity of olive oil samples from different locations
(L3 and L4) as a function of temperature, which was measured after some
weeks, is plotted in Fig. 4.4 a and b.

42
Figure (4.4): The measured values of the dynamic viscosity of olive oil samples from two different locations a) L3 and b) L4 for different storage age in weeks as a function of temperature.
A comparison was made between the measured experimental data of
dynamic viscosity (ηexp) and the previously calculated values (ηcal). This
calculated values found by two-constant formula of
a
b
43
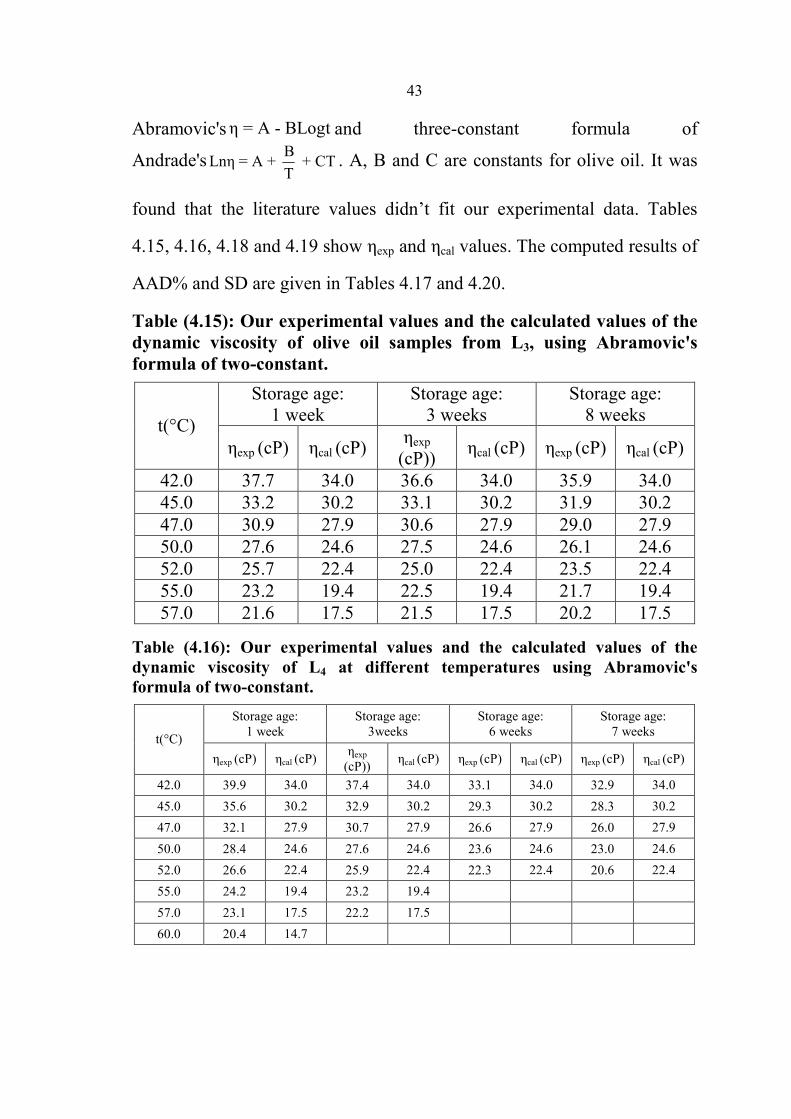
Abramovic's η = A - BLogt and three-constant formula of
Andrade'sB
Lnη = A + + CTT
. A, B and C are constants for olive oil. It was
found that the literature values didn’t fit our experimental data. Tables
4.15, 4.16, 4.18 and 4.19 show ηexp and ηcal values. The computed results of
AAD% and SD are given in Tables 4.17 and 4.20.
Table (4.15): Our experimental values and the calculated values of the dynamic viscosity of olive oil samples from L3, using Abramovic's formula of two-constant.
Storage age:
8 weeks
Storage age:
3 weeks
Storage age:
1 week
ηcal (cP) ηexp (cP) ηcal (cP) ηexp
(cP)) ηcal (cP) ηexp (cP)
t(°C)
34.0 35.9 34.0 36.6 34.0 37.7 42.0
30.2 31.9 30.2 33.1 30.2 33.2 45.0
27.9 29.0 27.9 30.6 27.9 30.9 47.0
24.6 26.1 24.6 27.5 24.6 27.6 50.0
22.4 23.5 22.4 25.0 22.4 25.7 52.0
19.4 21.7 19.4 22.5 19.4 23.2 55.0
17.5 20.2 17.5 21.5 17.5 21.6 57.0
Table (4.16): Our experimental values and the calculated values of the dynamic viscosity of L4 at different temperatures using Abramovic's formula of two-constant.
Storage age:
7 weeks
Storage age:
6 weeks
Storage age:
3weeks
Storage age:
1 week
ηcal (cP) ηexp (cP) ηcal (cP) ηexp (cP) ηcal (cP) ηexp
(cP)) ηcal (cP) ηexp (cP)
t(°C)
34.0 32.9 34.0 33.1 34.0 37.4 34.0 39.9 42.0
30.2 28.3 30.2 29.3 30.2 32.9 30.2 35.6 45.0
27.9 26.0 27.9 26.6 27.9 30.7 27.9 32.1 47.0
24.6 23.0 24.6 23.6 24.6 27.6 24.6 28.4 50.0
22.4 20.6 22.4 22.3 22.4 25.9 22.4 26.6 52.0
19.4 23.2 19.4 24.2 55.0
17.5 22.2 17.5 23.1 57.0
14.7 20.4 60.0
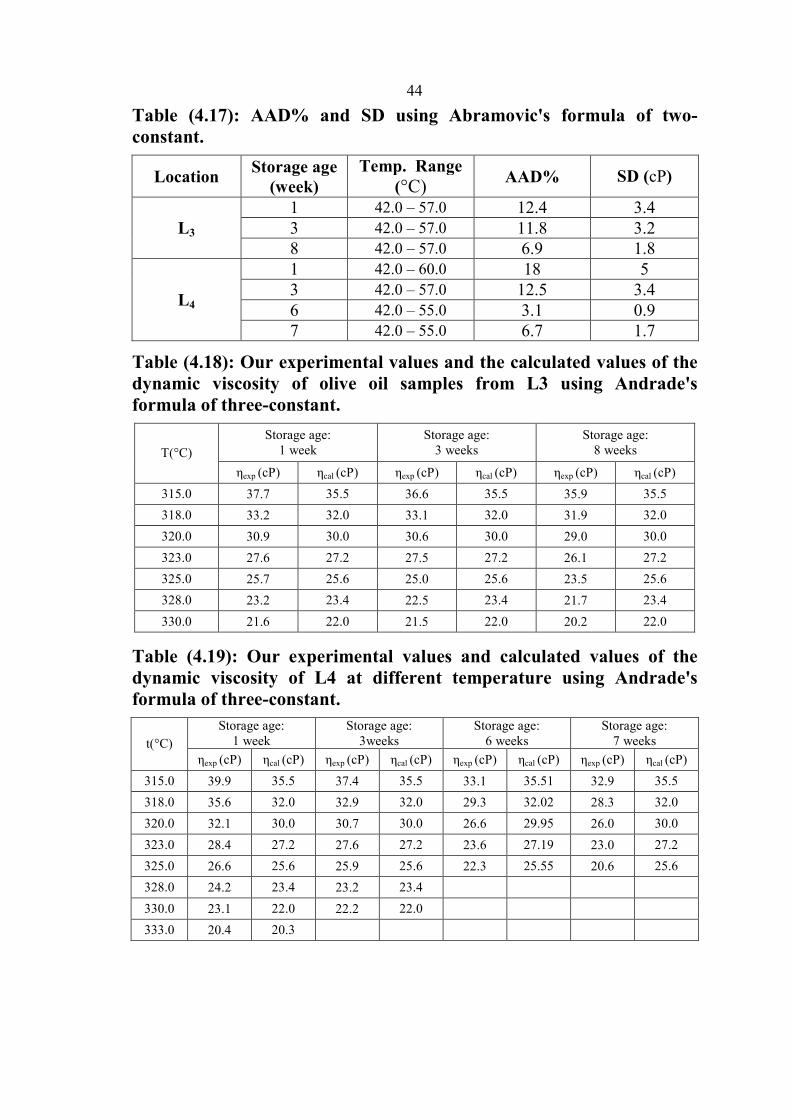
44
Table (4.17): AAD% and SD using Abramovic's formula of two-constant.
Location Storage age
(week) Temp. Range
(°C) AAD% SD (cP)
1 42.0 – 57.0 12.4 3.4
3 42.0 – 57.0 11.8 3.2 L3
8 42.0 – 57.0 6.9 1.8
1 42.0 – 60.0 18 5
3 42.0 – 57.0 12.5 3.4
6 42.0 – 55.0 3.1 0.9 L4
7 42.0 – 55.0 6.7 1.7
Table (4.18): Our experimental values and the calculated values of the dynamic viscosity of olive oil samples from L3 using Andrade's formula of three-constant.
Storage age:
8 weeks
Storage age:
3 weeks
Storage age:
1 week
ηcal (cP) ηexp (cP) ηcal (cP) ηexp (cP) ηcal (cP) ηexp (cP) T(°C)
35.5 35.9 35.5 36.6 35.5 37.7 315.0
32.0 31.9 32.0 33.1 32.0 33.2 318.0
30.0 29.0 30.0 30.6 30.0 30.9 320.0
27.2 26.1 27.2 27.5 27.2 27.6 323.0
25.6 23.5 25.6 25.0 25.6 25.7 325.0
23.4 21.7 23.4 22.5 23.4 23.2 328.0
22.0 20.2 22.0 21.5 22.0 21.6 330.0
Table (4.19): Our experimental values and calculated values of the dynamic viscosity of L4 at different temperature using Andrade's formula of three-constant.
Storage age:
7 weeks
Storage age:
6 weeks
Storage age:
3weeks
Storage age:
1 week
ηcal (cP) ηexp (cP) ηcal (cP) ηexp (cP) ηcal (cP) ηexp (cP) ηcal (cP) ηexp (cP)
t(°C)
35.5 32.9 35.51 33.1 35.5 37.4 35.5 39.9 315.0
32.0 28.3 32.02 29.3 32.0 32.9 32.0 35.6 318.0
30.0 26.0 29.95 26.6 30.0 30.7 30.0 32.1 320.0
27.2 23.0 27.19 23.6 27.2 27.6 27.2 28.4 323.0
25.6 20.6 25.55 22.3 25.6 25.9 25.6 26.6 325.0
23.4 23.2 23.4 24.2 328.0
22.0 22.2 22.0 23.1 330.0
20.3 20.4 333.0

45
Table (4.20): AAD% and SD using Andrade's formula of three-constant.
Location Storage age
(week) Temp. Range
(K) AAD% SD (cP)
1 315.0 – 330.0 1.6 1.0
3 315.0 – 330.0 0.8 1.0 L3
8 315.0 – 330.0 4.7 1.3
1 315.0 – 333.0 5.5 2.3
3 315.0 – 330.0 1.8 0.9
6 315.0 – 325.0 11.8 3.1 L4
7 315.0 – 325.0 15.8 4.0
Using Abramovic's and Andrade's formulas, the AAD% values were
found to be from 3.1% to 12.4% (Table 4.17) and from 0.8% to 15.8%,
(Table 4.20), respectivaly. As a result, their formulas were not the best fit
for our experimental data of dynamic viscosity of olive oil samples.
Abramovic's and Andrade's formulas didn't fit for our experimental
data of dynamic viscosity of olive oil samples. Accordingly, a modification
was introduced to their formula in order to obtain a suitable description of
our experimental data of dynamic viscosity as a function of temperature.
The constants of Abramovic's and Andrade's formulas were determined
using the modification. Our experimental values (ηexp) and calculated
values (ηcal), using the modified form of Abramovic’s and Andrade's
formulas of dynamic viscosity at different temperatures are given in Tables
4.21, 4.21, 4.24 and 4.25. Tables 4.23 and 4.26 tabulate AAD% and SD
values.

46
Table (4.21): Our experimental values and calculated values of the dynamic viscosity of L3 at different temperatures, using the modified Abramovic's formula of two-constant.
Storage age:
8 weeks
Storage age:
3 weeks
Storage age:
1 week
ηcal (cP) ηexp (cP) ηcal (cP) ηexp (cP) ηcal (cP) ηexp (cP)
t(°C)
35.7 35.9 37.0 36.6 37.4 37.7 42.0
32.2 31.9 33.4 33.1 33.9 33.2 45.0
30.0 29.0 31.2 30.6 31.6 30.9 47.0
26.8 26.1 27.9 27.5 28.4 27.6 50.0
24.8 23.5 25.9 25.0 26.3 25.7 52.0
21.9 21.7 23.0 22.5 23.4 23.2 55.0
20.0 20.2 21.1 21.5 21.6 21.6 57.0
Table (4.22): Our experimental values and our calculated values of the dynamic viscosity of L4 at different temperatures, using the modified Abramovic's formula of two-constant.
Storage age:
7 weeks
Storage age:
6 weeks
Storage age:
3weeks
Storage age:
1 week
ηcal (cP) ηexp (cP) ηcal (cP) ηexp (cP) ηcal (cP) ηexp (cP) ηcal (cP) ηexp (cP)
t(°C)
32.9 32.9 32.4 33.1 37.0 37.4 39.4 39.9 42.0
29.0 28.3 28.8 29.3 33.6 32.9 35.6 35.6 45.0
26.6 26.0 26.6 26.6 31.4 30.7 33.3 32.1 47.0
23.1 23.0 23.4 23.6 28.4 27.6 29.9 28.4 50.0
20.9 20.6 21.3 22.3 26.4 25.9 27.8 26.6 52.0
23.7 23.2 24.8 24.2 55.0
21.9 22.2 22.9 23.1 57.0
20.1 20.4 60.0
Table (4.23): Our values of A, B, AAD% and SD using the modified Abramovic's formula of two-constant of olive oil samples from L3 and L4.
Location Storage age
(week) A(cP) B (cP)
Temp. Range (°C)
AAD% SD (cP)
1 231.5 119.5513 42.0 – 57.0 1.5 0.5
3 231.2 119.6388 42.0 – 57.0 1.3 0.5 L3 8 228.0 118.4390 42.0 – 57.0 1.7 0.7
1 241.3 124.4046 42.0 – 60.0 1.6 0.9
3 222.2 114.0817 42.0 – 57.0 1.4 0.6
6 225.0 118.6790 42.0 – 55.0 1.8 0.6 L4
7 243.0 129.4211 42.0 – 55.0 1.5 0.5

47
Table (4.24): Our experimental values and our calculated values of the dynamic viscosity of L3 at different temperatures, using the modified Andrade's formula of three-constant.
Storage age:
8 weeks
Storage age:
3 weeks
Storage age:
1 week
ηcal (cP) ηexp (cP) ηcal (cP) ηexp (cP) ηcal (cP) ηexp (cP)
T(K)
36.0 35.9 37.2 36.6 37.1 37.7 315.0
31.9 31.9 33.1 33.1 33.1 33.2 318.0
29.5 29.0 30.7 30.6 30.7 30.9 320.0
26.2 26.1 27.4 27.5 27.5 27.6 323.0
24.2 23.5 25.5 25.0 25.5 25.7 325.0
21.6 21.7 22.9 22.5 22.9 23.2 328.0
20.0 20.2 21.3 21.5 21.3 21.6 330.0
Table (4.25): Our experimental values and calculated values of the dynamic viscosity of L4 at different temperatures, using the modified Andrade's formula of three-constant.
Storage age:
7 weeks
Storage age:
6 weeks
Storage age:
3weeks
Storage age:
1 week
ηcal (cP) ηexp (cP) ηcal (cP) ηexp (cP) ηcal (cP) ηexp (cP) ηcal (cP) ηexp (cP)
T(K)
32.3 32.9 32.7 33.1 36.5 37.4 39.3 39.9 315.0
28.1 28.3 28.8 29.3 32.7 32.9 35.0 35.6 318.0
25.6 26.0 26.5 26.6 30.4 30.7 32.4 32.1 320.0
22.3 23.0 23.4 23.6 27.3 27.6 28.9 28.4 323.0
20.4 20.6 21.6 22.3 25.5 25.9 26.8 26.6 325.0
22.9 23.2 24.0 24.2 328.0
21.4 22.2 22.3 23.1 330.0
20.0 20.4 333.0
Table (4.26): Our values of A, B, AAD% and SD using the modified Andrade's formula of three-constant of olive oil samples from L3 and L4.
Location Storage
age (weeks)
A B (K) C (K
2)
× 10-5
Temp. Range
(K) AAD
% SD
1 -3.64 3050.001 -771 315.0 – 330.0 0.9 0.3
3 -3.60 3052.000 -785 315.0 – 330.0 0.6 0.3 L3 8 -3.00 3050.289 -984 315.0 – 330.0 0.7 0.4
1 -3.31 3050.287 -858 315.0 – 333.0 0.7 0.5
3 -4.14 3050.281 -618 315.0 – 330.0 1.6 0.5
6 -2.60 3050.291 -1142 315.0 – 325.0 1.4 0.4 L4
7 -1.13 3050.299 -1612 315.0 – 325.0 1.5 0.4
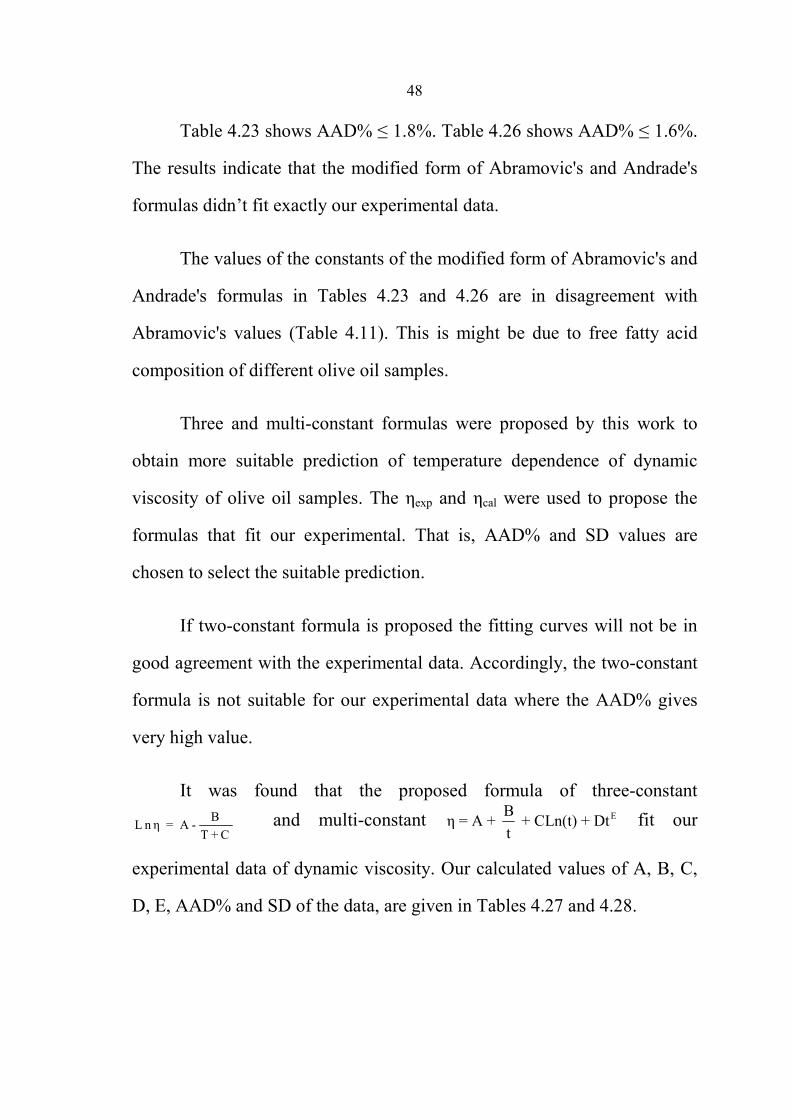
48
Table 4.23 shows AAD% ≤ 1.8%. Table 4.26 shows AAD% ≤ 1.6%.
The results indicate that the modified form of Abramovic's and Andrade's
formulas didn’t fit exactly our experimental data.
The values of the constants of the modified form of Abramovic's and
Andrade's formulas in Tables 4.23 and 4.26 are in disagreement with
Abramovic's values (Table 4.11). This is might be due to free fatty acid
composition of different olive oil samples.
Three and multi-constant formulas were proposed by this work to
obtain more suitable prediction of temperature dependence of dynamic
viscosity of olive oil samples. The ηexp and ηcal were used to propose the
formulas that fit our experimental. That is, AAD% and SD values are
chosen to select the suitable prediction.
If two-constant formula is proposed the fitting curves will not be in
good agreement with the experimental data. Accordingly, the two-constant
formula is not suitable for our experimental data where the AAD% gives
very high value.
It was found that the proposed formula of three-constant
BL n η = A -
T + C and multi-constant EB
η = A + + CLn(t) + Dtt
fit our
experimental data of dynamic viscosity. Our calculated values of A, B, C,
D, E, AAD% and SD of the data, are given in Tables 4.27 and 4.28.

49
Table (4.27): Our values of A, B, C, AAD% and SD using our proposed three-constant formula of olive oil samples of L3 and L4.
Location Storage
age (weeks)
A B (K) C (K) Temp. Range
(K) AAD
% SD (cP)
1 -7.30653 -3053.11 -35.6963 315.0 – 330.0 0.0 0.1
3 -7.25578 -3053.05 -33.9289 315.0 – 330.0 0.0 0.3 L3 8 -7.62857 -3053.43 -42.5131 315.0 – 330.0 0.0 0.3
1 -7.36674 -3053.25 -38.5983 315.0 – 333.0 0.1 0.4
3 -7.04828 -3052.78 -28.6302 315.0 – 330.0 0.0 0.2
6 -7.87487 -3053.66 -46.5050 315.0 – 325.0 0.0 0.2 L4
7 -8.57047 -3054.37 -61.7518 315.0 – 325.0 0.0 0.2
Table (4.28): Our values of A, B, C, D, E, AAD% and SD using our proposed multi-constants formula.
Loc
atio
n
Storage age
(week) A (cP) B (cP.°C) C (cP) D(cP/°CE) E
Temp Range (°C)
AAD%
SD (cP)
1 -150.31904 3820.695 25.94402 694.2263 -2624.33 42.0 – 57.0 0.0 0.1
3 41.22569 1897.006 -13.18860 694.2263 -2624.33 42.0 – 57.0 0.0 0.4 L3
8 -299.88700 5270.429 56.30426 694.2263 -2624.33 42.0 – 57.0 0.0 0.2
1 -355.97400 6073.650 67.27800 694.2263 -2624.33 42.0 – 60.0 0.2 0.3
3 -229.89000 4514.184 42.72617 694.2263 -2624.33 42.0 – 57.0 0.0 0.1
6 -1134.18000 13876.920 225.60200 694.2263 -2624.33 42.0 – 55.0 0.0 0.4 L4
7 -1116.07000 13878.850 220.74040 694.2263 -2624.33 42.0 – 55.0 0.0 0.6
Tables 4.27 and 4.28 show that AAD% ≤ 0.2%; therefore, our
proposed two and multi-constant formulas are more suitable to describe the
temperature dependence of dynamic viscosity of olive oil samples.
Fig. 4.5 a and b and 4.6 a and b show our experimental data and our
fitting curves using our proposed three and multi-constant formulas of
dynamic viscosity of olive oil samples from two different locations (L3 and
L4) of different storage ages as a function of temperature.
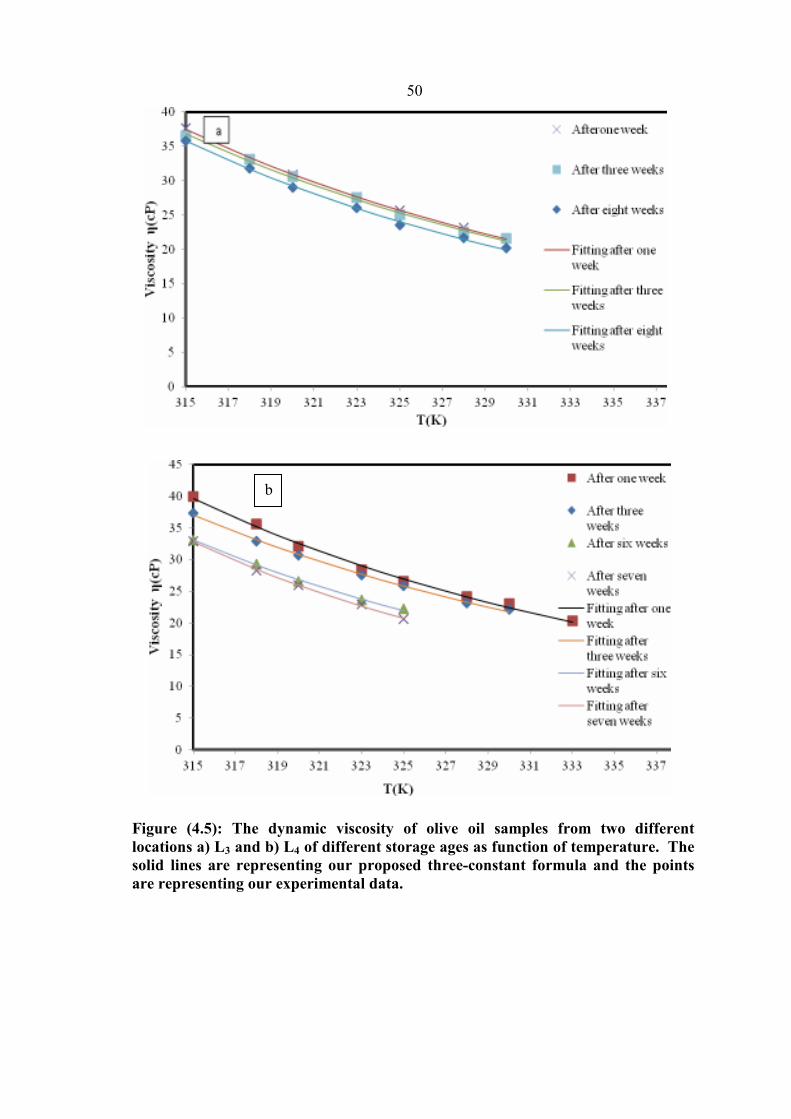
50
Figure (4.5): The dynamic viscosity of olive oil samples from two different locations a) L3 and b) L4 of different storage ages as function of temperature. The solid lines are representing our proposed three-constant formula and the points are representing our experimental data.
b
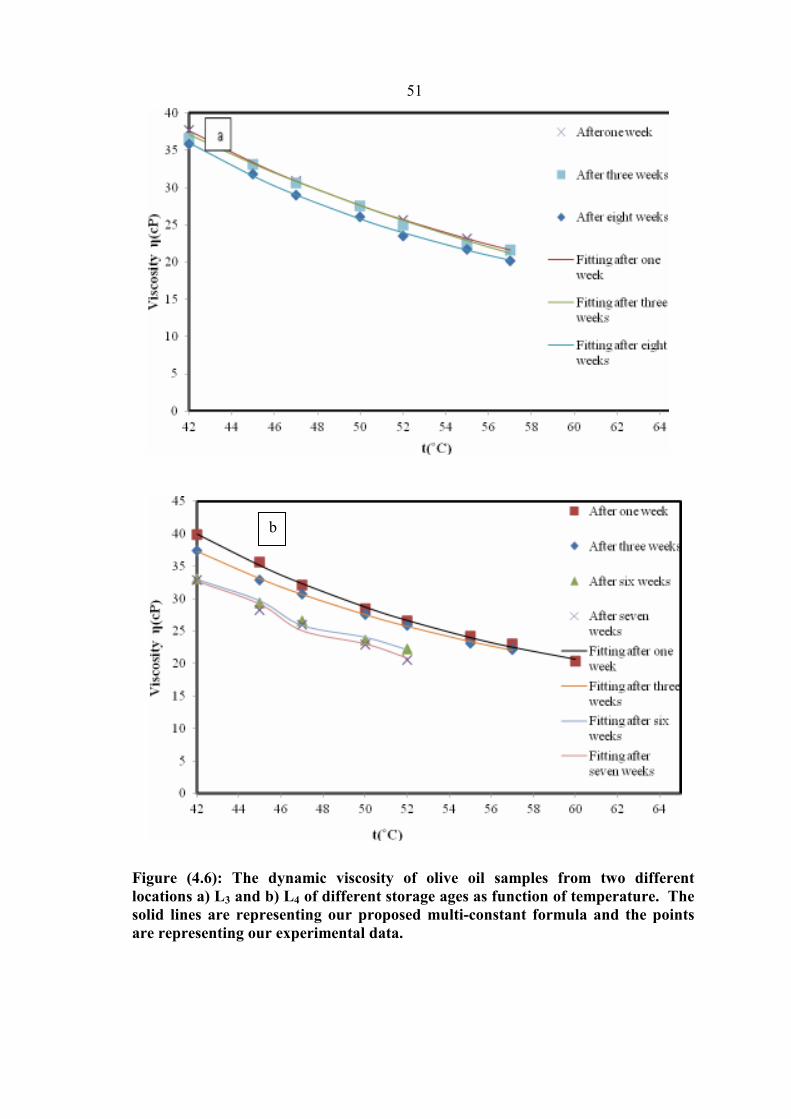
51
Figure (4.6): The dynamic viscosity of olive oil samples from two different locations a) L3 and b) L4 of different storage ages as function of temperature. The solid lines are representing our proposed multi-constant formula and the points are representing our experimental data.
b
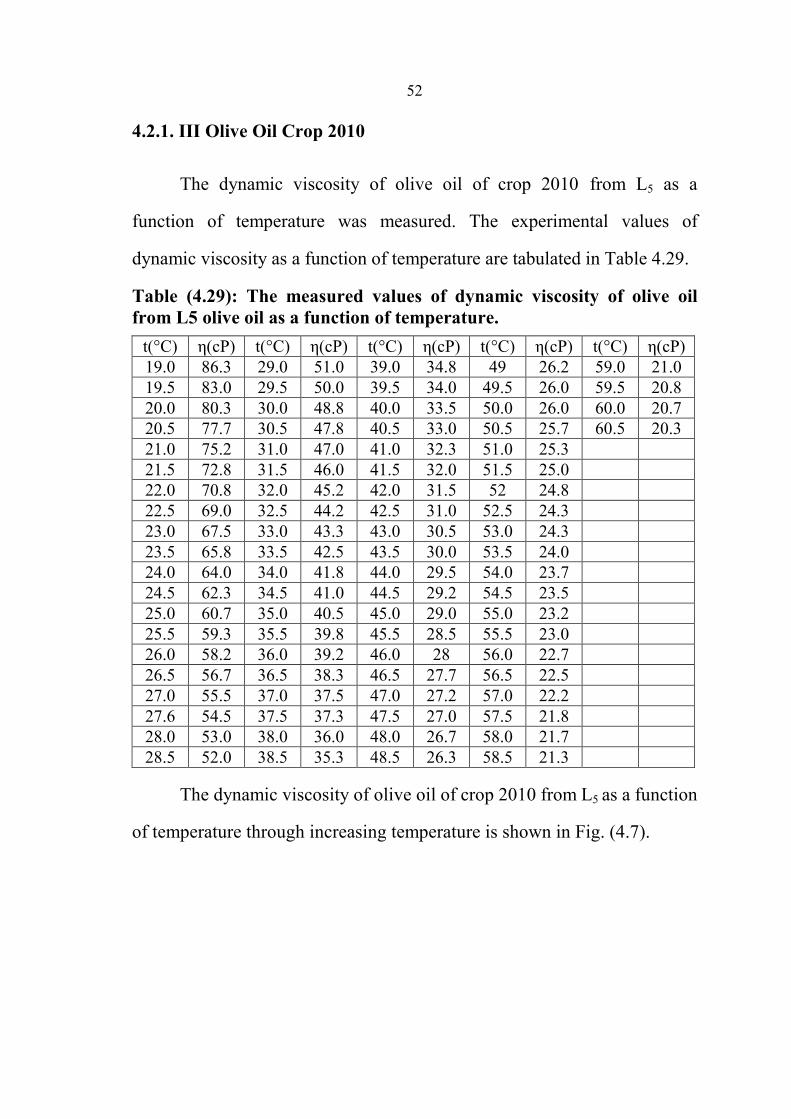
52
4.2.1. III Olive Oil Crop 2010
The dynamic viscosity of olive oil of crop 2010 from L5 as a
function of temperature was measured. The experimental values of
dynamic viscosity as a function of temperature are tabulated in Table 4.29.
Table (4.29): The measured values of dynamic viscosity of olive oil from L5 olive oil as a function of temperature.
t(°C) η(cP) t(°C) η(cP) t(°C) η(cP) t(°C) η(cP) t(°C) η(cP)
19.0 86.3 29.0 51.0 39.0 34.8 49 26.2 59.0 21.0
19.5 83.0 29.5 50.0 39.5 34.0 49.5 26.0 59.5 20.8
20.0 80.3 30.0 48.8 40.0 33.5 50.0 26.0 60.0 20.7
20.5 77.7 30.5 47.8 40.5 33.0 50.5 25.7 60.5 20.3
21.0 75.2 31.0 47.0 41.0 32.3 51.0 25.3
21.5 72.8 31.5 46.0 41.5 32.0 51.5 25.0
22.0 70.8 32.0 45.2 42.0 31.5 52 24.8
22.5 69.0 32.5 44.2 42.5 31.0 52.5 24.3
23.0 67.5 33.0 43.3 43.0 30.5 53.0 24.3
23.5 65.8 33.5 42.5 43.5 30.0 53.5 24.0
24.0 64.0 34.0 41.8 44.0 29.5 54.0 23.7
24.5 62.3 34.5 41.0 44.5 29.2 54.5 23.5
25.0 60.7 35.0 40.5 45.0 29.0 55.0 23.2
25.5 59.3 35.5 39.8 45.5 28.5 55.5 23.0
26.0 58.2 36.0 39.2 46.0 28 56.0 22.7
26.5 56.7 36.5 38.3 46.5 27.7 56.5 22.5
27.0 55.5 37.0 37.5 47.0 27.2 57.0 22.2
27.6 54.5 37.5 37.3 47.5 27.0 57.5 21.8
28.0 53.0 38.0 36.0 48.0 26.7 58.0 21.7
28.5 52.0 38.5 35.3 48.5 26.3 58.5 21.3
The dynamic viscosity of olive oil of crop 2010 from L5 as a function
of temperature through increasing temperature is shown in Fig. (4.7).
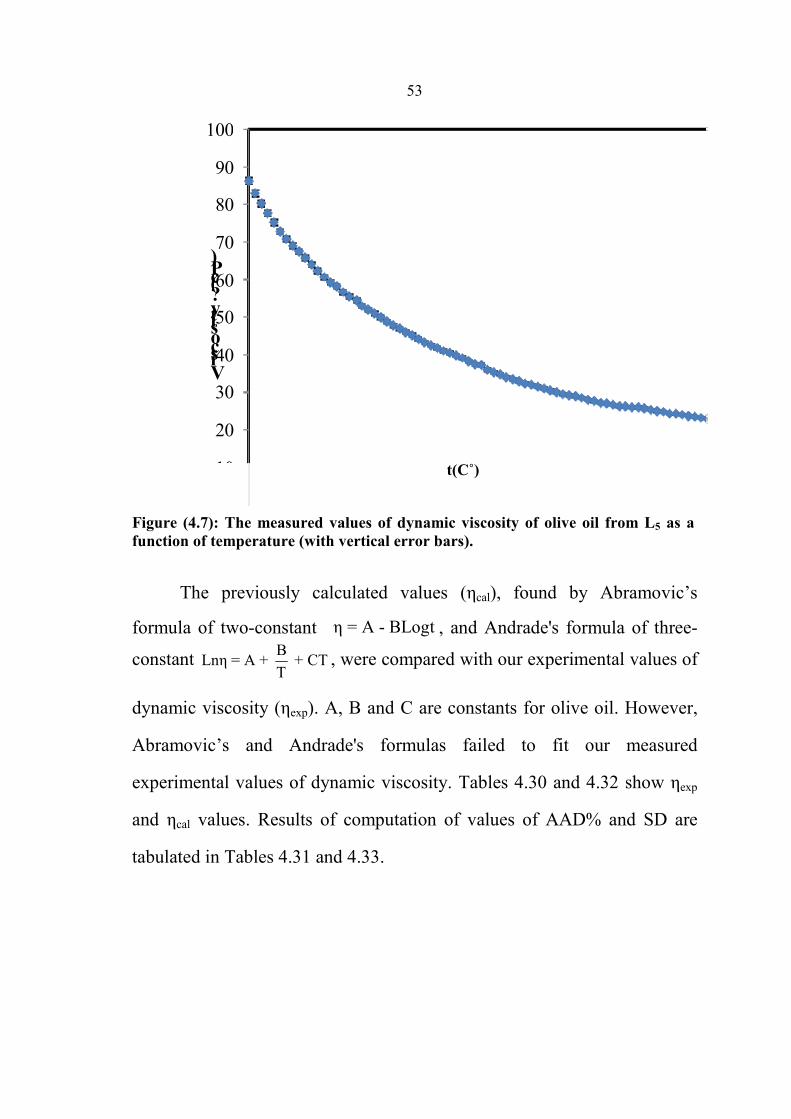
53
t(C˚)
Figure (4.7): The measured values of dynamic viscosity of olive oil from L5 as a function of temperature (with vertical error bars).
The previously calculated values (ηcal), found by Abramovic’s
formula of two-constant η = A - BLogt , and Andrade's formula of three-
constant B
Lnη = A + + CTT
, were compared with our experimental values of
dynamic viscosity (ηexp). A, B and C are constants for olive oil. However,
Abramovic’s and Andrade's formulas failed to fit our measured
experimental values of dynamic viscosity. Tables 4.30 and 4.32 show ηexp
and ηcal values. Results of computation of values of AAD% and SD are
tabulated in Tables 4.31 and 4.33.
10
20
30
40
50
60
70
80
90
100
Viscosity ?(cP)
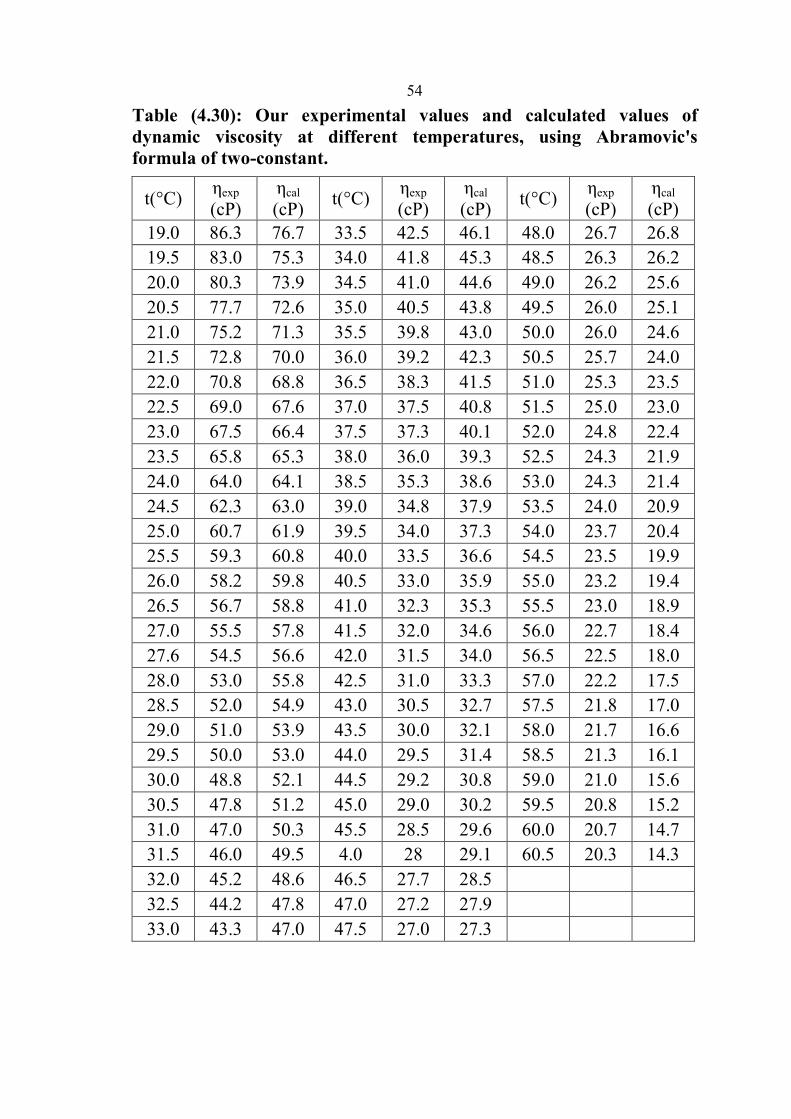
54
Table (4.30): Our experimental values and calculated values of dynamic viscosity at different temperatures, using Abramovic's formula of two-constant.
ηcal
(cP)
ηexp
(cP) t(°C)
ηcal
(cP)
ηexp
(cP) t(°C)
ηcal
(cP)
ηexp
(cP) t(°C)
26.8 26.7 48.0 46.1 42.5 33.5 76.7 86.3 19.0
26.2 26.3 48.5 45.3 41.8 34.0 75.3 83.0 19.5
25.6 26.2 49.0 44.6 41.0 34.5 73.9 80.3 20.0
25.1 26.0 49.5 43.8 40.5 35.0 72.6 77.7 20.5
24.6 26.0 50.0 43.0 39.8 35.5 71.3 75.2 21.0
24.0 25.7 50.5 42.3 39.2 36.0 70.0 72.8 21.5
23.5 25.3 51.0 41.5 38.3 36.5 68.8 70.8 22.0
23.0 25.0 51.5 40.8 37.5 37.0 67.6 69.0 22.5
22.4 24.8 52.0 40.1 37.3 37.5 66.4 67.5 23.0
21.9 24.3 52.5 39.3 36.0 38.0 65.3 65.8 23.5
21.4 24.3 53.0 38.6 35.3 38.5 64.1 64.0 24.0
20.9 24.0 53.5 37.9 34.8 39.0 63.0 62.3 24.5
20.4 23.7 54.0 37.3 34.0 39.5 61.9 60.7 25.0
19.9 23.5 54.5 36.6 33.5 40.0 60.8 59.3 25.5
19.4 23.2 55.0 35.9 33.0 40.5 59.8 58.2 26.0
18.9 23.0 55.5 35.3 32.3 41.0 58.8 56.7 26.5
18.4 22.7 56.0 34.6 32.0 41.5 57.8 55.5 27.0
18.0 22.5 56.5 34.0 31.5 42.0 56.6 54.5 27.6
17.5 22.2 57.0 33.3 31.0 42.5 55.8 53.0 28.0
17.0 21.8 57.5 32.7 30.5 43.0 54.9 52.0 28.5
16.6 21.7 58.0 32.1 30.0 43.5 53.9 51.0 29.0
16.1 21.3 58.5 31.4 29.5 44.0 53.0 50.0 29.5
15.6 21.0 59.0 30.8 29.2 44.5 52.1 48.8 30.0
15.2 20.8 59.5 30.2 29.0 45.0 51.2 47.8 30.5
14.7 20.7 60.0 29.6 28.5 45.5 50.3 47.0 31.0
14.3 20.3 60.5 29.1 28 4.0 49.5 46.0 31.5
28.5 27.7 46.5 48.6 45.2 32.0
27.9 27.2 47.0 47.8 44.2 32.5
27.3 27.0 47.5 47.0 43.3 33.0

55
Table (4.31): AAD% and SD of the data using Abramovic's formulas of two-constant.
AAD% SD (cP) Temperature range (°C ) 0.6 3.4 19.0 – 60.5
Table (4.32): Our experimental values and calculated values of dynamic viscosity at different temperatures, using Andrade's formula of three-constant.
ηcal (cP) ηexp (cP) T(K) ηcal (cP) ηexp (cP) T(K) ηcal (cP) ηexp (cP) T(K)
29.0 26.7 321.0 48.8 42.5 306.5 91.4 86.3 292.0
28.5 26.3 321.5 47.8 41.8 307.0 89.3 83.0 292.5
28.1 26.2 322.0 46.9 41.0 307.5 87.2 80.3 293.0
27.6 26.0 322.5 46.0 40.5 308.0 85.2 77.7 293.5
27.2 26.0 323.0 45.1 39.8 308.5 83.3 75.2 294.0
26.8 25.7 323.5 44.2 39.2 309.0 81.4 72.8 294.5
26.4 25.3 324.0 43.4 38.3 309.5 79.5 70.8 295.0
26.0 25.0 324.5 42.6 37.5 310.0 77.7 69.0 295.5
25.6 24.8 325.0 41.8 37.3 310.5 76.0 67.5 296.0
25.2 24.3 325.5 41.0 36.0 311.0 74.3 65.8 296.5
24.8 24.3 326.0 40.3 35.3 311.5 72.6 64.0 297.0
24.4 24.0 326.5 39.5 34.8 312.0 71.0 62.3 297.5
24.1 23.7 327.0 38.8 34.0 312.5 69.5 60.7 298.0
23.7 23.5 327.5 38.1 33.5 313.0 68.0 59.3 298.5
23.4 23.2 328.0 37.5 33.0 313.5 66.5 58.2 299.0
23.0 23.0 328.5 36.8 32.3 314 65.1 56.7 299.5
22.7 22.7 329.0 36.1 32.0 314.5 63.7 55.5 300.0
22.4 22.5 329.5 35.5 31.5 315.0 62.1 54.5 300.6
22.0 22.2 330.0 34.9 31.0 315.5 61.0 53.0 301.0
21.7 21.8 330.5 34.3 30.5 316.0 59.8 52.0 301.5
21.4 21.7 331.0 33.7 30.0 316.5 58.5 51.0 302.0
21.1 21.3 331.5 33.1 29.5 317.0 57.3 50.0 302.5
20.8 21.0 332.0 32.6 29.2 317.5 56.1 48.8 303.0
20.6 20.8 332.5 32.0 29.0 318.0 55.0 47.8 303.5
20.3 20.7 333.0 31.5 28.5 318.5 53.9 47.0 304.0
20.0 20.3 333.5 31.0 28 319.0 52.8 46.0 304.5
30.5 27.7 319.5 51.8 45.2 305.0
30.0 27.2 320.0 50.7 44.2 305.5
29.5 27.0 320.5 49.7 43.3 306.0

56
Table (4.33): AAD% and SD of the data using Andrade's formula of three-constant.
AAD% SD (cP) Temperature range (K)
9.5 5.2 292.0 – 333.5
Abramovic's and Andrade's formulas were not the best fit for our
experimental data of dynamic viscosity of olive oil sample because the
AAD% values found to be 0.6% and 9.5%, respectively (Tables 4.31 and
4.33).
Abramovic's and Andrade's formulas failed to fit our experimental
data. This work, therefore, introduced a modification to Abramovic's and
Andrade's formulas in order to obtain a suitable description of our
experimental data of dynamic viscosity. This modification, by using
Abramovic’s and Andrade's formulas, determined the constants of
Abramovic's and Andrade's formulas. Tables 4.34 and 4.36 show our
experimental values (ηexp) and calculated values (ηcal) using the modified
form of Abramovic’s and Andrade's formula of dynamic viscosity at
different temperatures. Tables 4.35 and 4.37 tabulate AAD% and SD
values.

57
Table (4.34): Our experimental values and calculated values of dynamic viscosity at different temperatures, using the modified Abramovic’s formula of two-constant.
ηcal (cP) ηexp (cP) t(°C) ηcal (cP) ηexp (cP) t(°C) ηcal (cP) ηexp (cP) t(°C)
27.3 26.7 48.0 46.0 42.5 33.5 75.4 86.3 19.0
26.8 26.3 48.5 45.2 41.8 34.0 74.0 83.0 19.5
26.3 26.2 49.0 44.4 41.0 34.5 72.7 80.3 20.0
25.7 26.0 49.5 43.7 40.5 35.0 71.4 77.7 20.5
25.2 26.0 50.0 43.0 39.8 35.5 70.2 75.2 21.0
24.7 25.7 50.5 42.2 39.2 36.0 69.0 72.8 21.5
24.2 25.3 51.0 41.5 38.3 36.5 67.8 70.8 22.0
23.7 25.0 51.5 40.8 37.5 37.0 66.6 69.0 22.5
23.2 24.8 52.0 40.1 37.3 37.5 65.5 67.5 23.0
22.7 24.3 52.5 39.4 36.0 38.0 64.4 65.8 23.5
22.2 24.3 53.0 38.8 35.3 38.5 63.3 64.0 24.0
21.7 24.0 53.5 38.1 34.8 39.0 62.2 62.3 24.5
21.2 23.7 54.0 37.4 34.0 39.5 61.1 60.7 25.0
20.7 23.5 54.5 36.8 33.5 40.0 60.1 59.3 25.5
20.3 23.2 55.0 36.1 33.0 40.5 59.1 58.2 26.0
19.8 23.0 55.5 35.5 32.3 41.0 58.1 56.7 26.5
19.3 22.7 56.0 34.9 32.0 41.5 57.2 55.5 27.0
18.9 22.5 56.5 34.2 31.5 42.0 56.0 54.5 27.6
18.4 22.2 57.0 33.6 31.0 42.5 55.3 53.0 28.0
18.0 21.8 57.5 33.0 30.5 43.0 54.4 52.0 28.5
17.5 21.7 58.0 32.4 30.0 43.5 53.5 51.0 29.0
17.1 21.3 58.5 31.8 29.5 44.0 52.6 50.0 29.5
16.6 21.0 59.0 31.3 29.2 44.5 51.7 48.8 30.0
16.2 20.8 59.5 30.7 29.0 45.0 50.8 47.8 30.5
15.8 20.7 60.0 30.1 28.5 45.5 50.0 47.0 31.0
15.3 20.3 60.5 29.5 28 4.0 49.2 46.0 31.5
29.0 27.7 46.5 48.3 45.2 32.0
28.4 27.2 47.0 47.5 44.2 32.5
27.9 27.0 47.5 46.8 43.3 33.0
Table (4.35): Our values of A, B, AAD% and SD using the modefied Abramovic’s formula of two-constant.
A(cP) B (cP) Temp Range (°C ) AAD% SD (cP) 228.0487 119.3898 19.0 – 60.5 0.4 3.3
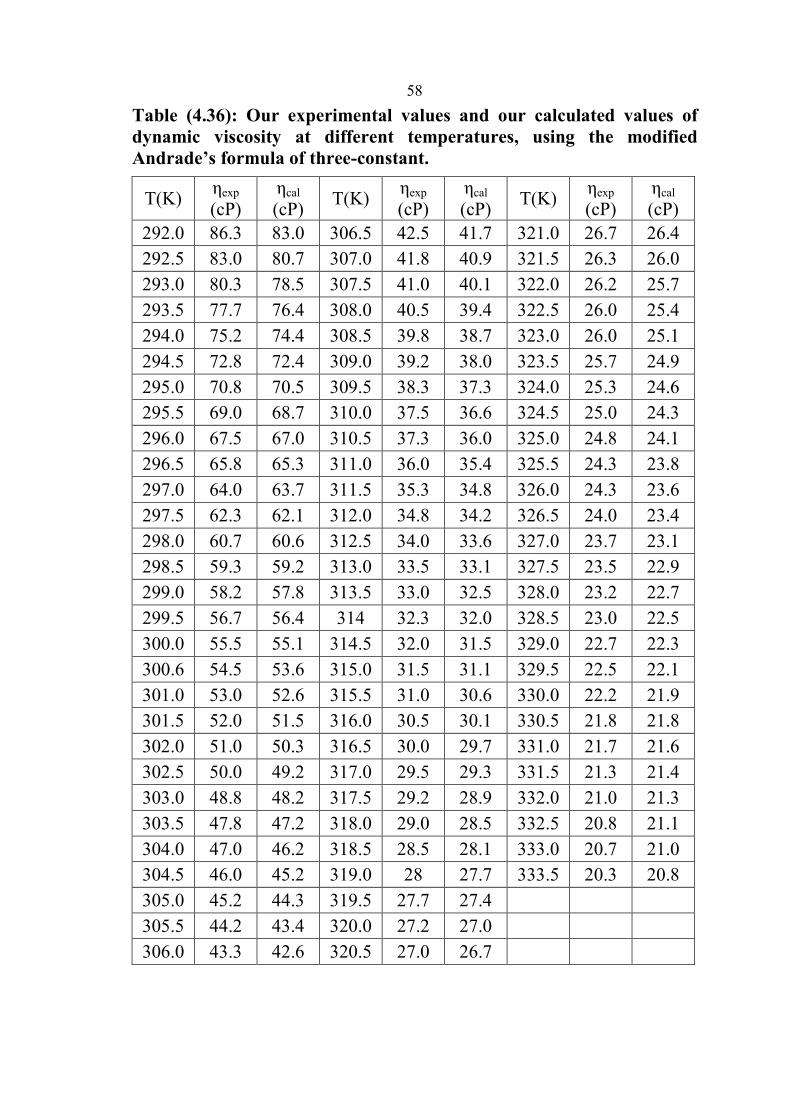
58
Table (4.36): Our experimental values and our calculated values of dynamic viscosity at different temperatures, using the modified Andrade’s formula of three-constant.
ηcal
(cP)
ηexp
(cP) T(K)
ηcal
(cP)
ηexp
(cP) T(K)
ηcal
(cP)
ηexp
(cP) T(K)
26.4 26.7 321.0 41.7 42.5 306.5 83.0 86.3 292.0
26.0 26.3 321.5 40.9 41.8 307.0 80.7 83.0 292.5
25.7 26.2 322.0 40.1 41.0 307.5 78.5 80.3 293.0
25.4 26.0 322.5 39.4 40.5 308.0 76.4 77.7 293.5
25.1 26.0 323.0 38.7 39.8 308.5 74.4 75.2 294.0
24.9 25.7 323.5 38.0 39.2 309.0 72.4 72.8 294.5
24.6 25.3 324.0 37.3 38.3 309.5 70.5 70.8 295.0
24.3 25.0 324.5 36.6 37.5 310.0 68.7 69.0 295.5
24.1 24.8 325.0 36.0 37.3 310.5 67.0 67.5 296.0
23.8 24.3 325.5 35.4 36.0 311.0 65.3 65.8 296.5
23.6 24.3 326.0 34.8 35.3 311.5 63.7 64.0 297.0
23.4 24.0 326.5 34.2 34.8 312.0 62.1 62.3 297.5
23.1 23.7 327.0 33.6 34.0 312.5 60.6 60.7 298.0
22.9 23.5 327.5 33.1 33.5 313.0 59.2 59.3 298.5
22.7 23.2 328.0 32.5 33.0 313.5 57.8 58.2 299.0
22.5 23.0 328.5 32.0 32.3 314 56.4 56.7 299.5
22.3 22.7 329.0 31.5 32.0 314.5 55.1 55.5 300.0
22.1 22.5 329.5 31.1 31.5 315.0 53.6 54.5 300.6
21.9 22.2 330.0 30.6 31.0 315.5 52.6 53.0 301.0
21.8 21.8 330.5 30.1 30.5 316.0 51.5 52.0 301.5
21.6 21.7 331.0 29.7 30.0 316.5 50.3 51.0 302.0
21.4 21.3 331.5 29.3 29.5 317.0 49.2 50.0 302.5
21.3 21.0 332.0 28.9 29.2 317.5 48.2 48.8 303.0
21.1 20.8 332.5 28.5 29.0 318.0 47.2 47.8 303.5
21.0 20.7 333.0 28.1 28.5 318.5 46.2 47.0 304.0
20.8 20.3 333.5 27.7 28 319.0 45.2 46.0 304.5
27.4 27.7 319.5 44.3 45.2 305.0
27.0 27.2 320.0 43.4 44.2 305.5
26.7 27.0 320.5 42.6 43.3 306.0
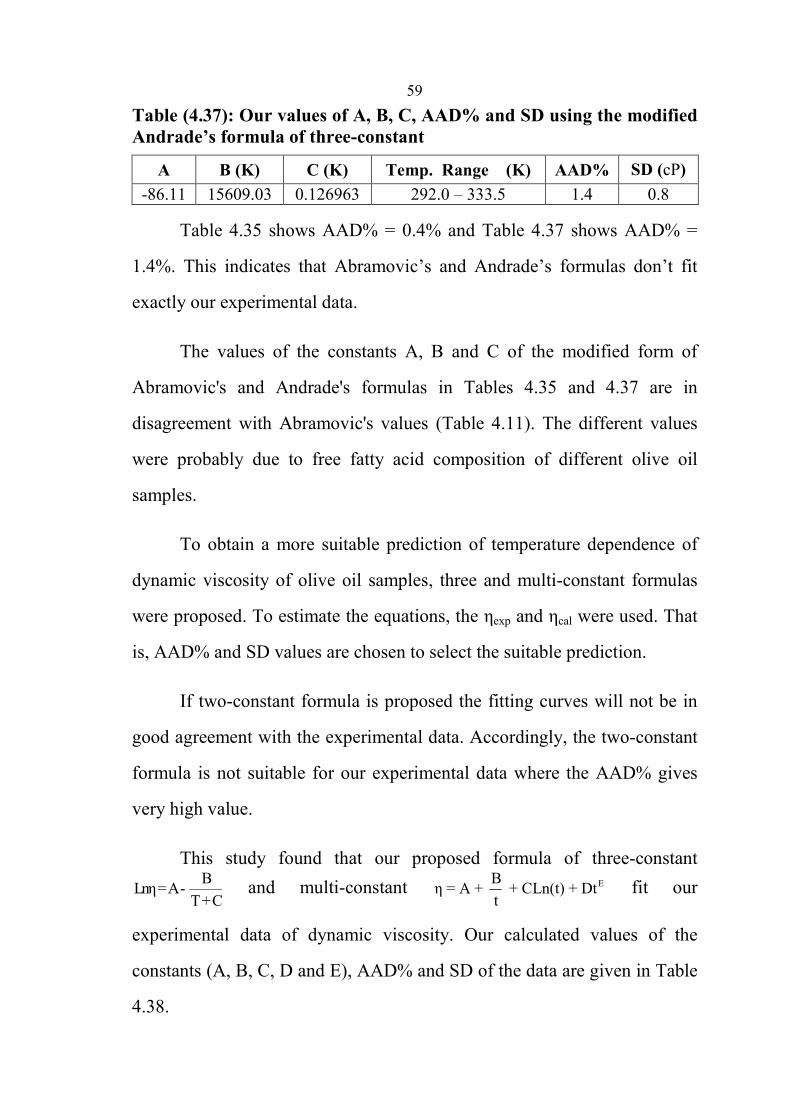
59
Table (4.37): Our values of A, B, C, AAD% and SD using the modified Andrade’s formula of three-constant
A B (K) C (K) Temp. Range (K) AAD% SD (cP)
-86.11 15609.03 0.126963 292.0 – 333.5 1.4 0.8
Table 4.35 shows AAD% = 0.4% and Table 4.37 shows AAD% =
1.4%. This indicates that Abramovic’s and Andrade’s formulas don’t fit
exactly our experimental data.
The values of the constants A, B and C of the modified form of
Abramovic's and Andrade's formulas in Tables 4.35 and 4.37 are in
disagreement with Abramovic's values (Table 4.11). The different values
were probably due to free fatty acid composition of different olive oil
samples.
To obtain a more suitable prediction of temperature dependence of
dynamic viscosity of olive oil samples, three and multi-constant formulas
were proposed. To estimate the equations, the ηexp and ηcal were used. That
is, AAD% and SD values are chosen to select the suitable prediction.
If two-constant formula is proposed the fitting curves will not be in
good agreement with the experimental data. Accordingly, the two-constant
formula is not suitable for our experimental data where the AAD% gives
very high value.
This study found that our proposed formula of three-constant B
Lnη = A - T + C
and multi-constant EBη = A + + CLn(t) + Dt
t fit our
experimental data of dynamic viscosity. Our calculated values of the
constants (A, B, C, D and E), AAD% and SD of the data are given in Table
4.38.

60
Table (4.38): Our values of A, B, C, D and E, AAD% and SD using our proposed formula.
our proposed formula
A B C D E Temp. Range
AAD%
SD (cP)
three-
constant 1.261552 -163.511 K -240.637 K - - 292.0 – 333.5 K 0 0.3
multi-
constant -70.4707
cP
2222.396
cP.°C
694.2263
cP
-2624.33
cP/°CE 13.22235 19.0 – 60.5 °C 0 0.3
Table 4.38 shows that AAD% = 0%; therefore, our proposed two and
multi-constant formulas are more suitable to describe the temperature
dependence of dynamic viscosity of olive oil sample.
Fig. 4.8 and 4.9 show our experimental data and our fitting curves
using our proposed three and multi-constant formulas of dynamic viscosity
of olive oil sample from L5 as a function of temperature.
Figure (4.8): The dynamic viscosity of olive oil from L5 as a function of temperature. The solid line is representing our proposed three-constant formula and the points are representing our experimental data.

61
Figure (4.9): The dynamic viscosity of olive oil from L5 as a function of temperature. The solid line is representing our proposed multi-constant formula and the points are representing our experimental data.
4.2.2 Storage Age-Dependence of Dynamic Viscosity
4.2.2 I Yearly Basis
The dynamic viscosity of olive oil samples from two locations (L1
and L2) was measured as a function of storage age in years at 45 ºC as given
in Table 4.39.
Table (4.39): The measured values of dynamic viscosity of olive oil samples from L1 and L2 as a function storage age.
L1 L2
Storage age (year) η (cP) Storage age (year) η (cP)
0 36.6 2 38.5
5 35.7 9 32.2
13 32.0 12 21.5

62
The experimental values of dynamic viscosity of olive oil samples
from L1 and L2 as a function of storage age at 45ºC are shown in Fig. (4.10).
Figure (4.10): The measured values of dynamic viscosity of olive oil samples from L1 and L2 as function of storage age.
Multi-constant formula is proposed by this work to obtain more
suitable prediction of storage age dependence of dynamic viscosity of olive
oil samples. The ηexp and ηcal were used to propose the formula that fits our
experimental data. That is, AAD% and SD values are chosen to select the
suitable prediction.
The experimental values of the dynamic viscosity of olive oil
samples from L1 and L2 of different storage ages were fitted by using our
multi-constant formula. Our multi-constant formula is proposed to be:
2 EtAt Bt C Deη = + + + (4.1)

63
Where η is the dynamic viscosity in cP, t is the storage age in years,
A, B, C, D and E are constants. Our calculated values of A, B, C, D, E,
AAD% and SD of the data, are given in Table 4.40.
Table (4.40): Our values of A, B, C, D and E, AAD% and SD using our proposed formula.
The
location
A
(cP/years2)
B
(cP/year) C (cP) D (cP) E AAD% SD
L1 -0.149 2.252 27.918 8.682 -0.709 0.0 0.0
L2 -0.311 3.199 27.039 9.396 -0.199 0.0 0.0
Table 4.40 shows that AAD% = 0%. Accordingly, our proposed
multi-constant formula is suitable to describe the storage age dependence
of dynamic viscisity of olive oil sample.
Fig. 4.11 shows our experimental data and our fitting curves using
equation 4.1 of dynamic viscosity of olive oil samples from L1 and L2 as a
function of storage age in years.
Figure (4.11): The dynamic viscosity of olive oil samples from L1 and L2 as a function of storage age in years. The solid lines are representing equation 4.1 and the points are representing our experimental data.
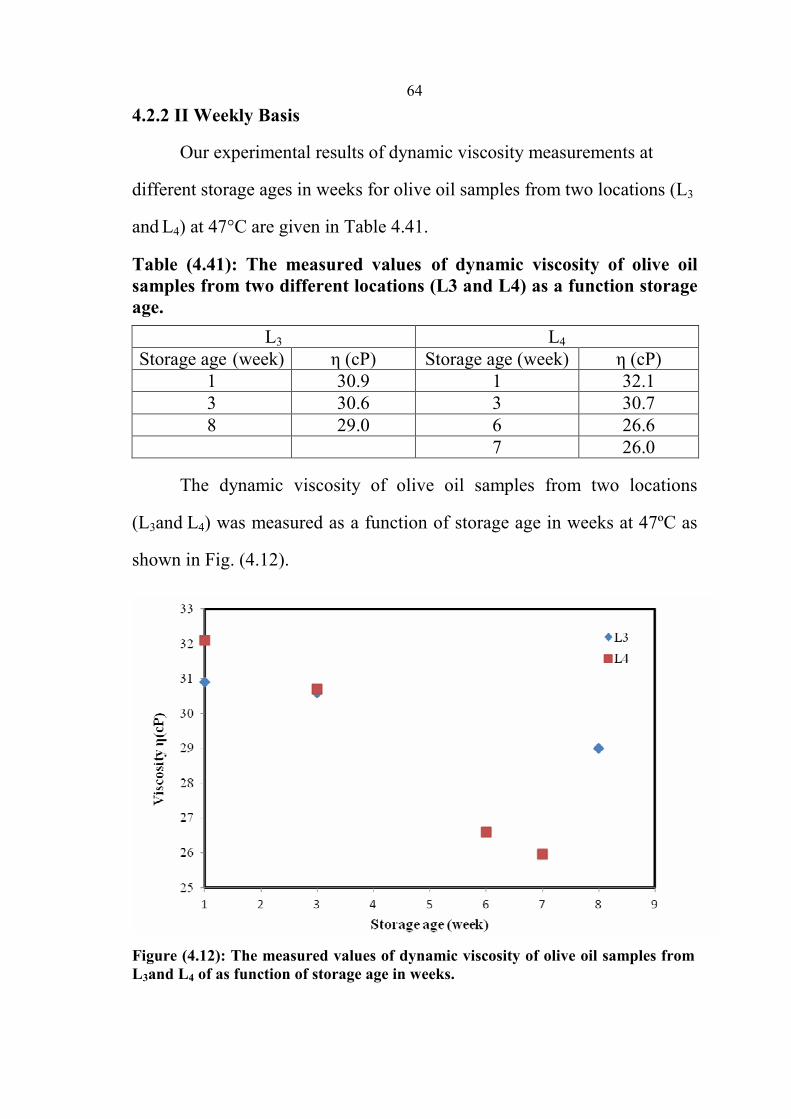
64
4.2.2 II Weekly Basis
Our experimental results of dynamic viscosity measurements at
different storage ages in weeks for olive oil samples from two locations (L3
and L4) at 47°C are given in Table 4.41.
Table (4.41): The measured values of dynamic viscosity of olive oil samples from two different locations (L3 and L4) as a function storage age.
L3 L4
Storage age (week) η (cP) Storage age (week) η (cP)
1 30.9 1 32.1
3 30.6 3 30.7
8 29.0 6 26.6
7 26.0
The dynamic viscosity of olive oil samples from two locations
(L3and L4) was measured as a function of storage age in weeks at 47ºC as
shown in Fig. (4.12).
Figure (4.12): The measured values of dynamic viscosity of olive oil samples from L3and L4 of as function of storage age in weeks.

65
The experimental values of the dynamic viscosity of olive oil
samples from L3 and L4 of different storage ages were fitted by using our
multi-constant formula. Our multi-constant formula is proposed to be:
2 EtAt Bt C Deη = + + + (4.2)
Where η is the dynamic viscosity in cP, t is the storage age in weeks,
A, B, C, D and E are constants. Our calculated values of A, B, C, D, E,
AAD% and SD of the data, are given in Table 4. 42.
Table (4.42): Our values of A, B, C, D and E, AAD% and SD using our proposed formula.
The
location
A
(cP/week2)
B
(cP/week) C (cP) D (cP) E AAD% SD
L3 -0.118 1.469 23.846 7.378 -0.257 0.0 0.0
L4 0.207 -3.300 38.930 -16.197 -1.466 0.0 0.0
Table 4.42 shows that AAD% = 0%; therefore, our proposed multi-
constant formula are suitable to describe the storage age dependence of
dynamic viscosity of olive oil sample.
Fig. 4.13 shows our experimental data and our fitting curves using
equation 4.2 of dynamic viscosity of olive oil samples from L3 and L4 as a
function of storage age in weeks.
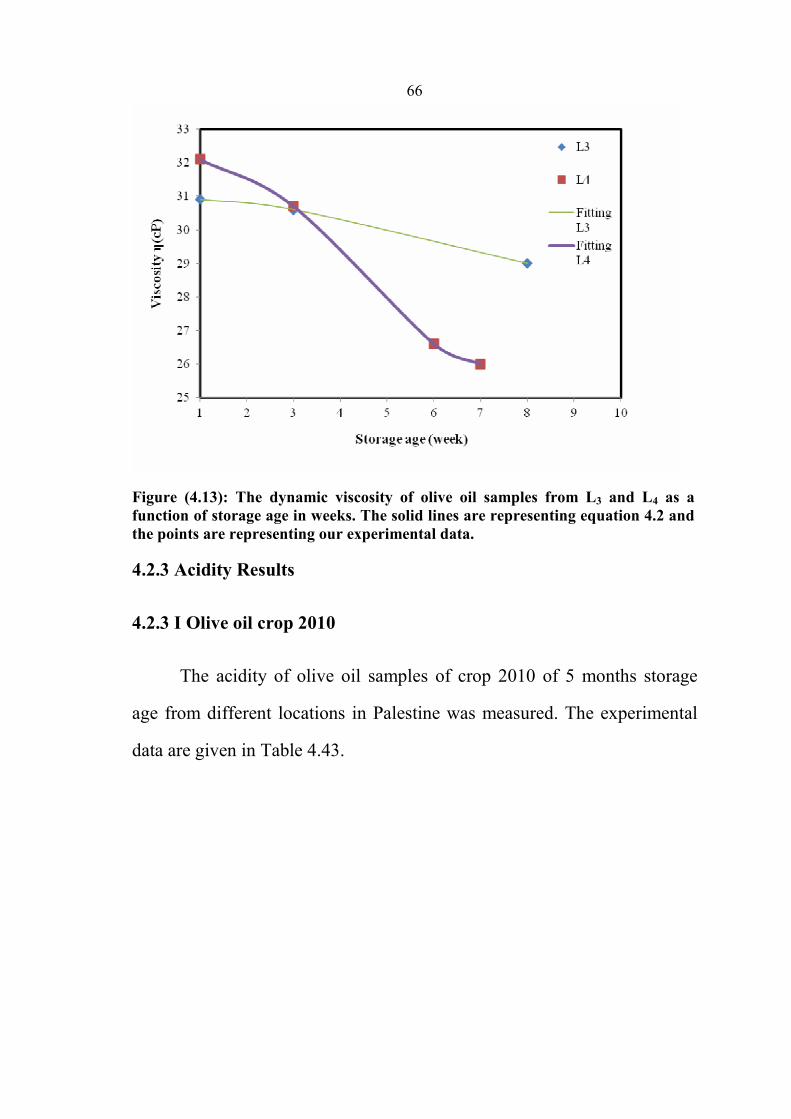
66
Figure (4.13): The dynamic viscosity of olive oil samples from L3 and L4 as a function of storage age in weeks. The solid lines are representing equation 4.2 and the points are representing our experimental data.
4.2.3 Acidity Results
4.2.3 I Olive oil crop 2010
The acidity of olive oil samples of crop 2010 of 5 months storage
age from different locations in Palestine was measured. The experimental
data are given in Table 4.43.

67
Table (4.43): The measured values of acidity of olive oil samples of crop 2010 from different locations.
Acidity (FFA %) Location Code 0.64 A'nin R1
0.53 Zbuba R2
0.50 Ti'innik R3
0.30 Silat al harithiya R4
0.95 Rummana R5
0.51 Arafa R6
0.54 Kafr dan R7
0.61 AL Tayba R8
1.55 Aqraba R9
1.34 burqa R10
0.65 Tubas R11
1.23 Marda R12
0.87 Kofor Tholoth R13
0.51 Jaba' R14
0.96 Barta'a R15
1.59 Yasid R16
0.90 AL-Jadida R17
Table 4.43 shows most of olive oil samples of crop 2010 from
different locations have FFA% ≤ 0.65% which indicates that most of olive
oil samples of crop 2010 from different locations are extra virgin olive oil
(<0.8%). On the other hand, the olive oil samples which have FFA%
between 0.8% and 2% are considered to be virgin olive oil. The acidity of
olive oil influenced by different parameters such as degree of ripeness,
industrial processes employed for oil extraction, the cultivator, altitude, and
climate and several other factors.
The measured values of acidity of olive oil samples of crop 2010
from different locations are shown in Fig. (4.14).

68
Figure (4.14): The measured values of acidity of olive oil samples from different location of crop 2010.
4.2.3 II Storage Age Dependence of Olive Oil Acidity
4.2.3 II.I Yearly Basis
The acidity of olive oil samples from four different locations (L1, L2,
L6 and L7) of different storage ages was measured. The experimental data
are given in Table 4.44.
Table (4.44): The measured acidity values of olive oil samples from L1, L2, L6 and L7 of different storage ages.
L1 L2 L6 L7 Storage
age
(years)
Acidity
(FFA %)
Storage
age
(years)
Acidity
(FFA %)
Storage
age
(years)
Acidity
(FFA %)
Storage
age
(years)
Acidity
(FFA %)
0 0.97 1 1.70 0 0.30 0 0.90
1 1.69 9 7.15 6 2.40 1 1.55
10 2.19 10 8.79 11 3.73 2 1.90
11 3.69 12 12.50 12 5.22 3 2.15
13 5.51 13 19.94 13 9.89 5 2.34
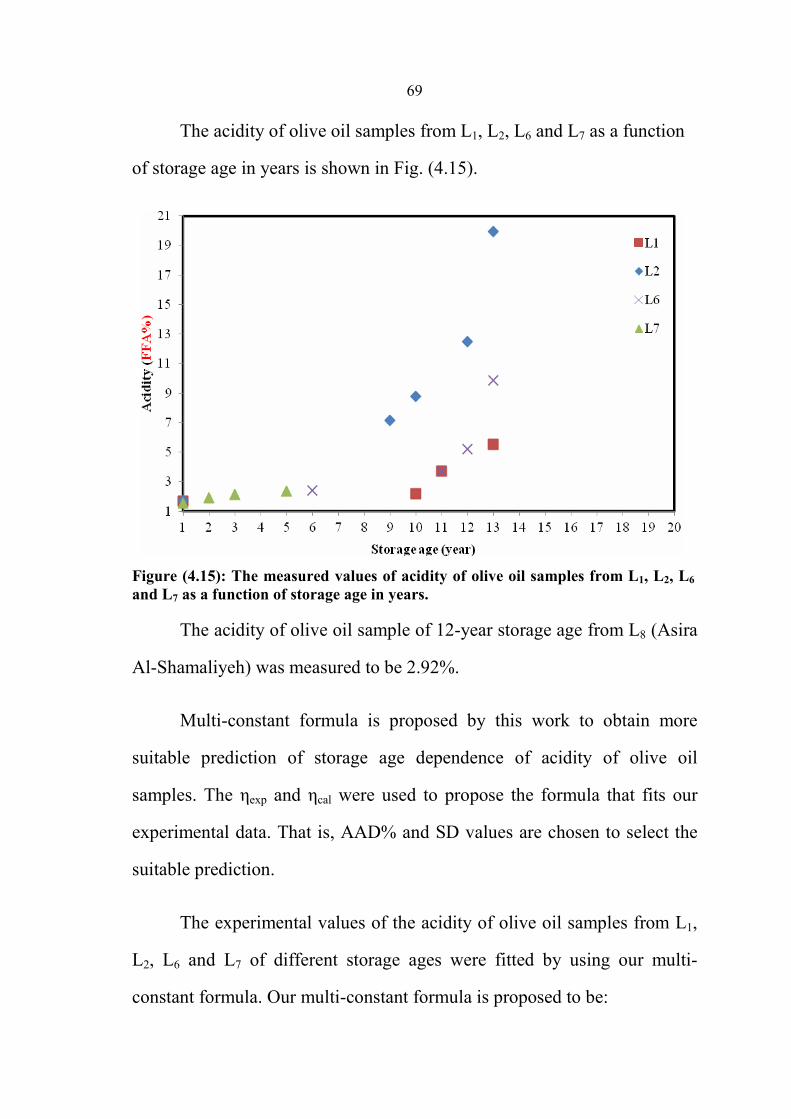
69
The acidity of olive oil samples from L1, L2, L6 and L7 as a function
of storage age in years is shown in Fig. (4.15).
Figure (4.15): The measured values of acidity of olive oil samples from L1, L2, L6 and L7 as a function of storage age in years.
The acidity of olive oil sample of 12-year storage age from L8 (Asira
Al-Shamaliyeh) was measured to be 2.92%.
Multi-constant formula is proposed by this work to obtain more
suitable prediction of storage age dependence of acidity of olive oil
samples. The ηexp and ηcal were used to propose the formula that fits our
experimental data. That is, AAD% and SD values are chosen to select the
suitable prediction.
The experimental values of the acidity of olive oil samples from L1,
L2, L6 and L7 of different storage ages were fitted by using our multi-
constant formula. Our multi-constant formula is proposed to be:
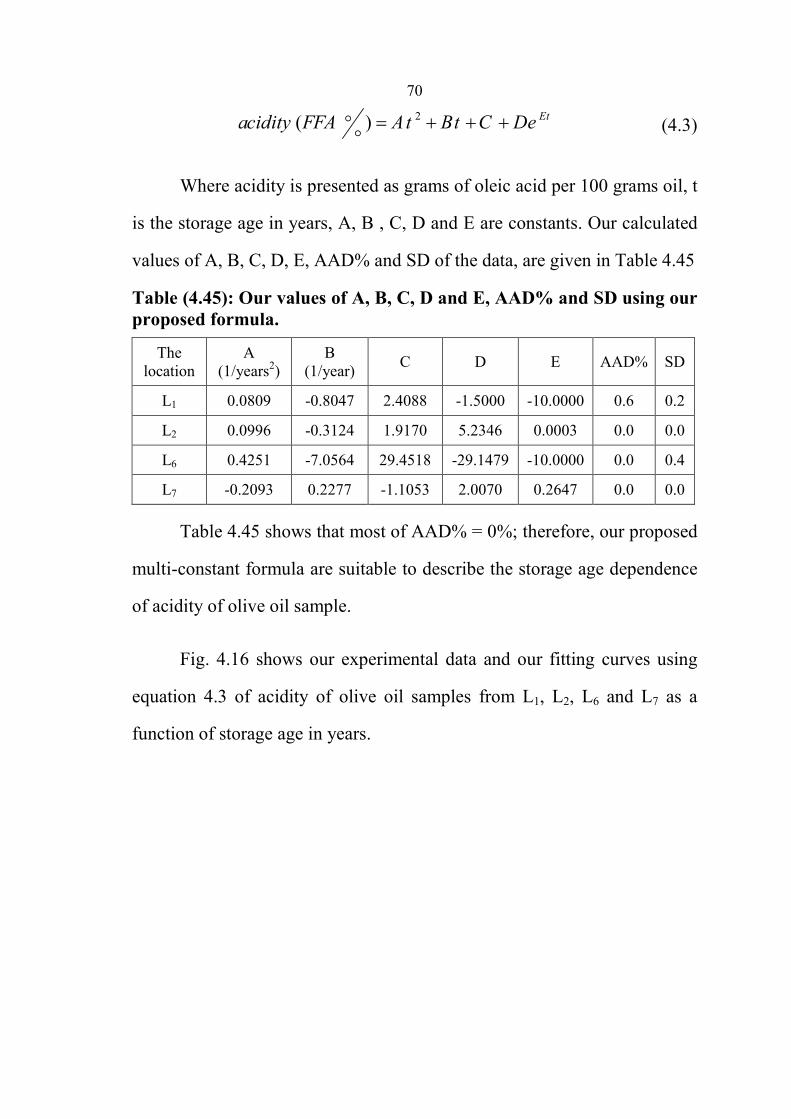
70
2( ) Etacidity FFA At Bt C De= + + +oo
(4.3)
Where acidity is presented as grams of oleic acid per 100 grams oil, t
is the storage age in years, A, B , C, D and E are constants. Our calculated
values of A, B, C, D, E, AAD% and SD of the data, are given in Table 4.45
Table (4.45): Our values of A, B, C, D and E, AAD% and SD using our proposed formula.
The
location
A
(1/years2)
B
(1/year) C D E AAD% SD
L1 0.0809 -0.8047 2.4088 -1.5000 -10.0000 0.6 0.2
L2 0.0996 -0.3124 1.9170 5.2346 0.0003 0.0 0.0
L6 0.4251 -7.0564 29.4518 -29.1479 -10.0000 0.0 0.4
L7 -0.2093 0.2277 -1.1053 2.0070 0.2647 0.0 0.0
Table 4.45 shows that most of AAD% = 0%; therefore, our proposed
multi-constant formula are suitable to describe the storage age dependence
of acidity of olive oil sample.
Fig. 4.16 shows our experimental data and our fitting curves using
equation 4.3 of acidity of olive oil samples from L1, L2, L6 and L7 as a
function of storage age in years.

71
Figure (4.16): The acidity of olive oil samples from L1, L2, L6 and L7 as a function of storage age in years. The solid lines are representing equation 4.3 and the points are representing our experimental data.
4.2.3 II Weekly Basis
The acidity of olive oil samples from three different locations (L3, L4
and L7) was measured at different storage ages in weekly basis. The values
are given in Table 4.46.
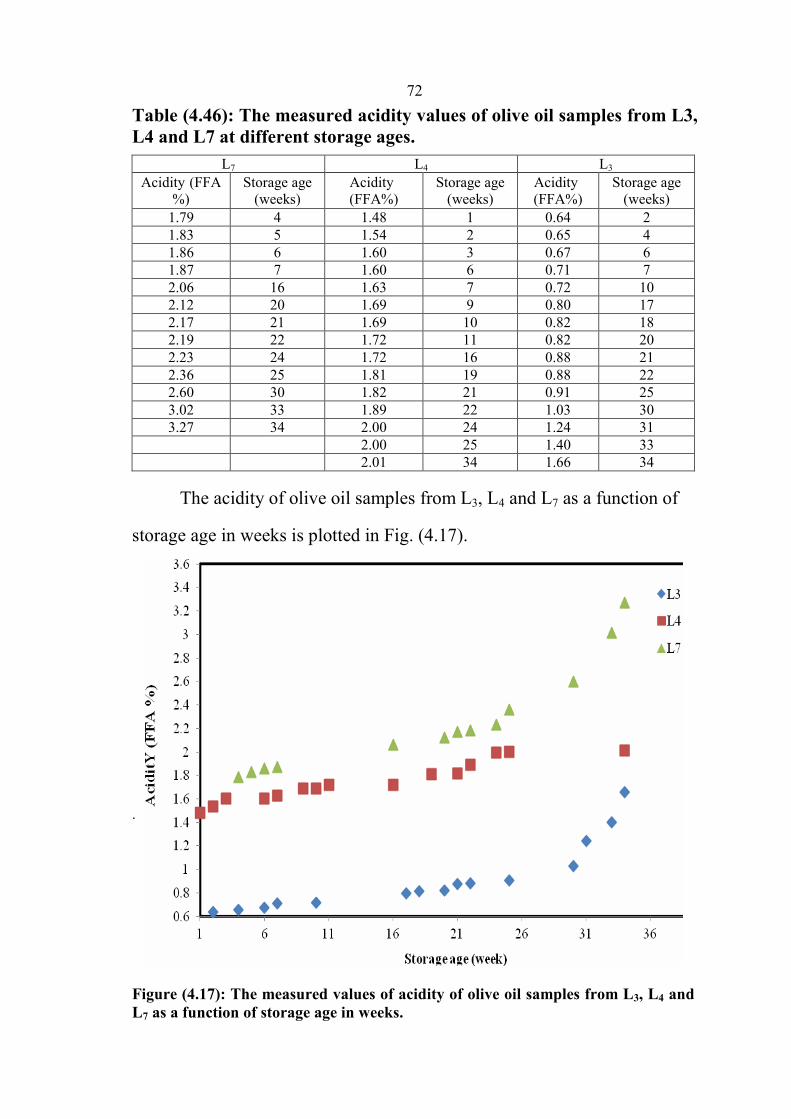
72
Table (4.46): The measured acidity values of olive oil samples from L3, L4 and L7 at different storage ages.
L7 L4 L3
Acidity (FFA
%)
Storage age
(weeks)
Acidity (FFA%)
Storage age
(weeks)
Acidity (FFA%)
Storage age
(weeks)
1.79 4 1.48 1 0.64 2
1.83 5 1.54 2 0.65 4
1.86 6 1.60 3 0.67 6
1.87 7 1.60 6 0.71 7
2.06 16 1.63 7 0.72 10
2.12 20 1.69 9 0.80 17
2.17 21 1.69 10 0.82 18
2.19 22 1.72 11 0.82 20
2.23 24 1.72 16 0.88 21
2.36 25 1.81 19 0.88 22
2.60 30 1.82 21 0.91 25
3.02 33 1.89 22 1.03 30
3.27 34 2.00 24 1.24 31
2.00 25 1.40 33
2.01 34 1.66 34
The acidity of olive oil samples from L3, L4 and L7 as a function of
storage age in weeks is plotted in Fig. (4.17).
.
Figure (4.17): The measured values of acidity of olive oil samples from L3, L4 and L7 as a function of storage age in weeks.
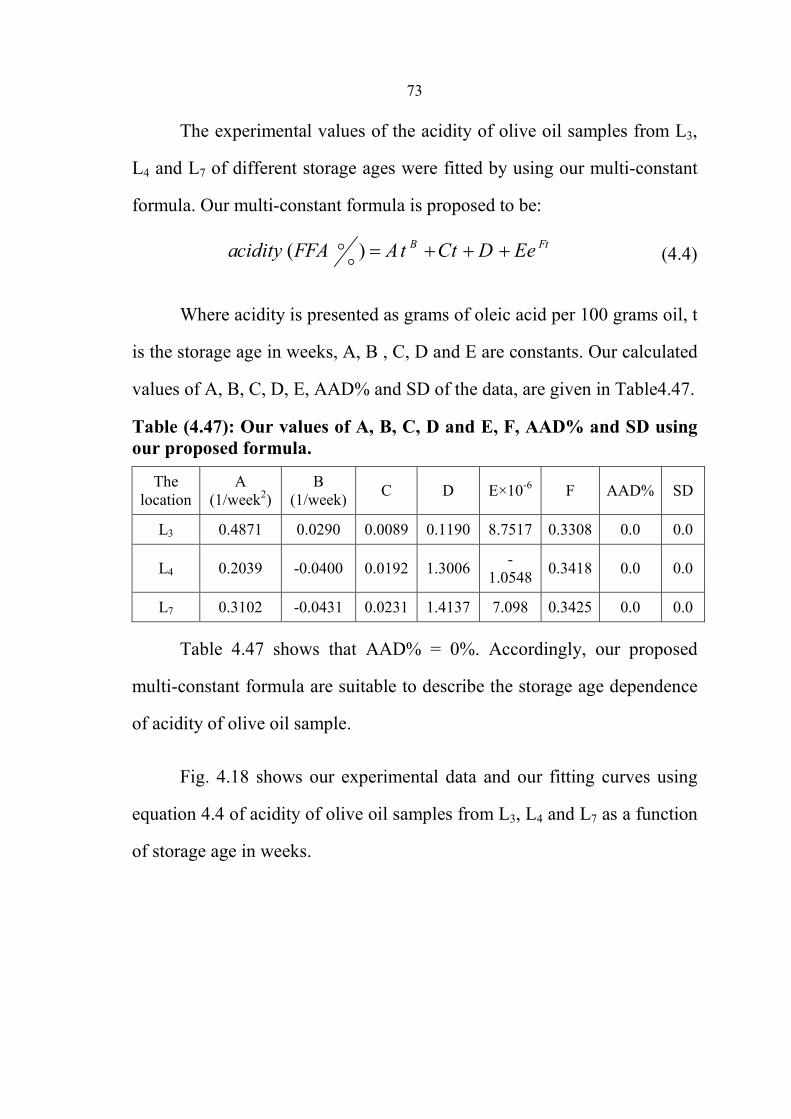
73
The experimental values of the acidity of olive oil samples from L3,
L4 and L7 of different storage ages were fitted by using our multi-constant
formula. Our multi-constant formula is proposed to be:
( ) B Ftacidity FFA At Ct D Ee= + + +oo
(4.4)
Where acidity is presented as grams of oleic acid per 100 grams oil, t
is the storage age in weeks, A, B , C, D and E are constants. Our calculated
values of A, B, C, D, E, AAD% and SD of the data, are given in Table4.47.
Table (4.47): Our values of A, B, C, D and E, F, AAD% and SD using our proposed formula.
The
location
A
(1/week2)
B
(1/week) C D E×10
-6 F AAD% SD
L3 0.4871 0.0290 0.0089 0.1190 8.7517 0.3308 0.0 0.0
L4 0.2039 -0.0400 0.0192 1.3006 -
1.0548 0.3418 0.0 0.0
L7 0.3102 -0.0431 0.0231 1.4137 7.098 0.3425 0.0 0.0
Table 4.47 shows that AAD% = 0%. Accordingly, our proposed
multi-constant formula are suitable to describe the storage age dependence
of acidity of olive oil sample.
Fig. 4.18 shows our experimental data and our fitting curves using
equation 4.4 of acidity of olive oil samples from L3, L4 and L7 as a function
of storage age in weeks.

74
Figure (4.18): The acidity of olive oil samples from L3, L4 and L7 as a function of storage age in weeks. The solid lines are representing equation 4.4 and the points are representing our experimental data.
75
Chapter Five
Discussion
The average of experimental results of density measurements for
olive oil samples of crop 2010 at 15°C was found to be 0.91229 g/cm3.
Robert obtained the density of olive oil to be 0.918 g/cm3
at 15°C (Robert
C. et al, 1980). Our value is in good agreement with Robert's value. The
slight difference in values is probably due to the influences of some
structural characteristics on viscosity (the fatty acid composition of olive
oil).
Our dynamic viscosity of olive oil sample was measured to be 80.5
cP at 20°C, 60.7 cP at 25°C, and 33.5 cP at 40°C. Adnan and Robert
obtained the dynamic viscosity of olive oil to be 84 cP at 20°C, 63.61 cP at
25°C, 36.3 cP at 40°C (Adnan Q. et al; 2009, Robert C. et al; 1980). Our
value of dynamic viscosity of olive oil at different temperatures is not in
good agreement with Adnan's and Robert's values. The small discrepancy
in values might be due to the influences of the fatty acid composition of
olive oil. The machinery groups also effect on the viscosity of olive oil.
The viscosity is influences by the wax content and composition which is
affected by cultivar, crop year, and processing (Boskou D., 2006).
The experimental measurements of dynamic viscosity of olive oil
samples of different storage ages in years from two different locations (L1
and L2) at 42°C showed that for location L1 η = 41.3 cP (0-year storage age)
and 36.6 cP (13-year storage age). For location L2 η = 59.0 cP (2-year
storage age) and η = 25 cP (12-year storage age). The overall results in this

76
study of the effect of dynamic viscosity as a function of storage age in
years indicate a decrease of dynamic viscosity as olive oil is stored. The
decrease of dynamic viscosity of olive oil as a function of storage age in
years occurred more rapidly in samples from L2 than that in those of L1.
The effect of dynamic viscosity as a function of storage age in weeks at
42°C showed that for location L3 η = 37.7 cP (1-week storage age) and
η=35.85 cP (8-week storage age) and for location L4 η = 39.9 cP (1-week
storage age) and 32.9 cP (7-week storage age). The dynamic viscosity
results of weekly basis in this study indicate that the dynamic viscosity of
olive oil samples decreases as a function of storage age in weeks. The
dynamic viscosity of olive oil decreased as a function of storage age at a
greater rate in samples from L4 than in those of L3.
All experimental measurements of dynamic viscosity of olive oil
samples of different locations in Palestine give values which slightly differ
from one location to another. For instance, the dynamic viscosity of olive
oil samples of crop 2010 from two different locations L1 and L5 at 42°C
were obtained to be 41.3 cP and 31.5 cP, respectively. The difference might
be due to different parameters that influence on the fatty acid composition
of olive oil. The fatty acid composition of olive oil varies widely depending
on the cultivator, maturity of the fruit, altitude and climate. Hot climate
affects the fatty acid composition of olive oils. The cooler regions will
yield oil with higher oleic acid than warmer climates; therefore, a cool
region olive oil may be more monounsaturated in content than warm region
oil. The altitude of location L1 is ranges between 440 to 510 m and the

77
amount of rain of crop season 2010 was 580.8 mm (cool region) while the
altitude of L5 is between 100 to 270 m and the amount of rain of crop
season 2010 was 513.5 mm (hot climate). Appendix B shows the altitude of
some locations in Palestine. The amount of rain for the different locations
and different crop seasons in Palestine is given in Appendix C. One can
observe that the results of the dynamic viscosity values of olive oil of crop
2010 from location L1 (cool region): η = 41.3 cP are greater than the values
of olive oil from location L5 (hot climate): η = 31.5 cP. The dynamic
viscosity values of olive oil from L1: η = 36.6 cP (13-year storage age) are
also greater than the values of olive oil samples from L2: η = 25 cP (12-
year storage age). The altitude of location L2 is 350 m. The dynamic
viscosity values of some olive oil samples from location L1 show values
less than the sample from location L2 of 2-year storage age: η = 43.9 cP.
The highest values for viscosity were found in the case of olive oil from
location L2 of 2 years storage age which indicates that there are other
factors that affect the viscosity of olive oil. This sample may be exposed to
factors that increase its dynamic viscosity. For instance, olive oil quality
and behavior can be influenced by the industrial processes employed for oil
extraction (Amirante et al, 2002). The degree of ripeness is also an
important quality factor. Appendix A shows the characteristic of the olive
oil during olive ripening.
The dynamic viscosity values of olive oil sample of crop 2010 from
L4: η = 39.9 cP (1 week storage age) are greater than the values from L3:
η=37.7 cP (1week storage age). The altitude of location L3 is 140 – 230 m

78
while the amount of rain was 514 mm. The altitude of location L4 is 520 –
600 m and the amount of rain of location was 333.2 mm. which gives a
reasonable cause that justifies the slight difference in dynamic viscosity
values of olive oil from L3 and L4.
The measured experimental results of dynamic viscosity of olive oil
samples are compared against the previously calculated values found by
Abramovic’s formula of two-constant η = A - BLogt and Andrade's
formula of three-constant B
Lnη = A + + CTT
for olive oil. For instance, the
calculated values of dynamic viscosity at 45°C were found to be 30.2 cP
and 32.0 cP, respectively. Our measured experimental value at 45°C
(36.6cP) shows significant difference between our result and the literature
value. This indicates that Abramovic’s and Andrade's formulas are not the
best fit to be used for our experimental data of dynamic viscosity of olive
oil samples. Abramovic’s and Andrade's formulas were modified to fit our
experimental values. As a result of this modification, the constants A, B
and C were determined using Abramovic’s and Andrade's formulas. The
calculated dynamic viscosity using the modified form of Abramovic’s and
Andrade's formulas at 45°C were found to be 38.5 cP and 37.6 cP,
respectively, which indicate that Abramovic's and Andrade's modified
formulas don not fit exactly our experimental data. Two ( Logη = AT + B ) ,
three B( Lnη = A - )
T + C and multi EB
( η = A + + CLn(t) + Dt )t
-constant
formulas are proposed to obtain more suitable prediction of temperature
dependence of dynamic viscosity of olive oil samples in our regions. The
constants of our proposed formulas were estimated to give the best fit.
79
The effect of acidity as a function of storage age in yearly basis
shows that: for location L1 from 0.97% (0-year storage age) to 5.51% (13-
year storage age). Location L2 is from 1.70% (1-year storage age) to19.94%
(13-year storage age), for location L6 from 0.305% (0-year storage age) to
9.89% (13-year storage age). Location L7 is from 0.90% (0-year storage
age) to 2.34% (5-year storage age).
The overall results in this study of the effect of acidity as a function
of storage age in yearly basis were over the limits established by IOOC
(≥3.3%). This indicates a deterioration of oil quality as olive oil is stored.
The values of the acidity of some olive oil samples (from L7) are below the
maximum levels (≤ 3.3%) established by IOOC which suggest that the oil
can be stored for a long period (> 12 years) without deterioration.
Our acidity results of the olive oils of weekly basis show an increase
as a function of storage age in weeks. The values of acidity increases as
follows: For location L3 from 0.64% (2-week storage age) to 1.66% (34-
week storage age). Location L4 is from 1.48% (1-week storage age) to
2.01% (34-week storage age). Location L7 is from 1.79% (4-week storage
age) to 3.27% (34-week storage age).
The overall results of weekly basis in this study indicate that the fatty
acid levels in the analyzed olive oil samples increased incrementally, but
that it was within the limits established by IOOC (≤ 3.3%).
Our acidity value of extra olive oil increased from 0.65% to 0.79%
after 3 months and 1.03% after 6 months. Falque in his study found that the

80
values of the initial acidity of the extra-virgin olive oils for glass bottle is
0.39%, and the values of acidity after 3 and 6 months are 0.42% and
0.45%, respectively (Falque E. et al; 2007). Our results are in quit good
agreement with those of Falque. The slightly different values from one
location to another are probably due to different parameters that influence
the acidity of oil. The degree of ripeness is an important quality factor
(Appendix A). Olive oil quality and properties can be influenced by the
industrial processes employed for oil extraction. The acidity increasis if the
olive fruits are damaged. The main olive pests/diseases in Palestine which
damage the fruits are the olive fly and the peacock eye spot. Fruits are
damaged also if olives are picked by sticks from the trees. Acidity in
previous studies (Bechir B. et al; 2012, Bento A. et al; 2002) indicates a
progressive deterioration of oil quality as the fruit is stored.
Some empirical relations that describe the dependence of dynamic
viscosity and acidity of olive oil on storage age were fitted to the
experimental data. The constants for the best fit are calculated.

81
Chapter Six
Conclusion and Future Works
The values of the acidity of some olive oil samples (from L1) suggest
that the oil can be stored for a period not more than 12 years without
deterioration. A lot of study is needed to study the influence of storage age
in other quality factors such as peroxide index, impurity content (%),
phenols content, iodine index, saponification index, fatty acid content and
absorption coefficients K270 and K232. The absorption coefficients K270
and K232 are used as quality factor because the absorbency at 232nm is
caused by hydroperoxides (primary stage of oxidation) and conjugated
dienes (intermediate stage of oxidation). The absorbency at 270nm is
caused by carbonylic compounds (secondary stage of oxidation) and
conjugated trienes (technological treatments). The degree of oxidation of
olive oil is reflected by its specific extinction at 232 nm and 270 nm.
These studies will determine the storage age of olive oil without
deterioration. In addition, future studies are needed to study the quality
parameters as a function of storage age in ideal storage conditions. The
ideal storage conditions when each bottle flushes with nitrogen after filling
in order to remove oxygen and olive oil must be stoned storage in
temperature range 16 – 18˚C in dark.
One of the most interesting topics left for future study is the behavior
of viscosity of olive oil from different location in Palestine as a function of
shear rate (Newtonian or non Newtonian behavior).
82
This work studies the dynamic viscosity of olive oil samples from
different locations in Palestine as a function of temperature. The acidity
and the viscosity as a function of storage age for these samples were also
studied. Another works is needed to study a lot of olive oil samples from
other locations in Palestine than the location which we did our study on
them.
83
References
Abed M. et al, "Characterization of the main Palestinian olive cultivars
and olive oil1 ,״st Ed., (2010).
Abramovic H., klofutar G., ״The temperature dependence of dynamic
viscosity for some vegetables oils״, Acta Chim. Slov. 45(1), 69-77
(1998).
Adnan Q., Ahmad M., Akhtar N., Farzana K. and Mehmood A.,
.J ,״Rheological studies and characterization of different oils״
Chem. Soc. Pak., 31(2), 201 - 206 (2009).
Ahmad M., Amran A.,Giap S. G. E. and Nik W. M. N. W., ״The
assessment of rheological model reliability in lubricating behavior of
vegetable oils״, Engineering e-Transaction, 4(2), 81-89 (2009).
Amirante P., Dugo G. and Gomes T., ״Influence of technological
innovation in improving the quality of extra virgin olive oil״, Olivae,
93, 34-42, (2002).
Andrade E. N. C., Nature, 125, 309-318(1930).
AOAC., official methods of analysis, 17th
Ed., 969.17(1997).
Ayadi M., Bouaziz M., Ines F., Jemai H. and Sayadi S., ״Effect of storage
on refined and husk olive oils composition: stabilization by addition
of natural antioxidants from Chemlali olive leaves״, Food
Chemistry, 108, 253–262 (2008).
84
Bakshi N.N. and Parthasarathy S., ״Relation between velocity of sound
and viscosity in liquids״, Proc. Phys. Soc. 66B:368–370 (1953).
Barnett R. E., Rodger J. W. and Thorpe T. E., ״On the relations between
the viscosity (internal friction) of liquids and their chemical nature״,
Part II, Phil. Trans. 189, 71-107(1897).
Bayrak Y., Iscan M., Topallar H., ״Kinetics of autoxidative polymerization
of sun flower seed oil״, Tr. J. of chemistry, 21, 118-125 (1997).
Bechir B., Chedly A., Mokhtar Z., Nabil B., Nizar D. and Youssef O.,
Effect of olive storage period at two different temperatures on oil״
quality of two tunisian cultivars of Olea europea Chemlali and
Chetoui״, African Journal of Biotechnology, 11(4), 888 – 895
(2012).
Bell J. D., Cannon M. R., Manning R. E., ״Viscosity measurement״, Anal.
Chem., 32, 355-358 (1960).
Bento A., Casal S., Oliveira M. and Pereira J., ״Influence of olive storage
period on oil quality of three portuguese cultivars of olea europea,
cobrancüosa, madural, and verdeal transmontana״, J. Agric. Food
Chem., 50, 6335 – 6340 (2002).
Bu L., Lin X. and Yaws C.L., ״Calculate viscosities for 355 liquids״,
Chem.Eng. 101(4) 119-20, 122, 124, 126, 128, (1994).
Boskou D., ״Olive oil chemistry and technology2 ,״nd
Ed. (2006).

85
Buszewski B and Ligor M., ״The comparison of solid phase
microextraction-GC and static headspace-GC for determination of
solvent residues in vegetable oils״, J. Sep. Sci. 31: 364-371(2008).
Brahmi F., Dabbou S., Gharbi I., Hammami M. and Nakbi A., ״Impact of
packaging material and storage time on olive oil quality״, African
Journal of Biotechnology, 10(74), 16937-16947, (2011).
Brian S. and Landau S., ״A hand book of statistical analyses using
SPSS(2004) ,״.
Bridgman P. W., ״Viscosity of liquids under pressure״, Physics, 11, 603-
606 (1925).
Brookfield Engineering Laboratories, Inc., Middlebore, USA, manual no.
M/92-021-K1098, pp. 34 (1999).
Calligaris S., Manzocco L., Nicoli M. C., Sovrano S., ״Influence of
crystallization on the oxidative stability of extra virgin olive oil״, J.
Agric. Food Chem., 54 (2), 529–535 (2005).
Clements C., Craig-Schmidt M., Fasina O. O. and Hallman H., ״Predicting
temperature-dependence viscosity of vegetable oils from fatty acid
composition״, Journal of the American Oil Chemists' Society,
83(10), 899-903 (2006).
Clements L. D., Noureddini H. and Teoh B. C., ״Viscosity of vegetables
oils and fatty acids״, J. Am. Oil Chem. Soc., 69 (12), 1189-1191
(1992).
86
Danner R. P. and Daubert T. E., ״Physical and thermodynamic
properties of pure chemicals –data compilation design institute for
Physical properties data״, AIChE, Taylor and Francis, Washington
DC (1994).
De Guzman J., ״Relation between fluidity and heat of fusion״, Anales
Soc. Espan. Fis. Y. Quim. 11, 353-362 (1913).
Duhne C. R., ״Viscosity-temperature correlations for liquids״, Chem.
Eng., 86 (15), 83 (1979).
Dumitru A., Geacai S.,Neagu N. A., Sterpu A., ״Study of the behavior of
some vegetable oils during the thermal treatment״, Ovidius
University Annals of Chemistry, 21(1),5-8 (2010).
Dutt N. and Prasad D. H., ״Representation of the temperature
dependence of the viscosity of pure liquids, private
communication״, chemical engineering division, Indian institute of
chemical technology, Hyderabad (2004).
Dutt N., Ghosh T. K., Prasad D. H. L., Rani K. Y. and Viswanath D. S.,
,״Viscosity of Liquids Theory, Estimation, Experiment, and Data״
444-553 (2007).
El-hefian E. A., Jabir O. M., Yahaya A. H., ״Temporal behavior of olive
oil: with and without chitosan12 ,״th
, Asian Chemical Congress
(12ACC), (2007).

87
Falque E. and Mendez A. I., ״Effect of storage time and container type on
the quality of extra-virgin olive oil״, Since Direct Food Control, 18,
521–529, (2007).
Giap S. G. E., ״The hidden property of arrhenius-type relationship:
viscosity as a function of temperature״, Journal of Physical Science,
21(1), 29–39 (2010).
Goletz E., Jr. and Tassios D., ״An Antoine type equation for liquid
viscosity dependency to temperature״, Ind. Eng. Chem. Proc. Des.
Dev., 16(1), 75-79 (1977).
Guushaa A., Hosier L., Swingler S. G. and Vaughan A. S., ״Selection of a
suitable vegetable oil for high voltage insulation applications״, J.
Phys., 183(1), 1-5 (2009).
Haighton J., Van Putte K. and Vermaas L. F., ״Determination of the solid
contents of fats by wide-line nuclear magnetic resonance. Signal of
liquid oils״, J. Am. Oil Chemist's Soc., 49(3), 153-156 (1972).
Hsieh F.H., Rodenbush C.M. and Viswanath D.S., ״Density and Viscosity
of Vegetable Oils״, JAOCS., 76, 1415–1419 (1999).
http//www.olive oil source.com/page/chemical-characteristics.
International Olive oil Council ״Trade standards applying to olive oil
and olive pomace oil״, E. /Conv. /Doc. no.1 /16 November 2000.
International Olive Oil Council, Madrid, Spain.

88
James F., ״Rheological methods in food process engineering2 ,״nd
Ed., 1-
35 (1996).
Kiritsakis A., Papadopoulou P. and Vekiari S. A., ״Effects of processing
methods and commercial storage conditions on the extra virgin olive
oil quality indexes״, Grasas Y Aceites., 58(3), 237-242 (2007).
Natarajan G. and Viswanath D. S., ״Data book on viscosity of liquids״,
Hemisphere, New York (1989).
Palestinian meteorological authority in the ministry of transport
Poling B. E., Prausnitz J. M., and Reid R. C., ״Properties of gases and
liquids״, McGraw-Hill, New York, 4th Ed. (1987).
Qun-Fang L., Rui-Sen L. and Yu-Chun H., ״Correlation of viscosities of
pure liquids in a wide temperature range״, Fl. Ph. Equilib.140(1-2),
221-231 (1997).
Rao, M.A., ״Rheology of fluid and semisolid foods: principles and
applications״, Aspen Publishers, Inc., Gaithersburg, Maryland (1999).
Robert C., ״CRC Handbook of Chemistry and Physics59 ,״th Ed. (1979).
Tan Hsiao Wei, ״Rheology and stability of olive oil cream emulsion
stabilized by sucrose fatty acid esters nonionic surfactants״,
(2009).
Vogel H., ״Das temperaturabhängigkeitsgesetz der viskosität von
flüssigkeiten״, Physics. 22, 645-646 (1921).

89
Appendix
Appendix A
October November Free acidity (%) 0.28 0.32 ± 0.16 Fatty acid composition (%) Palmitic 12.53 15.53 ± 2.19
Palmitoleic 0.59 0.98 ± 0.44 Heptadecanoic 0.25 0.11 ± 0.05 Heptadecenoic 0.25 0.13 ± 0.06 Stearic 4.05 3.48 ± 0.09
Oleic 70.54 64.11 ± 4.88
Linoleic 10.41 14.06 ± 2.30
Linolenic 0.61 0.89 ± 0.11
Eicosanoic 0.41 0.45 ± 0.04
Eicosenoic 0.36 0.24 ± 0.01
The characteristic of the olive oil during olive ripening (Abed et al, 2010).
Appendix B
Code Location Altitude (meter) L1 Jeet 450 - 510
L2 Saida 350
L3 Al-Yamun 140 - 230
L4 Beta 520 - 600
L5 Jenin 100 - 270
L6 Arraba 320
L7 Meithaloon 380 - 410
L8 Asira Al-Shamaliyeh 648
The altitude of some locations in Palestine (Palestinian meteorological authority
in the ministry of transport).
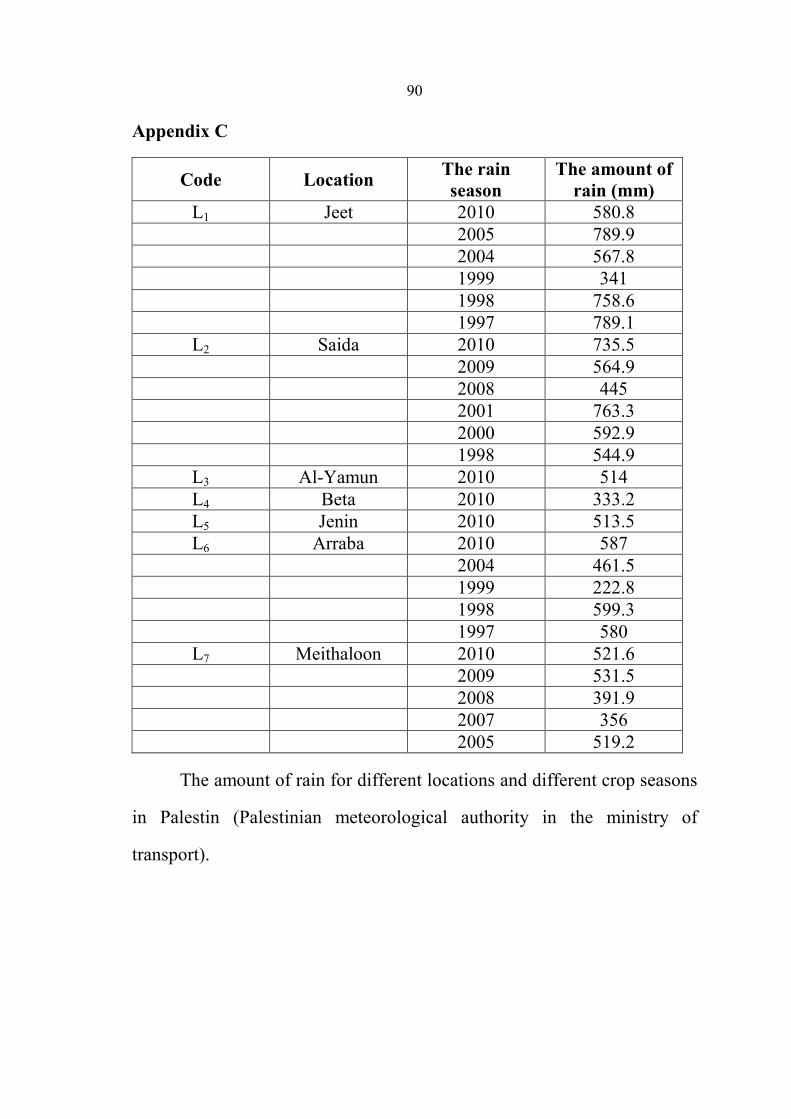
90
Appendix C
Code Location The rain season
The amount of rain (mm)
L1 Jeet 2010 580.8
2005 789.9
2004 567.8
1999 341
1998 758.6
1997 789.1
L2 Saida 2010 735.5
2009 564.9
2008 445
2001 763.3
2000 592.9
1998 544.9
L3 Al-Yamun 2010 514
L4 Beta 2010 333.2
L5 Jenin 2010 513.5
L6 Arraba 2010 587
2004 461.5
1999 222.8
1998 599.3
1997 580
L7 Meithaloon 2010 521.6
2009 531.5
2008 391.9
2007 356
2005 519.2
The amount of rain for different locations and different crop seasons
in Palestin (Palestinian meteorological authority in the ministry of
transport).

النجاح الوطنيةجامعة ليا الدراسات العكلية
لزوجة زيت الزيتون على درجة الحرارة اعتماد
مختلفة في فلسطينماكنأوعلى عمر التخزين في
إعداد
تجويد هاشم نعيرات
إشراف
عبد الرازقعصام راشد. د. أ محمد مسامحشربف. د
درجة الماجستير فـي الفيزيـاء الحصول على هذه األطروحة استكماالً لمتطلبات قدمت
. فلسطين،كلية الدراسات العليا في جامعة النجاح الوطنية في نابلسب
م2012

ب
لزوجة زيت الزيتون على درجة الحرارة اعتماد مختلفة في فلسطينماكنأوعلى عمر التخزين في
إعداد تجويد هاشم نعيرات
إشراف عبد الرازقعصام راشد. د. أ
محمد مسامحشربف. د
ملخصال
اعتمادها على درجات الحرارة لعينات من زيت الزيتون من تم دراسة اللزوجة و
كما تم . سنةةلى ثالث عشرإعمار تخزين مختلفة تصل أذات منطقتين مختلفتين في فلسطين
دراسة اللزوجة واعتمادها على درجات الحرارة لعينات من زيت الزيتون من محصول عام
تم مقارنة قيم اللزوجة . سابيعأ لعدة من منطقتين مختلفتين في فلسطين بعد تخزينها2010
التي تصف اعتماد و سابقةدراسات واعتمادها على درجات الحرارة لهذة العينات مع نتائج
ثوابت ةاللزوجة على درجات الحرارة بمعادالت تحوي على عدد من الثوابت اثنان أوثالث
أظهرت النتائج أن هذه المعادالت ال تصف بتوافق كبير اللزوجة واعتمادها على درجات و
تم اقتراح معادالت لذلك. الحرارة لعينات من زيت الزيتون من مناطق مختلفة في فلسطين
من الثوابت اثنان او ثالثة اًتصف اعتماد اللزوجة على درجة الحرارة بتوافق كبير تحوي عدد
.اوعدة ثوابت
.عمر التخزين درجة الحرارة و الدراسة أن اللزوجة تتأثر عكسيا مع نتائجأظهرت
من عدة 2010وكذلك تم دراسة حموضة عينات من زيت الزيتون من محصول عام
%).0.8 ≤(مناطق من فلسطين وأظهرت الدراسة أن معظم العينات هي زيت زيتون فاخر
فلسطين ذات فيربع مناطق مختلفة كما تم دراسة حموضة عينات زيت زيتون من أ
أظهرت النتائج أن الحموضة تتأثر طرديا مع عمر . سنةةلى ثالث عشرإعمار تخزين تصل أ
وتجدر %). 3.3≤(التخزين بالسنوات بحيث تتجاوز نسبة الحموضة مقاييس الجودة العالمية

ج
بدليل أن سنة ثنتى عشرةإ يمكن أن يتجاوزال لى أن عمر تخزين زيت الزيتون إشارة اال
سنوات احتفظت بنسبة حموضة ضمن عشرحموضة بعض العينات التي تم تخزينها لفترة
.المقاييس العالمية المعتمدة لجودة زيت الزيتون
وأيضا تم دراسة حموضة عينات من زيت الزيتون من ثالث مناطق مختلفة في فلسطين
سابيع كان الحموضة بعمر التخزين باالْكما أظرت النتائج أن تأثر . بعد تخزينها لعدة أسابيع
%).3.3≤( جدا وبقيت نسبة الحموضة ضمن مقاييس الجودة العالميةاًطفيف
في هذه الدراسة تم اقتراح معادالت تصف اعتماد كل من اللزوجة والحموضة على
.عمر التخزين