telkom sa soc limited group interim results · telom sa soc limited group interim results for the...
TRANSCRIPT

TELKOM SA SOC LIMITED Group Interim Results for the six months ended 30 September 2013
i
SPECIAL NOTE REGARDING FORWARD-LOOKING STATEMENTS
Telkom SA SOC Limited
Group Interim Resultsfor the six months ended 30 September 2013
The information contained in this document is also available on Telkom’s investor relations website www.telkom.co.za/ir

TELKOM SA SOC LIMITED Group Interim Results for the six months ended 30 September 2013
ii
SPECIAL NOTE REGARDING FORWARD-LOOKING STATEMENTSCONTENTS
INDEX
1 GROUP INTERIM RESULTS PRESENTATION
Telkom SA SOC Limited (Registration number 1991/005476/30)JSE share code: TKG ISIN: ZAE000044897
Group SecretaryXoliswa Makasi
Transfer secretariesComputershare Investor Services (Proprietary) LimitedPO Box 61051, Marshalltown, 2107
SponsorThe Standard Bank of South Africa LimitedStandard Bank Centre30 Baker Street, Rosebank, 2196
DirectorsJA Mabuza (Chairman), SN Maseko (Group Chief Executive Officer), JH Schindehütte (Chief Financial Officer), S Botha, Dr CA Fynn, N Kapila, I Kgaboesele, K Kweyama, L Maasdorp, K Mzondeki, F Petersen, LL Von Zeuner

TELKOM SA SOC LIMITED Group Interim Results for the six months ended 30 September 2013
1
Notes:
Telkom SA SOC Limited Group Interim Results for the 6 months to 30 September 2013
18 November 2013
Notes:
Sipho Maseko Group Chief Executive Officer

TELKOM SA SOC LIMITED Group Interim Results for the six months ended 30 September 2013
2
Notes:
1. Overview
2. Business performance
3. Financial results
4. The future
5. Q&A
3
AGENDA
Notes:
Healthy contract pipeline in Telkom Business
Wholesale is preferred supplier for submarine connectivity
Substantial increase in Business IT services revenues
Winner of MyBroadband fixed and mobile broadband provider for 2013
Launched new generation all-IP core network
Largest Wi-Fi and fibre network in SA
Significant reduction in cable theft incidents (-16%)
4
Laying the foundation to stabilise for future growth

TELKOM SA SOC LIMITED Group Interim Results for the six months ended 30 September 2013
3
Notes:
5 * Adjusted for the exclusion of the Competition Commission provision.
# Adjusted to exclude the curtailment gain.
Results positively influenced by non-recurring items
Sep 2013# Sep 2012* %
Net revenue R13 165m R13 027m 1.1
Operating expenses R12 496m R 12 209m 2.4
EBITDA R3 933m R3 948m (0.4)
Mobile EBITDA loss R773m R716m (8.0)
Capital investment R3 173m R2 123m 49.5
Free cash flow R33m R1 510m
(97.8)
Notes:
Wholesale and Networks
Key business drivers Focus areas
Next Generation Network on track with more than 158 000 homes passed on the MSAN Network
Launched all-IP core network
Enhance product solutions to be more competitive
Cost transformation initiatives underway
Next Generation Network moves into high gear
Expand business development capability to harness demand
Maintain and regain scale by growing our MCO business and expand value added services with OLOs/ISPs
Monetise infrastructure and increased fixed data traffic through value added services, innovative products and competitive pricing
6
TELKOM SA SOC LIMITED Group Interim Results for the six months ended 30 September 2013
4
Notes:
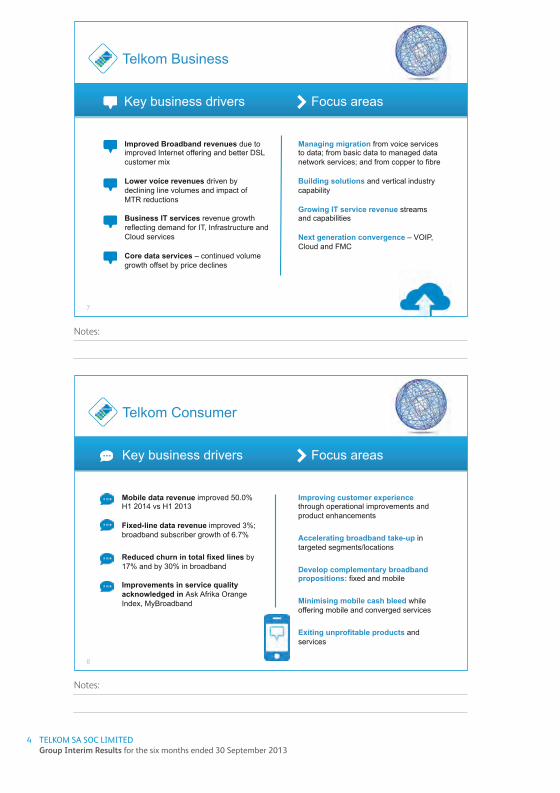
Telkom Business
Key business drivers
Improved Broadband revenues due to improved Internet offering and better DSL customer mix
Lower voice revenues driven by declining line volumes and impact of MTR reductions
Business IT services revenue growth reflecting demand for IT, Infrastructure and Cloud services
Core data services – continued volume growth offset by price declines
Managing migration from voice services to data; from basic data to managed data network services; and from copper to fibre
Building solutions and vertical industry capability
Growing IT service revenue streams and capabilities
Next generation convergence – VOIP, Cloud and FMC
Focus areas
7
Notes:
Telkom Consumer
Key business drivers
Mobile data revenue improved 50.0% H1 2014 vs H1 2013
Fixed-line data revenue improved 3%; broadband subscriber growth of 6.7%
Reduced churn in total fixed lines by 17% and by 30% in broadband
Improvements in service quality acknowledged in Ask Afrika Orange Index, MyBroadband
Improving customer experience through operational improvements and product enhancements
Accelerating broadband take-up in targeted segments/locations
Develop complementary broadband propositions: fixed and mobile
Minimising mobile cash bleed while offering mobile and converged services
Exiting unprofitable products and services
Focus areas
8

TELKOM SA SOC LIMITED Group Interim Results for the six months ended 30 September 2013
5
Notes:
Deon Fredericks Acting Chief Financial Officer
Notes:
10
1Free cash flow impacted by VERPs of R753m, Competition Commission fine of R67m, and higher capital investment of R1bn.
Interim Results Six months ended 30 September 2013
Sept 2013 Sept 2012 %
Operating revenue R16 192m R16 146m 0.3
Net revenue R13 165m R13 027m 1.1
Operating expenses R10 323m R12 598m 18.1
EBITDA R6 106m R3 559m 71.6
Depreciation and impairments R3 091m R2 966m (4.2)
Capital investment R3 173m R2 123m (49.5)
Free cash flow1 R33m R1 510m (97.8)

TELKOM SA SOC LIMITED Group Interim Results for the six months ended 30 September 2013
6
Notes:
Building momentum for future growth
11
1Free cash flow impacted by VERPs of R753m, Competition Commission fine of R67m, and higher capital investment of R1bn.
Sept 2013 Sept 2012 %
Operating revenue R16 192m R16 146m 0.3
Net revenue R13 165m R13 027m 1.1
Operating expenses R12 496m R12 209m 2.4
EBITDA R3 933m R3 948m (0.4)
Depreciation and impairments R3 091m R2 966m (4.2)
Capital investment R3 173m R2 123m (49.5)
Free cash flow1 R33m R1 510m (97.8)
Notes:
55.1% 33.7%
11.2%
25.8%
3.4%
(5.4%)
Data: R5 453m – 33.7% (Sept 2012: 32.8%)
Subsidiaries, CPE sales and other: R1 815m – 11.2% (Sept 2012: 8.9%)
Voice and interconnection: R8 924m – 55.1% (Sept 2012: 58.3%)
Year-on-year revenue increase
Year-on-year revenue decline
Higher mobile and Business IT data revenues
12
Year-on-year revenue increase
Year-on-year revenue decline

TELKOM SA SOC LIMITED Group Interim Results for the six months ended 30 September 2013
7
Notes:
Voice remains under pressure
9 41
4
4 41
1
3 84
7
874
8 92
4
4 07
1
3 88
9
739
Total voice and interconnection
Voice utilisation Voice subscriptions Interconnection
Sept 2012 Sept 2013
(7.7%)
(5.2%)
(15.4%)
13
1.1%
Notes:
795 419 841 831
898 203
Sept 2011 Sept 2012 Sept 2013
ADSL 6.7%
Sept 2011 Sept 2012 Sept 2013
Managed data network sites
12.8%
Data revenue gaining traction
Subs
crib
ers
14
4 764
8 205
11 958
19 655
Sept 2010 Sept 2011 Sept 2012 Sept 2013
Traffic Volumes in TBytes
ADSL Total
64.4%

TELKOM SA SOC LIMITED Group Interim Results for the six months ended 30 September 2013
8
Notes:
9 24
3
4 81
2
2 51
7
1 47
2
442
9 40
5
4 98
7
2 35
7
1 55
7
504
Operating expenses (excl depreciation)
Employee expenses
SG&A Service fees Operating leases
Sept 2012 Sept 2013
(14.0%)
6.4% (5.8%)
Real cost reduction remains crucial
(1.8%)
(3.6%)
Excluding the curtailment gain and the Competition Commission fine
Notes:
Capital programme gaining momentum
Sept 2013 Sept 2012 %
Total capital expenditure R3 173m R2 123m 49.5
Group capital expenditure excluding mobile R2 358m R1 602m 47.2
Converting access network to IP (NGN) R978m R276m 254.3
Maintaining/enhancing existing telecoms and IT networks R1 380m R1 326m 4.1
Mobile
R815m R521m 56.4
16

TELKOM SA SOC LIMITED Group Interim Results for the six months ended 30 September 2013
9
Notes:
Maintaining strong liquidity
Sept 2013 Sept 2012 %
Cash flow from operating activities R3 131m R3 490m (10.3)
Capital investments (R3 133m) (R2 085) (50.3)
(Reduction)/increase in term debt (R2 259m) R265m (952.5)
Cash at end of period R1 190m R561m 112.1
Discretionary investments R3 750m R6 710m (44.1)
17
We remain lowly geared (net debt to EBITDA is 0.3)
Notes:
Sipho Maseko Group Chief Executive Officer

TELKOM SA SOC LIMITED Group Interim Results for the six months ended 30 September 2013
10
Notes:
› Impairment of legacy assets
› Post-retirement medical aid liability
› Dealt with competition commission issues
› Engaging with regulatory structure
› Concluded agreement with Organised Labour
› Initiated efficiency measures
› Renewing the team
Addressing key issues affecting performance
19
Notes:
20
The status quo STRATEGIC AMBITION
Deliver superior customer experience
Focus investment in the right technologies and de-risk mobile
Implement sustainable cost reduction measures
Effectively manage regulatory process
Find growth in other profit pools where we have leadership
Right people, doing the right things at the right time
Redefining our future
Rapidly declining core (fixed voice)
Underinvestment in fixed access network and
start-up mobile network
High cost base
Uncertain regulatory and policy environment
Lack of execution capability
Poor brand perception and customer service

TELKOM SA SOC LIMITED Group Interim Results for the six months ended 30 September 2013
11
Notes:
• Discipline in allocating capital
• Delivering superior customer service and experience
• Driving execution capability and connectivity
• Investing in the right technologies to build an invincible network
• Obtaining the support of all our stakeholder to deliver on our strategy
• Impacting the SA economy in a transformational way through ICT
21
Strategic framework to focus our actions
Notes:
22
Managing costs to achieve a sustainable future
• Reduce external spend
• Optimise internal costs and improve productivity
• Streamline network maintenance expenses
• Integrate Consumer and Mobile platforms to realise cost synergies
• Focused product offering
• Reduce development burden

TELKOM SA SOC LIMITED Group Interim Results for the six months ended 30 September 2013
12
Notes:
23
Our financial targets over the next three years
F2014 F2015 F2016
Revenue Stabilise Stabilise to grow Grow
EBITDA margin Increase 1 - 2%
Increase 1 - 2%
Increase 1 - 2%
Capex to revenue 18 - 21% 14 - 17% 14 - 17%
Net debt to EBITDA ≤ 1 ≤ 1 ≤ 1
Reinstate dividend Reinstated Reinstated
Notes:
24
Summary
Deliver superior customer experience
Resolve Mobile – remove uncertainty and curtail future opex and capex
Disciplined capital allocation with greater emphasis on productivity and returns
Improve efficiency – cost base, execution
Find revenue growth – to secure future

TELKOM SA SOC LIMITED Group Interim Results for the six months ended 30 September 2013
13
Notes:
Thank you
Notes:
Appendix

TELKOM SA SOC LIMITED Group Interim Results for the six months ended 30 September 2013
14
Notes:
Organisational structure
Telkom Board
Head of Strategy & Regulatory
(In GCEO Office)
Chief Risk Officer
Chief of Human Resources
Chief Financial Officer
Chief of Procurement
Group Executive: Company Secretariat
Chief Information Officer
Chief Technology Officer
Chief Operating Officer
Chief Marketing Officer
IT and systems Integration
IT and innovation/ R & D
Network build
Network transformation
EXCO roles Non-EXCO Statutory role as per Companies Act
Mobile and fixed
Group Chief Executive Officer
Mobile and consumer
Telkom Business
iWay and subsidiaries
* Trudon, * Swiftnet
Cybernest (DCO)

TELKOM SA SOC LIMITED Group Interim Results for the six months ended 30 September 2013
15
Telkom SA SOC Limited
Group Interim Resultsfor the six months ended 30 September 2013

TELKOM SA SOC LIMITED Group Interim Results for the six months ended 30 September 2013
16
CONTENTS
INDEX
1 FORWARD LOOKING STATEMENTS 17
2 GROUP SALIENT FEATURES 18
3 KEY INDICATORS 19
4 OVERVIEW 20
5 OPERATIONAL DATA 22
6 FINANCIAL PERFORMANCE 23

TELKOM SA SOC LIMITED Group Interim Results for the six months ended 30 September 2013
17
SPECIAL NOTE REGARDING FORWARD LOOKING STATEMENTS
Many of the statements included in this document, as well as oral statements that may be made by us or by officers, directors or employees acting on behalf of us, constitute or are based on forward looking statements.
All statements, other than statements of historical facts, including, among others, statements regarding our convergence and other strategies, future financial position and plans, objectives, capital expenditures, projected costs and anticipated cost savings and financing plans, as well as projected levels of growth in the communications market, are forward looking statements. Forward looking statements can generally be identified by the use of terminology such as “may”, “will”, “should”, “expect”, “envisage”, “intend”, “plan”, “project”, “estimate”, “anticipate”, “believe”, “hope”, “can”, “is designed to” or similar phrases, although the absence of such words does not necessarily mean that a statement is not forward looking. These forward looking statements involve a number of known and unknown risks, uncertainties and other factors that could cause our actual results and outcomes to be materially different from historical results or from any future results expressed or implied by such forward looking statements. Among the factors that could cause our actual results or outcomes to differ materially from our expectations including, but not limited to those risks identified in Telkom’s most recent annual report, which are available on Telkom’s website at www.telkom.co.za/ir.
We caution you not to place undue reliance on these forward looking statements. All written and oral forward looking statements attributable to us, or persons acting on our behalf, are qualified in their entirety by these cautionary statements. Moreover, unless we are required by law to update these statements, we will not necessarily update any of these statements after the date of this document, either to conform them to actual results or to changes in our expectations.
The information contained in this document is also available on Telkom’s investor relations website www.telkom.co.za/ir.
Telkom SA SOC Limited (“Telkom” or “the Group” or “the Company”) is listed on the JSE Limited. Information may be accessed on Reuters under the symbols TKGJ.J and on Bloomberg under the symbol TKG.SJ. Information contained on Reuters and Bloomberg is provided by a third party and is not incorporated by reference herein. Telkom has not approved or verified such information and does not accept any liability for the accuracy of such information.

TELKOM SA SOC LIMITED Group Interim Results for the six months ended 30 September 2013
18
GROUP SALIENT FEATURES for the six months ended 30 September 2013
ADSL SUBSCRIBERS INCREASED 6.7% TO 898 203.6.7%
2.0%
6.9%
28.3%
0.3%
12.8%
CALLING PLAN SUBSCRIBERS INCREASED 2.0% TO 860 161.
MANAGED DATA NETWORK SITES INCREASED 12.8% TO 45 441.
ACTIVE MOBILE SUBSCRIBERS INCREASED 6.9% TO 1 598 173 WITH A BLENDED ARPU OF R58.81.
MOBILE SITES INTEGRATED INCREASED 28.3% TO 2 238.
871 LTE SITES INTEGRATED.
OPERATING REVENUE UP 0.3% TO R16.2 BILLION.
– FIXED-LINE VOICE AND INTERCONNECTION REVENUE DECREASED 4.7% TO R8.7 BILLION.
– FIXED-LINE DATA REVENUE INCREASED 1.2% TO R5.2 BILLION.
– MOBILE REVENUE INCREASED 55.4% TO R926 MILLION.
– MOBILE DATA REVENUE INCREASED 50.0% TO R303 MILLION.
HEADLINE EARNINGS PER SHARE EXCLUDING THE NET CURTAILMENT GAIN INCREASED SIGNIFICANTLY TO 224.2 CENTS.
EBITDA MARGIN EXCLUDING THE NET CURTAILMENT GAIN AND COMPETITION COMMISSION PROVISION WAS RELATIVELY FLAT AT 24.3%.
THE GROUP GENERATED FREE CASH FLOW OF R33 MILLION, A 97.8% DECREASE FROM THE PREVIOUS PERIOD.
GROUP INTEREST-BEARING DEBT DECREASED 34.9% TO R4.3 BILLION.
871 SITES
224.2 CENTS
97.8%
24.3%
34.9%

TELKOM SA SOC LIMITED Group Interim Results for the six months ended 30 September 2013
19
KEY INDICATORS
OPERATiNG REVENUE EBiTDA*
16 1
46
3 94
8
16 1
92
3 93
3
SEP 2013SEP 2012
R millionBEPS* HEPS*
140.
6
224.
2
SEP 2013SEP 2012
SEP 2013MAR 2013
RETURN ON ASSETS BEFORE TAXATiON*
*Excluding curtailment gain in September 2013 and the provision for the
Competition Commission fine in March 2013.
7.5
7.8
SEP 2013SEP 2012
REVENUE FROM MOBiLE OPERATiONS
R million
596
926
SEP 2013SEP 2012
CASH FLOWS FROM OPERATiNG ACTiViTiES
R million
3 49
0
3 13
1
SEP 2013SEP 2012
MOBiLE EBiTDA LOSS
R million
716 77
3
SEP 2013SEP 2012
ADSL SUBSCRiBERS
Thousand
842 89
8
SEP 2013SEP 2012
REVENUE GENERATiNGMOBiLE SUBSCRiBERS
Thousand
1 49
5
1 59
8
101.
1
*Excluding the curtailment gain in September 2013 and Competition Commission provision in September 2012.
94.0
TELKOM SA SOC LIMITED Group Interim Results for the six months ended 30 September 2013
20
OVERVIEW
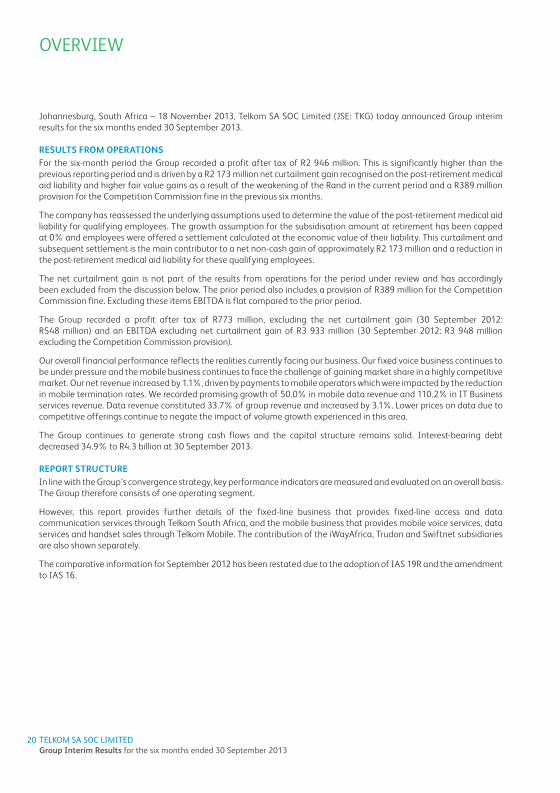
Johannesburg, South Africa – 18 November 2013, Telkom SA SOC Limited (JSE: TKG) today announced Group interim results for the six months ended 30 September 2013.
RESULTS FROM OPERATIONSFor the six-month period the Group recorded a profit after tax of R2 946 million. This is significantly higher than the previous reporting period and is driven by a R2 173 million net curtailment gain recognised on the post-retirement medical aid liability and higher fair value gains as a result of the weakening of the Rand in the current period and a R389 million provision for the Competition Commission fine in the previous six months.
The company has reassessed the underlying assumptions used to determine the value of the post-retirement medical aid liability for qualifying employees. The growth assumption for the subsidisation amount at retirement has been capped at 0% and employees were offered a settlement calculated at the economic value of their liability. This curtailment and subsequent settlement is the main contributor to a net non-cash gain of approximately R2 173 million and a reduction in the post-retirement medical aid liability for these qualifying employees.
The net curtailment gain is not part of the results from operations for the period under review and has accordingly been excluded from the discussion below. The prior period also includes a provision of R389 million for the Competition Commission fine. Excluding these items EBITDA is flat compared to the prior period.
The Group recorded a profit after tax of R773 million, excluding the net curtailment gain (30 September 2012: R548 million) and an EBITDA excluding net curtailment gain of R3 933 million (30 September 2012: R3 948 million excluding the Competition Commission provision).
Our overall financial performance reflects the realities currently facing our business. Our fixed voice business continues to be under pressure and the mobile business continues to face the challenge of gaining market share in a highly competitive market. Our net revenue increased by 1.1%, driven by payments to mobile operators which were impacted by the reduction in mobile termination rates. We recorded promising growth of 50.0% in mobile data revenue and 110.2% in IT Business services revenue. Data revenue constituted 33.7% of group revenue and increased by 3.1%. Lower prices on data due to competitive offerings continue to negate the impact of volume growth experienced in this area.
The Group continues to generate strong cash flows and the capital structure remains solid. Interest-bearing debt decreased 34.9% to R4.3 billion at 30 September 2013.
REPORT STRUCTUREIn line with the Group’s convergence strategy, key performance indicators are measured and evaluated on an overall basis. The Group therefore consists of one operating segment.
However, this report provides further details of the fixed-line business that provides fixed-line access and data communication services through Telkom South Africa, and the mobile business that provides mobile voice services, data services and handset sales through Telkom Mobile. The contribution of the iWayAfrica, Trudon and Swiftnet subsidiaries are also shown separately.
The comparative information for September 2012 has been restated due to the adoption of IAS 19R and the amendment to IAS 16.

TELKOM SA SOC LIMITED Group Interim Results for the six months ended 30 September 2013
21
MESSAGE FROM TELKOM GROUP CEO SIPHO MASEKO: The Group’s financial performance indicates a challenging industry environment. Despite a considerable increase in the Group’s earnings, owing to several once-off items, underlying operational earnings remain under pressure. The Group reported headline earnings, excluding the net curtailment gain recognised on the post-retirement medical aid liability, of 224.2 cents from 101.1 cents. This also excludes the provision for the Competition Commission fine in the prior reporting period. The increase was primarily due to lower payments to mobile operators resulting from the reduction in mobile termination rates and higher fair value gains as a result of the weakening of the Rand.
Operating revenue increased slightly by 0.3% to R16 192 million due to higher mobile and IT Business services revenue, partially offset by lower fixed-line voice revenue. We are encouraged by the improvement in mobile data revenue which increased 50.0% to R303 million resulting from an increase in the number of data subscribers and data deals and promotions launched during the period. However, we are continuing to explore all avenues to derisk the mobile business.
Operating expenses decreased by 18.1% to R10 323 million. This is due to the R2 173 million net curtailment gain and the R389 million provision for the Competition Commission fine included in the prior reporting period. Excluding the gain and Competition Commission provision in the previous year, operating expenses would have increased 2.4%.
Our capital structure remains sound despite large cash outflows resulting from payments of severance packages, part of the Competition Commission fine and an increase in our capital expenditure. We continue to invest in modernising our network to provide high speed, quality and reliable broadband to South Africans. For the 2014 financial year, management has taken a prudent approach to cap its capital expenditure to R6.5 billion while the Group reviews its options, particularly in mobile.
Telkom’s Board and management team have already resolved several long-term issues affecting the performance of the Group. This includes impairing a large portion of the Group’s legacy assets, settling Competition Commission matters, successfully addressing unfair and uncompetitive mobile termination rates and reviewing the post-retirement medical aid liability.
Defining our role clearly as a listed national incumbent will allow us to address the dichotomy in shareholder expectations. Through its people, technology and infrastructure, Telkom has the unique opportunity to meet the needs of all its stakeholders: our shareholders, customers, employees and the broader society in which we operate. To achieve this, we must prioritise our objectives to shape the Group’s strategic imperatives and ensure we succeed in the following key areas:• Financialperformance–strategiccapitalallocations,returnsdriventorestorefinancialhealth• Customerperception–deliversuperiorcustomerserviceandexperience• Operationalexcellenceandefficiency–driveexecutioncapabilityandconnectivityto“ownthehome”• Infrastructurequality–investintherighttechnologies• Alignmentofallstakeholders–Telkomcannotdeliveronitsstrategywithoutthesupportofallitsstakeholders
Telkom is instilling a disciplined approach to capital allocation. We will invest in areas where we have leadership, and place a greater emphasis on productivity and returns. Infrastructure investment in particular will be returns-driven.
Telkom has the most extensive infrastructure network in the country. We need to monetise that advantage and drive the take-up in high-speed broadband services enabled by the New Generation Network (NGNEC). The National Broadband Plan is an opportunity for Telkom to improve the scale and efficiency of its network.
There is a window of opportunity for Telkom to become the leader in data transmission, but we must act with speed and determination to commercialise our competitive advantage.
TELKOM SA SOC LIMITED Group Interim Results for the six months ended 30 September 2013
22
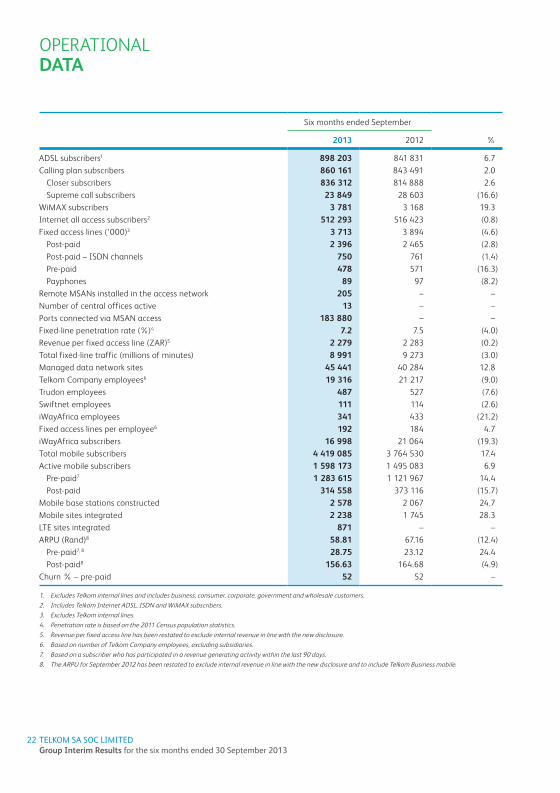
OPERATIONAL DATA
Six months ended September
2013 2012 %
ADSL subscribers1 898 203 841 831 6.7 Calling plan subscribers 860 161 843 491 2.0
Closer subscribers 836 312 814 888 2.6 Supreme call subscribers 23 849 28 603 (16.6)
WiMAX subscribers 3 781 3 168 19.3 Internet all access subscribers2 512 293 516 423 (0.8)Fixed access lines (‘000)3 3 713 3 894 (4.6)
Post-paid 2 396 2 465 (2.8)Post-paid – ISDN channels 750 761 (1.4)Pre-paid 478 571 (16.3)Payphones 89 97 (8.2)
Remote MSANs installed in the access network 205 – – Number of central offices active 13 – – Ports connected via MSAN access 183 880 – – Fixed-line penetration rate (%)4 7.2 7.5 (4.0)Revenue per fixed access line (ZAR)5 2 279 2 283 (0.2)Total fixed-line traffic (millions of minutes) 8 991 9 273 (3.0)Managed data network sites 45 441 40 284 12.8 Telkom Company employees6 19 316 21 217 (9.0)Trudon employees 487 527 (7.6)Swiftnet employees 111 114 (2.6)iWayAfrica employees 341 433 (21.2)Fixed access lines per employee6 192 184 4.7 iWayAfrica subscribers 16 998 21 064 (19.3)Total mobile subscribers 4 419 085 3 764 530 17.4 Active mobile subscribers 1 598 173 1 495 083 6.9
Pre-paid7 1 283 615 1 121 967 14.4 Post-paid 314 558 373 116 (15.7)
Mobile base stations constructed 2 578 2 067 24.7 Mobile sites integrated 2 238 1 745 28.3 LTE sites integrated 871 – – ARPU (Rand)8 58.81 67.16 (12.4)
Pre-paid7, 8 28.75 23.12 24.4 Post-paid8 156.63 164.68 (4.9)
Churn % – pre-paid 52 52 –
1. Excludes Telkom internal lines and includes business, consumer, corporate, government and wholesale customers.2. Includes Telkom Internet ADSL, ISDN and WiMAX subscribers. 3. Excludes Telkom internal lines.4. Penetration rate is based on the 2011 Census population statistics. 5. Revenue per fixed access line has been restated to exclude internal revenue in line with the new disclosure.6. Based on number of Telkom Company employees, excluding subsidiaries. 7. Based on a subscriber who has participated in a revenue generating activity within the last 90 days. 8. The ARPU for September 2012 has been restated to exclude internal revenue in line with the new disclosure and to include Telkom Business mobile.

TELKOM SA SOC LIMITED Group Interim Results for the six months ended 30 September 2013
23
FINANCIAL PERFORMANCE
GROUP OPERATING REVENUE
Six months ended
In ZAR millions 30 September
201330 September
2012 %
Voice 8 185 8 540 (4.2) Fixed-line usage 4 071 4 411 (7.7) Fixed-line subscriptions 3 889 3 847 1.1 Mobile voice and subscriptions 225 282 (20.2)
Interconnection 739 874 (15.4) Fixed-line domestic 236 286 (17.5) Fixed-line international 470 551 (14.7) Mobile interconnection 33 37 (10.8)
Data 5 453 5 289 3.1 Data connectivity 2 791 2 761 1.1 Leased line facilities 941 988 (4.8) Internet access and related services 846 798 6.0 Managed data network services 444 464 (4.3) Multi-media services 25 27 (7.4) Mobile data 303 202 50.0 IT Business services 103 49 110.2
Customer premises equipment sales and rentals 864 578 49.5 Sales 135 156 (13.5) Rentals 364 347 4.9 Mobile handset and equipment sales 365 75 386.7
Other 172 44 290.9 iWayAfrica 169 182 (7.1)Trudon 562 592 (5.1)Swiftnet 48 47 2.1
Total 16 192 16 146 0.3
Group operating revenue increased by 0.3% to R16 192 million (30 September 2012: R16 146 million) driven by growth in mobile data and IT Business services revenue.
Fixed-line voice usage revenue continued its declining trend and decreased 7.7% to R4 071 million (30 September 2012: R4 411 million). This was driven by a 3.0% decline in voice minutes, which continues being affected by mobile substitution, a reduction in fixed termination rates of approximately R55 million and a decrease of approximately R130 million relating to the pass through of the reduction in mobile termination rates to fixed-line customers. Furthermore, the number of lines also declined by 4.6%.
Fixed-line subscriptions revenue grew 1.1% to R3 889 million (30 September 2012: R3 847 million) as a result of line rental tariff adjustments (5.8% increase in post-paid residential and a 6% increase in business line rental tariffs effective 1 August 2012 and 1 August 2013).
Although revenue from our mobile operations increased by 55.4%, mobile voice and subscriber revenue decreased 20.2% and interconnection revenue decreased 10.8%. This is driven by both the decline in the number of post-paid subscribers and lower post-paid ARPU. The decline in our post-paid subscribers is attributable to the expiration of a large number of hybrid contracts as well as the continuation of the debtors clean-up to ensure a better quality customer base. These hybrid contracts were generating low ARPUs and the current base is providing a more sustainable growth base than the prior period. Fixed-line domestic interconnection revenue decreased 17.5% to R236 million (30 September 2012: R286 million) primarily due to the 20.9% average decrease in fixed termination rates.

TELKOM SA SOC LIMITED Group Interim Results for the six months ended 30 September 2013
24
FINANCIAL PERFORMANCE (CONTiNUED)
GROUP OPERATING REVENUE (CONTINUED)Fixed-line international interconnection revenue decreased by 14.7% to R470 million (30 September 2012: R551 million) largely as a result of the loss of traffic as competitors provide their own routes.
Data connectivity increased 1.1% to R2 791 million (30 September 2012: R2 761 million) as a 6.7% increase in the number of ADSL subscribers to 898 203 (30 September 2012: 841 831) was offset by lower revenue from Diginet, Megalines, ATM and LanConnect.
Revenue from mobile leased line facilities remained under pressure and declined 4.8% to R941 million (30 September 2012: R988 million) as self-provisioning by other operators continues.
Internet access revenue increased 6.0% contributed by higher IP Connect revenue.
Managed data network services revenue decreased 4.3% to R444 million (30 September 2012: R464 million) as a rcredit note of approximately R30 million was issued following the renegotiation of a contract. In terms of the renegotiated contract the revenue will only be recognised in the second half of the 2014 financial year. The migration of customers to lower cost solutions also contributed to the decrease and was partially offset by a 12.8% increase in the number of sites to 45 441 (30 September 2012: 40 284).
Mobile data revenue increased 50.0% to R303 million (30 September 2012: R202 million) from growth in the number of data subscribers, data deals and promotional products launched during the period in line with our strategy to focus on data.
IT Business services revenue increased 110.2% to R103 million (30 September 2012: R49 million) as we experienced good traction in the IT market with key strategic wins.
Although our customer premises equipment sales decreased 13.5% to R135 million (30 September 2012: R156 million) due to a strategic decision to discontinue the sale of PC and gaming equipment, our rentals increased 4.9% to R364 million (30 September 2012: R347 million) from growth in new generation equipment rentals and higher tariffs.
Mobile handset and equipment sales revenue increased 386.7% driven by higher bulk sales to dealers as well as the sharp increase from Smartphone and Tablet sales.
Other revenue increased 290.9% to R172 million (30 September 2012: R44 million) as we recognised higher revenue from expired cards and higher co-location revenue generated from an increase in the number of sites.
GROUP OTHER INCOME
Six months ended
In ZAR millions 30 September
201330 September
2012 %
Telkom 150 140 7.1 iWayAfrica 8 7 14.3 Trudon 14 14 – Swiftnet 1 3 (66.7)
Total 173 164 5.5
Higher rental received from commercial buildings was the main contributor to the increase in other income.

TELKOM SA SOC LIMITED Group Interim Results for the six months ended 30 September 2013
25
GROUP DIRECT EXPENSES
Six months ended
In ZAR millions 30 September
201330 September
2012 %
Payments to other operators 2 026 2 458 17.6 Direct cost 257 159 (61.6)Cost of sales 744 502 (48.2)
Total 3 027 3 119 2.9
The 2.9% decrease in direct expenses driven by the decrease in mobile termination rates was partially offset by higher mobile acquisition costs, higher cost of customer premises equipment and mobile handsets sold.
Telkom direct expenses
Six months ended
In ZAR millions 30 September
201330 September
2012 %
Payments to other operators 1 913 2 332 18.0 Mobile network operators 1 100 1 481 25.7 International network operators 458 517 11.4 Fixed-line network operators 199 178 (11.8)Data commitments 156 156 –
Direct cost 258 159 (62.3)Cost of sales 541 306 (76.8)
Total 2 712 2 797 3.0
Payment to other operators decreased by 18.0% resulting from a reduction in mobile termination rates, lower international settlement rates and volumes, and higher fixed-line volumes, offset by lower fixed-line termination rates.
Direct cost increased 62.3% following an increase in mobile sales acquisition cost relating to a 6.9% increase in active mobile subscribers.
The increase in cost of sales is mainly as a result of the increase in the cost of mobile handsets sold.
GROUP OPERATING EXPENSES
Six months ended
In ZAR millions 30 September
201330 September
2012 %
Employee expenses* 4 987 4 812 (3.6) Selling, general and administrative expenses* 2 357 2 517 6.4 Service fees 1 557 1 472 (5.8)Operating leases 504 442 (14.0)Depreciation, amortisation, impairments and write-offs 3 091 2 966 (4.2)
Total 12 496 12 209 (2.4)
* Excluding the net curtailment gain from employee expenses in September 2013 and the provision for the Competition Commission fine from selling, general and administrative expenses in September 2012.

TELKOM SA SOC LIMITED Group Interim Results for the six months ended 30 September 2013
26
FINANCIAL PERFORMANCE (CONTiNUED)
GROUP OPERATING EXPENSES (CONTINUED)Group operating expenses increased by 2.4% to R12 496 million (30 September 2012: R12 209 million) in the six months ended 30 September 2013, primarily due to the 6.8% average salary increase for bargaining unit employees and a 3.6% average salary increase for management employees as well as the impairment of legacy and technologically aged spare parts that was reclassified from inventory to property, plant and equipment in terms of an amendment to IFRS.
Group operating expenditure contribution
Six months ended
In ZAR millions 30 September
201330 September
2012 %
Telkom* 12 231 11 950 (2.4) iWayAfrica 63 71 11.3 Trudon 155 149 (4.0)Swiftnet 47 39 (20.5)
Total 12 496 12 209 (2.4)
*Excluding the net curtailment gain in September 2013 and the provision for the Competition Commission fine in September 2012.
Telkom operating expenses
Six months ended
In ZAR millions 30 September
201330 September
2012 %
Employee expenses 4 812 4 626 (4.0) Salaries and wages 3 649 3 609 (1.1)Benefits* 1 313 1 206 (8.9)Workforce reduction expenses 64 32 (100.0)Employee related expenses capitalised (214) (221) (3.2)
Selling, general and administrative expenses 2 340 2 513 6.9Materials and maintenance 1 554 1 531 (1.5)Marketing 453 375 (20.8)Bad debts 41 211 80.6 Other* 292 396 26.3
Service fees 1 545 1 460 (5.8)Property management 836 797 (4.9)Consultants, security and other 709 663 (6.9)
Operating leases 475 415 (14.5)Buildings 205 161 (27.3)Equipment 19 17 (11.8)Vehicles 251 237 (5.9)
Depreciation, amortisation, impairments and write-offs 3 059 2 936 (4.2)Depreciation 2 294 2 461 6.8 Amortisation 316 420 24.8 Impairment and write-offs 449 55 (716.4)
Total 12 231 11 950 (2.4)
* Excluding the net curtailment gain from employee expenses in September 2013 and the provision for the Competition Commission fine from selling, general and administrative expenses in September 2012.

TELKOM SA SOC LIMITED Group Interim Results for the six months ended 30 September 2013
27
GROUP OPERATING EXPENSES (CONTINUED)Employee expenses were 4.0% higher driven by a 6.8% average salary increase for bargaining unit employees and a 3.6% average salary increase for management employees, partially offset by a 9.0% decrease in headcount achieved through the voluntary severance packages and voluntary early retirement packages offered.
Selling, general and administrative expenses reduced by 6.9% to R2 340 million (30 September 2012: R2 513 million), contributed by lower inventory write-offs and bad debts which reduced by 80.6% as lower international bad debts were written off and mobile credit vetting systems were improved. We did however experience an increase in marketing expenses of 20.8% as mobile marketing campaigns increased.
Space optimisation projects, repairs and renovation of mobile buildings and masts, resulted in a 4.9% increase in property management expenses. Consultants, security and other service fees increased 6.9% driven by higher consulting cost incurred relating to the Company transformation process.
Operating leases increased 14.5% as we increased in the number of mobile sites acquired and higher building leases.
Depreciation decreased 6.8% to R2 294 million (30 September 2012: R2 461 million). The decrease relates to the R12 billion impairment of the asset base in March 2013. This was partially offset by accelerated depreciation as we reviewed the useful lives of new connections installed to customer premises.
Impairment and write-offs increased significantly. With effect from 1 April 2013, Telkom adopted an amendment to IAS 16, property, plant and equipment (PPE) which clarifies that spare parts previously included in inventory be classified as PPE if they meet the definition of PPE. Consequently, certain legacy and technologically aged items were reclassified to PPE from inventory. As the carrying amount of these items exceeded the recoverable amount thereof, IFRS required an impairment to be recognised regarding these assets.
Details of operating expenditure related to our mobile business that is included in Telkom’s operating expenditure are provided below for additional information to monitor Telkom Mobile as a start-up business.
Mobile operating expenditure
Six months ended
In ZAR millions 30 September
201330 September
2012 %
Payments to other operators 230 191 (20.4)Direct cost 215 126 (70.6)Cost of sales 331 131 (152.7)Employee expenses 180 153 (17.6)Selling, general and administrative expenses 565 534 (5.8)Service fees 71 116 38.8 Operating leases 107 61 (75.4)Depreciation, amortisation, impairments and write-offs 248 166 (49.4)
Total 1 947 1 478 (31.7)

TELKOM SA SOC LIMITED Group Interim Results for the six months ended 30 September 2013
28
FINANCIAL PERFORMANCE (CONTiNUED)
EBITDA
Six months ended
In ZAR millions 30 September
201330 September
2012 %
Telkom* 3 679 3 655 0.7EBITDA margin (%) 23.9 23.8 0.1Trudon 266 306 (13.1)EBITDA margin (%) 47.3 51.7 (4.4)Swiftnet (1.0) 5.0 (120.1)EBITDA margin (%) (2.1) 10.6 (12.7)iWayAfrica (11) (18) 38.9 EBITDA margin (%) (6.5) (9.9) 3.4
Total 3 933 3 948 (0.4)
*Excluding the net curtailment gain in September 2013 and the provision for the Competition Commission fine in September 2012.
INVESTMENT INCOMEInvestment income consists of interest received on short-term investments and bank accounts. Investment income decreased by 17.4% to R123 million (30 September 2012: R149 million) as a result of lower cash balances.
FINANCE CHARGES AND FAIR VALUE MOVEMENTSFinance charges include interest paid on local and foreign borrowings, amortised discounts on bonds and commercial paper bills, fair value gains and losses on financial instruments and foreign exchange gains and losses on foreign currency denominated transactions and balances.
Foreign exchange and fair value gains increased significantly to R279 million (30 September 2012: R60 million). The increase emanated from higher fair value gains on derivatives caused by the weakening of the Rand and a higher fair value of the investment in Cell Captive preference shares. The interest expense decreased by 21.3% to R269 million (30 September 2012: R342 million) driven by lower interest rates and a 34.9% decrease in interest-bearing debt from 31 March 2013.
TAXATION The consolidated tax expense decreased to R202 million (30 September 2012: R301 million) resulting from lower taxable profit in the six months ended 30 September 2013 as the deferred tax on the net curtailment gain was not recognised and the Competition Commission fine provided in the prior period was not tax deductible.
The consolidated effective tax rate for the six months ended 30 September 2013, excluding the net curtailment gain was 20.7%. The consolidated effective tax rate, excluding the non-deductible Competition Commission fine for the six months ended 30 September 2012 was 35.5%. The higher effective tax rate for the six months ended 30 September 2012 was as a result of the non-deductible impairment of the loan to Multi-Links and the loan and investment in iWayAfrica. Although the impairments are eliminated on consolidation, it has an impact on the Company’s taxation expense.
CONSOLIDATED STATEMENT OF FINANCIAL POSITIONThe Group’s capital structure remains strong. Net debt, after financial assets and liabilities, decreased by 4.6% to R2 029 million from R2 122 million as at 31 March 2013, resulting in a net debt to EBITDA ratio of 0.3 times excluding the net curtailment gain at 30 September 2013. On 30 September 2013, the Group had cash balances, including other financial assets and liabilities, of R2 229 million (31 March 2013: R4 464 million).
Current liabilities decreased in the six months ended 30 September 2013 as we settled the R2.0 billion syndicated loan payable in December 2013.

TELKOM SA SOC LIMITED Group Interim Results for the six months ended 30 September 2013
29
FREE CASH FLOW Six months ended
In ZAR millions 30 September
201330 September
2012 %
Cash generated from operations before dividends paid 3 166 3 595 (11.9)Less: Additions to property, plant and equipment (3 133) (2 085) 50.3
Free cash flow 33 1 510 (97.8)
Free cash flow decreased 97.8% to R33 million (30 September 2012: R1 510 million) resulting from a 50.3% increase in additions to property, plant and equipment and a 11.9% decrease in cash generated from operations. Cash generated from operations decreased due to the payment of severance packages, higher creditor payments resulting from the weakening of the Rand against major currencies and payment of part of the Competition Commission fine in the six months ended 30 September 2013.
GROUP CAPITAL EXPENDITUREOur capital expenditure remains directed at our strategic intent of building our Next Generation Network and growing our mobile and converged service offerings.
Group capital expenditure which includes spend on intangible assets, increased by 49.5% to R3 173 million (30 September 2012: R2 123 million) and represents 19.6% of Group operating revenue (30 September 2012: 13.1%).
Six months ended
In ZAR millions 30 September
201330 September
2012 %
Baseline 1 083 968 (11.9)Network evolution 1 014 344 (194.8)Mobile 815 521 (56.4)Sustainment 60 89 32.6 Effectiveness and efficiency 58 23 (152.2)Support 91 99 8.1 Regulatory and other 2 15 86.7 iWayAfrica 2 2 – Trudon 35 48 27.1 Swiftnet 13 14 7.1
Total 3 173 2 123 (49.5)
Baseline capital expenditure of R1 083 million (30 September 2012: R968 million) was largely for the deployment of technologies to support the growing data services business, links to the mobile cellular operators and expenditure for access line deployment in selected high growth commercial and business areas. The increased expenditure for the period can be attributed to growth in the IP Network, Customer Specific Solutions and the core transport network.
Expenditure on network evolution of R1 014 million (30 September 2012: R344 million) was mainly for the continued rollout of the Next Generation Network programme to modernise the legacy voice network, to provide high speed ADSL service in selected areas and to address the associated operational and business support systems. Expenditure has increased as the programme progresses beyond the initial phase.
Mobile capital expenditure increased 56.4% as we continue to invest in our mobile and LTE network. This is as a result of the first half of the prior year being a repositioning period.

TELKOM SA SOC LIMITED Group Interim Results for the six months ended 30 September 2013
30
FINANCIAL PERFORMANCE (CONTiNUED)
GROUP CAPITAL EXPENDITURE (CONTINUED)The sustainment category expenditure of R60 million (30 September 2012: R89 million) was largely for the replacement of obsolete power systems as well as the replacement and modernisation of the access and core network.
The increase in the effectiveness and efficiency category to R58 million (30 September 2012: R23 million) was as a result of the movement of staff from leased buildings to owned buildings and of the upgrade of the IT service desk.
The support capital expenditure of R91 million (30 September 2012: R99 million) is mainly for the rebranding of Telkom stores, for the provision of new buildings and building extensions in support of network growth and compliance upgrades.
THREE-YEAR FINANCIAL TARGETS
F2014 F2015 F2016
Revenue Stabilise Stabilise to grow
Grow
EBITDA margin Increase1 – 2%
Increase 1 – 2%
Increase 1 – 2%
Capex to revenue 18 – 21% 14 – 17% 14 – 17%
Net debt to EBITDA ≤1 ≤1 ≤1
Reinstate dividend Reinstated Reinstated

TELKOM SA SOC LIMITED Group Interim Results for the six months ended 30 September 2013
31
CONTENTS
INDEX
1 CONDENSED CONSOLIDATED INTERIM STATEMENT OF PROFIT OR LOSS AND OTHER COMPREHENSIVE INCOME 32
2 CONDENSED CONSOLIDATED INTERIM STATEMENT OF FINANCIAL POSITION 33
3 CONDENSED CONSOLIDATED INTERIM STATEMENT OF CHANGES IN EQUITY 34
4 CONDENSED CONSOLIDATED INTERIM STATEMENT OF CASH FLOWS 35
5 NOTES TO THE CONDENSED CONSOLIDATED INTERIM FINANCIAL STATEMENTS 36
AUDITORS’ REVIEW REPORTOur auditors, Ernst & Young Inc. have reviewed the condensed consolidated interim financial statements. The unmodified review report is available for inspection at the Group’s registered office.
BOARD APPROVALThe condensed consolidated interim financial statements were authorised for issue by the Board of Directors of Telkom (Board) on 15 November 2013.
PREPARER AND SUPERVISOR OF ANNUAL FINANCIAL STATEMENTSThese condensed consolidated interim financial statements were prepared by Riàz Mohammed Alli: Senior Manager and supervised by Deon Fredericks: Acting Chief Financial Officer.

TELKOM SA SOC LIMITED Group Interim Results for the six months ended 30 September 2013
32
CONDENSED CONSOLIDATED INTERIM STATEMENT OF PROFIT OR LOSS AND OTHER COMPREHENSIVE INCOME
Notes
Reviewed30 September 2013
Rm
Restated* 30 September 2012
Rm
Total revenue 4 16 482 16 454
Operating revenue 16 192 16 146Payments to other operators 5.1 2 026 2 458Cost of sales 5.2 1 001 661
Net operating revenue 13 165 13 027Other income 173 164Operating expenses 10 323 12 598
Employee expenses 5.3 2 814 4 812Selling, general and administrative expenses 5.4 2 357 2 906Service fees 5.5 1 557 1 472Operating leases 5.6 504 442Depreciation, amortisation, impairment, write-offs and losses 5.7 3 091 2 966
Operating profit 3 015 593Investment income 123 149Finance charges and fair value movements (10) 282
Interest 269 342Foreign exchange gains and fair value movements (279) (60)
Profit before taxation 3 148 460Taxation 6 202 301
Profit for the period 2 946 159
Other comprehensive incomeItems that may be reclassified subsequently to profit or lossExchange differences on translating foreign operations 5 10Items that may not be reclassified subsequently to profit or lossDefined benefit plan actuarial gains 1 101 43Defined benefit plan asset ceiling limitation (245) (24)Income tax relating to components of other comprehensive income 7 (69) (5)
Other comprehensive income for the period, net of taxation 792 24
Total comprehensive income for the period 3 738 183
Profit attributable to:Owners of Telkom 2 891 91Non-controlling interests 55 68
Profit for the period 2 946 159
Total comprehensive income attributable to:Owners of Telkom 3 683 115Non-controlling interests 55 68
Total comprehensive income for the period 3 738 183
Basic and diluted earnings per share (cents) 8 566.2 17.8
* The amounts have been restated due to the adoption of IAS 19R and the amendment to IAS 16. The layout of the statement of profit or loss and other comprehensive income has been changed to provide more relevant disclosures.
for the six months ended 30 September 2013

TELKOM SA SOC LIMITED Group Interim Results for the six months ended 30 September 2013
33
CONDENSED CONSOLIDATED INTERIM STATEMENT OF FINANCIAL POSITION
Notes
Reviewed30 September 2013
Rm
Restated* 31 March 2013
Rm
ASSETSNon-current assets 30 519 30 346
Property, plant and equipment 24 876 24 881Intangible assets 2 665 2 581Other investments 2 612 2 492Deferred expenses 39 50Other financial assets 12 76 83Finance lease receivables 210 219Deferred taxation 10 41 40
Current assets 9 094 11 232
Inventories 11 832 760Income tax receivable 18 16Current portion of finance lease receivables 125 131Trade and other receivables 5 861 5 804Other financial assets 12 1 067 2 134Cash and cash equivalents 13 1 191 2 387
Total assets 39 613 41 578
EQUITY AND LIABILITIESEquity attributable to owners of the parent 21 482 17 798
Share capital 5 208 5 208Treasury shares (771) (771)Non-distributable reserves 2 311 2 164Retained earnings 14 734 11 197
Non-controlling interests 398 379
Total equity 21 880 18 177Non-current liabilities 7 403 10 271
Interest-bearing debt 15 3 841 3 899Other financial liabilities – 12Employee related provisions 16 2 323 5 153Non-employee related provisions 16 320 238Deferred revenue 903 952Deferred taxation 10 16 17
Current liabilities 10 330 13 130
Trade and other payables 5 677 4 661Shareholders for dividend 22 22Current portion of interest-bearing debt 15 493 2 758Current portion of employee related provisions 16 1 494 2 605Current portion of non-employee related provisions 16 683 786Current portion of deferred revenue 1 574 1 740Income tax payable 358 501Current portion of other financial liabilities 28 54Credit facilities utilised 13 1 3
Total liabilities 17 733 23 401
Total equity and liabilities 39 613 41 578
*The amounts have been restated due to the adoption of IAS 19R and the amendment to IAS 16.
at 30 September 2013

TELKOM SA SOC LIMITED Group Interim Results for the six months ended 30 September 2013
34
Note
Reviewed30 September 2013
Rm
Restated* 30 September 2012
Rm
Balance at 1 April 18 177 30 121
Attributable to owners of Telkom 17 798 29 707
Change in accounting policy 2.1 – (20)
Non-controlling interests 379 434
Total comprehensive income for the period 3 738 183
Profit for the period as restated 2 946 159
Other comprehensive income 792 24
Exchange differences on translating foreign operations 5 10
Net defined benefit plan asset ceiling limitation (225) (17)
Net defined benefit plan actuarial gains 1 012 31
Acquisition of subsidiaries and non-controlling interests – (2)
Dividend paid** (35) (105)
Balance at 30 September 21 880 30 197
Attributable to owners of Telkom 21 482 29 801
Non-controlling interests 398 396
*The amounts have been restated due to the adoption of IAS 19R and the amendment to IAS 16.**Dividend paid to the non-controlling interests of the Trudon Group.
CONDENSED CONSOLIDATED INTERIM STATEMENT OF CHANGES IN EQUITYfor the six months ended 30 September 2013
TELKOM SA SOC LIMITED Group Interim Results for the six months ended 30 September 2013
35
Note
Reviewed30 September 2013
Rm
Restated* 30 September 2012
Rm
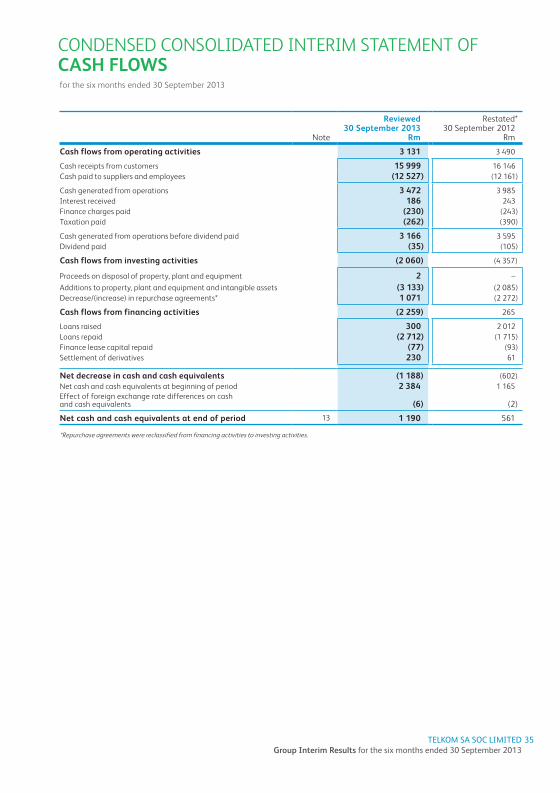
Cash flows from operating activities 3 131 3 490
Cash receipts from customers 15 999 16 146Cash paid to suppliers and employees (12 527) (12 161)
Cash generated from operations 3 472 3 985Interest received 186 243Finance charges paid (230) (243)Taxation paid (262) (390)
Cash generated from operations before dividend paid 3 166 3 595Dividend paid (35) (105)
Cash flows from investing activities (2 060) (4 357)
Proceeds on disposal of property, plant and equipment 2 –Additions to property, plant and equipment and intangible assets (3 133) (2 085)Decrease/(increase) in repurchase agreements* 1 071 (2 272)
Cash flows from financing activities (2 259) 265
Loans raised 300 2 012Loans repaid (2 712) (1 715)Finance lease capital repaid (77) (93)Settlement of derivatives 230 61
Net decrease in cash and cash equivalents (1 188) (602)Net cash and cash equivalents at beginning of period 2 384 1 165Effect of foreign exchange rate differences on cash and cash equivalents (6) (2)
Net cash and cash equivalents at end of period 13 1 190 561
*Repurchase agreements were reclassified from financing activities to investing activities.
CONDENSED CONSOLIDATED INTERIM STATEMENT OF CASH FLOWSfor the six months ended 30 September 2013

TELKOM SA SOC LIMITED Group Interim Results for the six months ended 30 September 2013
36
NOTES TO THE CONDENSED CONSOLIDATED INTERIM FINANCIAL STATEMENTS
1. CORPORATE INFORMATIONTelkom is a Company incorporated and domiciled in the Republic of South Africa whose shares are publicly traded. The main objective of Telkom, its subsidiaries, joint venture and associate (the Group) is to supply telecommunication, multimedia, technology, information and other related information technology services to Telkom’s customers, as well as mobile communication services, in South Africa and certain other African countries.
2. BASIS OF PREPARATION AND ACCOUNTING POLICIESBasis of preparationThe condensed consolidated interim financial statements have been prepared in accordance with IAS 34 Interim Financial Reporting and in compliance with the Listings Requirements of the JSE Limited and the South African Companies Act, 2008.
The condensed consolidated interim financial statements are presented in South African Rand, which is the Group’s functional currency. All financial information presented in Rand has been rounded off to the nearest million.
The condensed consolidated interim financial statements are prepared on the historical cost basis, with the exception of certain financial instruments initially (and sometimes subsequently) measured at fair value. The results of the interim period are not necessarily indicative of the results for the entire year and these reviewed financial statements should be read in conjunction with the audited financial statements for the year ended 31 March 2013.
The preparation of the condensed consolidated interim financial statements requires the use of estimates and assumptions that affect the reported amounts of assets and liabilities and disclosure of contingent assets and liabilities at the date of the financial statements and the reported amounts of revenue and expenses during the reporting periods. Although these estimates are based on management’s best knowledge of current events and actions that the Group may undertake in the future, actual results may differ from those estimates.
Significant accounting judgments, estimates and assumptionsIn preparing these condensed consolidated interim financial statements, the significant judgments made by management in applying the Group’s accounting policies and the key sources of estimation uncertainty were consistent with those applied to the consolidated financial statements for the year ended 31 March 2013 with the exception of the curtailment to the post-retirement medical aid liability.
Significant accounting policiesThe condensed consolidated interim financial statements have been prepared in accordance with the accounting policies adopted in the Group’s last annual financial statements for the year ended 31 March 2013, except for the adoption of the amendments and new standards listed below.
The accounting policies have been applied consistently throughout the Group for the purposes of preparation of these condensed consolidated interim financial statements.IAS 16 (amendment) Property, Plant and Equipment: Classification of Service EquipmentThe amendment clarifies that spare parts and servicing equipment are classified as property, plant and equipment rather than inventory when they meet the definition of property, plant and equipment. Previously the Group classified strategic spare parts which were not considered as major parts as inventory.
Following the amendment, the Group reclassified spare parts with a carrying amount of R376 million (1 April 2012: R352 million) from inventory to property, plant and equipment. The useful lives of the spare parts have been estimated to be approximately five years.
IAS 19R Employee BenefitsIAS 19R Employee Benefits prescribes a number of changes to the accounting for employee benefits. As a result of adopting the revised standard, the Group has changed its accounting policy with respect to the basis for determining the income or expense related to the Group’s defined benefit plans. These adjustments were made on a retrospective basis.
for the six months ended 30 September 2013

TELKOM SA SOC LIMITED Group Interim Results for the six months ended 30 September 2013
37
2. BASIS OF PREPARATION AND ACCOUNTING POLICIES (CONTINUED)Significant accounting policies (continued)The standard replaces the interest cost on the defined benefit obligation and the expected return on plan assets with a net interest cost based on the net defined benefit asset or liability and the discount rate, measured at the beginning of the year. This has increased profit or loss charge as the discount rate applied to assets is lower than the expected return on assets. This has no effect on total comprehensive income as the increased charge in profit or loss is offset by a credit in other comprehensive income.
In addition, unvested past service costs can no longer be deferred and recognised over the future vesting period. Instead all past service costs are recognised at the earlier of when the amendment occurs and when the Group recognises related restructuring or termination costs. Until 2013, the Group’s unvested past service costs were recognised as an expense on a straight-line basis over the average period until the benefits became vested. With the transition to IAS 19R, past service costs are recognised immediately if the benefits have vested immediately following the introduction of, or changes to, a pension plan. The effect has been that the profit or loss has increased by R104 million as at 31 March 2013 and R53 million as at 30 September 2012. The effect on the defined benefit obligation was an increase of R2 million as at 31 March 2013 and R5 million as at 30 September 2012.
2.1 IAS 19R (amendment) Employee Benefits and Strategic Inventory Impact Impact of transition to IAS 19R and IAS 16 Impact on interim condensed consolidated statement of financial position
As at 31 March 2013
Rm
As at 30 September 2012
Rm
Increase in the defined benefit obligation due to past service cost recognition (3) (5)Decrease in deferred tax liabilities – 1Increase in property, plant and equipment due to service equipment restatement 357* 352Decrease in strategic inventory due to service equipment restatement (406) (376)
Net impact (52) (28)
*Depreciated amount.
The effects on the statement of profit or loss and other comprehensive income for the year ended 31 March 2013 and for the six months ended 30 September 2012 are:
Year to 31 March 2013
Rm
Six months to 30 September 2012
Rm
Profit or loss:Increase in employee benefit expenses (144) (73)Decrease in tax expenses 40 20Increase in depreciation due to service equipment restatement (25) (13)Decrease in deferred tax liabilities 7 4
Net decrease in profit for the year (122) (62)Equity holders of the parent (122) (62)
Other comprehensive income:Increase in remeasurement movement in OCI 146 74Increase in tax effect on remeasurement movements in OCI (41) (21)
Net increase in other comprehensive income 105 53Equity holders of the parent 105 53

TELKOM SA SOC LIMITED Group Interim Results for the six months ended 30 September 2013
38
NOTES TO THE CONDENSED CONSOLIDATED INTERIM FINANCIAL STATEMENTS (CONTiNUED)
2. BASIS OF PREPARATION AND ACCOUNTING POLICIES (CONTINUED)Significant accounting policies (continued)
2.1 IAS 19R (amendment) Employee Benefits and Strategic Inventory Impact (continued)Impact of transition to IAS 19R and IAS 16 (continued)There was no material impact on the Group’s interim condensed consolidated statement of cash flows. The basic and diluted earnings per share moved from 30.2 cents as previously reported to 17.8 cents for the six months ended 30 September 2012. The headline earnings and diluted headline earnings per share moved from 37.2 cents as previously reported to 24.9 cents for the six months ended 30 September 2012.
The following new standards, amendments to standards and interpretations that have been adopted and do not have a material impact on the Group.IFRS 1 First-time Adoption of IFRS – Amendments permit the repeated application of IFRS 1, borrowing costs on certain qualifying assets (effective 1 January 2013).IFRS 1 First-time Adoption of IFRS – Amendment addresses how a first-time adoptee would account for a government loan with a below market rate of interest (effective 1 January 2013).IFRS 7 Financial Instruments Disclosures – Amendments enhancing disclosures about offsetting of financial assets and financial liabilities (effective 1 January 2013).IAS 32 Financial Instruments: Presentation – Amendments to clarify tax effect of distribution to holders of equity instruments (effective 1 January 2013).IAS 34 Interim Financial Reporting – Amendments to clarify interim financial reporting segment information for total assets and total liabilities to enhance consistency with the requirements of IFRS 8 (effective 1 January 2013).IFRIC 20 Stripping Costs in the Production Phase of a Surface Mine (effective 1 January 2013).
Standards and interpretations in issue not yet adopted and not yet effectiveThe new standards, amendments to standards and interpretations in issue have not yet been adopted and are not yet effective. All standards are effective for annual periods beginning on or after the stated effective date.
IFRS 7 Financial Instruments Disclosures – Amendments requiring disclosures about the initial application of IFRS 9 (effective 1 January 2015).IFRS 9 Financial Instruments – Classification and measurement of financial assets and financial liabilities and derecognition requirements (effective 1 January 2015).IAS 32 Financial Instruments: Presentation – Amendments to application guidance on the offsetting of financial assets and financial liabilities and the related net credit exposure (effective 1 January 2014).IAS 36 Impairment of Assets – Amendment to disclosures of the recoverable amount of impaired non-financial assets as a consequence of issuing IFRS 13 Fair Value Measurement (effective 1 January 2014).
IFRIC 21 Levies – Interpretation on the accounting for levies imposed by governments (effective 1 January 2014).
3. SEGMENT INFORMATIONThe Executive Committee manages the business on a combined basis. This reflects the financial information reviewed by the Executive Committee when making decisions about performance and resource allocation and is consistent with the manner in which the Telkom network generates revenue, ie on a combined basis. As a result, Telkom has a single operating and reporting segment. No Group geographical information is provided as the majority of the Group’s operations are carried out in South Africa. Refer to prior year’s annual report.
The Telkom segment provides fixed-line access, fixed-line usage, data communications services (through Telkom and Cybernest), mobile voice services and handset sales.
September 2013Rm
September 2012Rm
4. TOTAL REVENUE 16 482 16 454
Operating revenue 16 192 16 146Other income (excluding profit on disposal of property, plant and equipment, intangible assets, investments and profit on disposal of subsidiary) 167 159Investment income 123 149

TELKOM SA SOC LIMITED Group Interim Results for the six months ended 30 September 2013
39
4. TOTAL REVENUE (CONTINUED)Operating revenue increased due to higher mobile data revenue and higher data revenue from Cybernest partially offset by lower fixed-line voice and interconnection revenue.
Investment income decreased due to lower levels of cash available for investment.
September 2013Rm
RestatedSeptember 2012
Rm
5. EXPENSES5.1 Payments to other operators 2 026 2 458
Payments to other network operators (interconnection fees) has decreased due to the reduction in the termination rates.
5.2 Cost of sales 1 001 661The increase in the cost of sales is due to increased customer premises equipment sales.
5.3 Employee expenses* 2 814 4 812The decrease in employee expenses is mainly due to a net curtailment gain of R2.2 billion related to the post-retirement medical aid benefit that has been reduced. This was set-off with a R100 million curtailment loss from the Telkom Retirement Fund due to the closing of the voluntary severance and voluntary early retirement process as well as a lower headcount. The average salary increase and the adoption of IAS 19R adversely impacted employee expenses. Refer to note 16 with regard to the curtailment gain.
5.4 Selling, general and administrative expenses 2 357 2 906Selling, general and administrative expenses decreased mainly due to the provision for the Competition Commission fine in 2012.Included in selling, general and administrative expenses is write-down of inventories to the value of R11 million (2012: R17 million).
5.5 Service fees 1 557 1 472Increases in service fees are due to the cost incurred on the transformation programme of the Company.
5.6 Operating leases 504 442Operating leases increased as a result of an increase in the number of mobile sites acquired and an increase in building leases.
5.7 Depreciation, amortisation, impairment, write-offs and losses 3 091 2 966
Depreciation of property, plant and equipment 2 309 2 474Amortisation of intangible assets 333 436Impairment of property, plant and equipment and intangible assets 392 –Write-offs of property, plant and equipment and intangible assets 57 56
Depreciation and amortisation decreased as a result of a lower asset base after a R12 billion impairment of assets in March 2013, partially offset by accelerated depreciation emanating from the review of the useful lives of drop wires installed at customer premises. Impairment and write-offs increased significantly due to the decision to impair property, plant and equipment that was reclassified from inventories following a change in accounting policy.*Restated due to the adoption of IAS 19R.

TELKOM SA SOC LIMITED Group Interim Results for the six months ended 30 September 2013
40
NOTES TO THE CONDENSED CONSOLIDATED INTERIM FINANCIAL STATEMENTS (CONTiNUED)
September 2013Rm
RestatedSeptember 2012
Rm
6. TAXATION 202 301
South African normal company taxation 273 470Deferred taxation (refer to note 10)* (71) (169)
The tax expense is lower as a result of lower taxable income mainly as a result of the realisation of employee related provisions raised at March 2013.
7. TAXATION EFFECTS OF OTHER COMPREHENSIVE INCOMETax effects relating to each component of other comprehensive incomeExchange differences on translating foreign operations 5 10Net foreign currency translation differences for foreign operations 5 10Defined benefit plan actuarial gains* 1 101 43Tax effect of defined benefit plan actuarial gains* (89) (12)Net defined benefit plan actuarial gains 1 012 31Defined benefit plan asset ceiling limitation (245) (24)Tax effect of defined benefit plan asset ceiling limitation 20 7Net defined benefit plan asset ceiling limitation (225) (17)Other comprehensive income for the year before taxation 861 29Tax effect of other comprehensive income for the year (69) (5)Other comprehensive income for the year, net of taxation 792 24*Restated due to the adoption of IAS 19R.

TELKOM SA SOC LIMITED Group Interim Results for the six months ended 30 September 2013
41
September 2013Rm
Restated*September 2012
Rm
8. EARNINGS PER SHARETotal operationsBasic and diluted earnings per share (cents) 566.2 17.8Headline earnings and diluted headline earnings per share (cents) 649.8 24.9Reconciliation of weighted average number of ordinary shares:Ordinary shares in issue 520 783 900 520 783 900Weighted average number of treasury shares (10 190 084) (10 190 084)
Weighted average number of shares outstanding 510 593 816 510 593 816
Reconciliation of diluted weighted average number of ordinary shares
Diluted weighted average number of shares outstanding 510 593 816 510 593 816
Total operationsReconciliation between earnings and headline earnings:Profit attributable to equity holders of Telkom 2 891 91Adjustments:Profit on disposal of property, plant and equipment and intangible assets (7) (5)Impairment loss on property, plant and equipment and intangible assets 392 –Write-offs of property, plant and equipment and intangible assets 57 56Taxation effects (15) (15)
Headline earnings 3 318 127
*The amounts have been restated due to the adoption of IAS 19R and the amendment to IAS 16.
September 2013Rm
March 2013Rm
9. CAPITAL ADDITIONS AND DISPOSALSProperty, plant and equipment 2 967 4 755
Additions 2 972 4 777Disposals (5) (22)
Intangible assets 201 960
Additions 201 961Disposals – (1)
The capital expenditure for the six months was largely due to the deployment of the Next Generation Network, mobile cellular services and baseline technologies.

TELKOM SA SOC LIMITED Group Interim Results for the six months ended 30 September 2013
42
NOTES TO THE CONDENSED CONSOLIDATED INTERIM FINANCIAL STATEMENTS (CONTiNUED)
September 2013Rm
RestatedMarch 2013
Rm
10. DEFERRED TAXATION 25 23
Deferred taxation assets 41 40Deferred taxation liabilities (16) (17)
Deferred tax assets are recognised for deductible temporary differences to the extent of the related tax benefit through future taxable profits is probable. The Group did not recognise deferred tax assets of R2 242 million (31 March 2013: R3 200 million) in respect of temporary differences amounting to R8 007 million (31 March 2013: R11 300 million) that can be carried forward against future taxable income.
11. INVENTORIES 832 760
Gross inventories 953 1 067Write-down of inventories to net realisable value (121) (307)
March 2013 has been restated due to the adoption of the amended IAS 16. Maintenance spares were reclassified to property, plant and equipment. Refer to note 2.
Decrease in inventory is mainly due to network equipment partly offset by an increase in installation and maintenance and merchandise stock.
The write-down of inventory is mainly due to the provision for technology obsolescence and slow-moving stock.
12. OTHER FINANCIAL ASSETSOther financial assets consist of: 76 83
Total other financial assets 1 143 2 217
Held-to-maturity– Repurchase agreements 910 1 980
At fair value through profit or loss– Derivative instruments 233 237
Forward exchange contracts 112 132Cross currency swaps 121 105
Less: Current portion of other financial assets 1 067 2 134
Held-to-maturity– Repurchase agreements 910 1 980
At fair value through profit or loss– Derivative instruments 157 154
Forward exchange contracts 112 132Cross currency swaps 45 22
Repurchase agreementsThe Group manages a portfolio of repurchase agreements, with a view to generating additional investment income on the favourable interest rates and security provided on these instruments. They are short term, usually seven days and are held to maturity.

TELKOM SA SOC LIMITED Group Interim Results for the six months ended 30 September 2013
43
September 2013Rm
March 2013Rm
13. NET CASH AND CASH EQUIVALENTSCash disclosed as current assets 1 191 2 387
Cash and bank balances 268 234Short-term deposits 923 2 153
Credit facilities utilised (1) (3)
Net cash and cash equivalents 1 190 2 384
The decrease in cash and cash equivalents is mainly due to the repayment of the syndicated loan of R2 billion. This was partly off-set by an inflow of R1 billion from repurchase agreements.
14. FINANCIAL RISK MANAGEMENTExposure to continuously changing market conditions has made management of financial risk critical for the Group. Treasury policies, risk limits and control procedures are continuously monitored by the Board of Directors through its Audit Committee.
The condensed consolidated interim financial statements do not include all financial risk management information and disclosures required in the annual financial statements, and should be read in conjunction with the Group’s annual financial statements as at 31 March 2013.
14.1 Liquidity riskLiquidity risk is the risk that the Group will not be able to meet its financial obligations as they fall due. The Group is exposed to liquidity risk as a result of uncertain cash flows as well as capital commitments of the Group.
Liquidity risk is managed by the Group’s Treasury team in accordance with policies and guidelines formulated by the Group’s Executive Committee. In terms of its borrowing requirements the Group ensures that sufficient facilities exist to meet its immediate obligations.
Compared to the 2013 financial year-end, there was no material change in the contractual undiscounted cash out flows for financial liabilities.
14.2 Fair value of financial instrumentsThe carrying amount of financial instruments approximate fair value, with the exception of interest-bearing debt (at amortised cost), which has a fair value of R5 148 million (31 March 2013: R7 661 million) and a carrying amount of R4 334 million (31 March 2013: R6 657 million) (refer to note 15).
Type of financial instrumentFair value at
30 September 2013 Valuation technique Significant inputs
Receivables, bank balances, repurchase agreements, and other liquid funds, payables and accruals, credit facilities utilised and shareholders for dividends
R4 468 million Undiscounted future estimated cash flows due to short-term maturities of these instruments
Probability of default
Derivatives R205 million Discounted cash flows Yield curves, market interest rate and market foreign exchange rate
Borrowings R5 148 million Discounted cash flows Market interest rate
The estimated net fair values as at the reporting date, have been determined using available market information and appropriate valuation methodologies as outlined below. This value is not necessarily indicative of the amounts that the Group could realise in the normal course of business.

TELKOM SA SOC LIMITED Group Interim Results for the six months ended 30 September 2013
44
NOTES TO THE CONDENSED CONSOLIDATED INTERIM FINANCIAL STATEMENTS (CONTiNUED)
14. FINANCIAL RISK MANAGEMENT (CONTINUED)14.2 Fair value of financial instruments (continued)
Derivatives are recognised at fair value. The fair values of derivatives are determined using quoted prices or, where such prices are not available, a discounted cash flow analysis is used. These amounts reflect the approximate values of the net derivative position at the reporting date. The fair values of listed investments are based on quoted market prices.
The fair values of the borrowings disclosed above are based on quoted prices or, where such prices are not available, the expected future payments discounted at market interest rates. As a result they differ from carrying values.
The fair value of receivables, bank balances, repurchase agreements and other liquid funds, payables and accruals, approximate their carrying amount due to the short-term maturities of these instruments.
14.3 Fair value hierarchyThe table below analyses financial instruments carried at fair value, by valuation method.
The different levels have been defined as follows:(a) Quoted prices in active markets for identical assets or liabilities (level 1).(b) Inputs other than quoted prices, that are observable for the asset or liability (level 2).(c) Inputs for the asset or liability that are not based on observable market data (level 3).
The following tables presents the fair value of the Group’s assets and liabilities:
30 September 2013Total
RmLevel 1
RmLevel 2
RmLevel 3
Rm
Assets measured at fair valueForward exchange contracts 112 – 112 –Investment in preference shares 2 607 2 607 – –Cross currency swaps 121 – 121 –
Liabilities measured at fair valueInterest rate swaps (5) – (5) –Forward exchange contracts (23) – (23) –
Liabilities measured at amortised costInterest-bearing debt (5 148) (3 752) (1 396) –
31 March 2013Total
RmLevel 1
RmLevel 2
RmLevel 3
RmAssets measured at fair value
Forward exchange contracts 132 – 132 –Investment in preference shares 2 490 589 1 901 –Transfer to level 1* – 1 901 (1 901)Cross currency swaps 105 – 105 –
Liabilities measured at fair valueInterest rate swaps (51) – (51) –Forward exchange contracts (15) – (15) –
Liabilities measured at amortised costInterest-bearing debt (7 661) (3 882) (3 779) –
The fair value of the financial assets and financial liabilities are sensitive to exchange rates and interest rates movements. The Rand depreciated against major currencies during the period resulting in unrealised fair value gains. The volatility of the exchange rates also had an impact on the fair values of these instruments.* During the year ended 31 March 2013, the Investment in Cell Captive’s Coronation Absolute Portfolio with a market value of R1 901 million was transferred from fair value level 2 to fair value level 1. The reason for transfer is that the prices for each of the assets held in the absolute portfolio was obtained from recognised market sources.

TELKOM SA SOC LIMITED Group Interim Results for the six months ended 30 September 2013
45
September 2013Rm
RestatedMarch 2013
Rm
15. INTEREST-BEARING DEBTNon-current interest-bearing debt 3 841 3 899Local debt 2 770 2 730Foreign debt 396 456Finance leases 675 713Current portion of interest-bearing debt 493 2 758Local debt 200 2 494Foreign debt 224 207Finance leases 69 57Repayments/refinancingThe Company repaid the syndicated loan of R2 billion out of available cash during the reporting period.
The current portion of interest-bearing debt of R424 million (nominal) as at 30 September 2013 is expected to be repaid from available operational cash flow and/or the issue of new debt instruments.
Management believes that sufficient funding facilities will be available at the date of repayment/refinancing.
16. PROVISIONSNon-current portion of provisions 2 643 5 391Employee related 2 323 5 153Non-employee related 320 238Current portion of provisions 2 177 3 391
Employee related 1 494 2 605Non-employee related 683 786The decrease in non-current employee related provisions is mainly due to the effect of the net curtailment gain of R2.2 billion recognised on the post-retirement medical aid benefit. Telkom allowed eligible employees the option to transfer their post-retirement medical aid benefit to Liberty Life. The Company curtailed the medical cap increase to 0% for active members due to rising operational costs and affordability. Of the 9 302 eligible employees, 7 549 employees exercised their option to transfer their benefit to Liberty Life.
The increase in the non-employee related portion is attributable to the provision for certain legal matters.
The reduction of the current portion of employee related provisions is attributable to the post-retirement medical aid curtailment and bonus provision due to lower headcount.
Refer to note 2 for the impact of the adoption of IAS 19R.
17. COMMITMENTSCapital commitments authorised 3 470 7 542
Commitments against authorised capital expenditure 2 008 2 855Authorised capital expenditure not yet contracted 1 462 4 687
Capital commitments are largely attributable to purchases of property, plant and equipment and software (included in intangible assets).
Management expects these commitments to be financed from internally generated cash and borrowings.

TELKOM SA SOC LIMITED Group Interim Results for the six months ended 30 September 2013
46
NOTES TO THE CONDENSED CONSOLIDATED INTERIM FINANCIAL STATEMENTS (CONTiNUED)
18. CONTINGENCIES Contingent liabilitiesCompetition mattersTelkom was a party to a number of legal proceedings filed by several parties with the South African Competition Commission (CC) alleging anti-competitive practices described below. Some of the complaints filed at the CC have been referred by the CC to the Competition Tribunal (CT) for adjudication.
Should the CT find that Telkom committed a prohibited practice as set out in the Competition Act for each of the cases, the CT may impose a maximum administrative penalty of 10% of Telkom’s annual turnover in the Republic of South Africa and its exports from the Republic of South Africa during Telkom’s preceding financial year. However, Telkom has been advised by external legal counsel that the CT has to date not imposed the maximum penalty on any offender in respect of the contraventions it is being accused of.
SAVA/OMNILINKThis matter was settled on the basis that Telkom must pay the fine that was originally awarded by the Tribunal in the sum of R449 million. Telkom paid 50% of the fine on 12 October 2013 and will pay the balance on 12 October 2014.
CC Multiple Complaints ReferralTelkom and the CC signed a settlement agreement on 14 June 2013, in settlement of the Multiple Complaints Referral. In terms of this settlement agreement, Telkom admitted that its conduct during the complaint period amounted to a contravention of sections 8(c) (margin squeeze) and 8(d)(iii) (bundling and tying) of the Competition Act. The settlement agreement was confirmed by the CT on 18 July 2013 and made an order of the CT. In terms of the aforementioned settlement agreement, Telkom agreed to pay an administrative penalty of R200 000 000, payable in three instalments. The first instalment of R66 666 666 was paid on 16 August 2013. The second instalment in the same amount is payable during July 2014 and the last instalment of R66 666 668 is payable during July 2015. Telkom furthermore committed to certain price reductions in the 2014, 2015 and 2016 financial years as well as to certain behavioural remedies.
Matters before ICASAPhutuma Networks (Proprietary) Limited (Phutuma)Phutuma filed a complaint against Telkom at the Complaints and Compliance Committee of ICASA (CCC) in February 2010. At the hearing during February 2013, Phutuma applied for a postponement and the matter was postponed for hearing in August 2013. However, the matter was not finalised during this hearing due to, amongst other things, new allegations raised by Phutuma which, Telkom argued, did not form part of the complaint as currently constituted before the CCC. No evidence was led regarding the merits of the claim. The matter was postponed again to January 2014 in order to hear argument regarding the admissibility of evidence Phutuma intends to introduce. The matter was further postponed to May 2014 for the main hearing.
Supplier disputeRadio Surveillance Security Services (Proprietary) Limited (RSSS)During September 2011, RSSS served two summons on Telkom for the sum of R215 million and R9 million (including VAT) respectively. Both summons were withdrawn in November 2011 but reissued in December 2011. The smaller claim of R9 million was settled. The claim for R215 million is being defended. RSSS has alleged that Telkom is indebted to it for the rendering and upgrading of 440 alarm systems previously purchased by Telkom, to be M3010 compliant.
Telkom’s exception application was set down in August 2013 for hearing but was postponed at the instance of RSSS with costs awarded to Telkom. The exception hearing was again set down for hearing on 11 November 2013. RSSS served a notice to amend its summons, to which Telkom objected, whereupon a second notice to amend was filed. Telkom’s exception application was adjourned at the request of RSSS, with an associated cost order against RSSS.
High CourtPhutuma Networks (Proprietary) Limited (Phutuma)In August 2009 Phutuma served a summons on Telkom, claiming for damages arising from a tender published by Telkom in November 2007 for the outsourcing of the Telex and Gentex services and for the provision of a solution to support the maritime industry requirements. The tender was cancelled in June 2009, without any award being made, due to the expiration of the validity period of the tender. Phutuma alleged that Telkom awarded the tender to a third party outside a fair, transparent and cost-effective procurement process and claimed damages of R3 730 433 545, alternatively R5 513 876 290, and further alternatively R1 771 683 580 plus interest at 15.5% per annum to date of payment from April 2008, alternatively from 30 April 2009 being the date of notice in terms of Act 40 of 2002, further alternatively from date of service of this summons plus legal costs.

TELKOM SA SOC LIMITED Group Interim Results for the six months ended 30 September 2013
47
18. CONTINGENCIES (CONTINGENT LIABILITIES) (CONTINUED)Contingent liabilities (continued)High Court (continued)Phutuma Networks (Proprietary) Limited (Phutuma) (continued)The trial was re-enrolled for hearing in May 2013. On 22 May 2013 the court refused Phutuma’s application for a postponement of the trial. The court also granted absolution from the instance plus costs since Phutuma could not establish the facts in support of its case to the satisfaction of the court. Phutuma has filed a notice of appeal against the judgment. No date for leave to appeal has been assigned by the High Court.
African Pre-paid Services Nigeria Limited (APSN) vs Multi-Links (MLT): Arbitration matterIn December 2008 MLT, a former Telkom subsidiary concluded a Super Dealer Agreement (SDA) with African Prepaid Services (APS). In May 2009, APS ceded and assigned all of its rights and obligations under the agreement to APSN. On 13 June 2011, APSN launched arbitration proceedings in South Africa against MLT claiming damages (9 claims) in a sum of USD481 milllion arising from an alleged repudiation of the SDA by MLT. The claim was later reduced to USD457 million. The matter is defended by MLT, which also filed a counterclaim for USD123 million. In terms of an indemnity clause under the Share Purchase Agreement with Hip Oils, Telkom is liable for all amounts in excess of USD10 million in respect of the claim between APSN and MLT.
The arbitration was set down for hearing in November 2012, which was adjourned to enable MLT to file a special plea regarding certain alleged irregularities pertaining to the negotiations and the conclusion of the SDA. In August 2013, MLT successfully applied to the High Court to set aside the arbitation proceedings pending the outcome of the damages action of Telkom and MLT against Blue Label Telecoms and others.
OtherHip Oils Topco Limited (Hip Oils)With the sale of Telkom’s shares in Multi-Links to HIP Oils, Telkom provided a taxation indemnity and a creditors indemnity to HIP Oils and Multi-Links where such liability or obligation was incurred prior to 3 October 2011 and to the extent that such liability was not disclosed or exceed the amounts set out in Schedule 4 (creditors list) to the Sale and Purchase Agreement. Discussions are underway with the Nigerian tax authorities. Telkom is also in discussions with Multi-Links/Hip Oils regarding contributions towards the creditors claims.
Contingent assetsFormer Senior Executive of TelkomTelkom has issued a summons against a former senior executive of Telkom in April 2013, claiming an amount of USD6 million, for damages suffered as a result of certain irregularities. Telkom paid USD1 million to a third party due to the defendant, acting outside his authority and also USD5 million ultra vires, by binding Telkom jointly and severally under a financial guarantee for the obligations of Multi-Links (a previous subsidiary of Telkom) and also suffered damages of USD5 million due to the defendant’s conduct.
Blue Label Telecoms Limited and five othersOn 17 May 2013, Telkom and MLT issued a summons against Blue Label Telecoms Limited, APSN and four other defendants, for damages of USD528 million arising out of a Super Dealer Agreement (SDA) concluded between APS (a subsidiary of Blue Label) and MLT. MLT also filed a damages claim for several millions US Dollars. The matter is defended. In August 2013, Telkom and MLT successfully opposed a High Court application by APSN that the North Gauteng High Court had no jurisdiction over it. In November 2013, APSN filed its plea and a counterclaim against MLT for damages in the sum of USD457 million based on various claims and a claim against Telkom for damages in the sum of USD451 million or so much of it as APSN does not recover from Multi-Links arising from Telkom’s alleged interference with the contractual relationship between Multi-Links and APSN. Telkom and MLT is in the process of finalising their pleas.
ArbitrationBLS Telecom LLC (BLS)In October 2008, Telkom concluded a traffic termination agreement with BLS (a USA company), which made provision inter alia for the resolution of disputes by means of arbitration in South Africa. BLS disputed liability for payment of various amounts owing to Telkom in terms of the agreement. In 2011, Telkom served a Statement of Claim on BLS for payment of USD38 million in relation to services rendered in terms of the agreement. BLS is defending the matter and has also filed a counterclaim of USD18 million for a telecommunications network allegedly supplied to MLT and switchboxes allegedly supplied to both Telkom and MLT. The matter is ongoing.
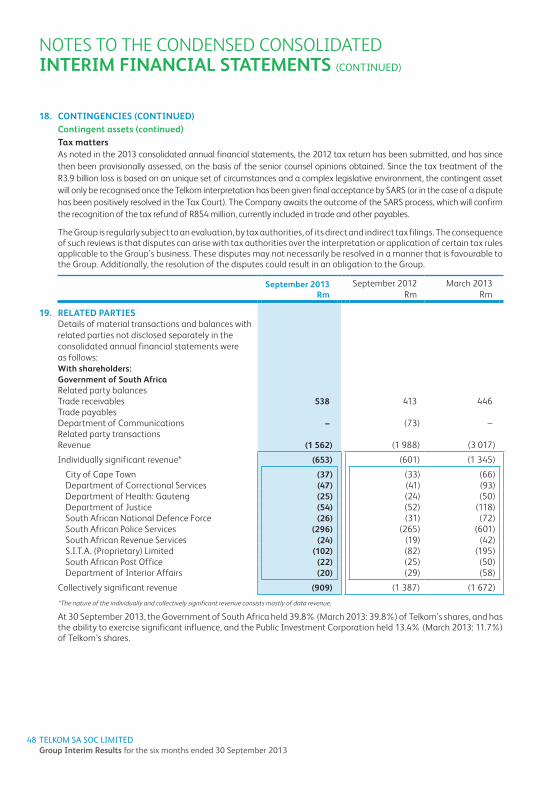
TELKOM SA SOC LIMITED Group Interim Results for the six months ended 30 September 2013
48
NOTES TO THE CONDENSED CONSOLIDATED INTERIM FINANCIAL STATEMENTS (CONTiNUED)
18. CONTINGENCIES (CONTINUED)Contingent assets (continued)Tax mattersAs noted in the 2013 consolidated annual financial statements, the 2012 tax return has been submitted, and has since then been provisionally assessed, on the basis of the senior counsel opinions obtained. Since the tax treatment of the R3.9 billion loss is based on an unique set of circumstances and a complex legislative environment, the contingent asset will only be recognised once the Telkom interpretation has been given final acceptance by SARS (or in the case of a dispute has been positively resolved in the Tax Court). The Company awaits the outcome of the SARS process, which will confirm the recognition of the tax refund of R854 million, currently included in trade and other payables.
The Group is regularly subject to an evaluation, by tax authorities, of its direct and indirect tax filings. The consequence of such reviews is that disputes can arise with tax authorities over the interpretation or application of certain tax rules applicable to the Group’s business. These disputes may not necessarily be resolved in a manner that is favourable to the Group. Additionally, the resolution of the disputes could result in an obligation to the Group.
September 2013Rm
September 2012Rm
March 2013Rm
19. RELATED PARTIESDetails of material transactions and balances with related parties not disclosed separately in the consolidated annual financial statements were as follows:With shareholders:Government of South AfricaRelated party balancesTrade receivables 538 413 446Trade payablesDepartment of Communications – (73) –Related party transactionsRevenue (1 562) (1 988) (3 017)
Individually significant revenue* (653) (601) (1 345)
City of Cape Town (37) (33) (66)Department of Correctional Services (47) (41) (93)Department of Health: Gauteng (25) (24) (50)Department of Justice (54) (52) (118)South African National Defence Force (26) (31) (72)South African Police Services (296) (265) (601)South African Revenue Services (24) (19) (42)S.I.T.A. (Proprietary) Limited (102) (82) (195)South African Post Office (22) (25) (50)Department of Interior Affairs (20) (29) (58)
Collectively significant revenue (909) (1 387) (1 672)
* The nature of the individually and collectively significant revenue consists mostly of data revenue.
At 30 September 2013, the Government of South Africa held 39.8% (March 2013: 39.8%) of Telkom’s shares, and has the ability to exercise significant influence, and the Public Investment Corporation held 13.4% (March 2013: 11.7%) of Telkom’s shares.

TELKOM SA SOC LIMITED Group Interim Results for the six months ended 30 September 2013
49
September 2013Rm
September 2012Rm
March 2013Rm
19. RELATED PARTIES (CONTINUED)With entities under common control:Major public entitiesRelated party balancesTrade receivables 36 17 48Trade payables 2 – –Related party transactionsRevenue (136) (157) (260)Expenses 113 126 237
Individually significant expenses 106 119 223
South African Post Office 47 48 96Eskom 59 71 127
Collectively significant expenses 7 7 14
Rent received (23) (13) (43)
Individually significant rent received: South African Post Office (21) (11) (39)Collectively significant rent received (2) (2) (4)
Rent paid 14 13 26
Individually significant rent paid: South African Post Office 9 9 17Collectively significant rent paid 5 4 9
Key management personnel compensation:(Including directors and prescribed officers’ emoluments)Related party transactionsShort-term employee benefits 70 97 189Post-employment benefits 5 5 10Termination benefits 2 16 24
Loan to Group Chief Financial OfficerTelkom SA (SOC) Limited provided a loan of R5 997 775.43 to Mr Jacques Schindehutte to assist him to acquire shares in Telkom. Interest on the loan is calculated at 0% per annum. The loan is repayable on termination of employment contract by any of the following reasons: retirement, resignation, dismissal, abscondment or medical disability. In the event of these reasons materialising the loan shall bear interest at the prime rate plus 2% per annum, calculated from the date of demand to the actual repayment, compounded monthly in arrears. As security for the executive’s obligation to Telkom pursuant to the loan agreement, the executive will pledge and cede in securitatem debiti to Telkom all the shares in Telkom that are acquired through the use of the loan facility (the Pledged Security) until the full and irrevocable discharge of the loan, the executive shall not sell or otherwise dispose of the Pledged Security or any interest therein. The Pledged Security shall be delivered to and held by the escrow agent contemplated in the rules of the Employee FSP until the repayment in full of the loan and any interest.
Telkom’s management has recognised that the loan made to such executive may not have been in compliance with the provisions of the Companies Act and will, as a matter of urgency, take the matter under advisement from its advisers for rectification and/or recovery of the amount, should that be necessary. The Board resolutions in respect of the loans to be granted are to be tabled for consideration/approval to the Board at its first meeting after the Annual General Meeting, scheduled for 15 November 2013.
Terms and conditions of transactions with related partiesOutstanding balances at the year-end are unsecured, interest free and settlement occurs in cash. There have been no guarantees provided or received for related party receivables or payables.

TELKOM SA SOC LIMITED Group Interim Results for the six months ended 30 September 2013
50
NOTES TO THE CONDENSED CONSOLIDATED INTERIM FINANCIAL STATEMENTS (CONTiNUED)
20. SIGNIFICANT EVENTSResults of the Telkom annual general meeting regarding directors reappointmentsAll Board members were re-elected as per the annual general meeting ordinary resolutions with the exception of Mr J Molobela who withdrew his nomination to be re-elected as director with effect from 27 September 2013. Mr B du Plessis did not stand for re-election for the Board.
Suspension of Chief Financial OfficerShareholders are advised that Mr Jacques Schindehütte, the Chief Financial Officer of Telkom has been suspended by the Board effective 24 October 2013, pending a disciplinary process. The suspension follows the findings of an investigation commissioned by the Board after certain allegations were made against Mr Schindehütte.
The Board has a duty to investigate and to test the validity of allegations, which are brought to its attention through an appropriate process, and will do this fairly, without favour or prejudice.
Mr Deon Fredericks has been acting as Chief Financial Officer of Telkom with effect from 24 October 2013 and will fulfil this role until such time as the disciplinary process against Mr Schindehütte is concluded.
Employee Forfeitable Share Plan (Employee FSP)A new forfeitable share plan was approved at the Annual General Meeting per special resolution where no more than 5% of Telkom’s amount of issued shares will be allocated to employees.
Post-retirement medical aid curtailmentTelkom announced during August 2013 that eligible employees have the option to transfer their post-retirement medical aid benefit to Liberty Life. The Company curtailed the medical cap increase to 0% as from 1 October 2013 for active members due to revenue remaining under pressure, rising operational costs and affordability. Of the 9 302 eligible employees 7 549 employees exercised their option to transfer their benefit to Liberty Life on 11 October 2013. The approximate net curtailment gain recognised is R2.2 billion.
21. SUBSEQUENT EVENTSAppointment of Chief Information OfficerTelkom announced on 21 October 2013 that Mr L De Villiers has been appointed as Chief Information Officer with effect from 1 November 2013.
Fair value hedge accountingThe Group implemented hedge accounting for foreign currency risk hedging instruments from 1 October 2013 in an attempt to mitigate earnings volatility and better reflect the underlying economics of hedges.
Other mattersThe directors are not aware of any other matter or circumstance since the financial period ended 30 September 2013 and the date of this report, or otherwise dealt with in the financial statements, which significantly affects the financial position of the Group and the results of its operations.

8 9 8

www.telkom.co.za