tees valley economic assessment 2019
TRANSCRIPT

1

2
CONTENTS
Section 1: Introduction 3
Section 2: Executive Summary 4
Section 3: Area Profile 10
Section 4: Economic Growth and Productivity 24
Section 5: Business Growth 41
Section 6: Research & Development, Innovation and Energy 52
Section 7: Education, Employment and Skills 61
Section 8: Transport & Digital Infrastructure 103
Section 9: Place and Culture 114
Section 10: Performance Gaps and Baselines 135
Bibliography 139

3
Section 1: Introduction
The Tees Valley Economic Assessment is the core statistical document related to economic development in Tees Valley. It is based upon data and analysis for key areas that contribute towards growth in our economy including: o Economy and Productivity (economic conditions, innovation activity, the business base and
key sectors);
o Skills and Labour Market (attainment, employment and future demand); and
o Growth Enablers (connectivity, education, place and culture).
The Economic Assessment is updated annually. It reflects the priorities in the Tees Valley Strategic Economic Plan and the draft Local Industrial Strategy for Tees Valley (agreed by Cabinet in July 2019). The Economic Assessment provides an evidence base that underpins the Tees Valley Investment Plan, supporting the development of business cases, as well as helping to inform local authority assessments, Local Plans and other policy and strategy documents. In 2020, it is also intended that updated analysis will underpin the joint agreement with Government of a Local Industrial Strategy for Tees Valley. Data is presented for Tees Valley wherever possible and where appropriate includes analysis at Local Authority level. When available, performance is benchmarked against the North of England and nationally.

4
Section 2: Executive Summary
2.1 . Economic Overview
Headline metrics for Tees Valley:
• Total population in 2018 = 674,300
• Working age (16-64) population in 2018 = 414,400
• Economically active population aged 16-64 in 12 months to June 2019 = 302,900
• Economically inactive population aged 16-64 in 12 months to June 2019 = 106,700
• Employment (employed residents aged 16-64) in 12 months to June 2019 = 281,100
• Jobs (people employed within Tees Valley) in 12 months to June 2019 = 283,300
• Number of businesses in 2019 = 17,765. 87.8% of Tees Valley firms are micro-businesses
(under 10 employees) and 0.5% of firms are large companies (250+ employees)
• Economic output / Gross Domestic Product (GDP) in 2018 = £16.2bn
• Productivity in 2018 = £31.8 per hour
• In 2018, 125,700 or 30.6% of residents aged 16-64 were qualified to NVQ Level 4 (degree
level) or above
Tees Valley covers over 300 square miles. It is located on the North East coast, and comprises the
five Local Authority areas of Darlington, Hartlepool, Middlesbrough, Redcar & Cleveland and
Stockton-on-Tees. It is highly urbanised, with 98% of the population living in built-up areas of which
90% can be classed as ‘urban’.
The Tees Valley economy has well established strengths in Chemical & Process, Energy and
Advanced Manufacturing. There are also emerging strengths in Digital, Business & Professional
Services and the Logistics sector, which are playing an increasing role in the region’s economy.
These priority sectors are supported by several key assets in the region, including:
• Cost effective sites and premises, with significant opportunities for development at the
4,500 acre South Tees Development site, and further potential at the region’s seven
Enterprise Zones.
• Teesside University – an internationally recognised university in terms of working with
business. The University was the winner of the Improving the Business Environment
category in the 2018 Enterprising Britain Awards.
• National centres of excellence including the Centre for Process Innovation (CPI) and National
Horizons Centre (specialising in training for UK bioscience), the Materials Processing Institute
(MPI) and TWI.
• A major East Coast rail hub at Darlington providing fast north-south connections across the
country.
• An International Airport and The Port of Tees and Hartlepool - the largest port in England in
terms of outwards traffic tonnage, providing a critical gateway to world markets for the Tees
Valley industrial platform.
The Tees Valley labour market and wider economy suffered a difficult 2016 following the closure of
the SSI steelworks in 2015, resulting in around 4,000 job losses at SSI and across associated suppliers
and contractors. Whilst the local economy stabilised in 2017, 2018 was another difficult year with
Brexit uncertainty impacting negatively on business investment. Tees Valley Gross Domestic Product
(GDP) was 3.5% lower in 2018 than it was in 2015. The area’s relative economic performance

5
remains well below national levels and rates and the region experiences some persistent economic
challenges.
Key economic messages for the Tees Valley include:
• Labour demand issues, including the relative lack of Tees Valley jobs. Additionally, Tees
Valley has consistently recorded some of the highest economic inactivity and unemployment
rates in the country. However, economic output per job is close to national averages and
above the North of England average, demonstrating that there are well paid and productive
jobs in the region with the opportunity for further growth.
• Tees Valley has significant sectoral strength and relatively high employment in higher
productivity sectors such as Chemical & Process, Clean Energy, Low Carbon & Hydrogen and
Advanced Manufacturing. Construction sub-sectors including civil engineering and
specialised construction are also well represented.
• The area has a relatively aged population profile and, as with many other areas, an ageing
population. There has been slow population growth over recent years, below national
increases, along with significant out migration of working age people. Future projections
suggest that labour supply constraints will increase, which could result in the potential for
there to be a lack of local workers in the future. However, there remains significant scope
for mitigating the majority of this potential constraint by addressing the area’s particularly
high rates of economic inactivity and unemployment.
• A key constraint on the Tees Valley economy is the relatively small size of its private sector,
reflected by its low business density at less than two-thirds the size of the UK average. If the
Tees Valley public sector broadly mirrors national public sector trends the Tees Valley
private sector growth must significantly out-perform UK private sector growth just to keep
up with aggregate UK GDP or GVA growth rates. However, with local private sector business
growth metrics typically running at or a little below national rates, the Tees Valley economy
was 3.5% smaller in 2018 than in 2015.
• The Tees Valley is home to the single biggest development opportunity in the UK in the form
of the South Tees Development Corporation. This significant opportunity means that Tees
Valley’s private sector business and economic growth potential is amongst the greatest in
the country.

6
2.2 . Key metrics
The following bullet points highlight some of the key metrics underpinning the above key messages.
Chart 10.1 in Section 10 shows how a number of these metrics translate in terms of gap to reach
national performance rates.
• Economic output across Tees Valley, measured in terms of Gross Domestic Product or GDP, stood at £16.2bn in 2018. Tees Valley GDP per capita was £24,085 or 75.3% of the UK rate. However, the Tees Valley’s high levels of economic inactivity provide significant scope for increasing GDP per capita greatly. Any paid work undertaken by those residents previously economically inactive will increase GDP per capita.
• Productivity – GVA per hour worked – was £31.8 in 2018, third highest of all North of England LEPs and at 90.9% of the UK rate, far closer to the national average than the GVA per capita measure (71.5% of UK rate). The GVA per hour worked indicator is the best measure of an economy’s underlying productivity and removes employment rate, economic inactivity, demographic, and commuting considerations that are present within GVA per capita. This again highlights that whilst Tees Valley has relatively low numbers of jobs, the jobs it does have are amongst the most productive anywhere in the North of England.
• Enterprise – the number of business enterprises located in Tees Valley – stood at 17,765 in 2019. This total represents 64.8% of the UK rate for enterprises per resident adults aged 16+. The number of business enterprises increased by 1,265 between 2015 and 2019. However, this rate of growth was a little slower than for the UK resulting in Tees Valley business density falling from 65.5% of the national rate in 2015. Business density remains a key challenge for Tees Valley going forwards. However, with historical sectoral strength in those sectors where fewer but larger firms tended to predominate e.g. traditional heavy industry, the ongoing diversification of the economy can only help to close the present enterprise gap.
• Throughout the past three years, the Tees Valley employment rate has been broadly matching its pre-recession highs observed during the mid-2000s. However, with 281,100 Tees Valley residents aged 16 to 64 in employment in the year to June 2019, the Tees Valley employment rate of 68.6% remains significantly below the UK rate of 75.5%. This difference in employment rates translates to an employment gap of 27,900.
• Local demand for highly skilled workers remains robust and there is currently high job demand for teachers, carers, nurses, engineers, IT professionals, and teaching/nursery assistants. In 2019, there were close on 2,500 job vacancies in each of the broad professional occupation groups of Teaching & Education Professionals; Science, Research, Engineering & Technology Professionals and Health Professionals. Similarly, Caring Personal Service occupations recorded around 2,500 vacancies across Tees Valley.
• The skills levels of residents can present a challenge in meeting labour demands, Tees Valley residents are less well qualified than many other parts of the country. In terms of Degree/Level 4+ qualifications in 2018, the area needs an additional 34,800 residents qualified to that level to match the UK rate.
• Tees Valley primary schools perform above the national average with high quality schools and above average key stage 2 results. However, the quality and performance of Tees Valley secondary schools is below national average. Tees Valley has good quality Post 16 skills provision with all Further Education colleges now rated as either ‘Good’ or ‘Outstanding’ by Ofsted.

7
• Commercialisation, in terms of the proportion of firms introducing either a new or
significantly improved product or service between 2014 and 2016, stood at 21% in Tees
Valley compared to the Local Enterprise Partnerships’ (LEP) average of 25%. However,
amongst those Tees Valley firms that do innovate, higher than average proportions of sales
were derived from innovative products or services (42% of Tees Valley firms v 37% LEP
average) – an indicator of short-term success of firms’ innovation. This implies that
interventions to encourage Tees Valley firms to innovate are likely to generate greater
returns than in some other parts of the country.
• Tees Valley remains a strong exporting region. However, recent sharp growth in imports (up
15.8% on 2017) means that it no longer runs a trade in goods surplus i.e. imports into Tees
Valley are now greater than exports out. In 2018, Tees Valley goods exports totalled
£3,278m with imports at £3,423m, a deficit of £145m. No English region now runs a trade in
goods surplus (Scotland and N. Ireland still do) but the North East remains the region with
the lowest deficit (£830m in 2018). However, reflecting the Tees Valley’s increasing reliance
on imports, the North East region recorded the largest percentage increase in imports of any
region/country of the UK (NE 6.2% up, UK 2.9% up).
• Tees Valley runs a trade in goods surplus with the EU but a deficit with the rest of the world.
In 2018, export trade with EU countries was £1,863m (up 4.8% on 2017) whilst that with
non-EU countries totalled £1,415m (up 2.2%). EU goods imports were £1,675m (up 9.6% on
2017) and those from non-EU countries totalled £1,748m (up 22.4%). The UK has trade
agreements (until the end of 2020) with many of these non-EU countries through its
membership of the EU. The recent strong growth in exports to these non-EU countries
highlights the opportunity for further export growth provided the present country by
country agreements can be replicated or improved upon with UK bilateral deals by the end
of 2020.
• Congestion is less of a problem in Tees Valley than in many other areas. Tees Valley average
‘A’ road speeds (30.0 mph) are significantly quicker than other metropolitan areas in the
North of England e.g. Manchester at 18.3 mph and are also well above the national average
(24.9 mph).
• The relatively low cost of living in the Tees Valley helps boost the quality of life. With
average wage rates (Tees Valley £25,300 p.a., England £30,400 p.a.) far closer to the national
average than house prices (TV £155,700, England £304,000), Tees Valley has some of the
most affordable homes in the country (TV ratio of house price to salary 6.2, England 10.0).
Average housing rental costs also account for a significantly smaller share of wages than
nationally e.g. % of take home pay on two bedroom home in TV 30%, England 47%.
• Tees Valley has a relatively high proportion of localities within the most deprived 10%
nationally, as ranked by the 2019 Index of Multiple Deprivation, ranking as the second most
deprived LEP in England (out of 38 LEP areas). Whilst this ranking is unchanged since 2015,
there has been a slight increase in relative deprivation across Tees Valley over this time.
• Digital connectivity in Tees Valley is well above the national average, especially for Ultrafast
broadband with an average availability of 90% of all residential and business premises
covered compared to 59% nationally.

8
2.3. Tees Valley SWOT assessment
Strengths Weaknesses
Underlying aggregate productivity one of the highest of the northern LEPs and well represented in relatively high productivity sectors such as Energy & Circular Economy, Chemical & Process and Advanced Manufacturing. Strong recent GVA trend growth in sectors such Civil Engineering, Food Manufacturing and Wholesale. Tees Valley is a strong exporting region and is supported by England’s largest port in terms of outwards traffic tonnage with strong links to northern Europe and considerable potential for expansion around the world. Above average Tees Valley performance across primary school level and above average participation in Higher Education. Higher percentage of 16-34 year old residents starting an apprenticeship than nationally and apprenticeship achievement rates are consistently higher than the national average. Staff costs and other business overheads such as office rental costs are amongst the most price competitive in the country. Major East Coast rail hub at Darlington providing fast north-south connections across Great Britain. Relatively low levels of traffic congestion. Attractive and affordable towns, countryside and coast. Low cost of living generally.
A stagnant economy with an increasing output gap. Some of the country’s highest economic inactivity rates – closely correlated with relatively low levels of health and well-being – and stubbornly high unemployment rates when compared to other areas. Youth unemployment is an issue with a higher than average number of young people unemployed and claiming benefits and a high number NEET (Not in Education, Employment or Training). Lowest business density rates in England and low levels of innovation activity / spend among businesses. Lack of business churn with enterprise start-up rates constrained by lack of demand. Lack of jobs and the second lowest jobs density of all combined authority areas in England. The quality and performance of Secondary schools is below average. School performance at a local level varies between Local Authorities with pockets of under-achievement in both primary and secondary. The number of residents with higher level skills is below average and Tees Valley has a higher than average number of residents with no qualifications. Economic growth constrained by recent employment growth being skewed towards low pay, low skill occupations. Negative external perceptions of Teesside and lack of awareness re Tees Valley. Variable housing stock and relatively low house prices.
9
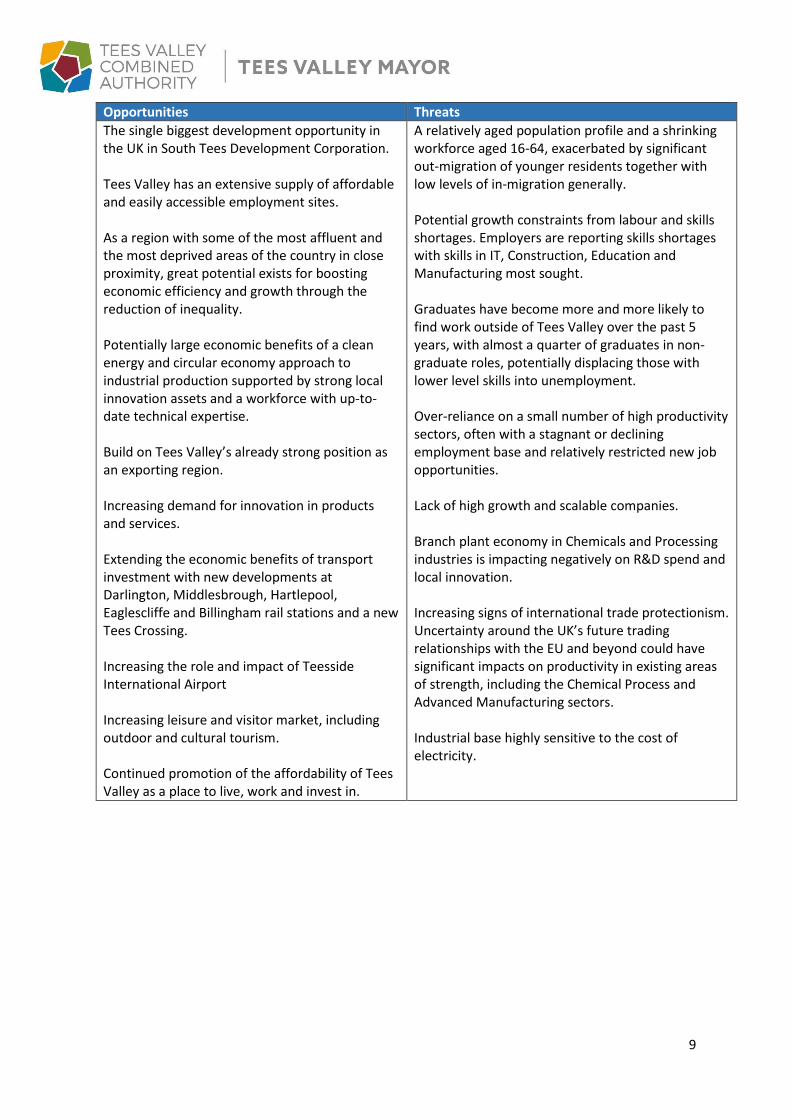
Opportunities Threats
The single biggest development opportunity in the UK in South Tees Development Corporation. Tees Valley has an extensive supply of affordable and easily accessible employment sites. As a region with some of the most affluent and the most deprived areas of the country in close proximity, great potential exists for boosting economic efficiency and growth through the reduction of inequality. Potentially large economic benefits of a clean energy and circular economy approach to industrial production supported by strong local innovation assets and a workforce with up-to-date technical expertise. Build on Tees Valley’s already strong position as an exporting region. Increasing demand for innovation in products and services. Extending the economic benefits of transport investment with new developments at Darlington, Middlesbrough, Hartlepool, Eaglescliffe and Billingham rail stations and a new Tees Crossing. Increasing the role and impact of Teesside International Airport Increasing leisure and visitor market, including outdoor and cultural tourism. Continued promotion of the affordability of Tees Valley as a place to live, work and invest in.
A relatively aged population profile and a shrinking workforce aged 16-64, exacerbated by significant out-migration of younger residents together with low levels of in-migration generally. Potential growth constraints from labour and skills shortages. Employers are reporting skills shortages with skills in IT, Construction, Education and Manufacturing most sought. Graduates have become more and more likely to find work outside of Tees Valley over the past 5 years, with almost a quarter of graduates in non-graduate roles, potentially displacing those with lower level skills into unemployment. Over-reliance on a small number of high productivity sectors, often with a stagnant or declining employment base and relatively restricted new job opportunities. Lack of high growth and scalable companies. Branch plant economy in Chemicals and Processing industries is impacting negatively on R&D spend and local innovation. Increasing signs of international trade protectionism. Uncertainty around the UK’s future trading relationships with the EU and beyond could have significant impacts on productivity in existing areas of strength, including the Chemical Process and Advanced Manufacturing sectors. Industrial base highly sensitive to the cost of electricity.

10
Section 3: Area Profile
The Tees Valley connects five local authority areas, with the river Tees running through all, and
forms a functioning economic geography. It has a con-terminus, fully integrated Combined
Authority and Local Enterprise Partnership in the area, responsible for overseeing economic growth.
The unique assets and strengths across the five Tees Valley local authorities combine to create the
opportunity to build a diverse and inclusive economy for Tees Valley residents and businesses, with
specialisms in Chemical & Process, Advanced Manufacturing, Clean Energy, Low Carbon and
Hydrogen. The Tees Valley also includes the South Tees Development Corporation, which is the
single biggest development opportunity in the UK right now. It is the first Mayoral Development
Corporation outside of Greater London and the 4,500-acre site is six times bigger than the City of
London.
Key messages
• Tees Valley is a predominantly urban area, covering five distinct town centres. The
unique natural assets and sectoral strengths across the five Tees Valley local authorities
combine to create the opportunity to build a diverse and inclusive economy for Tees
Valley residents and businesses.
• In addition to ranking as one of the most deprived parts of the country, Tees Valley has a
highly-polarised distribution of deprivation. It ranks as the second most deprived LEP
area in England with all five Tees Valley districts ranking in the most deprived 15% of
local authorities nationally.
• Tees Valley is most deprived in the Health domain, with Employment deprivation second
and Income deprivation a close third. However, Tees Valley shows relatively low levels
of deprivation in both Barriers to Housing & Services and Living Environment domains.
• Tees Valley has a wide range of extensive development sites, opportunities and financial
incentives including the Mayoral South Tees Development Corporation and Special
Economic Area, together with seven Enterprise Zones offering Business Rate Relief and
Enhanced Capital allowances.
• The Tees Valley total resident population stood at 674,300 in 2018 – the smallest
Combined Authority in terms of total population numbers. However, in terms of the
wider economic catchment area population, around three million people live within an
hour’s drive of Tees Valley – on a par with the core population of other urban areas in
the North of England such as Greater Manchester and Leeds City Regions.
• The Tees Valley can be defined as a functional economic area with close to 9 in 10 local
jobs filled by Tees Valley residents and similarly close to 9 in 10 local residents employed
within Tees Valley i.e. relatively small and balanced levels of in and out-commuting.
• The population of Tees Valley has grown in recent years, albeit this has been at a slower
rate of growth than levels seen nationally. The majority of the increase in our population
size can be attributed to an ageing population.

11
The following section provides a geographical overview of the Tees Valley, taking into consideration,
the emerging demographic profile of the region, the urban/rural split in terms of population and the
location of key industrial sites and Enterprise Zones offering Business Rate Relief and Enhanced
Capital allowances. Relative deprivation rates at the community level are also examined.
A focus on geography is particularly important in the Tees Valley Strategic Economic Plan, which calls
for capital investment to be focused in urban settlements and enterprise zones. It is also important
to plan local programmes and make the case to attract national resources on the basis of need,
which can maximise economic impact and increase social inclusion. By understanding our
geography, we can develop initiatives and plan for developments that play to our region’s strengths,
including our natural assets, and address areas of challenge.
3.1. Geography Covering over 300 square miles and located on the North East coast, Tees Valley comprises five local
authority areas including: Darlington, Hartlepool, Middlesbrough, Redcar & Cleveland and Stockton-
on-Tees.
The Tees Valley area represents 1.2% of the population of England and 0.6% of the English land
mass; it is highly urbanised, with 90% of the population in urban areas. Around one third of the total
population is concentrated in the five main town centres with the remaining population located in
the suburbs, in smaller settlements, or rural areas.
• Compared to national averages, Tees Valley has a relatively aged population profile.
There is a smaller than average labour force with relatively more residents aged 65+ and
relatively fewer aged 16 to 64 compared to the UK. Projections indicate that this trend is
set to continue, with population growth driven mainly by those over retirement age in
the next two decades. However, decreasing numbers of 16 to 64 residents will be
potentially offset to a degree by ongoing increases in the State Retirement Age.
• There is a risk that these demographic trends lead to skills shortages as highly skilled
staff leave the workforce.
• The region has relatively poor levels of health impacting negatively on the pool of
available labour supply.
• Tees Valley international net in-migration rose sharply (up 86%) in 2018, however both in
and out international migration rates continue to be half that observed nationally.
• Migration flows are relatively low in Tees Valley compared to many other parts of the
country. Whilst this does result in a more stable population, it does exacerbate the Tees
Valley’s relatively aged population profile as migrants tend on average to be younger
people.

12
Figure 3.1. Tees Valley area
As a major settlement with a growing service industry, Stockton-on-Tees is the largest of the Local
Authority areas in employment and population terms. The borough’s economy is diverse, with
sectoral strengths in Chemical & Process, Advanced Manufacturing, Clean Energy Low Carbon &
Hydrogen and Construction. Key companies include Fujifilm Diosynth Biotechnologies and Johnson
Matthey, heavy industries include the expansion of the SUEZ UK energy from waste site, and a
growing digital sector includes fast growing Visualsoft. A range of office and industrial business
accommodation is available, such as Wynyard Business Park, Teesside Industrial Estate and Belasis
Business Park, together with the industrial areas of North Tees and Seal Sands, plus incubation
facilities. Numbers of overseas students in the area continue to grow with Durham University’s
International Study Centre. A large percentage of the population of Stockton-on-Tees is located in
the Stockton built up town area, with the remainder of the population spread between a number of
local areas such as Billingham, Thornaby, Ingleby Barwick, Norton and Fairfield.
Middlesbrough continues to diversify its economy with a stronghold in engineering companies
across the borough, the recently developed TeesAMP site provides world-class research and
commercial premises, including a home to TWI, an internationally renowned research institute. The
digital cluster centred in the Boho area is becoming nationally recognised and has a unique
opportunity to play a critical role in the productivity growth of the Tees Valley’s industrial base in its
adoption of Industry 4.0 (industrial digitalisation). Middlehaven continues to develop as a mixed use
regeneration site with leisure (home to Middlesbrough FC and the site for a new snow centre),
offices including Boho 5, innovative residential developments and education facilities. Home to
Teesside University, the development of modern student facilities and proposals for a student village
integrates the role of the university within the town. The town is also home to Tees Valley’s largest
employer South Tees NHS Trust, with almost 9,000 employees. The introduction of direct rail
services to London and improvements at the station and the surrounding area will form the stimulus
for independent businesses in the Historic Quarter linking the centre to the Boho area. A significant

13
amount of the population of Middlesbrough is located in Middlesbrough’s built up area with the
remainder of the population spread between a number of local areas such as Acklam, Linthorpe,
Coulby Newham, Grove Hill & Beechwood and Marton.
Darlington is a gateway to Tees Valley, with direct connections to the A1(M) and the East Coast
mainline as well as Teesside International Airport. Sectoral strengths are Advanced Manufacturing,
Digital, Logistics and Healthcare and the town is home to some major engineering and specialist
services companies (Cleveland Bridge, Magnet, Cummins and Wood) including subsea and seabed
companies (Deep Ocean and Modus). At Central Park, the home to CPI’s National Biologics
Manufacturing Centre and Teesside University’s National Horizons Centre, the town is the ideal
location for the development of the biologics market. With its proximity to the A1(M) the borough is
a growing location for logistics distribution centres – Amazon has recently announced plans to open
a new fulfilment centre and is starting to recruit for more than 1,000 new permanent jobs – with the
opportunity for further developments at key sites. It has arich heritage including the first railway
from Darlington to Stockton (with a bicentenary in 2025). A large percentage of the population of
Darlington is located in the Darlington built up area, with the remainder of the population spread
between a number of towns and villages. Outside of the town centre the largest population shares
are in Middleton St. George, Hurworth, Faverdale, Heighington and Harrowgate Village.
Redcar and Cleveland, which contains the coastal town of Redcar and is historically associated with
the steel and chemicals industry has the third largest population. It has a broad range of sectoral
strengths including Raw Materials and Agriculture, Chemical & Process, Clean Energy Low Carbon &
Hydrogen, Advanced Manufacturing, Logistics and Creative, Culture & Leisure. Redcar & Cleveland is
home to the UK’s largest integrated industrial complex with Wilton International one of the UK’s
most important locations for process manufacturing including global companies, Sabic, Sembcorp
Utilities, Ensus, Lotte Chemical, Huntsman and Falck. The South Tees Development Corporation is
one of the biggest industrial and coastal development sites (4,500 acres) in Britain and it presents a
unique opportunity to develop the Tees Valley’s strength in clean growth. With the combination of
assets including large scale sites, deep access port facilities, global companies and innovation
organisations including the Materials Processing Institute and the Centre for Process Innovation, the
area can become the clean growth centre of the UK. The borough is still home to a significant steel
industry and mining and processing of minerals is growing with Boulby mine, one of the deepest in
Europe, and the new £2.3bn polyhalite mine under construction in North Yorkshire with processing
to take place at Wilton. A large amount of the population of Redcar and Cleveland is located in the
Redcar area with the remainder of the population spread between a number of local towns and
villages such as Guisborough, Eston, Marske, Skelton, Grangetown, Ormesby, Saltburn and Brotton.
Hartlepool is the smallest Local Authority in both population and employment terms. It is home to
Hartlepool Port, has strong historic links to the maritime industry and sectoral strengths in Clean
Energy Low Carbon & Hydrogen, Chemical & Process, Advanced Manufacturing, Healthcare and
Education. The town is home to the Northern School of Art, the leading provider of specialist
creative art and design in the north, counting Sir Ridley Scott among its former pupils. It is central to
the opportunity to create the biggest film studios outside London on the former council depot site,
which will put Hartlepool at the centre of film making in the north. The town offers excellent
opportunities for port-related industries with more than 300 acres at the Port of Hartlepool owned
and operated by PD Ports, with deep water access, warehousing and open storage. Engineering
companies employ around 1,700 people with Liberty Steel and Able, with Seaton Port one of the
largest dry dock facilities in the world and a recycling facility of international significance (currently
dismantling the Shell Brent Delta platform). The chemicals industry is still also important to the town

14
and clean energy production at EDF’s Nuclear Power Plant generates 60GW (2% of GB’s peak
electricity demand). A smaller percent of the population of Hartlepool is located in and around the
town centre area, with the population mainly spread between a number of local areas such as
Throston, West View, Seaton Carew, Middle Warren and Clavering.
Figure 3.2 compares the urban/rural composition of the Tees Valley area:
Figure 3.2. Rural/Urban split of Tees Valley area
3.2. Local level deprivation
The Ministry of Housing, Communities and Local Government (MHCLG) published the latest Index of
Multiple Deprivation (IMD 2019) in September 2019. This comprises deprivation scores and national
ranks for all Lower Super Output Areas (LSOAs) in England, plus Local Enterprise Partnership (LEP)
and local authority (LA) results. A wide variety of indicators are combined to form seven domains –
Income, Employment, Education, Health, Crime, Barriers to Housing & Services and Living
Environment. The Income domain includes two sub-domains namely IDACI (Income Deprivation
Affecting Children Index) and IDAOPI (Income Deprivation Affecting Older People Index). The seven
domains are then combined into overall deprivation scores (the IMD) for every LSOA in England.
IMD is a nationally recognised measure of deprivation in small areas across England and is used
widely to target programmes that tackle inequality and deprivation. The IMD also provides a useful
means to guide the allocation of resources, with the potential to be used to inform allocation of
funding going forward, for example, UK Shared Prosperity Fund (UKSPF). Tees Valley’s relative levels
of deprivation can therefore be used in messaging to shape government policy and resource
allocation that reflects levels of need and vulnerabilities to economic shocks.
© Crown Copyright and database rights 2014 Ordnance Survey Licence No. 100022861 | Source: ONS, DEFRA, DCLG

15
Key messages for Tees Valley
• IMD 2019 shows a slight increase in relative deprivation across Tees Valley compared with 2015, with little change to the overall pattern of highly-polarised deprivation in the area
• Tees Valley has a relatively high proportion of LSOAs within the most deprived 10% nationally, ranking as the second most deprived LEP in England (out of 38 LEP areas). This ranking is unchanged since 2015
• 121 or 29% of Tees Valley’s 417 LSOAs are in the 10% most deprived nationally, almost three times the national rate
• Tees Valley is most deprived in the Health domain, with Employment deprivation second and Income deprivation a close third
• More positively, Tees Valley shows relatively low levels of deprivation in both Barriers to Housing & Services and Living Environment domains
• At the local authority level and out of 317 districts nationally, Middlesbrough has the highest proportion of LSOAs within the national most deprived 10% with Hartlepool 10th, Redcar & Cleveland 29th, Stockton-on-Tees 39th and Darlington 47th
• All five local authority areas now rank amongst the 15% most deprived local authorities in England.
The figure below depicts the distribution of deprivation levels across Tees Valley. It shows how the
most deprived neighbourhoods are generally concentrated within the urban areas of Tees Valley.
Figure 3.3. Indices of Multiple Deprivation, Tees Valley LSOAs, 2019
Source: MHCLG. English Indices of Deprivation 2019

16
Ranking by domain - key points
• Tees Valley ranks as the least deprived LEP area on the Living Environment domain. This
domain covers two sub-domains; the indoors sub-domain measuring the quality of housing
and the outdoors sub-domain measuring air quality and road traffic accidents. Tees Valley
also ranks as relatively less deprived on the Barriers to Housing and Services domain as
discussed in Section 9.1.
• Tees Valley ranks as the most deprived LEP area in regards to the Income deprivation
affecting children index (IDACI) sub-domain. All five Tees Valley local authority areas record
higher levels of relative deprivation on the IDACI sub-domain as compared to the IDAOPI –
the Income deprivation affecting older people index. With Tees Valley also ranking as the
fourth most deprived LEP on the IDAOPI sub-domain, this suggests that child poverty is
relatively more of an issue than pensioner poverty in the Tees Valley.
• Reflecting Tees Valley’s overall IMD of second most deprived LEP area, the area also ranks
second most deprived on many domains including the overall Income domain, the
Employment domain, the Education domain and the Health domain. Tees Valley ranks as
the third most deprived LEP in terms of the Crime domain.
The table below summarises the IMD domain ranks by local authority.
Table 3.1. Rank of proportion of LSOAs in most deprived 10% nationally
Rank out of 317 LA areas Rank out of 38 LEP areas
Darlington Hartlepool Middlesbro’ R&C Stockton Tees Valley
Income 41 7 1 24 33 2
- IDACI 30 3 1 13 37 1
- IDAOPI 79 15 11 52 55 4
Employment 52 5 2 12 39 2
Education 42 38 3 46 61 2
Health 35 16 4 18 28 2
Crime 20 14 3 58 84 3
Barriers 199 250 250 250 219 35
Living Env. 251 251 251 235 251 38
IMD 47 10 1 29 39 2
Source: IMD 2019
3.3. Enterprise Zones There are a wide range of cost-effective sites and premises across Tees Valley, with seven Enterprise
Zones offering Business Rate Relief and Enhanced Capital allowances. The list of enterprise zones
includes:
Business Rate Relief Enterprise Sites:
• Northshore, Stockton-on-Tees;
• Central Park, Darlington; and
• Middlesbrough Historic Quarter.
The Business Rate Relief sites offer a discount of up to £55,000 each year for five years, totalling
£275,000. The sites benefit from excellent transport links, simplified planning and broadband
connections:

17
Enhanced Capital Allowance (ECA) Sites:
• South Bank Wharf, Redcar & Cleveland;
• New Energy & Technology Park; Stockton-on-Tees;
• Wilton International, Redcar & Cleveland; and
• Hartlepool Port Estates
The ECA benefits are on the larger industrial sites to help incentivise investment from companies in
the renewable energy, chemicals and advanced manufacturing and engineering sectors. Companies
locating on these sites can apply to receive first-year capital allowance at 100% on qualifying plant
and machinery, to a maximum of £100m to offset against corporation tax when the investment is
made before March 2020. Tees Valley is one of only a small number of areas across the country that
can offer large-scale occupiers enhanced capital allowances on their plant and machinery.
3.4. South Tees Development Corporation/Special Economic Area
The South Tees Development Corporation is the single biggest development opportunity in the UK
right now. It is the first Mayoral Development Corporation outside of Greater London and the 4,500-
acre site is six times bigger than the City of London.
The vision will see the area transformed into a hotbed of new industry and enterprise, focused on
clean energy, the circular economy, industrial symbiosis and advanced manufacturing, that will
create 20,000 new jobs and add an additional £1bn per annum into the Tees Valley economy.
The Development Corporation area is prime development land on the banks of the River Tees and benefits from the presence of strategically important businesses, facilities and operations that enhance the attractiveness of the site, including Teesport, Redcar Bulk Terminal, Northumbrian Water, British Steel and BOC. The South Tees Development Corporation owns more than half of all the developable land within its boundary following a deal with Tata Europe UK to acquire 1,420 acres in early 2019. It continues to engage with other landowners and interested parties and is expecting to have concluded all land deals by mid-2020. It offers access to the River Tees as well as one of the deepest water ports on the east coast of England, making it ideal for companies looking to export to global markets. The area has excellent transport connections, with rail-connected port-side facilities and access to the wider strategic road network and the rest of the UK. It is less than 30 minutes away from Teesside International Airport. The South Tees Development Corporation has significant Government support and in the 2018 Autumn Budget it was granted Special Economic Area status, the only site in the UK to have such status. So far Government has backed the Development Corporation with more than £208m to prepare the land for new investment.

18
Key Findings:
• There has been an upward
trend since the turn of the
millennium of the population
size of Tees Valley.
• This population growth of
2.8% has still lagged below
that in the North of England
(7.4%) and England as a
whole (17%).
Figure 3.4. South Tees Development Corporation area
3.5. Demography
The mid-2018 population of Tees Valley is estimated to be 674,300, with a total of three million
people living within an hour’s drive of the area. Figure 3.5 illustrates the overall population change
in Tees Valley over the last 27 years.
Figure 3.5. Total resident population in Tees Valley, 1991-2018
Source: ONS Population Estimates
Whilst the population of Tees Valley is predominantly White British (93%), Tees Valley is home to a
small Black and Minority Ethnic (BME) community with Middlesbrough having an ethnic make-up
that more closely reflects the national picture (86% of Middlesbrough’s population is White British
compared with 80% of England’s).
Health levels have improved across Tees Valley, however they remain lower than in the country as a
whole with 7% of the working age population claiming to be long term sick compared 4.6%
nationally.

19
Key Findings:
• 19.5% are aged between 0-15
years old (131,400 people),
compared to 19.2% nationally.
• 61.5% are aged between 16-64
years old (414,440 people),
compared to 62.6% nationally).
• 19% are aged over 65 (128,420
people), compared to 18.2%
nationally.
Figure 3.6. Age split of current population
Source: ONS Mid-2018 Population Projections
Table 3.2 compares the demographic profile of Tees Valley to England as a whole:
Table 3.2. Demographic profile, Tees Valley and England
Description Tees Valley England
Population (2018) 674,300 55,977,200
Population projection (2028) 679,700 59,043,500
Population projection (2038) 680,600 61,326,400
Geographical coverage (hectares) 79,400 13,027,800
Population density 8.5 4.3
Birth rate 1.11% 1.12%
Death rate 1.07% 0.90%
Life expectancy (2016-18) 79.3 years 81.4 years
Healthy life expectancy (2016-18) 59.5 years 63.6 years
International in-migration rate 0.50% 1.00%
International out-migration rate 0.10% 0.60%
Internal in-migration rate 3.90% n/a
Internal out-migration rate 4.00% n/a
Median age 40 38.9
Population growth rate 0.3% 0.6%
Sources/notes: ONS mid-2018 population estimates, ONS 2016-based population projections, Census 2011. Tees Valley life
and healthy life expectancy are simple averages of district estimates, ONS. Rates are a percentage of population in mid-
2018.

20
Key Findings:
• International net immigration
was higher in all five local
authorities in Tees Valley, with
Middlesbrough seeing the
largest rise of 510 when
compared with 2017.
• This drop in 2017 and rise in
2018 mirrors trends seen
across the wider North East
and UK.
3.6. Migration
Following the vote to leave the EU in 2016 and reflecting national trends, there was a sharp drop in
international net migration in Tees Valley in 2017. However recent figures show that in the year to
Mid-2018 international net migration in Tees Valley increased by 86.4%, up by 1,250 on the year
from 1,450 in 2017 to 2,700 in the year to mid-2018.
Figure 3.7. International Net Migration trends by Local Authority
Source: ONS
Migration flows are relatively low in Tees Valley compared to many other parts of the country.
Whilst this does result in a more stable population, it does exacerbate the Tees Valley’s relatively
aged population profile as migrants tend on average to be younger people. Compared to England as
a whole, Tees Valley international in and out migration rates were less than half that observed
nationally. Rates were highest in Central London, the university cities of Oxford and Cambridge and
large cities across the country.
Figure’s 3.8 and 3.9 illustrate the international inflow and outflow rates for the Tees Valley
compared with the wider North East and England.
Figure 3.8. International Inflow
Figure 3.9. International Outflow
Source: ONS

21
Key Findings:
• The Tees Valley population is
projected to increase by 0.8%
over the next 10 years (to
around 679,900 by 2029),
however this is a small increase
compared to a 5.2% increase
nationally and a 2.8% increase
across the North of England.
• Over the next 20 years (2039)
the population is expected to
increase by 0.9% compared to a
9.2% rise nationally and a 4.6%
rise across the North of England.
3.7. Population Trends and Projections
The population projections shown in this section are taken from the ONS 2016 based subnational
population projections. ONS recognise that these projections are not forecasts and take no account
of local policy or development aims that have not yet had an impact on observed trends.
The Tees Valley population is projected to continue its long-term growth seen since the start of the
millennium of approximately 1,000 per year until 2020, growth is then projected to slow both locally
and nationally reaching around 680,700 by 2039.
Figure 3.10. Projected total resident population in Tees Valley, 2019-2039
Source: ONS Population Projections
Although there is projected growth in the following 20 years, growth is not expected in all age
groups. Figure 3.11 shows the age make-up of the Tees Valley population in 2018 and then
projected make-up in 2028 and 2038:
Figure 3.11. Demographic Projections
2018 Estimates 2028 Projection 2038 Projection
Source: ONS Population Projections

22
Currently (ONS mid 2018) 0-15 year olds make up 19% of the population. We are moving towards
the projected peak of this age group in 2021, with an extra 700 children projected, adding pressure
to our schools over the next few years, before then falling steadily each year until 2039.
The working age population (16-64s) is predicted to be almost 28,400 lower in 20 years’ time, from
61% of the total population in 2018 to 57% in 2038.
There will be an increase in the proportion of over 65s with the percentage of population over the
retirement age expected to grow from 19% in 2018 to over a quarter of the population in 2038, this
coupled with the fall in working age population will bring skills shortages when experienced and
highly skilled staff leave the workforce. There will also be implications on health services as
pressures increase.
Figure 3.12 illustrates the change in detailed age group from 2001 until 2037.
Figure 3.12. Population estimates and projections by age group
Source: ONS Population Projections

23
3.8. Area Profile SWOT analysis
Strengths Weaknesses
There are a wide range of cost-effective sites and premises across Tees Valley, with seven Enterprise Zones providing a range of financial incentives to companies choosing to locate in the region, as well as simplified planning and super-fast broadband. Tees Valley demonstrates low levels of deprivation in relation to Living Environment and Barriers to Housing and Services.
Health levels in Tees Valley remain lower than in the country as a whole. The number of people with a long term illness is above national average, affecting the working age population. In addition to high levels of Health deprivation, Tees Valley ranks highly deprived on Employment, Income and Crime domains.
Opportunities Threats
Tees Valley contains the South Tees Development Corporation (STDC) – the first Mayoral Development Corporation outside of London, and often cited as the single biggest development opportunity in the UK at the current time. STDC was set up to promote economic growth and commercial development by converting assets in the South Tees area into opportunities for business investment and economic growth. A new Special Economic Area (SEA) will soon be established in Tees Valley across the STDC site with the power to retain business rates to reinvest in developing more of the site, reducing the ask of local taxpayers. Tees Valley’s sector strengths and natural assets, present opportunities for the region to become a global leader in clean energy, low carbon and hydrogen. The cost and quality of living in Tees Valley create an opportunity to attract and retain skilled workers, with the area having relatively low levels of deprivation in both Barriers to Housing & Services and Living Environment domains.
The population growth in Tees Valley is now projected to slow, with the growth rate much lower than national; however these ONS projections do not take into account local policy or development aims that have not yet had an impact on observed trends. The Tees Valley has a rapidly ageing population and declining working age population / labour force. There is a risk of skill shortages when experienced and highly skilled staff leave the workforce with an added implication on health services. The number of 0-15 year old Tees Valley residents is expected to peak in 2021, with extra pressures expected on primary and secondary school places in the short term before numbers are projected to drop steadily. Following the vote to leave the EU in 2016 and reflecting national trends, there was a sharp drop in international net migration into Tees Valley in 2017. Although this has seen a rise in 2018 there is a risk that EU negotiations in 2020 will affect international net migration in the coming years, and therefore access to skilled workers.
24
Section 4: Economic Growth and Productivity
The following section provides a summary of the Tees Valley economy in terms of Gross Domestic
Product (GDP), Gross Value Added (GVA), productivity and trade. Sectoral breakdowns are identified
where feasible and comparisons made against national and local indicators where appropriate. This
section seeks to determine the degree of the Tees Valley productivity gap and identify its constituent
parts.
Economic growth is an important indicator of wealth creation and economic performance. A key
target in the Tees Valley Strategic Economic Plan is to raise productivity. In addition, productivity is
the primary focus of the locally agreed draft Tees Valley Local Industrial Strategy.
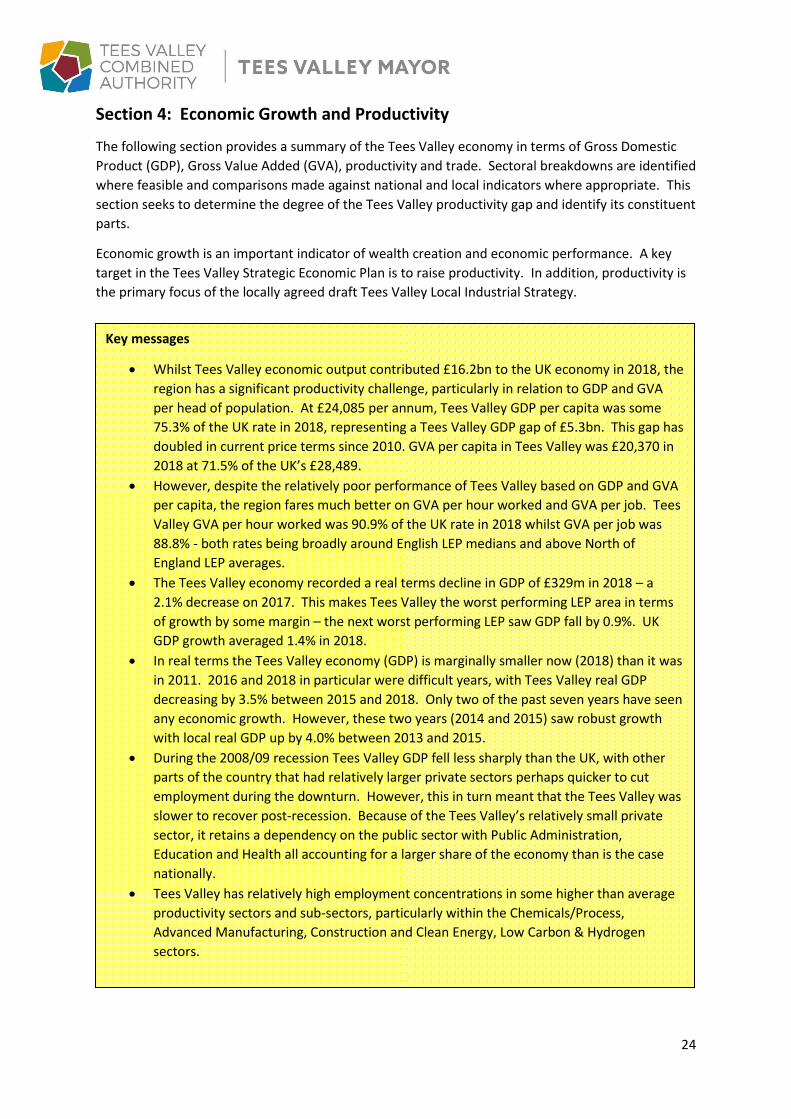
Key messages
• Whilst Tees Valley economic output contributed £16.2bn to the UK economy in 2018, the
region has a significant productivity challenge, particularly in relation to GDP and GVA
per head of population. At £24,085 per annum, Tees Valley GDP per capita was some
75.3% of the UK rate in 2018, representing a Tees Valley GDP gap of £5.3bn. This gap has
doubled in current price terms since 2010. GVA per capita in Tees Valley was £20,370 in
2018 at 71.5% of the UK’s £28,489.
• However, despite the relatively poor performance of Tees Valley based on GDP and GVA
per capita, the region fares much better on GVA per hour worked and GVA per job. Tees
Valley GVA per hour worked was 90.9% of the UK rate in 2018 whilst GVA per job was
88.8% - both rates being broadly around English LEP medians and above North of
England LEP averages.
• The Tees Valley economy recorded a real terms decline in GDP of £329m in 2018 – a
2.1% decrease on 2017. This makes Tees Valley the worst performing LEP area in terms
of growth by some margin – the next worst performing LEP saw GDP fall by 0.9%. UK
GDP growth averaged 1.4% in 2018.
• In real terms the Tees Valley economy (GDP) is marginally smaller now (2018) than it was
in 2011. 2016 and 2018 in particular were difficult years, with Tees Valley real GDP
decreasing by 3.5% between 2015 and 2018. Only two of the past seven years have seen
any economic growth. However, these two years (2014 and 2015) saw robust growth
with local real GDP up by 4.0% between 2013 and 2015.
• During the 2008/09 recession Tees Valley GDP fell less sharply than the UK, with other
parts of the country that had relatively larger private sectors perhaps quicker to cut
employment during the downturn. However, this in turn meant that the Tees Valley was
slower to recover post-recession. Because of the Tees Valley’s relatively small private
sector, it retains a dependency on the public sector with Public Administration,
Education and Health all accounting for a larger share of the economy than is the case
nationally.
• Tees Valley has relatively high employment concentrations in some higher than average
productivity sectors and sub-sectors, particularly within the Chemicals/Process,
Advanced Manufacturing, Construction and Clean Energy, Low Carbon & Hydrogen
sectors.
25
4.1. Total GDP and GVA
Office for National Statistics annual GDP and GVA statistics (GDP essentially comprises GVA plus
taxes e.g. VAT or Excise duties, less any subsidies) are now published for local level geographies.
However, GDP is only available at the aggregate level and so GVA is still used to provide the sectoral
breakdown. Whilst current prices are used for point in time headlines e.g. 2018 estimates, change
over time is measured in ‘real’ terms i.e. allowances made for inflation. These real term estimates
are thus consistent with other economic measures such as the quarterly headline estimates of UK
GDP.
Aggregate economic output (as measured by GDP) from Tees Valley amounted to £16.2bn in 2018, a
2.1% real terms decrease on 2017. This compares to real terms increases of 1.4% nationally and
1.2% in the North of England as a whole. Tees Valley GDP now accounts for 3.9% of the North of
England’s GDP, 0.88% of England’s and 0.76% of the UK’s.
However, Tees Valley GDP per capita was just 75.3% of the UK rate in 2018, down significantly from
80.8% of the UK rate observed as recently as 2015.
This means that the Tees Valley now has a GDP or output gap of £5.3bn – the additional level of
economic output required in Tees Valley to match the UK GDP per capita rate. This gap is now more
than twice what is was (in nominal terms) immediately following the 2008/09 recession in 2010.
As an approximate measure of productivity, GDP per capita is dividing a workplace-based numerator
(GDP) by a residence-based denominator (residential population). This means that this measure
does not account for people commuting into and out of a region and significant commuting flows
can lead to highly distorted results. Also, by including all the residential population (including
children, pensioners and others not economically active) and not just those who are in employment,
the denominator includes residents who are not directly contributing to GDP i.e. those residents not
in employment.
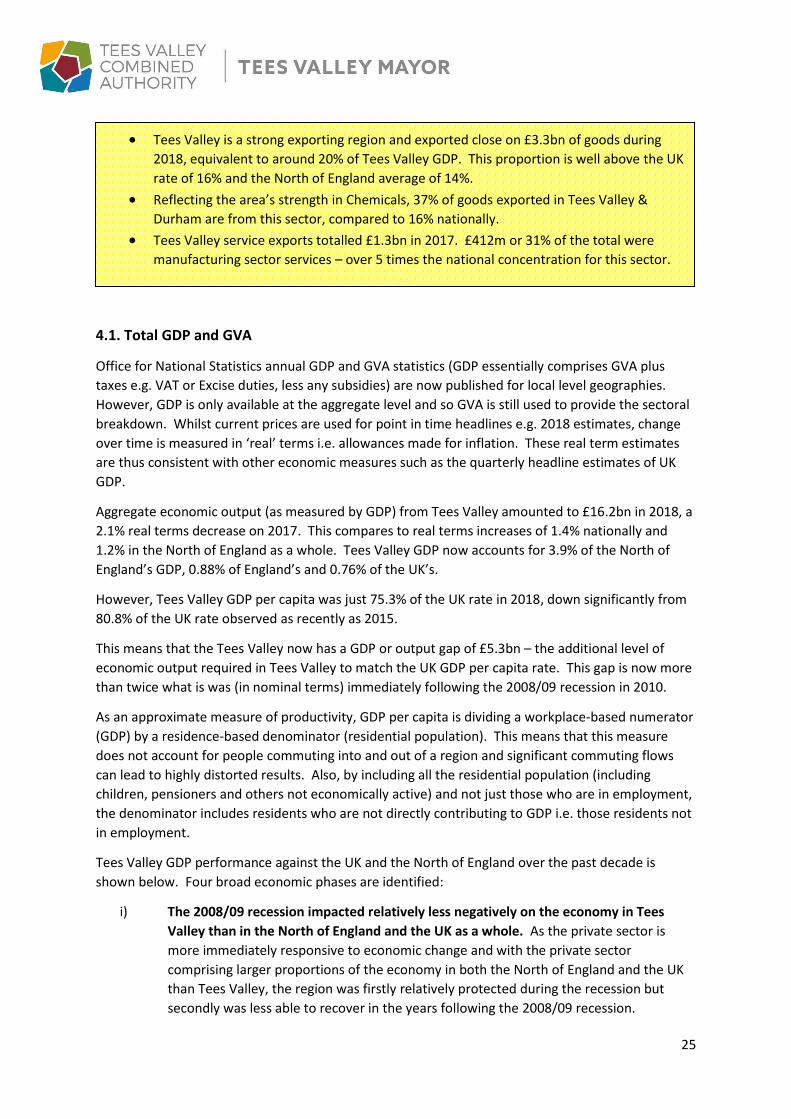
Tees Valley GDP performance against the UK and the North of England over the past decade is
shown below. Four broad economic phases are identified:
i) The 2008/09 recession impacted relatively less negatively on the economy in Tees
Valley than in the North of England and the UK as a whole. As the private sector is
more immediately responsive to economic change and with the private sector
comprising larger proportions of the economy in both the North of England and the UK
than Tees Valley, the region was firstly relatively protected during the recession but
secondly was less able to recover in the years following the 2008/09 recession.
• Tees Valley is a strong exporting region and exported close on £3.3bn of goods during
2018, equivalent to around 20% of Tees Valley GDP. This proportion is well above the UK
rate of 16% and the North of England average of 14%.
• Reflecting the area’s strength in Chemicals, 37% of goods exported in Tees Valley &
Durham are from this sector, compared to 16% nationally.
• Tees Valley service exports totalled £1.3bn in 2017. £412m or 31% of the total were
manufacturing sector services – over 5 times the national concentration for this sector.
26
ii) The Tees Valley fell back into recession during 2012 and 2013. In addition to the
private sector’s relatively smaller size and therefore smaller contribution to overall GDP,
private sector recovery within Tees Valley was further constrained by reduced levels of
public sector investment following the recession.
iii) 2014 and 2015 saw Tees Valley GDP growth rates pick-up. Private sector growth
responded to relatively higher levels of public sector investment.
iv) Since 2015 GDP has fallen back across the Tees Valley. The closure of Redcar’s SSI plant
in the Autumn of 2015 has had a profound effect on the performance of the Tees Valley
economy.
Figure 4.1. Real terms GDP index (2008 = 1), Tees Valley, North of England and UK
Source: ONS
Tees Valley GDP per capita at £24,085 in 2018 is slightly closer to the UK rate of £31,976 i.e. 75.3%
than Tees Valley GVA per capita (£20,370 in 2018) at 71.5% of the UK’s £28,489.
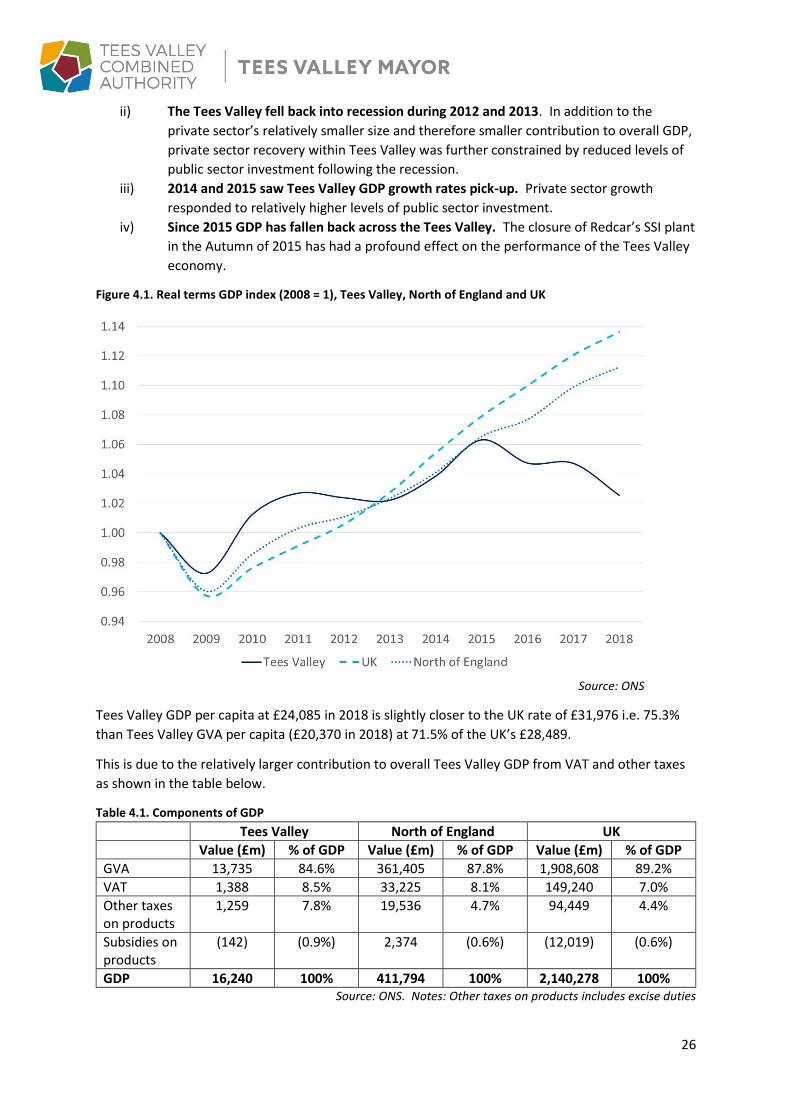
This is due to the relatively larger contribution to overall Tees Valley GDP from VAT and other taxes
as shown in the table below.
Table 4.1. Components of GDP
Tees Valley North of England UK
Value (£m) % of GDP Value (£m) % of GDP Value (£m) % of GDP
GVA 13,735 84.6% 361,405 87.8% 1,908,608 89.2%
VAT 1,388 8.5% 33,225 8.1% 149,240 7.0%
Other taxes on products
1,259 7.8% 19,536 4.7% 94,449 4.4%
Subsidies on products
(142) (0.9%) 2,374 (0.6%) (12,019) (0.6%)
GDP 16,240 100% 411,794 100% 2,140,278 100% Source: ONS. Notes: Other taxes on products includes excise duties
27
4.2. Productivity
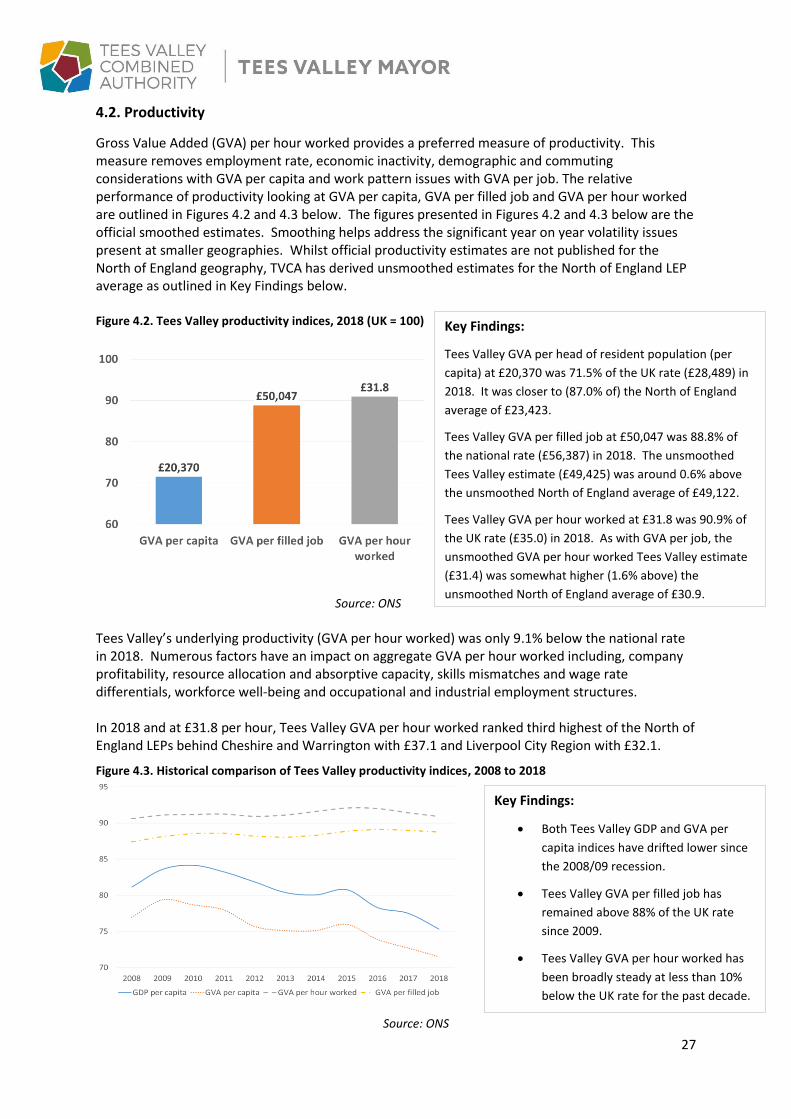
Gross Value Added (GVA) per hour worked provides a preferred measure of productivity. This measure removes employment rate, economic inactivity, demographic and commuting considerations with GVA per capita and work pattern issues with GVA per job. The relative performance of productivity looking at GVA per capita, GVA per filled job and GVA per hour worked are outlined in Figures 4.2 and 4.3 below. The figures presented in Figures 4.2 and 4.3 below are the official smoothed estimates. Smoothing helps address the significant year on year volatility issues present at smaller geographies. Whilst official productivity estimates are not published for the North of England geography, TVCA has derived unsmoothed estimates for the North of England LEP average as outlined in Key Findings below.
Figure 4.2. Tees Valley productivity indices, 2018 (UK = 100)
Source: ONS
Tees Valley’s underlying productivity (GVA per hour worked) was only 9.1% below the national rate in 2018. Numerous factors have an impact on aggregate GVA per hour worked including, company profitability, resource allocation and absorptive capacity, skills mismatches and wage rate differentials, workforce well-being and occupational and industrial employment structures. In 2018 and at £31.8 per hour, Tees Valley GVA per hour worked ranked third highest of the North of England LEPs behind Cheshire and Warrington with £37.1 and Liverpool City Region with £32.1.
Figure 4.3. Historical comparison of Tees Valley productivity indices, 2008 to 2018
Source: ONS
Key Findings:
Tees Valley GVA per head of resident population (per
capita) at £20,370 was 71.5% of the UK rate (£28,489) in
2018. It was closer to (87.0% of) the North of England
average of £23,423.
Tees Valley GVA per filled job at £50,047 was 88.8% of
the national rate (£56,387) in 2018. The unsmoothed
Tees Valley estimate (£49,425) was around 0.6% above
the unsmoothed North of England average of £49,122.
Tees Valley GVA per hour worked at £31.8 was 90.9% of
the UK rate (£35.0) in 2018. As with GVA per job, the
unsmoothed GVA per hour worked Tees Valley estimate
(£31.4) was somewhat higher (1.6% above) the
unsmoothed North of England average of £30.9.
Key Findings:
• Both Tees Valley GDP and GVA per
capita indices have drifted lower since
the 2008/09 recession.
• Tees Valley GVA per filled job has
remained above 88% of the UK rate
since 2009.
• Tees Valley GVA per hour worked has
been broadly steady at less than 10%
below the UK rate for the past decade.

28
4.3. Sectoral GVA
This section examines the most recent five year Tees Valley GVA trends across 17 broadly defined
ONS sectors.
Table 4.1 breaks these 17 sectors down by sub-sector for 2018 and provides an indication as to that
sector’s relative share of total Tees Valley GVA as compared to that sector’s share nationally.
Sectors accounting for the same share of total GVA as nationally are said to have a location quotient
(LQ) of 1. Those with a higher share have a higher LQ and those with a lower share a lower LQ.
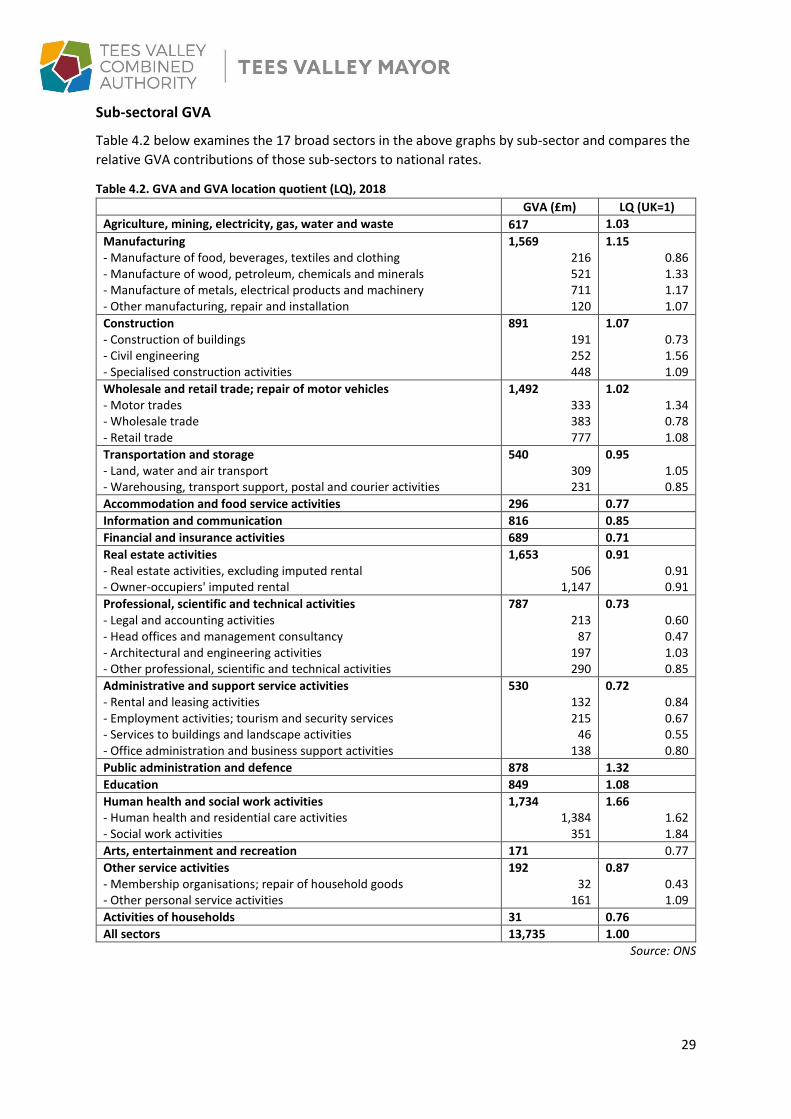
Overall Tees Valley GVA makes up 0.7% of UK GVA but in those sectors with an LQ of over one this
proportion is higher. The Tees Valley sub-sector that contributes the highest proportion of UK GVA
is the one with the highest LQ i.e. Social work activities with 1.3% of the UK GVA total for that sub-
sector.
Key points – change since 2013
• Tees Valley GVA was 2% higher in real terms in 2018 than it was in 2013. UK GVA was up by
10% over this time.
• Human health and social work activities is now the largest sector in Tees Valley with GVA of
more than £1.7bn in 2018 – up by 14% in five years. The sector also has the highest LQ of
any sector across Tees Valley and has replaced Manufacturing as the largest sector. Tees
Valley Manufacturing GVA has been revised down to £1.5bn (2018), 12% smaller in real
terms than in 2013.
• Within the Manufacturing sector, Wood, Petroleum, Chemicals & Minerals was down by 26%
since 2013 with Metals, Electrical products & Machinery down by 12%. Whilst these two
sectors remain relatively strong in Tees Valley (LQs>1), these strengths are significantly less
than previously. However, Food, Beverages, Textiles & Clothing was up by 36%.
• Driven by strong growth in Civil Engineering (up 52%) and Construction of Buildings (up
38%), the Construction sector was 7% larger in 2018 than in 2013. However, Specialised
Construction was down by 17%.
• Motor and Wholesale trades were up by over 40% since 2013 but Retail was down by 8%.
• Both Arts, entertainment & recreation and Transportation & storage were down by one-fifth
whilst Architectural and engineering services was down by one-quarter.
• Other sectors seeing increases in GVA between 2013 and 2018 included Accommodation
and food services (up 5%), Finance & insurance (up 35%), Professional, scientific & technical
(up 8%), Administrative & support services (up 11%), Public administration & defence (up
7%) and Other services (up 35%).
• Other sectors seeing decreases in GVA between 2013 and 2018 included Education (down
11%), Agriculture, mining, electricity, gas, water and waste (down 11%) and Information &
communication (down 2%). Real estate activities GVA was unchanged.
29
Sub-sectoral GVA
Table 4.2 below examines the 17 broad sectors in the above graphs by sub-sector and compares the
relative GVA contributions of those sub-sectors to national rates.
Table 4.2. GVA and GVA location quotient (LQ), 2018
GVA (£m) LQ (UK=1)
Agriculture, mining, electricity, gas, water and waste 617 1.03
Manufacturing - Manufacture of food, beverages, textiles and clothing - Manufacture of wood, petroleum, chemicals and minerals - Manufacture of metals, electrical products and machinery - Other manufacturing, repair and installation
1,569 216 521 711 120
1.15 0.86 1.33 1.17 1.07
Construction - Construction of buildings - Civil engineering - Specialised construction activities
891 191 252 448
1.07 0.73 1.56 1.09
Wholesale and retail trade; repair of motor vehicles - Motor trades - Wholesale trade - Retail trade
1,492 333 383 777
1.02 1.34 0.78 1.08
Transportation and storage - Land, water and air transport - Warehousing, transport support, postal and courier activities
540 309 231
0.95 1.05 0.85
Accommodation and food service activities 296 0.77
Information and communication 816 0.85
Financial and insurance activities 689 0.71
Real estate activities - Real estate activities, excluding imputed rental - Owner-occupiers' imputed rental
1,653 506
1,147
0.91 0.91 0.91
Professional, scientific and technical activities - Legal and accounting activities - Head offices and management consultancy - Architectural and engineering activities - Other professional, scientific and technical activities
787 213
87 197 290
0.73 0.60 0.47 1.03 0.85
Administrative and support service activities - Rental and leasing activities - Employment activities; tourism and security services - Services to buildings and landscape activities - Office administration and business support activities
530 132 215
46 138
0.72 0.84 0.67 0.55 0.80
Public administration and defence 878 1.32
Education 849 1.08
Human health and social work activities - Human health and residential care activities - Social work activities
1,734 1,384
351
1.66 1.62 1.84
Arts, entertainment and recreation 171 0.77
Other service activities - Membership organisations; repair of household goods - Other personal service activities
192 32
161
0.87 0.43 1.09
Activities of households 31 0.76
All sectors 13,735 1.00
Source: ONS

30
4.4 Sectoral productivity
The majority of Tees Valley’s key sectors have relatively high levels of productivity, with only
Healthcare and Creative, Culture & Leisure displaying relatively low productivity rates. Even then,
certain sub-sectors within Creative, Culture & Leisure have above average rates.
In total, a majority of key sectors record either or both of above average productivity rates and
above average employment concentrations. These sectors are Clean Energy, Low Carbon and
Hydrogen, Chemical and Process, Bioscience, Advanced Manufacturing, Construction and Logistics.
Only the Creative, Culture & Leisure sector displays both relatively low productivity and relatively
low employment concentration. However, this sector, alongside the Healthcare and Professional &
Business Services sectors is highly job rich, with these three sectors accounting for around one-third
of total employment in Tees Valley.
Finally, the Tees Valley Digital sector, whilst highly productive, is still relatively small compared to
many other parts of the country. However, the sector is growing rapidly and projections indicate
that this sector will play an important role in generating many jobs in the future. In addition, the
cross-cutting nature of the sector will support the development of other sectors, including with the
increasing trend towards manufacturing and industrial digitisation.
The ten key sectors can be categorised as follows:
Sub-sectoral productivity
The following analysis examines the ten sectors outlined above in more detail. The main sub-
sectors, ranked in terms of employment contribution, are identified for each sector. Note that in
terms of all sector average productivity, this is estimated at £52,000 for the UK in 2018. Also note
that Tees Valley total employment accounts for 1.0% of England’s total employment, so any Tees
Valley sub-sector that accounts for more than 1.0% of England’s employment is relatively strong in
terms of employment concentration (shaded green in the tables).

31
The three high productivity sectors are:
Clean Energy, Low Carbon & Hydrogen – key points
• High employment concentration across the majority of key sub-sectors, particularly with
regards to Remediation activities, Extraction of crude petroleum and Materials recovery.
• All sub-sectors display relatively high levels of productivity.
Table 4.3. Clean Energy, Low Carbon & Hydrogen main sub-sectors summary, 2018
Sub-sector SIC codes Tees Valley employment
% of England employment
UK productivity (£ p.a.)
Remediation activities 39 1,300 12.7% £93,000
Extraction of crude petroleum 6.1 200 7.8% £1.2m
Materials recovery 38.3 800 4.7% £95,000
Repair of fabricated metal products, machinery and equipment
33.1 2,100 2.5% £76,000
Electric power generation, transmission and distribution
35.1 1,100 1.4% £185,000
Renting and leasing of construction, civil engineering and other machinery
77.32, 77.39
700 1.2% £105,000
Water and sewerage 36, 37 500 1.0% £191,000
Waste collection, treatment & disposal 38.1, 38.2 800 0.8% £60,000
Clean Energy, Low Carbon & Hydrogen 8,100 1.5% £136,000* Source: ONS, Annual Business Survey (ABS). EMSI. Note: *Tees Valley employment adjusted average productivity of sub-
sectors listed.
Chemicals and Process – key points
• High employment concentration across all key sub-sectors.
• Chemicals manufacture is a high productivity sector and employs a large number of workers.
• Plastics is a medium productivity sector and a significant employer.
Table 4.4. Chemicals and Process main sub-sectors summary, 2018
Sub-sector SIC codes
Tees Valley employment
% of England employment
UK productivity (£ p.a.)
Manufacture of refined petroleum products 19.2 500 6.9% £186,000
Manufacture of chemicals and chemical products
20 3,300 3.8% £94,000
Manufacture of plastic products 22.2 1,500 1.1% £51,000
Chemicals and Process 5,400 2.2% £91,000*
Associated sub-sector: Mining of chemical and fertiliser minerals**
8.91 600 94.8% £73,000
Source: ONS, ABS. EMSI. Note: *Tees Valley employment adjusted average productivity of sub-sectors listed. **Technically
not defined as part of the Chemicals & Process sector, ‘Mining of chemical and fertiliser minerals’ is included here as a
significant associated sub-sectoral strength in employment terms. Productivity for this sub-sector is proxied as the broader
‘Mining and quarrying n.e.c.’ sub-sector (2017 estimate).
Digital – key points
• All sub-sectors display high rates of productivity.
• High employment concentration in high value Telecommunications sub-sector.
• Relatively lower levels of employment in other Digital sub-sectors.

32
Table 4.5. Digital main sub-sectors summary, 2018
Sub-sector SIC codes Tees Valley employment
% of England employment
UK productivity (£ p.a.)
Telecommunications** 61 2,500 1.3% £148,000
Computer consultancy activities 62.02 2,600 0.6% £90,000
Computer and peripherals repair 95.11 100 0.5% £79,000
Other IT and computer services 62.09 500 0.4% £101,000
Computer programming activities 62.01 600 0.3% £95,000
Data processing, web portals & related 63.1 100 0.2% £131,000
Digital sector 6,500 0.6% £114,000* Source: ONS, ABS. EMSI. Note: * Tees Valley employment adjusted average productivity of sub-sectors listed. ** Local
Contact/Call Centres – technically part of Professional & Business Services (PBS) – are often officially recorded under the
parent company’s Telecommunications SIC code. This tendency acts to over-report local level Digital sector employment
and under-report local level PBS employment.
The four medium/high productivity sectors are:
Bioscience – key points
• Reflecting SIC code issues, high productivity sectors such as Pharmaceuticals are not
effectively identified within Tees Valley.
• Significant representation of high productivity Chemical and Process sub-sectors support the
overall medium/high productivity rate for the sector.
Table 4.6. Bioscience main sub-sectors summary, 2018
Sub-sector SIC codes Tees Valley employment
% of England employment
UK productivity (£ p.a.)
Manufacture of industrial gases, organic chemicals, nitrogen compounds and primary plastics
20.11, 20.14, 20.15, 20.16
2,100
10.1% £118,000 a
Manufacture of other food products n.e.c.
10.89 800 2.7% £64,000
Research and experimental development on natural science and engineering
72.1 2,800 2.5% £30,000 b
Technical testing and analysis 71.2 700 1.4% £62,000
Manufacture of bread, fresh pastries and cakes
10.71 600 0.9% £31,000
Manufacture of beer 11.05 100 0.9% £84,000
Manufacture of plastic packaging 22.22 100 0.6% £52,000
Manufacture of pharmaceutical preparations
21.2 100 0.3% £224,000
Manufacture of soaps and detergents 20.4 100 0.2% £66,000
Bioscience 7,500 1.7% £66,000* Source: ONS, ABS. EMSI Note: * Tees Valley employment adjusted average productivity of sub-sectors listed. a Productivity
does not includes the unavailable SIC 20.11 Manufacture of industrial gases. b Productivity only available for broader SIC 72
Scientific R&D sub-sector.
Advanced Manufacturing – key points
• High employment concentration across the majority of sub-sectors.
• Most sub-sectors record Medium/High productivity rates.

33
Table 4.7. Advanced Manufacturing main sub-sectors summary, 2018
Sub-sector SIC codes
Tees Valley employment
% of England employment
UK productivity (£ p.a.)
Manufacture of iron, steel and piping 24.1, 24.2
1,100 5.7% £42,000 a
Manufacture of engines and turbines 28.11 800 4.8% £52,000
Research and experimental development on natural science and engineering
72.1 2,800 2.5% £30,000 b
Manufacture of electric motors, cables and electronics
27.11, 27.32
400 2.2% £74,000 c
Manufacture of specialist machinery 28.9 600 1.9% £76,000
Engineering consultancy services 71.12 4,700 1.6% £73,000
Manufacture of motor vehicle parts 29.32 800 1.6% £59,000
Machining, metals treatment, metal structures, wire products and tools manufacture
25 4,100 1.5% £52,000
Technical testing and analysis 71.2 700 1.4% £62,000
Manufacture of instruments and appliances for measuring and testing
26.51 400 0.9% £81,000
Other professional, scientific and technical activities n.e.c.
74.9 800 0.8% £57,000
Manufacture of aircraft, spacecraft and related machinery
30.3 500 0.7% £42,000
Advanced Manufacturing 17,800 1.5% £56,000* Source: ONS, ABS. EMSI. * Tees Valley employment adjusted average productivity of sub-sectors listed. a Productivity only
available for SIC 24.1 Manufacture of basic iron and steel. b Productivity only available for broader SIC 72 Scientific R&D
sub-sector. c Productivity only available for SIC 27.11 Manufacture of electric motors.
Construction – key points
• Overall a broadly average employment concentration than nationally but with a high
concentration in the Demolition and site preparation sub-sector and a relatively low
concentration in the construction installation and completion of buildings sub-sectors.
• Construction is a medium/high productivity sector with the majority of its sub-sectors within
or close to this productivity range. However, with self-employment rates in the sector
approaching 50%, there may be some under-reporting of total employment and therefore
over-stating of productivity level.
Table 4.8. Construction main sub-sectors summary, 2018
Sub-sector SIC codes
Tees Valley employment
% of England employment
UK productivity (£ p.a.)
Demolition and site preparation 43.1 500 2.8% £69,000
Construction of roads and motorways 42.11 700 1.5% £63,000
Construction of other civil engineering projects
42.9 1,600 1.4% £68,000
Construction of buildings 41 4,600 1.2% £96,000
Roofing, scaffolding and other specialised construction activities
43.9 1,600 1.2% £61,000
Electrical, plumbing and other construction installation activities
43.2 2,300 0.7% £50,000
Building completion and finishing 43.3 1,000 0.5% £53,000
Construction 12,400 1.0% £73,000* Source: ONS, ABS. EMSI. * Tees Valley employment adjusted average productivity of sub-sectors listed.
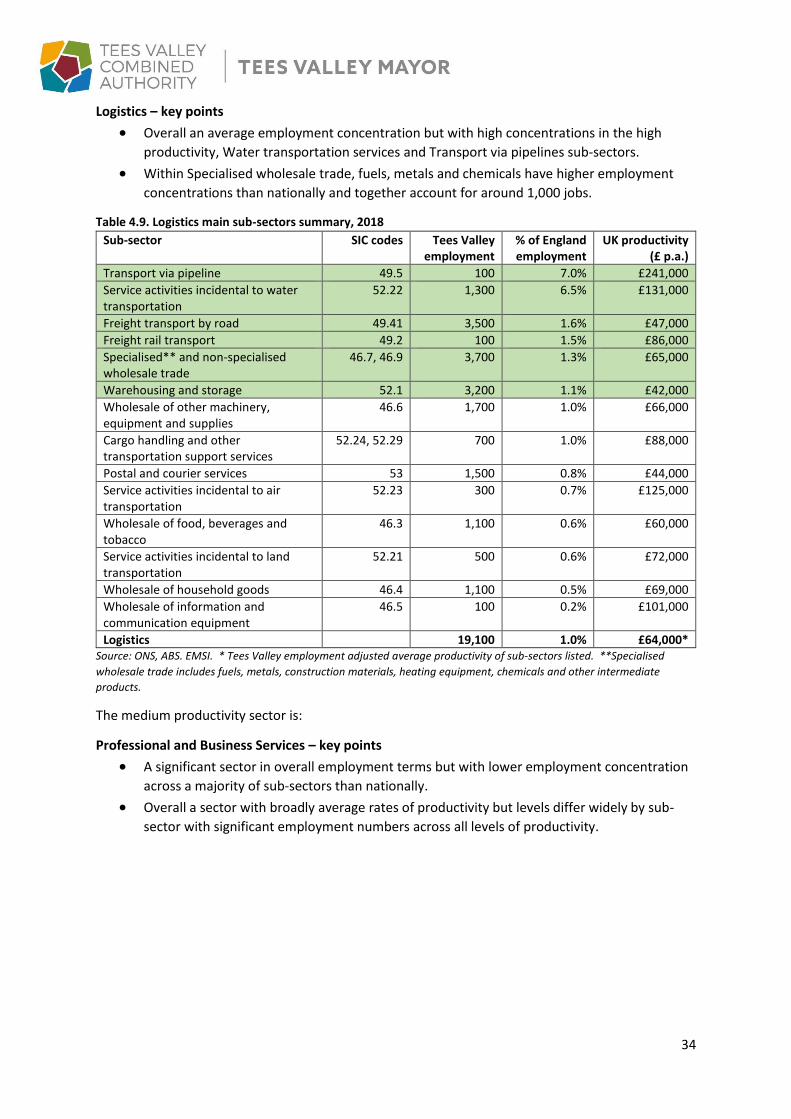
34
Logistics – key points
• Overall an average employment concentration but with high concentrations in the high
productivity, Water transportation services and Transport via pipelines sub-sectors.
• Within Specialised wholesale trade, fuels, metals and chemicals have higher employment
concentrations than nationally and together account for around 1,000 jobs.
Table 4.9. Logistics main sub-sectors summary, 2018
Sub-sector SIC codes Tees Valley employment
% of England employment
UK productivity (£ p.a.)
Transport via pipeline 49.5 100 7.0% £241,000
Service activities incidental to water transportation
52.22 1,300 6.5% £131,000
Freight transport by road 49.41 3,500 1.6% £47,000
Freight rail transport 49.2 100 1.5% £86,000
Specialised** and non-specialised wholesale trade
46.7, 46.9 3,700 1.3% £65,000
Warehousing and storage 52.1 3,200 1.1% £42,000
Wholesale of other machinery, equipment and supplies
46.6 1,700 1.0% £66,000
Cargo handling and other transportation support services
52.24, 52.29 700 1.0% £88,000
Postal and courier services 53 1,500 0.8% £44,000
Service activities incidental to air transportation
52.23 300 0.7% £125,000
Wholesale of food, beverages and tobacco
46.3 1,100 0.6% £60,000
Service activities incidental to land transportation
52.21 500 0.6% £72,000
Wholesale of household goods 46.4 1,100 0.5% £69,000
Wholesale of information and communication equipment
46.5 100 0.2% £101,000
Logistics 19,100 1.0% £64,000* Source: ONS, ABS. EMSI. * Tees Valley employment adjusted average productivity of sub-sectors listed. **Specialised
wholesale trade includes fuels, metals, construction materials, heating equipment, chemicals and other intermediate
products.
The medium productivity sector is:
Professional and Business Services – key points
• A significant sector in overall employment terms but with lower employment concentration
across a majority of sub-sectors than nationally.
• Overall a sector with broadly average rates of productivity but levels differ widely by sub-
sector with significant employment numbers across all levels of productivity.

35
Table 4.10. Professional and Business Services main sub-sectors summary, 2018
Sub-sector SIC codes
Tees Valley employment
% of England employment
UK productivity (£ p.a.)
Landscape service activities 81.3 1,600 2.6% £45,000
Call Centres 82.2 1,300 2.1% £31,000
Buildings combined facilities support activities 81.1 2,000 1.3% £38,000
Business support activities n.e.c. 82.9 3,700 1.1% £81,000
Security and investigation activities 80 1,700 1.0% £32,000
Financial and insurance activities 64, 65, 66
7,000 0.8% n/a
Employment agencies and related activities 78 6,300 0.7% £39,000
Legal and accounting activities 69 3,100 0.5% £71,000
Buildings cleaning activities 81.2 1,800 0.5% £15,000
Veterinary activities 75 200 0.4% £45,000
Office administration and support activities 82.1 200 0.4% £59,000
Head offices and business management consultancies
70.1, 70.22
2,000 0.3% £78,000
Real estate activities 68 200 0.1% £81,000
Professional and Business Services 31,300 0.7% £51,000* Source: ONS, ABS. EMSI. * Tees Valley employment adjusted average productivity of sub-sectors listed.
Tees Valley’s two Low productivity sectors are:
Creative Culture and Leisure – key points
• A wide-ranging sector encompassing both high and low productivity sub-sectors.
• Overall employment levels are high but the two largest sub-sectors in terms of number of
jobs, Restaurants & event catering and Beverages serving activities are both very low
productivity.
• With greater employment levels observed in relatively lower level productivity sub-sectors
this impacts negatively on the sector’s overall productivity rate.
Table 4.11. Creative, Culture and Leisure main sub-sectors summary, 2018
Sub-sector SIC codes Tees Valley employment
% of England employment
UK productivity (£ p.a.)
Beverage serving activities 56.3 6,600 1.4% £20,000
Gambling and betting 92 1,100 1.3% £63,000
Motion picture projection activities 59.14 200 1.2% £97,000 a
Sport and recreation 93 4,200 1.0% £28,000
Retail of sport equipment 47.64 600 1.0% £33,000
Taxis, passenger rail and other land transport
49.1, 49.32, 49.39
1,100 0.8% £56,000
Newspaper publication 58.13 200 0.8% £99,000 b
Restaurants and event catering 56.1, 56.2 7,300 0.7% £19,000
Hotels and similar accommodation 55 2,100 0.6% £36,000
Travel agents and tour operators 79.1 500 0.6% £108,000
Renting and leasing of cars and recreational goods
77.11, 77.21 200 0.6% £205,000
Libraries and museums 91.01, 91.02 300 0.6% £3,000
Photography and specialised design activities
74.1, 74.2 200 0.4% £69,000
Sports and cultural education 85.51, 85.52 100 0.4% £21,000
Creative, arts and entertainment 90 100 0.2% £53,000
Creative, Culture and Leisure 28,300 0.7% £31,000*
Healthcare – key points Source: ONS, ABS. EMSI. * Tees Valley employment adjusted average productivity of sub-sectors listed. a
Productivity only available for broader SIC 59 Motion pictures sub-sector. b Productivity only available for broader
SIC 58 Publishing activities sub-sector.

36
• A key sector for Tees Valley in terms of high numbers of employees and high employment
concentration.
• Both Hospital activities and Residential care sub-sectors account for relatively higher levels
of employment than nationally.
• Reflecting the labour intensive nature of the sector, Healthcare as a whole has Low
productivity levels with all sub-sectors recording Low productivity rates.
Table 4.12. Healthcare main sub-sectors summary, 2018
Sub-sector SIC codes Tees Valley employment
% of England employment
UK productivity (£ p.a.)
Hospital activities 86.1 22,000 1.7% £20,000
Residential care 87 9,500 1.5% £24,000
Other human health activities 86.9 2,300 0.7% £36,000
Dental practice activities 86.23 600 0.7% £28,000 a
General and specialist medical practice activities
86.21, 86.22 1,400 0.6% £28,000 a
Healthcare 35,900 1.4% £23,000* Source: ONS, ABS. EMSI. * Tees Valley employment adjusted average productivity of sub-sectors listed. a Productivity only
available for broader SIC 86 Human health activities.
4.5. Total goods trade and export destinations
Reflecting Tees Valley’s relatively strong exporting performance, in 2018 goods exports of £3,278m
were only marginally below goods imports of £3,423. This represents a trade in goods deficit of
£145m. This compared with a Tees Valley trade in goods surplus in 2017 of £206m. The
deterioration in the trade balance was driven by the particularly strong increase in imports – 15.8%
up on 2017 (UK imports up 2.9%), which outstripped the increase in exports, up 3.7% on 2017 (UK
exports up 3.4%). All English regions are now (2018) running a trade in goods deficit balance. The
North East region remains the closest to surplus with just £830m of deficit.
Tees Valley’s exporting strength is also shown by the fact that goods exports are equivalent to
around 20% of Tees Valley GDP, significantly above the UK proportion of 16% and the North of
England’s 14%. In addition, Tees Valley’s goods exports account for around 1.0% of UK goods
exports, well above the Tees Valley’s 0.8% overall contribution to UK GDP.
Tees Valley continues to run a trade in goods surplus with the EU but a deficit with the rest of the
world. In 2018, export trade with EU countries was £1,863m (up 4.8% on 2017) whilst that with non-
EU countries totalled £1,415m (up 2.2%). EU goods imports were £1,675m (up 9.6% on 2017) and
those from non-EU countries totalled £1,748m (up 22.4%). The number of Tees Valley firms
exporting to the EU was 1,252 in 2018 (up 20 on 2017) and to non-EU countries 1,184 (up 12 on
2017).
Tees Valley & Durham total exports in goods was £5.1bn in 2018 i.e. Tees Valley accounted for
around 64% of sub-regional exports (and nearly one quarter of total North East exports of £13.2bn).
Figure 4.4 examines the top ten destination countries for Tees Valley & Durham’s goods exports in
2017 and 2018.
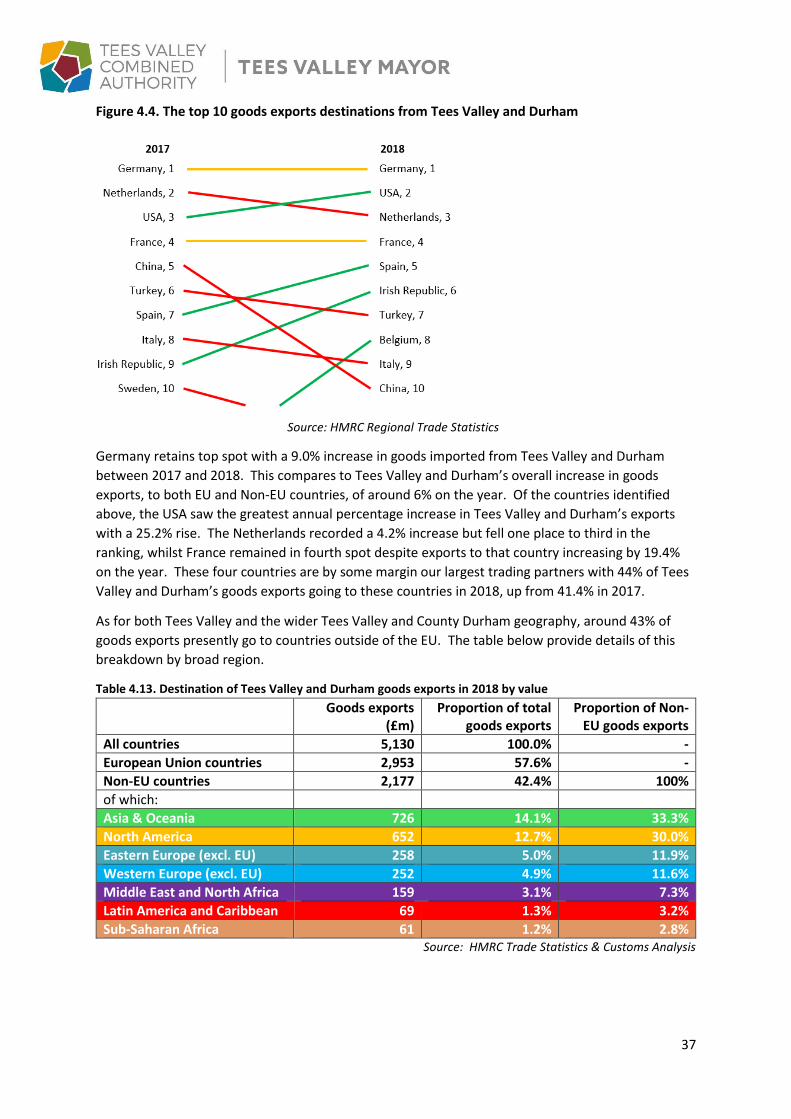
37
Figure 4.4. The top 10 goods exports destinations from Tees Valley and Durham
Source: HMRC Regional Trade Statistics
Germany retains top spot with a 9.0% increase in goods imported from Tees Valley and Durham
between 2017 and 2018. This compares to Tees Valley and Durham’s overall increase in goods
exports, to both EU and Non-EU countries, of around 6% on the year. Of the countries identified
above, the USA saw the greatest annual percentage increase in Tees Valley and Durham’s exports
with a 25.2% rise. The Netherlands recorded a 4.2% increase but fell one place to third in the
ranking, whilst France remained in fourth spot despite exports to that country increasing by 19.4%
on the year. These four countries are by some margin our largest trading partners with 44% of Tees
Valley and Durham’s goods exports going to these countries in 2018, up from 41.4% in 2017.
As for both Tees Valley and the wider Tees Valley and County Durham geography, around 43% of
goods exports presently go to countries outside of the EU. The table below provide details of this
breakdown by broad region.
Table 4.13. Destination of Tees Valley and Durham goods exports in 2018 by value
Goods exports (£m)
Proportion of total goods exports
Proportion of Non-EU goods exports
All countries 5,130 100.0% -
European Union countries 2,953 57.6% -
Non-EU countries 2,177 42.4% 100%
of which:
Asia & Oceania 726 14.1% 33.3%
North America 652 12.7% 30.0%
Eastern Europe (excl. EU) 258 5.0% 11.9%
Western Europe (excl. EU) 252 4.9% 11.6%
Middle East and North Africa 159 3.1% 7.3%
Latin America and Caribbean 69 1.3% 3.2%
Sub-Saharan Africa 61 1.2% 2.8% Source: HMRC Trade Statistics & Customs Analysis

38
Figure 4.5 illustrates how these regional exports are distributed by component countries.
Figure 4.5. Proportion of non-EU goods exports by world region and component countries, Tees Valley and
Durham, 2018
Source: HMRC Trade Statistics & Customs Analysis. Note that 96% of regional exports to Macedonia are non-
ferrous metals.
4.6. Sectoral goods exports
HMRC publish a broad sectoral split of their export statistics down to NUTS2 level i.e. Tees Valley
and County Durham combined. Chemicals & related products (£1.92bn) together with Machinery &
transport equipment (£1.81bn) accounted for over 72% of Tees Valley & Durham’s total goods
exports. Whilst aggregate Tees Valley and Durham exports were below imports, these two sectors
delivered a trade in goods surplus of over £1bn. However, deficits across the remaining sectors
resulted in an overall net trade deficit of £223m.
Figure 4.6. Tees Valley and County Durham, goods exports by sector, value and % of total, 2018
Source: HMRC Regional Trade Statistics

39
Reflecting the area’s particular strength in Chemicals (37% of total Tees Valley & Durham goods
exports), nationally Chemicals & related products accounted for just 16% of exports and at the North
East regional geography only 22% of exports were Chemicals.
4.7. Tees Valley services exports
Experimental service exports estimates are now available down to local level. Tees Valley service
exports were estimated at £1,344m in 2017. This represents around 0.5% of total UK service
exports. Manufacturing sector service exports accounted for £412m or 30.7% of total Tees Valley
service exports, over five times the percentage contribution of the sector nationally. Other sectors
where the Tees Valley records a higher percentage than nationally include Retail and
Accommodation & food service activities.
Tees Valley was also one of just two joint authority areas which exported more services to the EU
(£829m or 62%) than to Non-EU countries (£514m or 38%). At the national level, just 41% of UK
service exports went to the EU. South Teesside had the highest proportion of its service exports
going to the EU (74%) of any of the 168 NUTS3 areas in Great Britain. At this geography, Darlington’s
service exports totalled £291m (of which 56% went to the EU), Hartlepool’s & Stockton-on-Tees with
£505m (52% to the EU) and £548m for South Teesside.
Figure 4.7. Services exports by functional category, Tees Valley, £ millions, 2017
Source: ONS
4.8. Foreign Direct Investment (FDI) projects
From a UK perspective, inward foreign direct investment (FDI) is an investment from a foreign
investor into a UK enterprise. DIT collate FDI statistics by region covering the number of FDI projects
and the new jobs associated with these projects.
2018-19 was a difficult year for FDI into the UK with the number of projects down from 2,072 in
2017-18 to 1,782 in 2018-19, a 14% decline. The North East region saw a similar rate of decrease,
down from 69 projects in 2017-18 to 59 in 2018-19. The North East does however appear to be
maintaining its relative regional share of inward FDI and in 2018-19 was the recipient of around 3.3%
of the country’s FDI projects, a rate unchanged on 2017-18 and up a little on 2016-17’s 3.0%.

40
In terms of new jobs, the North East saw 2,188 created in 2018-19, down by around 8% on 2017-18’s
2,379. However, this rate of decline was only one third of that observed nationally, the number of
new FDI jobs in the UK falling from 75,968 to 57,625 in the year.
4.9. Economic Growth and Productivity SWOT analysis
Strengths Weaknesses
Existing strengths in relatively high productivity sectors such as Clean Energy, Low Carbon and Hydrogen (including Nuclear) and Chemicals & Process. Particular strengths in the medium/high productivity Advanced Manufacturing sub-sector Engineering Services and also Construction’s Civil engineering and specialised construction sub-sectors. Strong recent GVA trend growth in certain higher value broad sectors such as Construction and Professional, Scientific and Technical activities. A strong exporting area reflecting Manufacturing GVA strength in Chemicals and Metal manufactures goods exports in particular. Relatively strong trading relationships with the EU in both goods and services.
Slow overall GDP/GVA growth and an increasing GDP/GVA gap (based on GDP/GVA per capita). Underlying labour market participation issues are the largest contributor to the area’s low GDP/GVA per capita and sluggish economic growth rate. Over-reliance on a small number of high productivity sectors, often with a combination of declining output and shrinking employment base and relatively restricted new job opportunities.
Opportunities Threats
Potential for significant growth in emerging higher productivity sectors e.g. Bioscience and Digital. Significant aggregate GVA growth would flow from only marginal productivity improvement in employment rich sectors such as Healthcare and Creative, Culture and Leisure. Great potential for diversification of supply chains and developing the capacity of firms to increase exports.
Increasing levels of trade protectionism across the world, particularly in key non-EU markets such as USA and China. A deficit in trade in goods with non-EU countries with a need to diversify trade after leaving the EU. Continuing uncertainty in the economic environment impacting negatively on aggregate business investment.
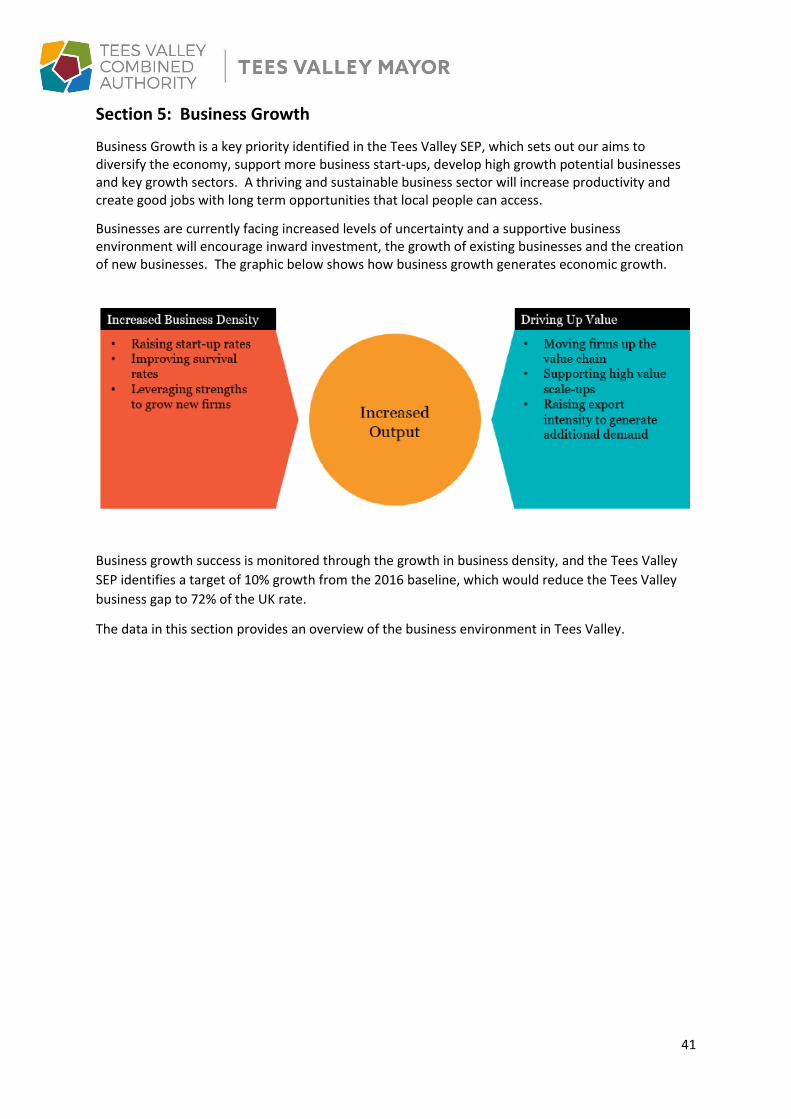
41
Section 5: Business Growth
Business Growth is a key priority identified in the Tees Valley SEP, which sets out our aims to diversify the economy, support more business start-ups, develop high growth potential businesses and key growth sectors. A thriving and sustainable business sector will increase productivity and create good jobs with long term opportunities that local people can access.
Businesses are currently facing increased levels of uncertainty and a supportive business environment will encourage inward investment, the growth of existing businesses and the creation of new businesses. The graphic below shows how business growth generates economic growth.
Business growth success is monitored through the growth in business density, and the Tees Valley
SEP identifies a target of 10% growth from the 2016 baseline, which would reduce the Tees Valley
business gap to 72% of the UK rate.
The data in this section provides an overview of the business environment in Tees Valley.

42
5.1. Business Density
There were 17,765 business enterprises in Tees Valley in 2019, up by 535 on the year before
(17,230). Within this, there were 695 additional companies but 145 fewer sole traders/partnerships.
The increase in enterprises was higher in the Tees Valley (up 3.1%) than nationally (1.8%). This
meant the Tees Valley business density rate increased from 318 enterprises per 10,000 residents
aged 16+ (63.7% of the UK rate) in 2018 to 327 (64.8% of UK) in 2019. This represents an enterprise
gap of 9,650 compared to the UK.
Key messages
• During the year to March 2019, the total number of Tees Valley business enterprises
grew by 535 to stand at 17,765 (of which 17,675 are SMEs). This represents an annual
increase of 3.1%, well above the national increase of 1.8%.
• Within this, strong growth was observed in company formation (up 695 on the year) at
the expense of both partnerships and sole traders (down 145 combined).
• The Service sector saw the highest growth rates with the number of Tees Valley
Professional & Business Service companies up by 16.2% (up 320) and Creative, Culture &
Leisure companies up by 9.4% (up 135). The Manufacturing sector recorded a more
mixed outcome with Advanced Manufacturing showing continued declines. However,
the Clean Energy, Low Carbon & Hydrogen sector grew by 8.1% (up by 25 companies).
• The Tees Valley business birth rate picked up from 12.4% during 2017 to 13.6% in 2018.
In combination with a fall in the business death rate from 13.0% during 2017 to 11.8% in
2018, this supported the increase in total enterprises of 535 observed in the 12 months
to March 2019.
• Tees Valley had the second lowest business density rate – 64.8% of the UK rate – of any
English LEP area in 2019. However, this was a move up one place from 2018 when Tees
Valley was lowest.
• The number of Tees Valley high growth firms (HGFs), based on employment increase, has
been slowly declining over recent years. There were 85 HGFs in Tees Valley in 2018,
down from 100 in 2015. There are also relatively fewer HGFs in Tees Valley than
nationally on a per capita basis, with the Tees Valley HGF rate of 4.0% somewhat below
the UK rate of 5.0%.
• There were 255 Tees Valley scale-up firms in 2017 employing over 16,500 people with a
combined turnover of £1.8bn. UK scale-up firms have average turnover per employee of
around £380,000 – 3½ times the Tees Valley average of £108,500.
• Just 7.3% of Tees Valley firms demonstrated productivity growth between 2015 and
2018, the joint lowest rate of increase of any LEP.
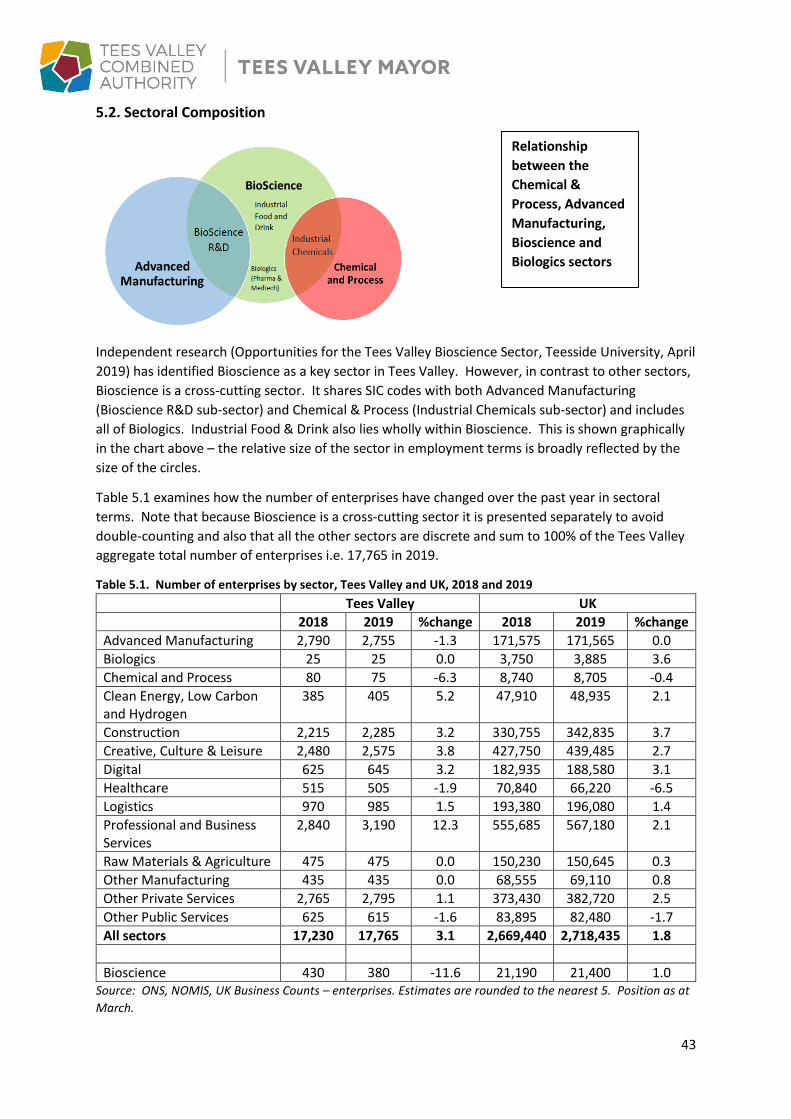
43
5.2. Sectoral Composition
Independent research (Opportunities for the Tees Valley Bioscience Sector, Teesside University, April
2019) has identified Bioscience as a key sector in Tees Valley. However, in contrast to other sectors,
Bioscience is a cross-cutting sector. It shares SIC codes with both Advanced Manufacturing
(Bioscience R&D sub-sector) and Chemical & Process (Industrial Chemicals sub-sector) and includes
all of Biologics. Industrial Food & Drink also lies wholly within Bioscience. This is shown graphically
in the chart above – the relative size of the sector in employment terms is broadly reflected by the
size of the circles.
Table 5.1 examines how the number of enterprises have changed over the past year in sectoral
terms. Note that because Bioscience is a cross-cutting sector it is presented separately to avoid
double-counting and also that all the other sectors are discrete and sum to 100% of the Tees Valley
aggregate total number of enterprises i.e. 17,765 in 2019.
Table 5.1. Number of enterprises by sector, Tees Valley and UK, 2018 and 2019
Tees Valley UK
2018 2019 %change 2018 2019 %change
Advanced Manufacturing 2,790 2,755 -1.3 171,575 171,565 0.0
Biologics 25 25 0.0 3,750 3,885 3.6
Chemical and Process 80 75 -6.3 8,740 8,705 -0.4
Clean Energy, Low Carbon and Hydrogen
385 405 5.2 47,910 48,935 2.1
Construction 2,215 2,285 3.2 330,755 342,835 3.7
Creative, Culture & Leisure 2,480 2,575 3.8 427,750 439,485 2.7
Digital 625 645 3.2 182,935 188,580 3.1
Healthcare 515 505 -1.9 70,840 66,220 -6.5
Logistics 970 985 1.5 193,380 196,080 1.4
Professional and Business Services
2,840 3,190 12.3 555,685 567,180 2.1
Raw Materials & Agriculture 475 475 0.0 150,230 150,645 0.3
Other Manufacturing 435 435 0.0 68,555 69,110 0.8
Other Private Services 2,765 2,795 1.1 373,430 382,720 2.5
Other Public Services 625 615 -1.6 83,895 82,480 -1.7
All sectors 17,230 17,765 3.1 2,669,440 2,718,435 1.8
Bioscience 430 380 -11.6 21,190 21,400 1.0 Source: ONS, NOMIS, UK Business Counts – enterprises. Estimates are rounded to the nearest 5. Position as at
March.
Relationship
between the
Chemical &
Process, Advanced
Manufacturing,
Bioscience and
Biologics sectors

44
Whilst the majority of priority sectors saw modest increases, Professional and Business Services saw
a significant increase of 350 net new firms, an increase of 12.3% on 2018.
Bioscience saw the greatest fall in both numerical and percentage terms, driven in large part by a 50
fall in the number of firms operating in Bioscience R&D and the Technical testing and analysis sub-
sector in particular. Reflecting challenging conditions and declining business investment in
associated manufacturing industries this broad sub-sector also saw significant falls nationally.
Despite recent decline, the interconnected Chemical & Process, Advanced Manufacturing and
Bioscience sectors remain highly concentrated within Tees Valley as detailed in the following section
re firm concentration.
However, it is worth noting that for smaller geographies such as for the Tees Valley, these sectoral
estimates in particular should be viewed with caution because of large volatility around
considerations such as multiple businesses registered at a single address, umbrella companies and
virtual offices. Indeed, the sector classification and location of individual businesses reflect the
management company / virtual offices’ rather than that of the individual business itself.
Sectoral firm concentration
The Tees Valley business base has relatively more firms concentrated in certain sectors than the
national sectoral business distribution might suggest. This is shown in Figure 5.1 below where the
sectors have a location quotient (LQ) or more than one. Those sectors where the Tees Valley has an
under-representation of businesses compared to the UK have an LQ of less than one.
Despite the decline in the number of Tees Valley Advanced Manufacturing enterprises, this sector
still has by far the highest concentration of firms in the country – two and half times that of the UK
average.
Source: ONS, NOMIS, UK Business Counts – enterprises
Key findings
▪ Tees Valley has relatively
more enterprises than the UK
in the following sectors:
o Bioscience
o Advanced Manufacturing
o Chemical and Process
o Clean Energy, Low Carbon
and Hydrogen
o Healthcare
o Other public services
o Other private services
o Construction
Figure 5.1. Business enterprises – Tees Valley Location Quotients

45
5.3. Scale of enterprises
Whilst the Tees Valley business base broadly reflects the national picture in terms of size measured
by number of employees, there are some slight differences.
Table 5.2. Structure of business base by size (number of employees) in 2019
Micro (0 to 9) Small (10 to 49) Medium (50 to 249) Large 250+
Tees Valley 87.8% 9.8% 1.9% 0.5%
UK 89.5% 8.6% 1.5% 0.4% Source: ONS, Business Counts – Enterprises
Tees Valley has relatively few micro firms employing fewer than ten employees but somewhat
higher rates of sole proprietors (17.3% are sole traders in Tees Valley compared to the UK’s 16.3%).
Sectors where Tees Valley has relatively high proportions of sole traders compared to nationally
include Creative, Culture & Leisure (21.2% of firms are sole traders), Logistics (20.3%) and Healthcare
(17.8%). Tees Valley has relatively low proportions of sole traders in Digital (1.6% of firms),
Bioscience (3.9%) and Advanced Manufacturing (4.9%).
Sectorally, Chemicals & Process and Healthcare are characterised by higher proportions of larger
companies. The Advanced Manufacturing, Digital and Construction sectors have the highest
proportions of micro firms.
Figure 5.2. Tees Valley sectors by employee size
Source: ONS, NOMIS, UK Business Counts – enterprises
In terms of firm size measured by turnover, Tees Valley has relatively more of those micro firms with
lower levels of annual turnover. This distribution of enterprises, particularly with regard to the
higher proportions of sole traders in Tees Valley, combined with the generally lower-skilled nature of
Tees Valley’s sectoral occupation profiles, means that the average annual turnover of a Tees Valley
SME is around 5% lower than UK rates.

46
Figure 5.3. Distribution of registered business enterprises by turnover band, Tees Valley, 2019
Source: ONS
Estimates of unregistered businesses are available at the regional level and these suggest there are
nearly one quarter more unregistered firms than registered firms in the North East of England.
At the start of 2019 and across the North East there were some 345 registered large firms, of which
90 were registered in Tees Valley (and 10,480 in the UK as a whole). Regionally, whilst making up
just 0.2% of businesses (registered plus unregistered), these firms account for 36.5% of total
employment and 43.4% of aggregate turnover.
Figure 5.4. Contribution of different sized businesses to total stock (registered and unregistered),
employment and turnover, North East of England, at start of 2019
Source: ONS
Key findings
▪ Tees Valley has relatively high
numbers (60.7% v 55.4% in UK)
of registered smaller
businesses with annual
turnover of between £50,000
and £200,000.
▪ There are fewer of the smallest
micro-enterprises (under £50k)
in Tees Valley (11.8% v 15.6%
in UK) and also slightly fewer
firms with turnover of £200k
plus (27.5% v 29.0% in UK).
Key findings
▪ Including unregistered
businesses, small firms
make up 99.1% of all firms
in the North East, account
for 49.3% of total
employment and 36.0% of
aggregate turnover. ▪ BEIS & ONS estimate that
regionally there are more
unregistered firms without
employees (55% of total)
than registered employers
(27%) or registered firms
without employees (18%).
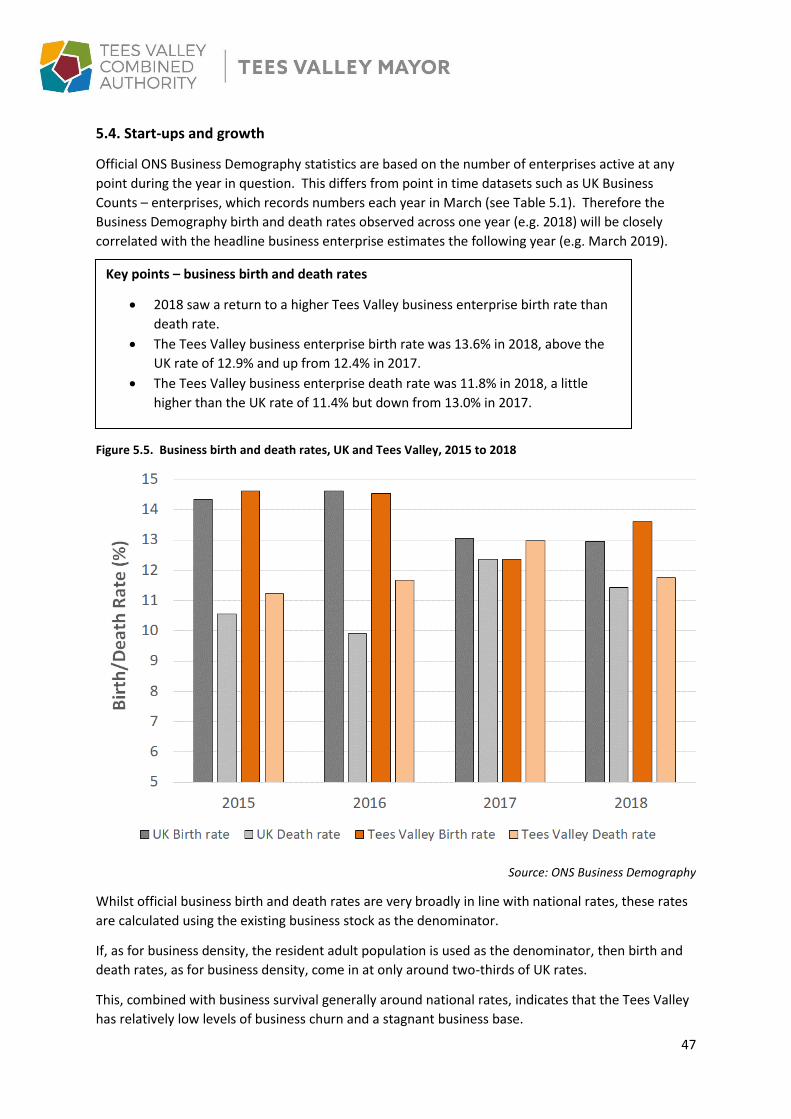
47
5.4. Start-ups and growth
Official ONS Business Demography statistics are based on the number of enterprises active at any
point during the year in question. This differs from point in time datasets such as UK Business
Counts – enterprises, which records numbers each year in March (see Table 5.1). Therefore the
Business Demography birth and death rates observed across one year (e.g. 2018) will be closely
correlated with the headline business enterprise estimates the following year (e.g. March 2019).
Figure 5.5. Business birth and death rates, UK and Tees Valley, 2015 to 2018
Source: ONS Business Demography
Whilst official business birth and death rates are very broadly in line with national rates, these rates
are calculated using the existing business stock as the denominator.
If, as for business density, the resident adult population is used as the denominator, then birth and
death rates, as for business density, come in at only around two-thirds of UK rates.
This, combined with business survival generally around national rates, indicates that the Tees Valley
has relatively low levels of business churn and a stagnant business base.
Key points – business birth and death rates
• 2018 saw a return to a higher Tees Valley business enterprise birth rate than
death rate.
• The Tees Valley business enterprise birth rate was 13.6% in 2018, above the
UK rate of 12.9% and up from 12.4% in 2017.
• The Tees Valley business enterprise death rate was 11.8% in 2018, a little
higher than the UK rate of 11.4% but down from 13.0% in 2017.

48
Figure 5.6. Business survival rates, UK and Tees Valley, business births from 2013 to 2017
Source: ONS
High Growth Businesses
The number of high growth firms (HGFs) in Tees Valley has been declining over recent years.
Business Demography statistics record HGFs as firms with 10 or more employees and an average
growth in employment of greater than 20% per year over a three year period. On this measure the
number of Tees Valley HGFs fell year on year from 100 in 2015 to 85 in 2018. From having a high
growth firm rate of 5.0% in 2015 (UK 4.5%), the Tees Valley HGF rate of 4.0% is now below the UK
rate of 5.0%.
Key findings – business survival rates
▪ There has been a gradual deterioration in business survival rates since 2013 both nationally
and in Tees Valley. Survival rates have generally fallen faster in Tees Valley than nationally.
▪ Business survival rates in Tees Valley compare favourably to the UK for the first couple of
years. However, longer term survival rates (3 years onwards) in Tees Valley have fallen
away from a position of at least parity with the UK in 2013. For example, just 54.0% of Tees
Valley businesses born in 2015 survived for three years (UK rate 55.3%) compared to 63.4%
for those born in 2013 (UK rate 60.9%).
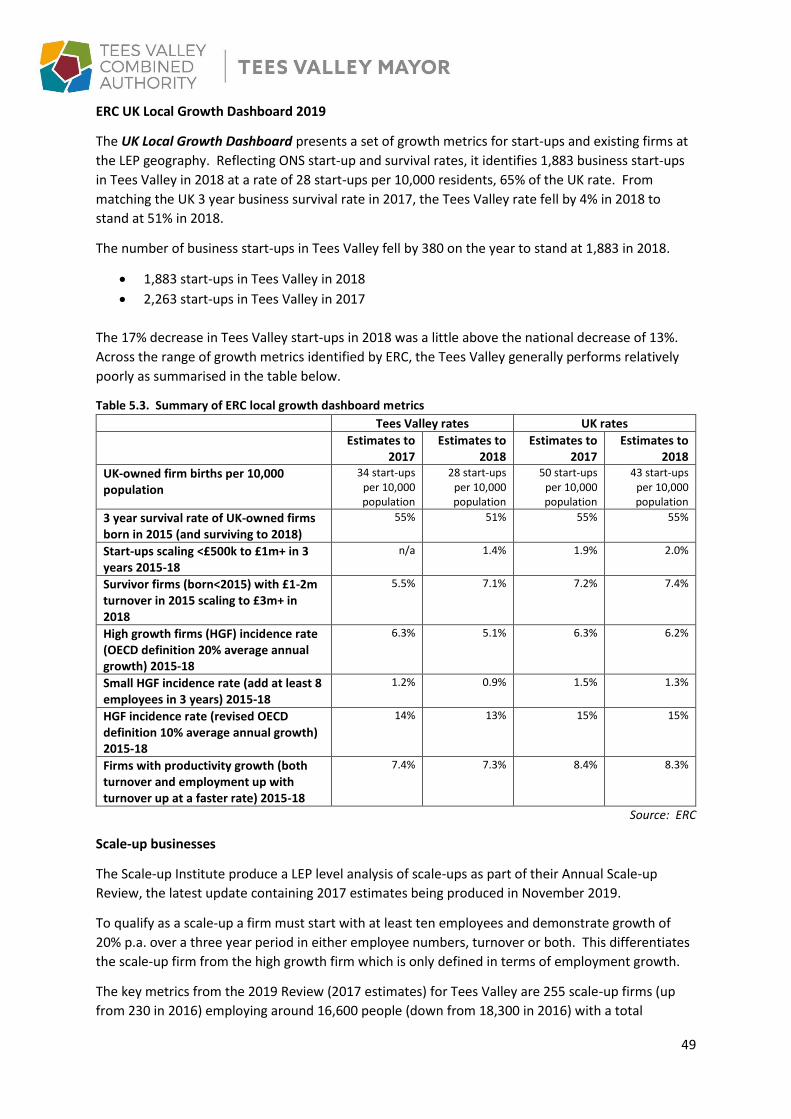
49
ERC UK Local Growth Dashboard 2019
The UK Local Growth Dashboard presents a set of growth metrics for start-ups and existing firms at
the LEP geography. Reflecting ONS start-up and survival rates, it identifies 1,883 business start-ups
in Tees Valley in 2018 at a rate of 28 start-ups per 10,000 residents, 65% of the UK rate. From
matching the UK 3 year business survival rate in 2017, the Tees Valley rate fell by 4% in 2018 to
stand at 51% in 2018.
The number of business start-ups in Tees Valley fell by 380 on the year to stand at 1,883 in 2018.
• 1,883 start-ups in Tees Valley in 2018
• 2,263 start-ups in Tees Valley in 2017
The 17% decrease in Tees Valley start-ups in 2018 was a little above the national decrease of 13%.
Across the range of growth metrics identified by ERC, the Tees Valley generally performs relatively
poorly as summarised in the table below.
Table 5.3. Summary of ERC local growth dashboard metrics
Tees Valley rates UK rates
Estimates to 2017
Estimates to 2018
Estimates to 2017
Estimates to 2018
UK-owned firm births per 10,000 population
34 start-ups per 10,000 population
28 start-ups per 10,000 population
50 start-ups per 10,000 population
43 start-ups per 10,000 population
3 year survival rate of UK-owned firms born in 2015 (and surviving to 2018)
55% 51% 55% 55%
Start-ups scaling <£500k to £1m+ in 3 years 2015-18
n/a 1.4% 1.9% 2.0%
Survivor firms (born<2015) with £1-2m turnover in 2015 scaling to £3m+ in 2018
5.5% 7.1% 7.2% 7.4%
High growth firms (HGF) incidence rate (OECD definition 20% average annual growth) 2015-18
6.3% 5.1% 6.3% 6.2%
Small HGF incidence rate (add at least 8 employees in 3 years) 2015-18
1.2% 0.9% 1.5% 1.3%
HGF incidence rate (revised OECD definition 10% average annual growth) 2015-18
14% 13% 15% 15%
Firms with productivity growth (both turnover and employment up with turnover up at a faster rate) 2015-18
7.4% 7.3% 8.4% 8.3%
Source: ERC
Scale-up businesses
The Scale-up Institute produce a LEP level analysis of scale-ups as part of their Annual Scale-up
Review, the latest update containing 2017 estimates being produced in November 2019.
To qualify as a scale-up a firm must start with at least ten employees and demonstrate growth of
20% p.a. over a three year period in either employee numbers, turnover or both. This differentiates
the scale-up firm from the high growth firm which is only defined in terms of employment growth.
The key metrics from the 2019 Review (2017 estimates) for Tees Valley are 255 scale-up firms (up
from 230 in 2016) employing around 16,600 people (down from 18,300 in 2016) with a total

50
turnover of £1.8bn (unchanged on 2016). Additionally, the average annual change in Tees Valley
scale-ups per 100k population has increased from just 0.4% for 2013-16 to 1.4% for 2014-17.
However, this is the lowest rate of all the LEPs by some margin and just one third of the LEP median
increase of 4.2% p.a.
The qualifying characteristic of the Tees Valley’s 255 scale-up firms are identified in the Venn
diagram below.
The Scaleup Index 2019 report also identifies individual scale-up companies by LEP area. The table
below identifies the Tees Valley scale-ups identified in this report.
Table 5.4. Tees Valley Scaleups
Darlington -Fisher Outdoor Leisure -HMC Group -Modus Seabed Intervention -Subsea Innovation -The Almit Group -The Feel Good Group -Total Recycling Services -Ward Bros (Steel)
Hartlepool -Camerons Brewery -Deepdale Solutions -Gus Robinson Developments -Niramax
Middlesbrough -AV Dawson -Applebridge Construction -CIS Northern -Cleveland Cable Company -Derek Slack Motors -Greencroft Milk Supplies -JT Atkinson -QA Weld Tech -Ramsdens -Whitehead Alloys -Wilton Engineering Services
Redcar & Cleveland -C.J. Leonard & Sons -Applied Graphene Materials -Coopers Chemists -Isotank Group -Tees Components
Stockton-on-Tees -Alexanders Motor Group -BMSL Group -Cavendish Northern -Cleveland Meat Co -Communicate Technology PLC -Country Valley Foods -Direct Line Supplies -Idec Group -LJJ Ltd -Magnum Packaging -Mandale Group -MAP Group -Nifco UK -PX Group -Scott Bros -Wearmouth Construction & Plant -Wynyard Hall
Source: The Scaleup Index 2019, Scaleup Institute and Beauhurst
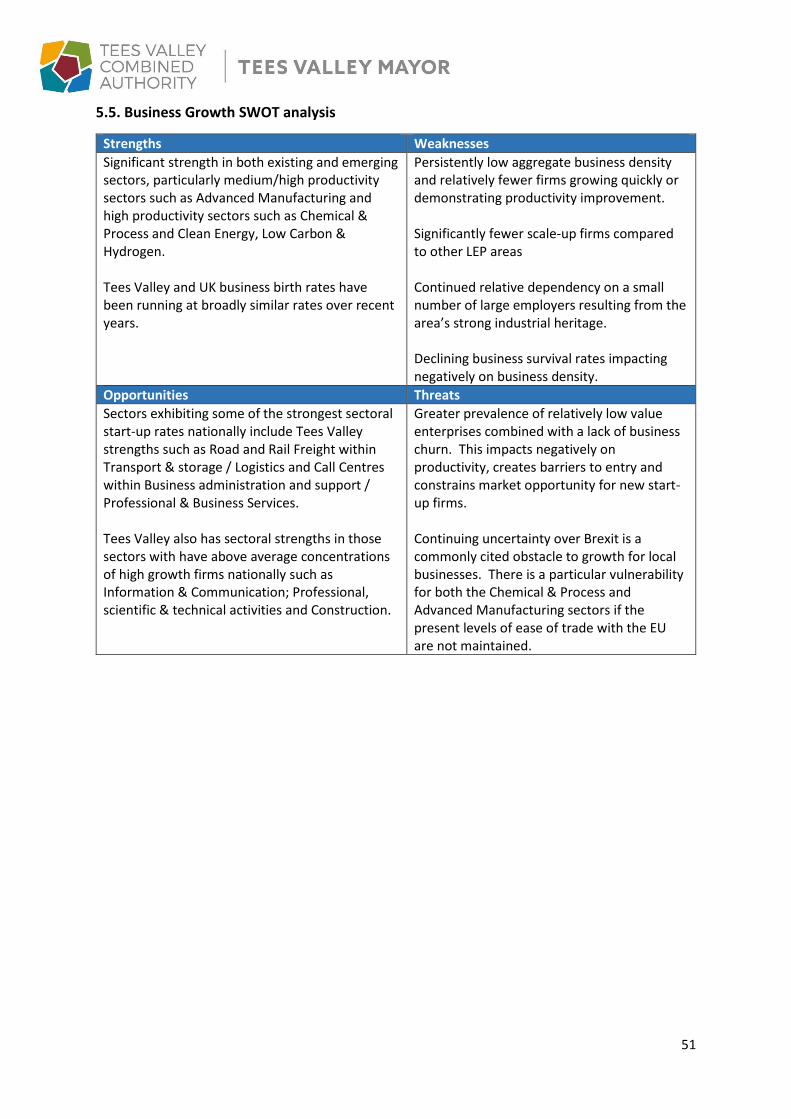
51
5.5. Business Growth SWOT analysis
Strengths Weaknesses
Significant strength in both existing and emerging sectors, particularly medium/high productivity sectors such as Advanced Manufacturing and high productivity sectors such as Chemical & Process and Clean Energy, Low Carbon & Hydrogen. Tees Valley and UK business birth rates have been running at broadly similar rates over recent years.
Persistently low aggregate business density and relatively fewer firms growing quickly or demonstrating productivity improvement. Significantly fewer scale-up firms compared to other LEP areas Continued relative dependency on a small number of large employers resulting from the area’s strong industrial heritage. Declining business survival rates impacting negatively on business density.
Opportunities Threats
Sectors exhibiting some of the strongest sectoral start-up rates nationally include Tees Valley strengths such as Road and Rail Freight within Transport & storage / Logistics and Call Centres within Business administration and support / Professional & Business Services. Tees Valley also has sectoral strengths in those sectors with have above average concentrations of high growth firms nationally such as Information & Communication; Professional, scientific & technical activities and Construction.
Greater prevalence of relatively low value enterprises combined with a lack of business churn. This impacts negatively on productivity, creates barriers to entry and constrains market opportunity for new start-up firms. Continuing uncertainty over Brexit is a commonly cited obstacle to growth for local businesses. There is a particular vulnerability for both the Chemical & Process and Advanced Manufacturing sectors if the present levels of ease of trade with the EU are not maintained.

52
Section 6: Research & Development, Innovation and Energy
This section provides a summary of the Tees Valley R&D, Innovation and Energy environment and
compares metrics with other LEPs, regions and the country as a whole. It provides evidence to
understand the role of innovation in Tees Valley, and to support an increase in innovation as a key
driver of economic growth.
The inclusion of Energy within this section, reflects the region’s ambition to be a global lead for clean
energy, low carbon and hydrogen, through an innovation-led agenda.
The Tees Valley economy has key strengths in the chemicals and process industries, offshore
engineering and advanced manufacturing, where we compete in global markets. Innovation, in its
various forms, is fundamental to ensuring that these industries remain competitive – whilst also
helping to move all of our sectors up the value chain to drive productivity growth.
The area benefits from a strong network of established innovation assets, which reflect our current
and emerging sector strengths, including:
➢ Centre for Process Innovation: the national Catapult Centre for the UK chemical and bioscience
sectors and a member of the High Value Manufacturing Catapult;
➢ The Materials Processing Institute: an internationally recognised research facility focussing on
the development of materials and the commercialisation of technologies for industrial
processes; and
➢ TWI: a global leader in materials research and engineering processes, with hydrogen supply
chain expertise.
Teesside University is well integrated into the regional innovation system, particularly in relation to
the digital and bioscience sectors (through DigitalCity and the National Horizons Centre respectively)
and more generally through academic-business knowledge exchange.
Significant recent investment has strengthened our innovation capabilities in biosciences. This will
create a platform from which to accelerate the growth of this emerging sector specialism moving
forwards and includes the delivery of:
➢ The Centre for Process Innovation’s National Biologics Manufacturing Centre: supporting the
growth and development of the UK bioscience industry and supply chain, with a focus on the
commercialisation of emerging technologies; and
➢ Teesside University’s National Horizons Centre: a state-of-the art education, training,
research and innovation facility based on partnership with the Centre for Process Innovation
and FUJIFILM Diosynth Biotechnologies.
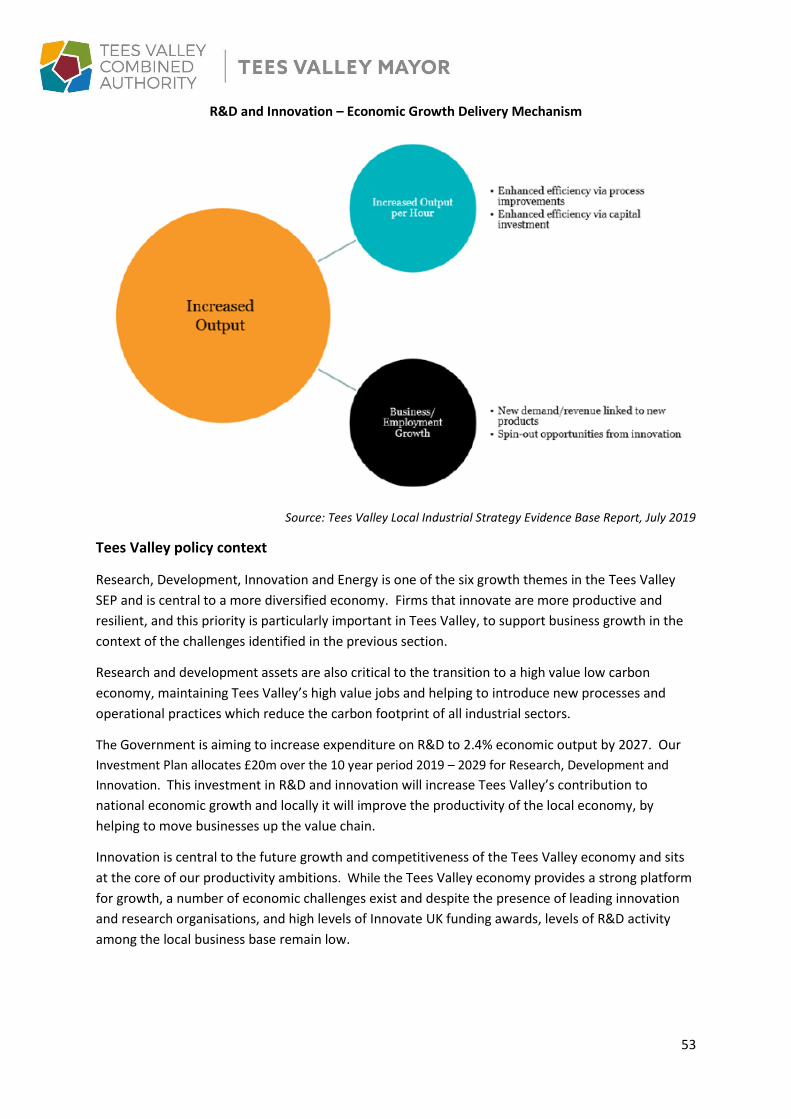
53
R&D and Innovation – Economic Growth Delivery Mechanism
Source: Tees Valley Local Industrial Strategy Evidence Base Report, July 2019
Tees Valley policy context
Research, Development, Innovation and Energy is one of the six growth themes in the Tees Valley
SEP and is central to a more diversified economy. Firms that innovate are more productive and
resilient, and this priority is particularly important in Tees Valley, to support business growth in the
context of the challenges identified in the previous section.
Research and development assets are also critical to the transition to a high value low carbon
economy, maintaining Tees Valley’s high value jobs and helping to introduce new processes and
operational practices which reduce the carbon footprint of all industrial sectors.
The Government is aiming to increase expenditure on R&D to 2.4% economic output by 2027. Our
Investment Plan allocates £20m over the 10 year period 2019 – 2029 for Research, Development and
Innovation. This investment in R&D and innovation will increase Tees Valley’s contribution to
national economic growth and locally it will improve the productivity of the local economy, by
helping to move businesses up the value chain.
Innovation is central to the future growth and competitiveness of the Tees Valley economy and sits
at the core of our productivity ambitions. While the Tees Valley economy provides a strong platform
for growth, a number of economic challenges exist and despite the presence of leading innovation
and research organisations, and high levels of Innovate UK funding awards, levels of R&D activity
among the local business base remain low.

54
6.1. Innovation in Tees Valley
The Enterprise Research Centre (ERC) has updated their benchmarking innovation in local areas
report. This report, published in June 2019, benchmarks the innovation performance of all LEP areas
against nine different measures of innovation. Its indicators are directly comparable with those in
the previous edition (published May 2017) of the report. The latest (2019) report analyses data from
the UK Innovation Survey of 2017, which relates to firms’ innovation activity during the three-year
period from 2014 to 2016. The 2017 report examined the UK Innovation Survey of 2015 and
covered the period between 2012 and 2014.
Key messages
• R&D expenditure across the Tees Valley business base is relatively low compared to
other parts of the country. However, the latest regional data for 2018 suggests the
North East has demonstrated the fastest rate of business expenditure on R&D (BERD)
growth in the UK over the past two years, increasing by 42% from 2016 to 2018.
• If monies allocated to the Catapult are excluded Tees Valley received the second lowest
amount of UK Research and Innovation grants to all LEPs between 2014 and 2018, at
£8.3m.
• Regionally, North East businesses spend relatively more on R&D compared with
nationally in the Mechanical Engineering, Chemicals and Services sectors.
• A very small percentage of firms claim R&D Tax Credit relief. However, with 1.4% of local
firms making a claim in 2016-17, the rate in Tees Valley was broadly similar to the
national average.
• Reflecting a broad-based deterioration in firm level innovation, Tees Valley businesses
typically scored below the LEP average across a range of innovation indicators. They did
however score relatively well (42% of firms engaged in the activity) on Sales of
innovation products/services. This important innovation indicator reflects the success
and commercialisation of innovation activity.
• Teesside University ranks 9th highest of all English HE institutions for the number of
successful surviving graduate start-up businesses – a proxy indicator for innovative
activity – still active three years after inception.

55
Table 6.1. Tees Valley Innovation Scores, 2017 and 2019
Lowest LEP score
Median LEP score
Highest LEP score
Tees Valley score
2017 2019 2017 2019 2017 2019 2017 2019
Organisational and Marketing Innovation strand
New business practices 17% 12% 28% 24% 38% 39% 23% 20%
New methods of work organisation
11% 13% 21% 19% 28% 29% 21% 19%
Marketing innovation 11% 9% 17% 14% 27% 23% 20% n/a
Structure and Approach to Innovation strand
Engaged in R&D 12% 13% 19% 22% 31% 40% 17% n/a
Design investment 8% 6% 13% 13% 20% 20% 11% n/a
Collaboration 17% 21% 25% 31% 39% 48% 29% 21%
Outcomes/Success of Innovation strand
Product and service innovation
14% 21% 22% 25% 34% 38% 18% 21%
Sales of innovative products/services
9% 18% 31% 37% 45% 50% 32% 42%
Process innovation 8% 13% 16% 18% 26% 29% 17% 13% Source: Enterprise Research Centre. Percentages indicate proportion of firms engaged in identified innovation
activity. n/a – estimate not available.
The table shows that Tees Valley firms generally score below the LEP average on the majority of
indicators. However, a notable exception is the ‘Sales of innovative products / services’ indicator
where Tees Valley firms rank well above the national average. In addition, the proportion of local
firms undertaking this form of innovation has increased significantly. It is also worth noting that ERC
states that the ‘Outcomes / Success of Innovation’ strand of the analysis – which includes sales of
innovative products / services – is arguably the most important of the three strands as it reflects the
success and commercialisation of innovation activity.
6.2. R&D Tax Credits
R&D tax credits are a tax relief designed to encourage greater R&D spending, leading in turn to
greater investment in innovation. Their take-up is an indicator of innovation activity. The chart
below shows a concentration of companies registered in London and the wider south east of
England that are claiming these R&D tax credits. The North East accounted for 1,615 claims (3.4% of
total UK claims) totalling £85m (2.0% of total UK amount claimed). Note that these 2017-18 are
provisional and partial and liable to upward revision next year.

56
Figure 6.1. Registered office regional analysis of R&D tax credit claims, 2017-18
Source: HMRC R&D Tax Credits Statistics, October 2019
Sub-regional R&D tax credit statistics are now also available for 2016-17. Of the identifiable 1,370
claims at local authority level, 250 were identifiable as Tees Valley claims. This represents around
1.4% of Tees Valley firms, marginally lower than the UK rate of 1.5%.
6.3. Business Expenditure on Research & Development (BERD)
Regionally, 2018 estimates are now available through ONS. North East BERD was up from £388m in
2017 to stand at £443m in 2018, an increase of £55m or 14.2% and second only to the East Midlands
in terms of growth. This is the second year year of strong NE BERD growth in a row. North East
BERD has grown by 42% in the past two years, the highest rate of any region/country and four times
the UK rate of increase.
In terms of regional BERD per FTE (full-time equivalent worker), the North East comes in at just less
than half of the national rate (North East £409 per FTE, England £851 per FTE). Applying the North
East rate to the number of Tees Valley FTEs gives an estimated Tees Valley BERD of £108m in 2018.
Chart 6.1 below summarises North East BERD spend by broad product grouping.
Key points
• The three largest product groups in terms of BERD in the North East were Services
(£155m), Chemicals (£126m) and Mechanical Engineering (£47m).
• These three groups, plus Other manufacturing and Electricity, gas & water supply; Waste
management (within Utilites and other), all accounted for higher proportions of total
BERD than was the case nationally.

57
Figure 6.2. North East BERD by broad product group, £m, 2018
Source: ONS Research and Development in UK Businesses, 2018
6.4. Research and Business Interaction in Innovation
Graduate start-ups are businesses set up by university graduates typically generating innovative
products or processes and linking research specialisms and business opportunities. With 149 active
start-up enterprises (that have survived for three years) founded by graduates who studied at
Teesside University, this puts the institution 9th highest out of 134 English HE providers (Source:
HEBCI 2017/18).
6.5. Innovate UK grants
Reflecting our sectoral strengths in Advanced Manufacturing, Chemicals & Process and Clean Energy,
Low Carbon & Hydrogen, Tees Valley has received above average allocations of Innovate UK grant
funding across High Value Manufacturing, Electronics, Photonics and Electrical Systems, Urban Living
and Emerging Technologies as shown in the table below.

58
Table 6.2. Grants offered by Innovate UK from 2014/15 to March 2018, Tees Valley
Value of grants offered (£)
Location Quotient (LEP average = 1)
High Value Manufacturing 6,522,061 3.81
Urban Living 1,500,000 1.56
Healthcare 1,200,741 0.32
Energy 722,260 0.17
Electronics, Photonics and Electrical Systems 700,821 1.96
Emerging Technologies 606,027 1.07
Development 445,300 0.42
Aerospace 254,882 0.01
Transport 242,902 0.04
Materials & Manufacturing 138,802 0.16
Infrastructure 114,491 0.11
Advanced Materials 89,295 0.60
Food Supply 64,626 0.05
Life Science 52,725 0.10
Total 12,654,933 0.26 Source: Smart Specialisation Hub, Innovate UK
Figures show that UK Research and Innovation awarded grants of £230.1m over the last five years
(2014-2018) within Tees Valley, however £221.8m of the total was allocated to the Catapult. The
remaining £8.3m accounted for 4% of the total grants awarded to Tees Valley over the period and
was the second lowest of all LEPs.
Figure 6.3. Percentage of Total Research and Innovation Grants allocated to Catapults
Source: UK Research and Innovation
6.6. Absorptive capacity
Higher absorptive capacity i.e. the ability to internalise external knowledge and thus benefit from
knowledge spill-overs, increases the likelihood of firms’ innovating as well as having more general
positive effects on productivity and competitiveness, as firms assimilate knowledge from the
59
external environment in which they operate. Absorptive capacity is very important in determining
whether a firm undertakes productivity-enhancing activities such as investing in R&D, exporting
and/or innovating. Moreover, if firms are not able to learn, and hence gather and make effective
use of information from outside the firm, then industrial strategies designed to help firms become
more productive are likely to have only a limited impact.
Mirroring the Tees Valley’s relatively poor performance in R&D, research (R. Harris, Durham
University) suggests that the area ranks as one of the lowest in terms of average rates for absorptive
capacity at 37th out of 39 LEPs.
6.7. Innovation and Energy
The development of a Carbon Capture, Utilisation and Storage (CCUS) network is a key element in
the Tees Valley’s innovative approach as part of our Clean Energy / Clean Growth Programme. By
removing CO2 from hydrogen production via a CCUS network we can cost-effectively be the main
supplier of low-carbon fuel to the UK.
Carbon Capture and Storage
Deployment of Carbon Capture and Storage for industry in the Tees Valley offers significant
opportunity to significantly reduce emissions both locally and nationally. The Committee on Climate
Change recognise the work that has been progressed by the Teesside Collective and have repeatedly
concluded that Industrial CCS is necessary if the UK is to meet its legal obligations under the Climate
Change Act 2008.
Tees Valley is ideally placed to generate significant economic growth and substantial CO2 savings
simultaneously through the implementation of CCS, the development of CCU and related
technologies and through building on other sub-sectoral strengths such as Energy from Waste,
Biomass and Biofuels. Statistics on carbon emissions and industrial energy costs are included under
the Place section of the report on page 124.

60
6.8. Research & Development, Innovation and Energy SWOT analysis
Strengths Weaknesses
Nationally recognised regional vision and ambition to establish Tees Valley as a global leader in clean energy, low carbon and hydrogen. A strong role for Tees Valley working with Northern LEPs in leading the agenda at a pan-Northern level Strong innovation assets including centres of excellence and innovation centres. Nationally recognised, wide-ranging strength across Clean Energy, Low Carbon & Hydrogen sub-sectors including Energy from Waste, Biomass and Biofuels. Up-to-date technical expertise across existing workforce and through local technical training provision. Good and improving firm level record in the commercialisation of innovative products and services.
Relatively low levels of business expenditure on Research & Development. Branch plant economy impacting negatively on the capacity to take forward innovation within Tees Valley. Relatively poor performance across many innovation metrics suggests significant scope for further investment across all aspects of the Tees Valley innovation ecosystem.
Opportunities Threats
The South Tees Development Corporation site will pose an additional opportunity to attract innovative high value manufacturing, along with existing industrial sites such as TAMP. Geography and geology allied with existing industrial infrastructure places the Tees Valley as the ideal location for the development of low carbon generation, offshore wind and CCUS, allowing retraining for qualified offshore personnel to change career path into renewables industries and technologies. Strong local graduate business start-up culture with potential to deliver products and services to the developing Clean Energy, Low Carbon and Hydrogen sector. National funding opportunities resulting from Government target of 2.4% of economic output to be spent of R&D 2027. Business spread across a small physical region has resulted in a close community that discusses, shares and cooperates well across many platforms and disciplines. Local knowledge sharing is well developed.
High cost of energy, particularly electricity, impacted on the requirements to cease gas provision to new homes from 2025. Lack of critical SME business mass in many sectors associated with significant constraints on firms’ innovation absorptive capacity. Present political uncertainty impacting on FDI and international collaborative working on Science and Innovation. Lack of certainty regarding possible future clean air zones across the region for both transport and business emissions, and the financial impact this may have. Lack of well-advertised funding streams for SME’s looking to lower their energy use and emissions outputs.

61
Section 7: Education, Employment and Skills
Education, Employment and Skills are key drivers in the local economy. They have an important role
to play in improving workforce productivity and boosting earning power for all. Access to an
appropriately skilled and qualified workforce is essential if we are to meet the growth needs of
existing businesses and is an important factor for businesses considering where to invest. Having
the right skills mix also helps to boost levels of economic activity and ensures that residents are able
to access local employment opportunities.
Therefore, a skilled workforce is a fundamental requirement for the Tees Valley to maximise its
economic potential, overcome challenges, support the creation of 25,000 new jobs and meet the
significant replacement job demand needed over the next decade. There is also a need for
businesses to sustain current activities through improved workforce planning and skills
development.
This section seeks to provide analysis to inform our understanding of the local labour market, which
will help shape our priorities and interventions in order to increase local labour market activity and
support productivity gains.
People and Skills - Economic Growth Delivery Mechanism
Source: Tees Valley Local Industrial Strategy Evidence Base Report, July 2019

62
Key messages
• Tees Valley primary schools achieve above average Key Stage 2 results across all subject areas, with
females consistently outperforming males. However results have fallen slightly over the last year. The
quality of Tees Valley Primary schools is high with consistently above average Ofsted results.
• The quality and attainment levels of Tees Valley secondary schools are below the national average, with
females continuing to outperform males. Tees Valley is below national average for secondary
achievement in English Baccalaureate subjects, with a particular fall in English and Maths achievement
over the past year, compared to a very slight fall nationally.
• Tees Valley has good quality Post 16 skills provision. Although A Level results are slightly below national
average, overall achievement and pass rates for 16-18 year olds at Tees Valley FE+ colleges are higher
than national.
• Participation in Higher Education is above national average. However achievement rates are slightly
below average, with graduates less likely to be in employment 6 months after graduating and the number
finding employment within Tees Valley falling year on year for the past 5 years.
• The number of residents with higher level skills is below average with little improvement being seen over
the past 3 years. Tees Valley has a higher than average number of residents with no qualifications, which
has risen since 2016 compared to a fall nationally.
• Whilst the percentage of 16-34 year olds starting an apprenticeship is higher than the national level,
apprenticeship starts have fallen by 37% over the last 3 years compared to a 23% drop nationally, with
the number of 16-18 year olds starting an apprenticeships falling further over the past year.
Apprenticeship achievement rates are consistently higher than the national average, with the exception
of Higher Apprenticeships.
• Tees Valley consistently has a lower than average job density (number of jobs per population) with a
higher than average number of resident’s unemployed and seeking work. However unemployment has
fallen by more than the national average over the past 5 years.
• Youth unemployment is a particular issue with a higher than average number of 16-24 year olds
unemployed and claiming benefits. The area also has a high number of 16-17 year olds NEET (Not in
Education, Employment or Training).
• Tees Valley has a high number of people classed as economically inactive (neither "employed" nor
"unemployed", for example those who are long-term sick, students or retired). In particular high
numbers of those both long term and temporarily sick.
• Employment is high in Education, Retail, Healthcare, Professional and Business Services and Creative,
Culture and Leisure. Tees Valley also has sectoral strengths in: Chemical and Process; Raw Materials and
Agriculture (which includes Bioscience); Advanced Manufacturing and Clean Energy and Low Carbon.
• There is currently high job demand for teachers, carers, nurses, engineers, IT professionals and
teaching/nursery assistants with local employers reporting skills shortages in IT, Construction, Education
and Manufacturing amongst others.
• Wages are lower than average. Although this is attractive to investors, it can discourage workers from
remaining in the area and the amount of disposable income available to households in Tees Valley is
much lower than national.
• There are 133,000 jobs that may need filling by 2024, including 17,000 new jobs and 116,000 replacement
jobs, with over a half requiring high level skills. There will still be high demand for intermediate and lower
level skills, particularly in replacement jobs.
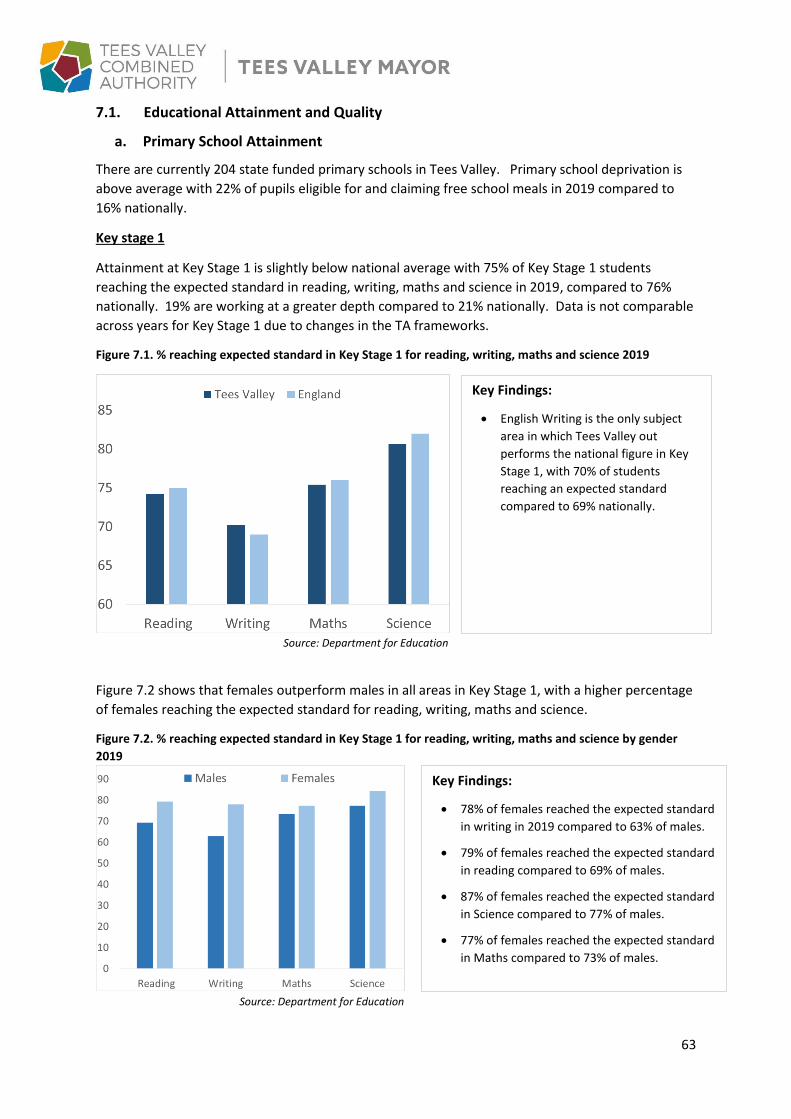
63
Key Findings:
• English Writing is the only subject
area in which Tees Valley out
performs the national figure in Key
Stage 1, with 70% of students
reaching an expected standard
compared to 69% nationally.
Key Findings:
• 78% of females reached the expected standard
in writing in 2019 compared to 63% of males.
• 79% of females reached the expected standard
in reading compared to 69% of males.
• 87% of females reached the expected standard
in Science compared to 77% of males.
• 77% of females reached the expected standard
in Maths compared to 73% of males.
7.1. Educational Attainment and Quality
a. Primary School Attainment
There are currently 204 state funded primary schools in Tees Valley. Primary school deprivation is
above average with 22% of pupils eligible for and claiming free school meals in 2019 compared to
16% nationally.
Key stage 1
Attainment at Key Stage 1 is slightly below national average with 75% of Key Stage 1 students
reaching the expected standard in reading, writing, maths and science in 2019, compared to 76%
nationally. 19% are working at a greater depth compared to 21% nationally. Data is not comparable
across years for Key Stage 1 due to changes in the TA frameworks.
Figure 7.1. % reaching expected standard in Key Stage 1 for reading, writing, maths and science 2019
Source: Department for Education
Figure 7.2 shows that females outperform males in all areas in Key Stage 1, with a higher percentage
of females reaching the expected standard for reading, writing, maths and science.
Figure 7.2. % reaching expected standard in Key Stage 1 for reading, writing, maths and science by gender
2019
Source: Department for Education

64
Key Findings:
• 74% of students reached the expected
standard for Reading, compared to 73%
nationally.
• 79% reached the expected standard for
Grammar, punctuation and spelling,
compared to 78% nationally.
• 81% reached the expected standard for
maths, compared to 79% nationally.
Key Findings:
• 67% of Key Stage 2 students are reaching an
expected standard in reading, writing and maths
in 2019 compared to 65% nationally.
• This has risen 13% since 2016 compared to an
11% rise both nationally and across the North of
England.
• However the past year has seen a 1% fall both in
Tees Valley and across the North of England
whilst nationally figures remained the same.
• 10% of Key Stage 2 students are reaching an
higher standard in reading, writing and maths in
2019, which matches the national figure.
• This has risen 4.4% since 2016 compared to an
5% rise both nationally and across the North of
England.
• The past year has seen a 1% rise both in Tees
Valley and across the North of England whilst
nationally figures remained the same.
Key stage 2
Figures 7.3 and 7.4 illustrate that Tees Valley primary schools are above the national average for Key
Stage 2 expected attainment and match the national average for the percentage reaching a higher
standard.
Figure 7.3. % reaching expected standard in Key Stage 2 for reading, writing and maths 2019
Figure 7.4. % reaching higher standard in Key Stage 2 for
reading, writing and maths 2019
Source: Department for Education
Figure 7.5 shows that Tees Valley outperformed the national in all subject areas for the percentage
reaching the expected standard in Key Stage 2 in 2019.
Figure 7.5. % reaching expected standard in Key Stage 2 by subject - 2019
Source: Department for Education
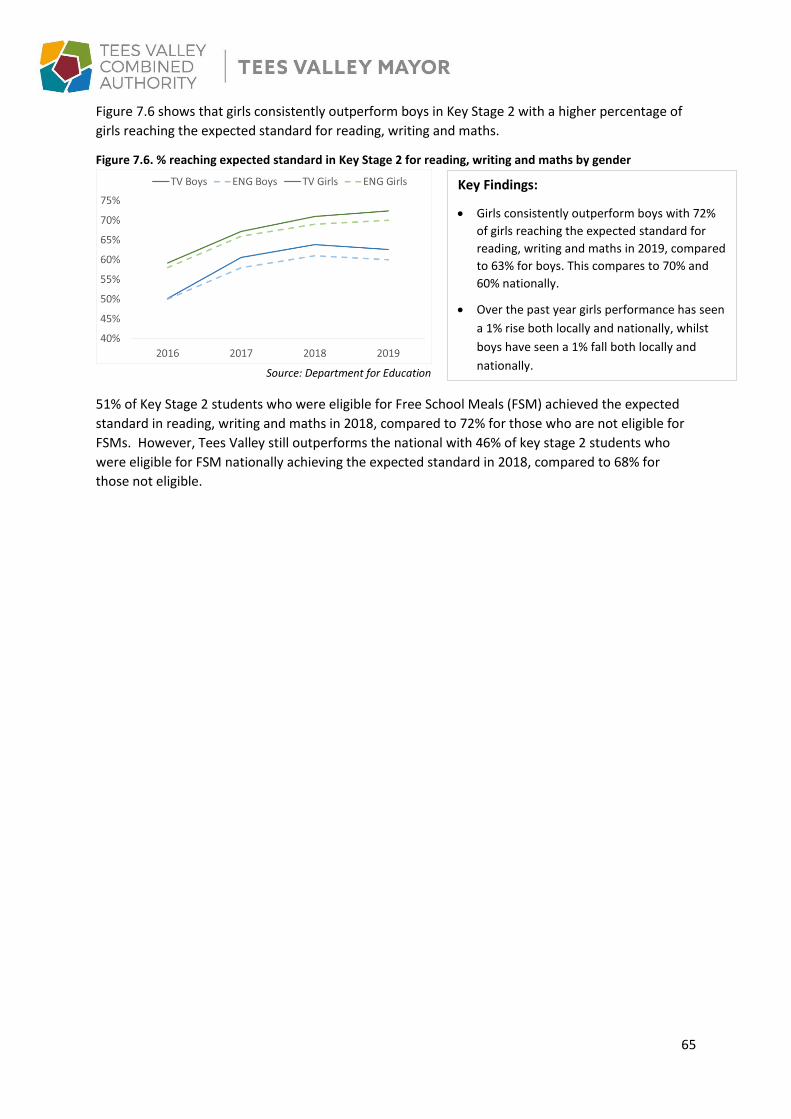
65
Key Findings:
• Girls consistently outperform boys with 72%
of girls reaching the expected standard for
reading, writing and maths in 2019, compared
to 63% for boys. This compares to 70% and
60% nationally.
• Over the past year girls performance has seen
a 1% rise both locally and nationally, whilst
boys have seen a 1% fall both locally and
nationally.
Figure 7.6 shows that girls consistently outperform boys in Key Stage 2 with a higher percentage of
girls reaching the expected standard for reading, writing and maths.
Figure 7.6. % reaching expected standard in Key Stage 2 for reading, writing and maths by gender
Source: Department for Education
51% of Key Stage 2 students who were eligible for Free School Meals (FSM) achieved the expected
standard in reading, writing and maths in 2018, compared to 72% for those who are not eligible for
FSMs. However, Tees Valley still outperforms the national with 46% of key stage 2 students who
were eligible for FSM nationally achieving the expected standard in 2018, compared to 68% for
those not eligible.

66
Key Findings:
• The average Attainment 8 score per
pupil in 2019 was 44.1 compared to
46.5 nationally. This varies from 41.4
in Middlesbrough to 46.4 in
Darlington.
• Average Attainment 8 scores have
fallen by 2.5 points over the last 4
years from 46.6 in 2015 to 44.1 in
2019. Nationally figures have dropped
by 2.1 points from 48.6 to 46.5.
• 39.6% of Tees Valley secondary pupils
achieved a 9-5 pass in English and
Maths in 2019, compared to 43%
nationally. This has fallen by 2.1
percentage points over the last year
whilst nationally levels have fallen by
0.5.
• The average Progress 8 score for Tees
Valley secondary school pupils in 2019
was -0.29 compared to -0.15 for the
North of England.
b. Secondary attainment
There are currently 43 secondary schools in Tees Valley. Secondary school deprivation is above
average with 21% of pupils eligible for and claiming free school meals in 2019 compared to 14%
nationally.
Figures 7.7 and 7.8 show that attainment in Key Stage 4 is below the national average1 for headline
accountability measures. 23
Figure 7.7. Average Attainment 8 score per pupil
Source: Department for Education
Figure 7.8. Percentage achieving 9-5 pass in English and Maths
Source: Department for Education
1 National figures are for state funded schools only as local authority data is for state funded schools only. 2 Attainment 8 is a measure of a pupil's average grade across a set suite of eight subjects. Once calculated, this Attainment 8 score is
compared to the average Attainment 8 score of all pupils nationally with the same prior attainment at KS2 in order to calculate a pupils Progress 8 score. 3 Progress 8 measures a student's progress between Key Stage 2 and Key Stage 4 across eight key subjects. The average Progress 8 score
of all secondary schools nationally is 0. Schools with a Progress 8 score of below -0.5 are not achieving the minimum standard expected by the Government. A score of +0.5 of above shows that pupils in that school are making well above the expected level of progress.
2
3

67
Key Findings:
• The average Attainment 8 score for
Females in 2019 was 46.4, compared
to 41.9 for males.
• Nationally the Attainment 8 score for
Females is 49.3, compared to 43.9 for
males.
• The gap between Tees Valley and
national is larger for females, with the
Tees Valley average female
attainment 8 score 2.9 points below
the national average, compared to 2
points below for males.
• 42.3% of females achieved a 9-5 pass
in English and Maths in 2019,
compared to 36.9% of males.
Nationally 46.4% of females achieved
a 9-5 pass in English and Maths,
compared to 39.7 of males.
• Again the gap between Tees Valley
and national is larger for females, with
the percentage of females achieving a
9-5 pass in English and Maths 4.1%
lower than national, compared to
2.8% lower for males.
The average attainment 8 score per pupil eligible for free school meals was 32.4 in 2018, compared
to 46.6 for those not eligible.
Figures 7.9 and 7.10 show that females continue to outperform males throughout secondary school.
Figure 7.9. Average Attainment 8 score per pupil - Gender
Source: Department for Education 2019
Figure 7.10. % achieving 9-5 pass in English and Maths
Source: Department for Education

68
Key Findings:
• Tees Valley has lower than national
percentage of pupils entered for all
components of Ebacc:
o 95.6% were entered for English,
compared to 95.8% nationally.
o 96.6% were entered for Maths,
compared to 97.3% nationally.
o 94.5% were entered for Science,
compared to 95.6% nationally.
o 76.8% were entered for Humanities
subjects, compared to 80.6% nationally.
o 34.8% were entered for Languages,
compared to 46.6% nationally.
Key Findings:
• Tees Valley pupils are below the national
average for the percentage of pupils
achieving grade 5 or above in all
components:
o 57.3% of pupils achieved in English,
compared to 60.4% nationally.
o 45.6% of pupils achieved in Maths,
compared to 48.9% nationally.
o 39.1% of pupils achieved in Science,
compared to 46.6% nationally.
o 46.3% of pupils achieved in Humanities,
compared to 49.9% nationally.
o 47.2% of pupils achieved in Languages,
compared to 54.2% nationally.
Participation and achievement in English Baccalaureate (EBacc) components
29% of Tees Valley pupils entered the EBacc in 2018/19, compared to 40% nationally4. This is down
2% from 31% in 2017/18 compared to a 1.5% rise nationally. This is due to a 1.4% drop in entries to
Languages (0.5% rise nationally), with entries to English, Maths, Science and Humanities each seeing
a small increase over the past year.
Figure 7.11. Percentage entered for the Ebacc by component – 2018/19
Source: Department for Education
11% of Tees Valley pupils achieved the Ebacc (grades 5 or above in English and maths, A*-C in
unreformed subjects), compared to 17% nationally. This is down 1.3% from 12.3% in 2017-18
compared to 0.2% rise nationally. This is due a 1.3% drop in English and a 1.5% drop in Maths
achievements (0.2% and 0.6% drop nationally), with achievements in Science and Humanities seeing
a 1.5% and 10.6% rise respectively5 (2.3% and 10.8% rise nationally).
Figure 7.12. Percentage achieving grade 5 or above in Ebacc by component – 2018/19
Source: Department for Education
4 National data reported is for State Funded Schools only as Local Authority data covers state funded schools only. 5 Unable to report the change in Languages due to data issues.

69
Key Findings:
• Tees Valley has a higher percentage of
primary school rated as both
outstanding (19%) and good (72%) by
Ofsted than national (18% and 69%)
• 9% of primary schools require
improvement compared to 10%
nationally, and 1% are inadequate,
compared to 3% nationally.
• The quality of Tees Valley primary
school has remained fairly steady over
the past 4 years, taking a slight dip in
2018 before recovering in 2019.
• However 48% of Tees Valley
secondary schools require
improvement or are inadequate,
compared to 25% nationally.
• The percentage of Tees Valley
secondary schools rated as
outstanding or good has fallen
consistently over the past 2 years,
from a high of 59% in 2016 to the
current 52% in 2019, a drop of 7
percentage points compared to a drop
of 1 nationally.
c. Quality
91% of Tees Valley primary schools are rated as good or outstanding by Ofsted compared to 87% nationally, with the Tees Valley average remaining above the national for the last 4 years. However only 52% of Tees Valley secondary schools are rated as good or outstanding by Ofsted, compared to 75% nationally, with this falling year on year for the past 3 years. Almost half are rated as “requires improvement” or “inadequate” by Ofsted. Figure 7.13. Primary Ofsted Results – March 2019
Figure 7.14. Secondary Ofsted Results – March 2019
Figure 7.15. Percentage of education providers rated as outstanding or good by Ofsted
Source: Ofsted

70
Key Findings:
• 3.9% of 16-17 year olds are known to be
NEET in Tees Valley in 2018/19, compared to
2.6% nationally.
• The percentage has increased very slightly by
0.1 percentage points over the last year,
compared to a fall of 0.1 nationally.
• This has fallen 0.8 percentage points over
the past 4 years from 4.7% in 2014/15, which
matches the drop seen nationally.
Key Findings:
• 81% of 16-17 year olds were in full time
education and training in 2018/19, compared
to 85% nationally.
• 5.8% were in an apprenticeship, compared to
5.5% nationally.
• 2.5% were taking part in work based
learning, compared to 1.1% nationally.
• 1.2% were in employment combined with
study, compared to 0.7% nationally.
• 2.5% were in some other form of education
and training, compared to 0.2% nationally.
d. Post 16 Education
Tees Valley has four general further education colleges, Darlington, Hartlepool, Middlesbrough, and
Stockton Riverside (incorporating Redcar and Cleveland College) along with one specialist college
(The Northern School of Art), all of which are rated as either Good or Outstanding by Ofsted. There
are also five sixth form colleges along with a number of schools that contain a sixth form college.
These colleges offer a range of education and training courses, including apprenticeships and full-
time and part-time provision.
Participation
92.8% of 16-17 years olds in Tees Valley were in Education or Training in 2019 compared to 92.5%
nationally. This has increased by 2.3 percentage points over the last 5 years, compared to an
increase of 2.7 nationally. However, compared to the previous year, the percentage of 16-17 year
olds in Education or Training has remained the same.
Figure 7.16. Participation in Education and Training by type – 2018/19
Source: Department for Education
Figure 7.17 illustrates that Tees Valley has a higher than average number of 16-17 years olds known
as NEET (Not in Education, Employment or Training).
Figure 7.17. Percentage of 16-17 year olds known to be NEET
Source: Department for Education

71
Key Findings:
• The overall achievement rate for 16-18
year olds at Tees Valley FE+ colleges
was above national average at 84% in
2017/18, compared to 82.2% for all
general FE and tertiary colleges
nationally.
• This has remained the same compared
to 2016/17, whilst nationally the rate
improved from 80.5% in 2016/17 to
82.2% in 2017/18.
Key Findings:
• The pass rate for 16-18 year olds at Tees
Valley FE+ colleges was above national
average at 92.8% in 2017/18, compared
to 90.6% for all general FE and tertiary
colleges nationally.
• This has risen slightly from 92.2% in
2016/17, an increase of 0.6 percentage
points, compared to a 1.6 rise
nationally.
Key Findings:
• The retention rate for 16-18 year olds at
Tees Valley FE+ colleges was very
slightly below national average at 90.5%
in 2017/18, compared to 90.7% for all
general FE and tertiary colleges
nationally.
• This has fallen slightly from 91.1% in
2016/17, a drop of 0.6 percentage
points, compared to a 0.1 rise
nationally.
Attainment
Figure 7.18. Overall Achievement Rates for 16-18 year olds at FE Colleges
Source: Department for Education
Figure 7.19. Pass Rates for 16-18 year olds at FE Colleges
Source: Department for Education
Figure 7.20. Retention Rates for 16-18 year olds at FE Colleges
Source: Department for Education

72
Key Findings:
• Tees Valley has an average point score
per A-level entry of 32.3 in 2018/19
compared to 33.8 nationally. However,
the gap has narrowed slightly and Tees
Valley has seen an increase in score of
3.1 since 2015/16, compared to an
increase of 2 points nationally.
Key Findings:
• 10% of Tees Valley students received
grades AAB or better, of which 2 were in
facilitating subjects in 2018/19
compared to 16% nationally.
• This percentage rose to 12% in 2016/17
before falling back to 10% in 2018/19,
whilst nationally the percentage has
fallen slowly by 1.2% over the past 3
years. This caused the gap between
Tees Valley and the national to narrow
slightly.
Figure 7.21. Average point score per A Level entry
Source: Department for Education
Figure 7.22. Percentage of students achieving grades AAB or better at GCE A Level, of which 2 are in
facilitating subjects6
Source: Department for Education
88% of 16-18 year olds entered or remained in education or employment after completing their level
3 qualification, which matches the national figure and has remained steady over the past 3 years.
6 Facilitating subjects are the subjects most commonly required or preferred by universities to get on to a range of degree courses.

73
Key Findings:
• Participation in full time
Higher Education is slightly
higher in Tees Valley than
nationally.
• Participation in part time
Higher Education has
continued to fall both
locally and nationally since
2010/11.
a. Higher Education
Higher education provision in Tees Valley is focused on Teesside University and the University of
Durham (Queens Campus), with FE colleges also offering HE courses.
Teesside University is described as the UK’s leading higher education institution for working with
business and received the Queen’s Anniversary Prize for work at world-class level in the field of
enterprise and business engagement.
The University of Durham, Middlesbrough College and The Northern School of Art were awarded a
Gold standard Teaching Excellence Framework after a rigorous review of higher education standards
judged that they provide teaching of the highest quality in the UK.
The figures below cover higher education level students registered directly with a HE provider. If a
HE provider has a franchise / collaborative agreement with a Further Education college these
students will be included in this analysis. However if a student is registered directly with the FE
college their data is not included.
Participation
10.7% of 18-39 year old Tees Valley residents were in higher education in 2017/18, compared to
9.9% nationally. This has dropped from 13.3% in 2010/11, a drop of 2.6 percentage points
compared to a 1.3 drop nationally.
However, the percentage of 18-39 year old Tees Valley residents in full-time higher education has
increased from 6.8% in 2010/11 to 7.7% in 2017/18, a rise of 0.9 percentage points compared to a
rise of 0.4 nationally. The percentage of 18-39 year old Tees Valley residents in part-time higher
education has fallen from 6.5% in 2010/11 to 3% in 2017/18, a drop of 3.5 percentage points
compared to a drop of 1.7 nationally.
Figure 7.23. Percentage of 18-39 years olds participating in Higher Education by mode of study
Source: Higher Education Statistics Agency (HESA)

74
Key Findings:
• Since 2016/17 there has been a rise
of 0.2 percentage points (395 extra
qualifications) compared to a rise of
0.1 percentage points nationally.
• The Tees Valley rate has risen 0.4
percentage points from a low of
3.5% in 2014/15, (730 extra
qualifications) compared to a 0.1
rise nationally.
Key Findings:
• Qualification in Health Care
accounted for 33% of all
undergraduate and postgraduate
qualifications in 2017/18.
• The second largest sector for take
up of qualifications is the Other
Services sector with 29% of all
passes.
Attainment
3.8% of Tees Valley Higher Education students7 aged 20-39 obtained an undergraduate or
postgraduate qualification in 2017/18, compared to 4.4% nationally.
Figure 7.24. Percentage of 20-39 year olds gaining undergraduate or postgraduate qualifications
Source: HESA
52% of Tees Valley Higher Education students gained their undergraduate or postgraduate
qualification at Teesside University, an increase of 3% since 2014/15. 15% of qualifications gained by
Tees Valley Higher Education students were obtained at Russell Group universities. 8
Figure 7.25. Undergraduate and Postgraduate qualification by Key Sector 2017-18
Source: HESA
7 Students whose permanent residence prior to starting study was within Tees Valley
8 The Other Services sector includes qualifications gained in Education, Social Studies, Languages, Historical and
philosophical studies, Architecture, Building & Planning, Forensic & Archaeological Sciences and Astronomy and Agriculture. Education qualifications make up over half of Other Services qualifications
8

75
Key Findings:
• The Other Services industry sector
has consistently employed the most
Tees Valley graduates over the past
five years, with 34% of Tees Valley
graduates finding employment in
this sector in 2016/17.
• Half of the employment in the Other
Services sector is in the Education
sub sector (50%), with a further 25%
in Wholesale and Retail Trade.
b. Graduate retention and employment
The Destination of Leavers from Higher Education Leavers survey (DLHE) was taken by graduates 6
months after qualifying from their higher education qualification. This survey was replaced in 2018
by the new Graduate Outcomes survey, taken 15 months after graduation with the first extract of
results expected to be available in spring 2020. Consequently there is no new local graduate data
since the publication of the previous economic assessment, therefore this section is included again
below for information.
73% of Tees Valley graduates who obtained a higher education qualification in 2016/17 were in
some form of employment or due to start employment six months after graduating, compared to
77% nationally.
59% of graduates found employment within Tees Valley with 73% finding employment within the
North East region. However, this figure has reduced each year for the past five years from a high of
69% in 2009/10, showing that graduates have become increasingly likely to move out of the Tees
Valley for employment.
Figure 7.26. Percentage of employed graduates by industry sector – 2016/17 9
Source: HESA
Of the 73% of graduates who were in some form of employment or due to start employment six
months after graduating 78% were in professional employment10. Almost a quarter (22%) were in
non-professional roles (assumed non-graduate) six months after graduating, compared to 26%
nationally. This rises to 25% for those who found employment specifically within Tees Valley,
suggesting there are fewer graduate level jobs available in Tees Valley. Figure 7.27 shows the top
industry sectors for non-graduate jobs.
9 The Other Services industry sector includes Education, Wholesale and retail trade; repair of motor vehicles and motorcycles, Public
administration and defence; compulsory social security, Other service activities, Agriculture, forestry and fishing and Water supply,
sewerage, waste management/remediation activities. 10 Professional employment includes the SOC codes 1 – Managers, directors and senior officials, 2 – Professional Occupations and 3-
Associate professional and technical occupations
9
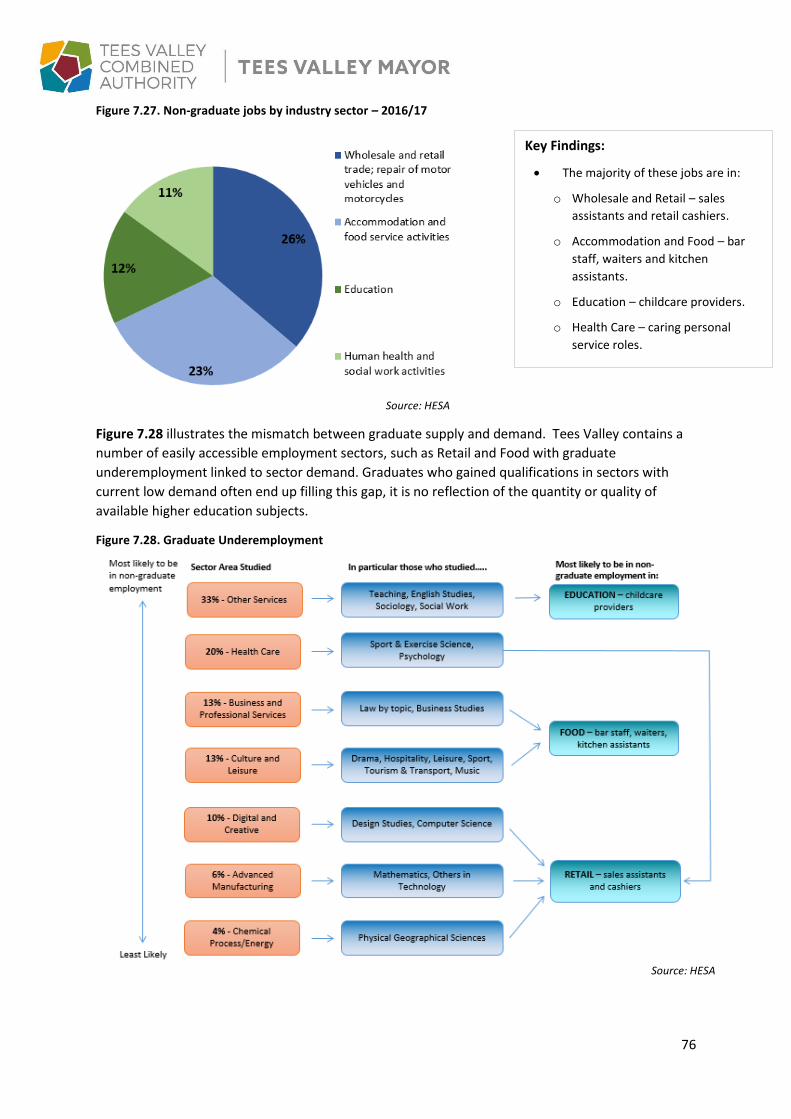
76
Key Findings:
• The majority of these jobs are in:
o Wholesale and Retail – sales
assistants and retail cashiers.
o Accommodation and Food – bar
staff, waiters and kitchen
assistants.
o Education – childcare providers.
o Health Care – caring personal
service roles.
Figure 7.27. Non-graduate jobs by industry sector – 2016/17
Source: HESA
Figure 7.28 illustrates the mismatch between graduate supply and demand. Tees Valley contains a
number of easily accessible employment sectors, such as Retail and Food with graduate
underemployment linked to sector demand. Graduates who gained qualifications in sectors with
current low demand often end up filling this gap, it is no reflection of the quantity or quality of
available higher education subjects.
Figure 7.28. Graduate Underemployment
Source: HESA
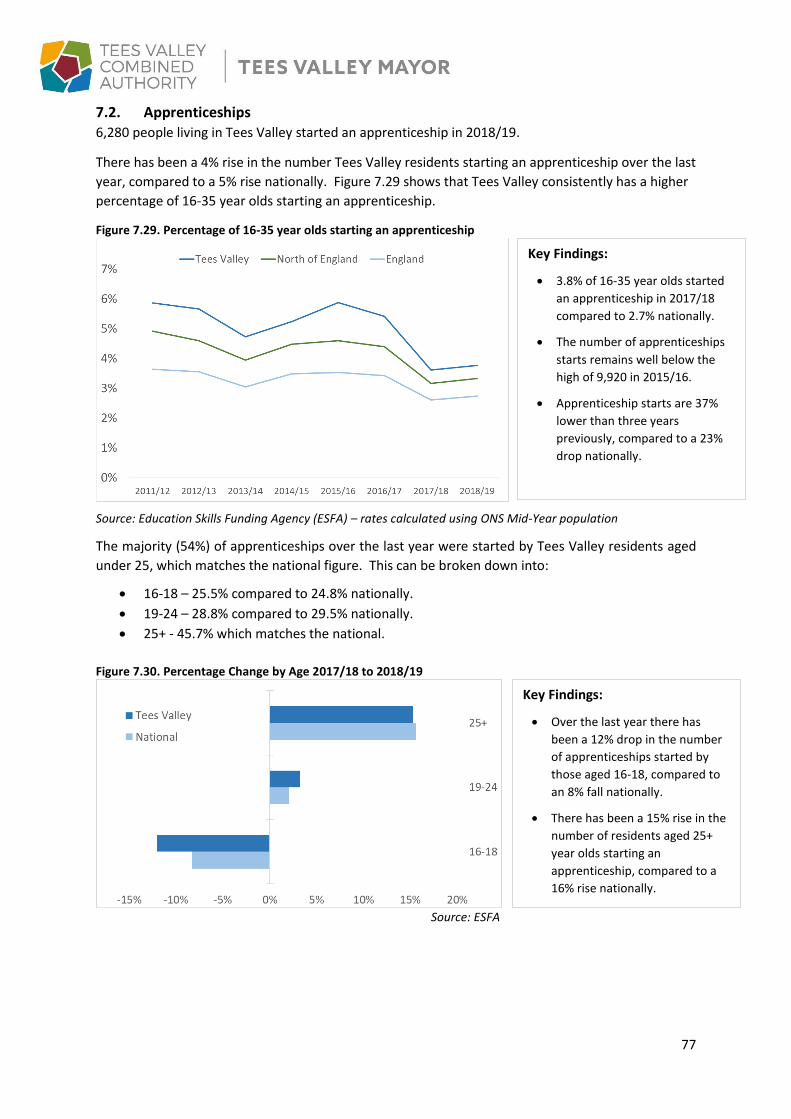
77
Key Findings:
• 3.8% of 16-35 year olds started
an apprenticeship in 2017/18
compared to 2.7% nationally.
• The number of apprenticeships
starts remains well below the
high of 9,920 in 2015/16.
• Apprenticeship starts are 37%
lower than three years
previously, compared to a 23%
drop nationally.
Key Findings:
• Over the last year there has
been a 12% drop in the number
of apprenticeships started by
those aged 16-18, compared to
an 8% fall nationally.
• There has been a 15% rise in the
number of residents aged 25+
year olds starting an
apprenticeship, compared to a
16% rise nationally.
7.2. Apprenticeships 6,280 people living in Tees Valley started an apprenticeship in 2018/19.
There has been a 4% rise in the number Tees Valley residents starting an apprenticeship over the last
year, compared to a 5% rise nationally. Figure 7.29 shows that Tees Valley consistently has a higher
percentage of 16-35 year olds starting an apprenticeship.
Figure 7.29. Percentage of 16-35 year olds starting an apprenticeship
Source: Education Skills Funding Agency (ESFA) – rates calculated using ONS Mid-Year population
The majority (54%) of apprenticeships over the last year were started by Tees Valley residents aged
under 25, which matches the national figure. This can be broken down into:
• 16-18 – 25.5% compared to 24.8% nationally.
• 19-24 – 28.8% compared to 29.5% nationally.
• 25+ - 45.7% which matches the national.
Figure 7.30. Percentage Change by Age 2017/18 to 2018/19
Source: ESFA

78
Key Findings:
• Over the last year there has
been an 11% drop in Tees Valley
residents starting Intermediate
apprenticeships, which matches
the national.
• Advanced level apprenticeships
have risen by 5%, compared to a
9% rise nationally.
• Higher apprenticeship have risen
by 56% compared to a 52% rise
nationally.
Key Findings:
• The largest percentage of
apprenticeships started by Tees
Valley residents are in Business,
Admin and Law with 31% of all
starts (30% nationally).
• Tees Valley has a higher percentage
of apprenticeship starts than
national in:
o Construction, Planning and the
Built Environment; and
o Health, Public Services and
Care
42% of apprenticeships started by Tees Valley residents in 2018/19 were intermediate level
apprenticeships compared to 37% nationally. 42% were advanced level apprenticeships compared
to 44% nationally and 16% were higher level apprenticeships compared to 19% nationally.
Figure 7.31. Percentage Change by Level 2017/18 to 2018/19
Source: ESFA
82% of Tees Valley residents started an apprenticeship which was delivered in Tees Valley11, with a
further 8% delivered in the North East.
Figures 7.32 and 7.33 uses the generic Framework Sector Subject Areas used by ESFA to compare
apprenticeship starts against national figures:
Figure 7.32. Percentage of apprenticeships starts by Framework Sector Subject Area 2018/19
Source: ESFA
11 Delivered in Tees Valley by providers who may or may not be based in Tees Valley.

79
Key Findings:
• Over the last year there has been a
38% rise in starts in Arts, Media &
Publishing, compared to a 5% rise
nationally, however this only
equates to 10 extra starts.
• There has also been a 15% rise in
starts in Health, Public Services and
Care compared to 11% nationally,
with an extra 230 starts.
• There has been a 14% rise in starts
in Engineering & Manufacturing
Technologies compared to a 2% fall
nationally, with 110 extra starts.
• The largest fall in apprenticeship
starts has been in Construction,
Planning and the Built Environment,
with a 15% drop compared to a 1%
fall nationally and 90 fewer starts.
Key Findings:
• There has been a slight 0.9% fall in
the apprenticeships achievement
rate of Tees Valley residents over
the last year, compared to fall of
0.4% nationally.
• Over the past 5 years the Tees
Valley rate has fallen from a high of
74% in 2012/13, a drop of 4.3%
compared to a 5% drop nationally.
Figure 7.33. Percentage change by Framework Sector Subject Area 2017-18 to 2018-19
Source: ESFA
Apprenticeship achievement rates
Tees Valley residents had an overall apprenticeship achievement rate of 70% in 2017/18, compared
to 67% nationally. This has consistently been higher than the national figure for the past 5 years,
although the rate has fallen from a high of 74% in 2012/13.
Figure 7.34. Apprenticeship Achievement rate
Source: ESFA

80
Key Findings:
• 16-18 year old Tees Valley residents
achieve the highest achievement
rates at 74%, compared to 70%
nationally.
• This falls to 71% for 19-23 year olds,
compared to 70% nationally.
• This falls further to 67% compared
to 65% for those aged 24+.
Key Findings:
• Tees Valley residents have the best
achievement rates when
undertaking advanced level
apprenticeships at 72% compared to
68% nationally.
• This falls to 70% for Intermediate
level apprenticeships, compared to
67% nationally.
• Tees Valley achievement rates for
Higher Apprenticeships are much
lower at 58% compared to 64%
nationally.
Figure 7.35. Apprenticeship Achievement rate by age of learner 2017/18
Source: ESFA
Figure 7.36. Apprenticeship Achievement rate level of apprenticeship 2017/18
Source: ESFA

81
Key Findings:
• 30.6% of the Tees Valley working age
population were qualified to at least a level 4
in 2018, compared to 39.3% nationally. This
has risen by 0.5 percentage points over the
last year compared to a rise of 0.8 nationally.
Over the last 5 years the Tees Valley
percentage has increased by 3.5 percentage
points, compared to a rise of 4.2 percentage
points nationally.
• 50.8% are qualified to at least a level 3
compared to 57.8% nationally. This has risen
by 1 percentage point over the last year
compared to a rise of 0.7 nationally. Over the
last 5 years this has risen by 0.5 percentage
points compared to a 3.9 increase nationally.
• 69% are qualified to at least a level 2
compared to 74.9% nationally. This has fallen
by 0.1 percentage points over the last year
compared to an increase of 0.2 nationally.
Over the last 5 years the percentage has fallen
by 2.1 percentage points compared to an
increase of 2.5 nationally.
• 80.3% are qualified to at least a level 1
compared to 85.4% nationally. This has fallen
by 0.2 percentage points over the last year
whilst no change was seen nationally. Over
the last 5 years the percentage has fallen by
3.3 percentage points compared to an increase
of 1.1 nationally.
• 12% of the Tees Valley working age population
had no qualifications in 2018, compared to
7.8% nationally. This has fallen by 0.1
percentage point over the last year compared
to a 0.1 rise nationally. Over the last 5 years
the percentage has risen by 1 percentage
points compared to a drop of 1.6 percentage
points nationally.
• 7.7% of the Tees Valley working age
population had ‘other’ qualifications in 2018,
compared to 6.8% nationally. Over the last
year this has risen by 0.3 percentage points
compared to a fall of 0.1 nationally. Over the
last 5 years this has increased by 2.3
percentage points, compared to a rise of 0.5
nationally.
7.3. National Qualification Framework (NQF) Skills Levels Over the last year there has been a slight rise in the percentage of working age population with level
3 and 4 qualifications, whist the percentage with level 2 and 1 qualifications fell slightly. Figures 7.37
to 7.39 illustrate the change over the last 5 years.
Figure 7.37. Percentage of working age population qualified to
NQF Level 4 and 3
Source: ONS, Annual Population Survey Figure 7.38. Percentage of working age population qualified to
NQF Level 2 and 1
Source: ONS, Annual Population Survey
Figure 7.39. Percentage of working age population with other
qualifications or no qualifications
Source: ONS, Annual Population Survey

82
Key Findings:
• Current employment demand
for Level 4 occupations appears
to be close to supply. 29% of
current occupations in Tees
Valley require a level 4 or above
qualification, whilst 30.6% of the
Tees Valley working age
population are qualified to a
level 4 or above (as discussed in
the previous NQF Skills Levels
section).
7.4. Current Skills by Occupation
30% of current occupations in Tees Valley require a Level 4 or above qualification compared to 32%
nationally. Figure 7.40 illustrates that the skills levels of current occupations in Tees Valley are
similar to national skills levels.
Figure 7.40. Skill levels of current employment
Source: EMSI 2018 Occupation Table
7.5. Travel to learn
87% of learning undertaken by Tees Valley residents in 2018/19 was undertaken within Tees Valley.
This varies from 90% for Middlesbrough and Redcar and Cleveland residents to 81% for Darlington
and Hartlepool residents.
The majority of learners started a learning aim which was based in their home district. This varies
from 69% in Darlington to 44% in Redcar and Cleveland. 34% of Redcar and Cleveland residents
undertake learning in Middlesbrough, with a highly populated part of the Redcar and Cleveland local
authority area lying within Middlesbrough.
Table 7.1. Percentage of learning aims started in 2018/19
Source: ESFA
Location of Learning Darlington Hartlepool Middlesbrough Redcar and Cleveland Stockton on Tees Grand Total
Darlington 69% 1% 1% 1% 3% 11%
Hartlepool 2% 63% 2% 1% 4% 12%
Middlesbrough 6% 6% 66% 34% 20% 29%
Redcar and Cleveland 1% 1% 10% 44% 2% 11%
Stockton on Tees 3% 10% 12% 9% 59% 23%
Tees Valley 81% 81% 90% 90% 88% 87%
Rest of North East 11% 11% 3% 2% 5% 6%
Other England 9% 8% 7% 8% 7% 8%
Home Local Authority

83
Key Findings:
• This is a 9% drop when compared to 2018 (2,845 fewer vacancies), in
comparison to a 20% drop nationally and a 17% drop across the North
of England.
Key Findings:
• The largest rise when compared to 2018 was
for Leisure, Travel and Related Personal
Service Occupations, with a 41% increase
(vacancies increasing from 324 to 456). There
was a particular increase in Caretakers,
Hairdressers and Barbers, Housekeepers and
Sports and Leisure Assistants.
• However, when compared to 2018, demand
has fallen for Other Managers and Proprietors
with a 21% fall (vacancies dropping from 981
to 776). In particular, there was a fall in
vacancies for Managers and Proprietors in
other services not elsewhere classified, Care
Managers and Restaurant and Catering
Managers.
7.6. Current job demand
There were 27,510 job vacancies advertised online in Tees Valley between January 2019 and
December 201912.
Figure 7.41 illustrates that the largest number of job vacancies in Tees Valley in 2019 were for
Carers, Teachers, IT Staff, Engineers, Nurses and Admin workers.
Figure 7.41. Top 5 Tees Valley Job Vacancies in 2019
Source: Burning Glass Labour Insight
12 The source of vacancy data is Burning Glass Labour Insight. A fall in job vacancies does not necessarily indicate fewer jobs, it may be an indication of increased job stability or lower staff turnover.

84
Key Findings:
• 31% of Information & Communication
employers in Tees Valley reported a
skills shortage vacancy, compared to
6% nationally.
• 15% of Education employers in Tees
Valley reposted a skills shortage
vacancy compared to 9% nationally.
• 10% of Manufacturing employers and
9% of Construction employers in Tees
Valley also reported skills shortage
vacancy, compared to 9% and 5%
nationally.
Key Findings:
• 89% of Tees Valley job vacancies in the
Information and Communication sector
were skills shortage vacancies,
compared to 27% nationally.
• 64% of Construction job vacancies were
skills shortage vacancies, compared to
35% nationally.
• 43% of Education vacancies and 38% of
Manufacturing vacancies in Tees Valley
were skills shortage vacancies
compared to 23% and 29% nationally.
7.7. Skills Shortage Vacancies
The 2017 DfE Employer Skills Survey reported that 5% of Tees Valley employers reported a skills
shortage vacancy, this matches the North East figure and compares to a national figure of 6%.
27% of all vacancies in the Tees Valley are classed as skills shortage vacancies, compared to 22%
nationally and 25% across the North East region. However this is down 11 percentage points from
the 38% reported in 2013, compared to a national increase of 1 percentage point. Figures 7.42 and
7.43 highlight the industry sectors reporting skills shortage vacancies and the percentage of all
vacancies which are skills shortage vacancies.
Figure 7.42. Percentage of employers with a Skills Shortage Vacancy by industry sector
Source: Department for Education (DfE) Employer Skills Survey
Figure 7.43. Percentage of all job vacancies which are skills shortage vacancies by industry sector
Source: DfE Employer Skills Survey

85
Key Findings:
• Professional and Business Services are
projected to have the largest
expansion demand, followed by
Healthcare and Wholesale and Retail.
• Production Industries, Logistics and
Public Admin, Defence and Education
are the three sectors which are not
projected to have any expansion job
opportunities between 2014 and
2024. However, every sector is
projected to have a large number of
replacement demand job
opportunities.
• Part-time jobs are projected to make
up a greater share of total
employment in the future.
• Growth in female employment is
expected to exceed that for men.
• High qualification / high skill
occupations are making up an ever
increasing share of total employment,
with over half of the 133,000 jobs
predicted requiring a level 4 or above
qualification. In addition 45% of these
jobs are projected to be high skill
managerial, professional or associate
professional & technical occupations.
• There will still be a high demand for
intermediate and lower level skills,
particularly in replacement jobs, with
almost half of all job opportunities
(46%) requiring a level 3 or below
qualification.
7.8. Future Job Demand
The nationally developed Working Futures model released data in 201613 which predicts that Tees
Valley will have 133,000 jobs that will need filling by 2024. This is made up of 17,000 new jobs and
116,000 replacement jobs. The Tees Valley Strategic Economic Plan, published in December 2016,
sets an ambitious growth target of creating 25,000 net new jobs over the next decade. Figure 7.44
and 7.45 illustrate the breakdown of new and replacement jobs by industry sector and skills
requirement.
Figure 7.44. Future Job Demand by Industry Sector 2014 - 2024
Source: Working Futures
Figure 7.45. Total Skills Requirement 2014 -2024
Source: Working Futures
13 An update of the Working Futures model is expected in 2020, which will provide revised projections up to 2027.

86
Figure 7.46 shows that high skill levels are projected to be in demand across all sectors. In particular,
Public, Admin, Defence and Education, IT, Media and Other Services, Production Industries,
Professional and Business Services and Healthcare.
Figure 7.46. Percentage Skills required 2014 - 2024 by sector and qualification level
Source: Working Futures
All sectors, including those with declining aggregate employment numbers are projected to see
thousands of job opportunities in the next decade.

87
Key Findings:
• Tees Valley resident employment rate
peaked in 2017 at 69.1%, whilst
nationally and regionally the rate
continues to rise.
• Over the last year the Tees Valley rate
has risen slightly by 0.2 percentage
points compared to a 0.6% rise
nationally and a 0.4% rise across the
North of England. However, this slight
rise in rate is due to a fall in the working
age population rather than an increase
in people in employment, with 100
fewer 16-64 year olds in employment,
whilst nationally and regionally numbers
in employment have risen.
7.9. Current Employment
a) Overall resident employment
281,100 Tees Valley residents aged 16-64 were employed in the 12 months to June 2019, 68.6% of
the working age population compared to 75.8% nationally. Figure 7.47 illustrates the trends in
employment rate over the last 5 years.
Figure 7.47. Employment Rate (resident employment)
Source: ONS Annual Population Survey (APS)
b) Jobs by Sector
Tees Valley has over 273,000 jobs across a range of industries as shown in Table 7.2.
Table 7.2. Industry sector breakdown
Industry Sector Tees Valley Jobs (2018)
Change 2013-18
% Change 2013-18
% Change nationally 2013-2018
LQ
Chemical and Process 5,361 -2,822 -35% 9% 2.2
Raw Materials and Agriculture 6,255 -275 -4% 7% 1.8
Advanced Manufacturing 18,055 3,235 22% 8% 1.5
Clean Energy Low Carbon 8,215 1,327 19% 13% 1.4
Healthcare 35,978 -4,143 -10% 10% 1.3
Other Public Services 49,386 1,355 3% 2% 1.1
Other Private Services 38,786 -643 -2% 4% 1.1
Logistics 19,399 4,022 26% 10% 1.0
Construction 12,844 -1,058 -8% 20% 0.9
Other Manufacturing 9,742 1,861 24% 7% 0.9
Creative, Culture and Leisure 30,228 804 3% 12% 0.8
Professional and Business Services 32,238 4,792 18% 14% 0.7
Digital 6,455 1,415 28% 27% 0.7
Biologics 143 -68 -32% 3% 0.2 Source: Emsi 2019.1

88
Key Findings:
• The top 5 sectors for jobs in Tees Valley are Other Public Services (mainly Education) Other
Private Services (mainly Retail), Healthcare, Professional and Business and Creative, Culture and
Leisure.
• Tees Valley has particular sectoral strengths in Chemical and Process and Raw Materials and
Agriculture (which includes Bioscience) with Location Quotients of 2.2 and 1.8. However these
two sectors have seen a fall in jobs over the last five years compared to a rise nationally.
• Healthcare, Construction, Other Private Services and Biologics have also seen a fall in the
number of jobs over the past 5 years, compared to rises nationally.
• The largest percentage increase in jobs over the past 5 years has been in the Digital sector with a
28% rise and over 1,400 extra jobs, compared to a 27% rise nationally.
• Logistics, Other Manufacturing and Advanced Manufacturing have all seen a rise in jobs which is
much larger than the percentage rise experienced nationally.
Key Findings:
• Tees Valley has a larger percentage
than national employed in:
o Healthcare.
o Other Public Services.
o Other Private Services.
o Advanced Manufacturing.
o Chemical Process.
o Construction.
o Clean Energy Low Carbon.
• Tees Valley has fewer than national
employed in:
o Professional and Business
Services.
o Creative and Culture.
o Digital.
o Logistics.
o Raw Materials and Agriculture.
o Other Manufacturing.
o Biologics.
Tees Valley has a number of key sectors which contain a higher number of jobs than national.
Figures 7.48 and 7.49 show the distribution of jobs by industry and occupation compared to national
in 2018.
Figure 7.48. Distribution of Jobs by Industry in 2018
Source: Emsi 2019.1

89
Key Findings:
• Tees Valley has a lower percentage
than national employed in the private
sector, with almost a quarter of all
employees employed in the public
sector in 2018-19.
• There was a fall in private sector
employment in 2015-16 from 75.5%
in 2014-15 to 73.9% in 2015-16. This
may in part be due to the closure of
the SSI Steelworks in October 2015
which resulted in the loss of around
2,200 local jobs.
• However private sector employment
has risen by 2.1 percentage points
since the dip in 2015-16 from 73.9%
to 76%, compared to a rise of 0.6
nationally.
Key Findings:
• 18.5% of jobs in Tees Valley are in
Professional occupations (18.7% nationally)
• 13.9% of jobs are in Elementary
occupations (13.5% nationally).
• Tees Valley has above the national average
jobs in:
o Caring, Leisure and Other Service
Occupations;
o Process , Plant and Machine
Operatives;
o Skilled Trades Occupations;
o Sales and Customer Service
Occupations; and
o Elementary Occupations.
• And fewer the national average jobs in:
o Associate Professional and
Technical occupations;
o Managers, Directors and Senior
officials;
o Administrative and Secretarial
occupations; and
o Professional Occupations.
Figure 7.49. Distribution of Jobs by Occupation in 2018
Source: Emsi 2019.1
c) Public/Private Sector and Self-Employment
The majority (76%) of Tees Valley employees are employed in the private sector, with 24% employed
in the public sector, compared to 79% and 21% nationally.
Figure 7.50. Percentage in employment working in the private sector
Source: ONS APS
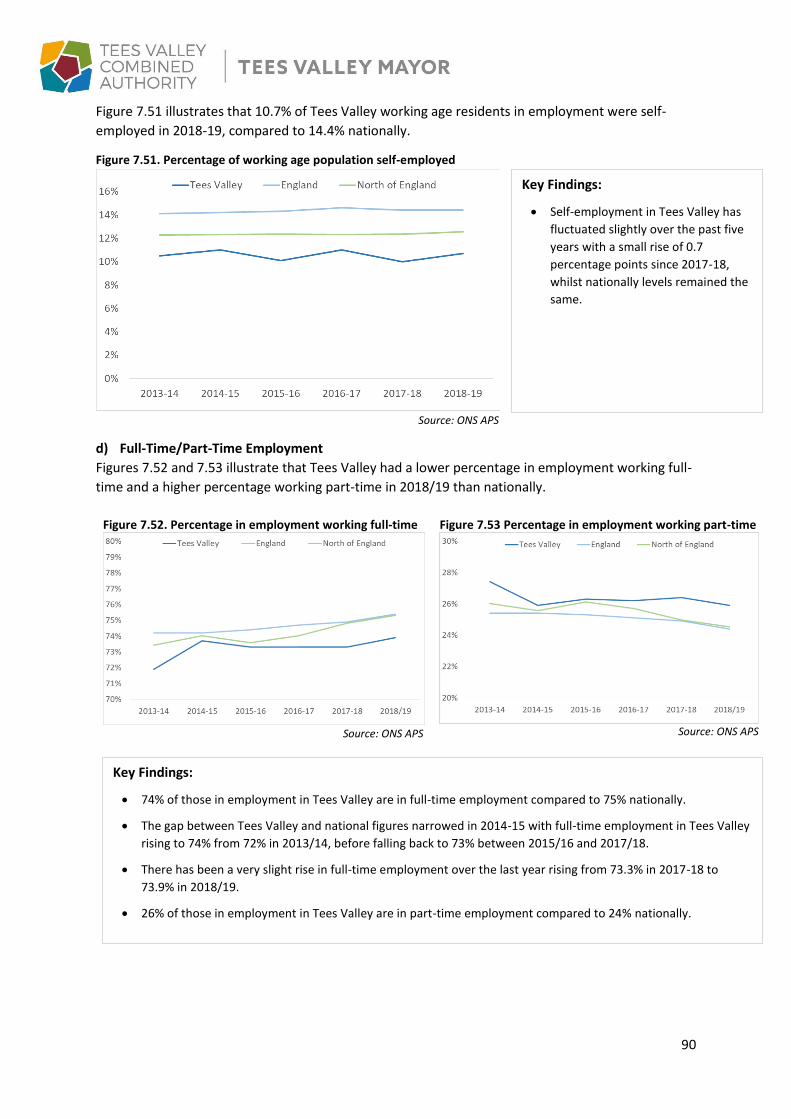
90
Key Findings:
• 74% of those in employment in Tees Valley are in full-time employment compared to 75% nationally.
• The gap between Tees Valley and national figures narrowed in 2014-15 with full-time employment in Tees Valley
rising to 74% from 72% in 2013/14, before falling back to 73% between 2015/16 and 2017/18.
• There has been a very slight rise in full-time employment over the last year rising from 73.3% in 2017-18 to
73.9% in 2018/19.
• 26% of those in employment in Tees Valley are in part-time employment compared to 24% nationally.
Key Findings:
• Self-employment in Tees Valley has
fluctuated slightly over the past five
years with a small rise of 0.7
percentage points since 2017-18,
whilst nationally levels remained the
same.
Figure 7.51 illustrates that 10.7% of Tees Valley working age residents in employment were self-
employed in 2018-19, compared to 14.4% nationally.
Figure 7.51. Percentage of working age population self-employed
Source: ONS APS
d) Full-Time/Part-Time Employment
Figures 7.52 and 7.53 illustrate that Tees Valley had a lower percentage in employment working full-
time and a higher percentage working part-time in 2018/19 than nationally.
Figure 7.52. Percentage in employment working full-time
Source: ONS APS
Figure 7.53 Percentage in employment working part-time
Source: ONS APS

91
Key Findings:
• 88% of males in Tees Valley were
employed full-time in June 2019
compared to 59% of females
(89% of males and 61% of
females nationally).
• The split in male full time and
part-time employment has been
steady over the past 4 years.
However, the percentage of
Females working part time has
dropped by 4.3 percentage
points over the past 5 years,
compared to a drop of 2.3
nationally, whilst the percentage
working full time has risen by 4.7
percentage points compared to
a rise of 2.5 nationally.
Key Findings:
• The percentage of those in non-
permanent employment in Tees
Valley has fallen from a high of
6.8% in 2015-16 to 4.5% in 2018-
19, compared to a fall of 0.7
percentage points nationally.
Males have historically dominated full-time employment and this continues to be the case. Female
employment is more evenly distributed between full and part-time.
Figure 7.54. Male and Female split 2018/19
Source: ONS APS June 2019
e) Zero hour and Non-Permanent contracts
The Tees Valley Business Survey 2018 found that only 8% of Tees Valley businesses had recruited
any staff on zero hour contracts over the past 12 months.
Figure 7.55 shows that 4.5% of those in employment in 2018-19 in Tees Valley were employed in
non-permanent employment, compared to 4.4% nationally.
Figure 7.55. Percentage of all employment in non-permanent employment
Source: ONS APS
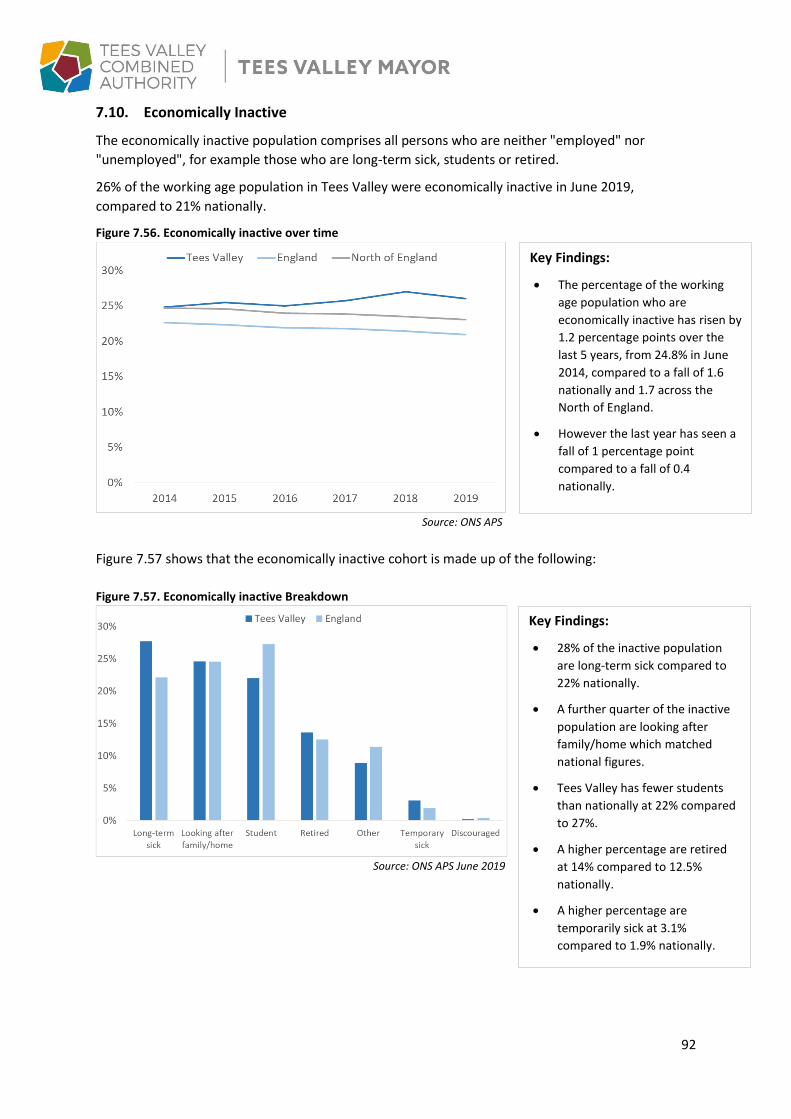
92
Key Findings:
• 28% of the inactive population
are long-term sick compared to
22% nationally.
• A further quarter of the inactive
population are looking after
family/home which matched
national figures.
• Tees Valley has fewer students
than nationally at 22% compared
to 27%.
• A higher percentage are retired
at 14% compared to 12.5%
nationally.
• A higher percentage are
temporarily sick at 3.1%
compared to 1.9% nationally.
Key Findings:
• The percentage of the working
age population who are
economically inactive has risen by
1.2 percentage points over the
last 5 years, from 24.8% in June
2014, compared to a fall of 1.6
nationally and 1.7 across the
North of England.
• However the last year has seen a
fall of 1 percentage point
compared to a fall of 0.4
nationally.
7.10. Economically Inactive
The economically inactive population comprises all persons who are neither "employed" nor
"unemployed", for example those who are long-term sick, students or retired.
26% of the working age population in Tees Valley were economically inactive in June 2019,
compared to 21% nationally.
Figure 7.56. Economically inactive over time
Source: ONS APS
Figure 7.57 shows that the economically inactive cohort is made up of the following:
Figure 7.57. Economically inactive Breakdown
Source: ONS APS June 2019

93
Key Findings:
• 93% of those aged 65+ are
economically inactive, compared
to 89% nationally.
• 57.5% of 16-19 year olds are
economically inactive, compared
to 58% nationally. This has fallen 4
percentage points from 62% in
2018, compared to a rise of 2
percentage points nationally.
• 31.5% of 50-64 year olds are
inactive compared to 25%
nationally.
Key Findings:
• The percentage of those who do
want a job peaked in 2016 at
26% before falling to 14% in
2019.
The majority of the economically inactive in Tees Valley do not want a job at 86% compared to 79%
nationally. Figure 7.58 shows that 14% of the economically inactive in Tees Valley do want a job,
compared to 21% nationally and 19% across the North of England.
Figure 7.58. Percentage of those Economically Inactive who want a job
Source: ONS APS
Figure 7.59. Age split of economically inactive
Source: ONS APS June 2019

94
Key Findings:
• The percentage of economically
active claiming to be unemployed
has fallen by 3.1 percentage points
over the past five years, falling
from 10.3% in 2014 to 7.2% in
2019, compared to a fall of 2.9
percentage points nationally.
• However over the last year
unemployment in Tees Valley has
risen by 0.9 percentage points
compared to a fall of 0.2
nationally.
Key Findings:
• Over a quarter (28%) of 16-19 year
olds in Tees Valley are claiming to
be unemployed compared to 17%
nationally.
• 10.8% of 20-24 year olds are
claiming to be unemployed
compared to 9.8% nationally.
• 8.7% of 25-34 year olds are
claiming to be unemployed
compared to 3.7% nationally.
7.11. Economically Active
The economically active population comprises all persons who are either "employed" or
"unemployed and actively seeking employment".
281,100 people aged 16-64 (74% of the working age population in Tees Valley) were economically
active in June 2019, compared to 79% nationally, this comprised of:
• 92.8% in employment (95.9% nationally).
• 7.2% unemployed (4.1% nationally).
Figure 7.60 shows the percentage of economically active claiming to be unemployed.
Figure 7.60. Percentage of economically active claiming to be unemployed
Source: ONS APS Figure 7.61 shows that Tees Valley has a higher percentage unemployed across all age ranges than
national.
Figure 7.61. Percentage of age specific population claiming to be unemployed
Source: ONS APS June 2019

95
Key Findings:
• The percentage of 16-19 year olds
claiming to be unemployed has
dropped from 32% in 2014 to 28%
in 2019, a drop of 3.9 percentage
points compared to a drop of 9.7
nationally. The raise in
participation age may have
contributed to this.
• The percentage of 20-24 year olds
claiming to be unemployed peaked
at 21% in 2016 before falling to
10.8% in 2019, an overall fall of 8.3
percentage points, compared to a
drop of 5.3 nationally.
Key Findings:
• 2.2% of the working age
population claim to be
unemployed with a health
condition or illness which has
lasted over 12 months (2019).
This compares to 1.2% nationally.
• This has increased by 0.3
percentage points since 2018,
compared to a 0.1 fall nationally.
Figure 7.62. Percentage of age specific population claiming to be unemployed over time
Source: ONS APS 14
Figure 7.63. Percentage of working age population unemployed with health conditions or illnesses which has
lasted over 12 months
Source: ONS APS
14 Government legislation introduced in 2013 requires all young people to continue in education or training until at least their 18th birthday
14

96
Key Findings:
• Tees Valley has a higher percentage of males
claiming unemployment benefits than national
at 58% compared to 42%.
• 42% of females were claiming unemployment
benefits in August 2019 compared to 47%
nationally.
• The male/female split has remained fairly steady
over the past 5 years.
Key Findings:
• The largest gap between the Tees Valley and
national age groups is the 20-24 age group, in
which 7.5% are claiming in Tees Valley, compared
to 3.7% nationally.
• After the 20-24 age group the gap between the
national figures closes as the age range increases.
7.12. Alternative Claimant Count
In August 2019 5.2% of 16-64 year old Tees Valley residents were claiming either Job Seekers
Allowance or Universal Credit (and required to seek work), compared to 3.1% nationally. This rises
to 6% for 16-24 year old residents, double the national rate of 3%.
Universal Credit is designed so that a broader span of claimants is required to look for work than
under Job Seekers Allowance. Therefore, the ONS alternative claimant count models what the count
would have been if Universal Credit had been fully rolled out since 2013 (when Universal Credit
began), with the broader span of people this covers.15
Figure 7.64. Gender split of claimant count
Source: ONS Alternative Claimant Count August 2019
Figure 7.65. Age split of claimant count – August 2018
Source: ONS Claimant Count August 2019
15 Universal Credit has been rolled out to all new claimants in stages across Tees Valley in the following order: Hartlepool - December 2016, Darlington - June 2018, Stockton - July 2018, Middlesbrough - October 2018 and Redcar & Cleveland - November 2018. It is expected that DWP will begin moving all remaining existing benefit claimants to the Universal Credit full service between July 2019 and December 2023.

97
Key Findings:
• Jobs density in Tees Valley has
increased year on year from 0.66
in 2011 to a high of 0.72 in 2015,
before falling to 0.70 in 2018.
Key Findings:
• The median gross annual full time
salary for Tees Valley residents has
increased by 7.5% (£1,890) over
the last 5 years, however this
compares to a rise of 11.5%
nationally and 11.2% across the
North of England.
7.13. Job density
Figure 7.66 shows that Tees Valley consistently has a lower jobs density that nationally with 0.70
jobs for every working age resident in 2018 compared to 0.87 jobs nationally.
Figure 7.66. Job Density
Source: ONS Jobs Density
7.14. Wages and disposable income
a) Median full time earnings
Tees Valley historically has a low percentage of residents employed in high value occupations16
compared to the national average; 38.4% employed in high value occupations in 2018 compared to
42.1% nationally. Tees Valley is 3.8% below the national average compared to 4.5% five years ago.
For workers living in Tees Valley the median gross annual full time wage in 2019 was £27,040
compared to £30,660 nationally and £27,850 across the North of England. Figure 7.67 shows how
this has changed over time:
Figure 7.67. Median gross annual full time earnings
Source: ONS – Annual Survey of Hours and Earnings
16 High value occupations are defined as Managers, Directors or Senior Officials, Professional occupations or Associate
Professional and Technical occupations.

98
Key Findings:
• Stockton-on-Tees residents
currently have the highest
weekly full-time earnings in the
Tees Valley at £580 per week,
followed by Hartlepool with
£550. Redcar and Cleveland and
Middlesbrough residents have
the lowest weekly earnings at
£500 per week.
Key Findings:
• Weekly wages for Redcar and
Cleveland residents are now
£500, very close to their pre-SSI
amount of £510 in 2015, and 5%
higher than the £475 recorded in
2014.
• All Tees Valley Local Authorities
have experienced a rise in
weekly full time earnings
compared to five years ago,
ranging from a 17% rise in
Hartlepool, to a 5% rise in Redcar
& Cleveland.
Figure 7.68 Median gross weekly full time earnings17 by resident local authority 2019
Source: ONS – Annual Survey of Hours and Earnings
In October 2015 the SSI Steelworks in Redcar and Cleveland closed resulting in the loss of over 2,000
jobs, with many of these highly paid. The impact of this closure on weekly earning in Redcar and
Cleveland can be seen in figure 7.69.
Figure 7.69. Median gross weekly full time earnings by resident local authority over time
Source: ONS – Annual Survey of Hours and Earnings
17 Weekly wages have been used instead of annual wages for the local authority breakdown as confidence internals for annual wages at a local authority level made the data unreliable.

99
b) Median household income - Gender
Males continue to earn a higher median gross weekly full-time wage than females, both within Tees
Valley and nationally, with a weekly difference of around £110 in Tees Valley and £104 nationally.
Figure 7.70. Median gross weekly full-time earnings
Source: ONS – Annual Survey of Hours and Earnings 2019
c) Gross Disposable Household Income
Gross disposable household income (GDHI) is the amount of money that all of the individuals in a
household have available for spending or saving after they have paid direct and indirect taxes and
received any direct benefits.
In 2017 GDHI per head in Tees Valley was £15,469, compared to £19,988 nationally and £16,263
across the North of England.
Figure 7.71. GDHI per head
Source: ONS GDHI
Key Findings:
• Tees Valley male residents earn on
average £580 per week for full-time
work, compared to £635 nationally.
• Tees Valley female residents earn on
average £470 per week for full time
work compared to £530 nationally.
Key Findings:
• Over the last 5 years GDHI has risen by
8% in Tees Valley from £14,330 in 2012
to £15,470 in 2017, compared to a 13%
rise nationally and a 9% increase across
the North of England.

100
Figure 7.72. Growth in GDHI per head from 2016 to 2017 (%)
Source: ONS GDHI
Key Findings:
• Of all the Combined Authorities Tees
Valley saw the second largest rise in
the percentage of GDHI per head over
the last year, with a 1.3% rise (£206 per
head). This is a significant
improvement on last year which saw
Tees Valley with the largest fall out of
all Combined Authorities.

101
7.15. Education, Employment and Skills SWOT analysis
Strengths Weaknesses The majority of Tees Valley primary schools are above the national average with high quality schools and above average Key Stage 2 results in all subject areas. Tees Valley has good quality Post 16 skills provision with overall achievement and pass rates for 16-18 year olds at Tees Valley FE+ colleges higher than national, however A level results are below average. Participation in higher education is above average with a higher percentage of 18-39 year olds in higher education than national, and top subjects for participation supporting key sector strengths in Tees Valley. Teesside University is described as the UK’s leading higher education institution for working with business and received the Queen’s Anniversary Prize for work at world-class level in the field of enterprise and business engagement. The University of Durham, Middlesbrough College and The Northern School of Art have been awarded a Gold standard Teaching Excellence Framework after a rigorous review of higher education standards judged that they provide teaching of the highest quality in the UK. Tees Valley has sectoral strengths in a number of key sectors including Chemical and Process, Raw Materials and Agriculture, Advanced Manufacturing and Clean Energy Low Carbon. Unemployment has fallen by more than the national average over the past 5 years.
Tees Valley has a higher percentage of 16-34 year old residents starting an apprenticeship than nationally and apprenticeship achievement rates are consistently higher than the national average.
The quality and performance of Tees Valley Secondary schools are below national average. School performance at a local level varies between Local Authorities with pockets of under-achievement in both primary and secondary. Tees Valley has lower than national A-level level results. Higher Education postgraduate participation and achievement are much lower than national. The percentage of graduates in employment 6 months after graduating is lower than national, with the percentage finding employment within Tees Valley falling year on year for the past 5 years. Labour market performance is below average with high unemployment and lower than average job density (number of jobs per population). Whilst there are many high-skilled jobs in the area, there are also a relatively high proportion of low skilled jobs with a low percentage of residents employed in high value occupations compared to the national average, impacting on the areas productivity. Youth unemployment is a particular issue with a higher than average number of 16-24 year olds unemployed and claiming benefits. In addition a high number of 16-17 year olds are NEET (Not in Education, Employment or Training). The amount of disposable income available to Tees Valley households is much lower than national despite the recent rise. The number of residents with higher level skills is below average and Tees Valley has a higher than average number of residents with no qualifications, which has risen over the past 5 years. Whilst the percentage of 16-34 year olds starting an apprenticeship is higher than national, apprenticeship starts have fallen by 37% over the last 3 years compared to a 23% drop nationally. The number of 16-18 year olds starting an apprenticeships has fallen by 12% over the past year compared to an 8% fall nationally and the number of people doing Higher Level Apprenticeships is lower than national levels. Apprenticeships achievement

102
rates are also much lower than national for higher apprenticeships. Employment in Chemical and Process, a priority sector for Tees Valley, has fallen by 35% over the last 5 years, compared to a 9% increase nationally. Deprivation is high (Tees Valley is the second most deprived LEP in England, as ranked by the 2019 Index of Multiple Deprivation) with lower levels of attainment at both primary and secondary level for students eligible for Free School Meals, in comparison to those not eligible.
Opportunities Threats There is currently high job demand for teachers, carers, nurses, engineers, IT professionals and teaching/nursery assistants. There are 133,000 jobs that may need filling by 2024, including 17,000 new jobs and 116,000 replacement jobs, with over half requiring high level skills. There will still be a high demand for intermediate and lower level skills, particularly in replacement jobs. Private sector employment has risen by 2.1 percentage points since 2015-16, compared to a rise of 0.6 nationally. Automation and robotics is likely to impact disproportionally on lower skilled work, potentially leading to relatively more unemployment in the short-run but also acting as a driver of productivity increase and economic growth via a rebalancing of paid work into intermediate and higher skilled new jobs in the longer-term. Employment in logistics has risen by 26% over the last 5 years in Tees Valley, compared to a rise of 10% nationally with the rise in online shopping services creating a number of logistics jobs. There is an opportunity to improve the image of Tees Valley, along with certain industry sectors, to encourage the retention and attraction of youth people to the area.
An ageing workforce is contributing towards potential skills shortages, and gaps that employers cannot fill, particularly in key sectors. The 18-29 year old population in Tees Valley is projected to continue its decrease until 2026, potentially resulting in a smaller higher education cohort. Graduates have become more and more likely to find work outside of Tees Valley over the past 5 years, with almost a quarter of graduates in non-graduate roles, potentially displacing those with lower level skills into unemployment. The retention of young people in Tees Valley is an issue on the back of this aging workforce and fall in graduates finding employment in the area. Employers are reporting skills shortages, with skills in IT, Construction, Education and Manufacturing most sought.
Tees Valley has a higher than average number of residents who are Economically Inactive, in particular those who are long term sick. This can be a key barrier to improving education, employment and skills.
Tees Valley consistently has a lower than average job density with a higher than average number of residents unemployed.
Wages are lower than average, which although may attract investors to the region discourages workers from remaining in the area.
Changing shopping habits and rise of online services continue to add pressure on high streets and reduce jobs in retail.

103
Section 8: Transport & Digital Infrastructure
The following section provides an overview of the transport, digital connectivity and infrastructure
needs in Tees Valley. It seeks to determine whether the area’s transport and digital infrastructure is
fit for purpose.
Transport and infrastructure is central to both a diversified and a high value, low carbon economy,
providing the links for people and goods to connect to the wider economy, while local transport is
central to an inclusive economy where local people can access employment opportunities across the
region.
As one of the Tees Valley Strategic Economic Plan’s priority area for growth, the aim for transport
and infrastructure is to improve connectivity within Tees Valley, across the Northern Powerhouse,
the UK and the world and ensure comprehensive access to superfast broadband.
Tees Valley has a well-recognised and growing business base in digital industries, with fast growing
companies now providing the employment opportunities which are allowing local, well qualified
young people to find good quality employment, with excellent career progression and enterprise
opportunities. Digital connectivity is critically important to modern businesses and must ensure that
our digital infrastructure remains fit for purpose into the future.
Unlocking the growth potential of Tees Valley requires resilient and reliable connections across the
area. This includes into and out of the area by air, road, rail, bus, foot and bicycle, as well as an
increasing reliance on digital connections that connect the region nationally and internationally.
Tees Valley firms must be supported to access UK and European supply chains, particularly in the
Northern Powerhouse, which in turn will enable Tees Valley residents to benefit fully from emerging
job opportunities.
The TVCA Investment Plan 2019 – 2029 identifies a total of £256.7m which has been earmarked to
transform transport across Tees Valley. The investment will be guided by the Strategic Transport
Plan and aims to unlock 2,600 jobs and an additional £472m GVA within the economy.
The Tees Valley has a number of locally and nationally significant transport assets, which underpin
economic activity and also offer economic growth opportunities in their own right. These include:
• The port of Tees and Hartlepool: The largest port in England in terms of outward tonnage
and provides a critical gateway to world markets for the Tees Valley industrial platform.
• Major highways: The A1 (M), A66, A19, A171 and the A1053 provide fast communications
within the sub-region as well as to the North East region and the rest of the country.
• Rail connections: Darlington acts as a critical rail ‘gateway’ into and out of the Tees Valley
and is the main interchange hub for national and inter-regional rails connections. Transport
plans for Tees Valley take account of Transport for the North activities, as well as the need
for efficient freight and passenger transport corridors running both north and south and east
to west.

104
Digital infrastructure – Tees Valley is evolving into one of the most vibrant digital hubs in the UK with
a successful and self-sustaining digital media, technology and creative supercluster developing a
worldwide reputation for creativity, imagination and vision. Whilst the region has the second
highest proportion of premises with superfast broadband coverage in the country, pockets of poor
broadband provision still exist. Infrastructure is a key determinant of a local economy’s internal and
external connectivity, which are important influencing factors on productivity.
Key messages
• After a number of years of declining passenger numbers, Teesside International Airport
recorded a significant increase in passengers in 2018. The continuing growth of the
Airport is a key priority within the Combined Authority’s new ten year Investment Plan.
• Tees Valley has rapid East Coast Mainline rail connections with Darlington to London in
2½ hours. Direct trains are also available from Hartlepool to London in under 3¼ hours.
• The port of Tees and Hartlepool is a key asset for the area with great potential for
supporting export growth from Tees Valley, surrounding regions and the UK as a whole.
It is the largest English port in terms of outwards tonnage despite this falling by more
than a fifth between 2015 and 2018. However, the port is particularly reliant on Crude
Oil Liquid Bulk trade (a declining cargo) which accounts for the vast majority (96%) of
England’s outward Crude Oil tonnage and 69% of the port of Tees and Hartlepool’s total
outward tonnage.
• Tees Valley is a relatively compact (300 square miles), functional economic area with
close to 9 in 10 of working residents employed in the region. Commuting is broadly
balanced between in and out commuters, which results in little overall impact on
aggregate Tees Valley productivity rates.
• Average road speeds are significantly quicker than other built up areas in England.
• Increasing levels of motor vehicle and rail usage contrast with falling levels of bus usage.
• Excellent digital infrastructure and connectivity is helping to drive productivity growth,
although pockets of poor connectivity remain.
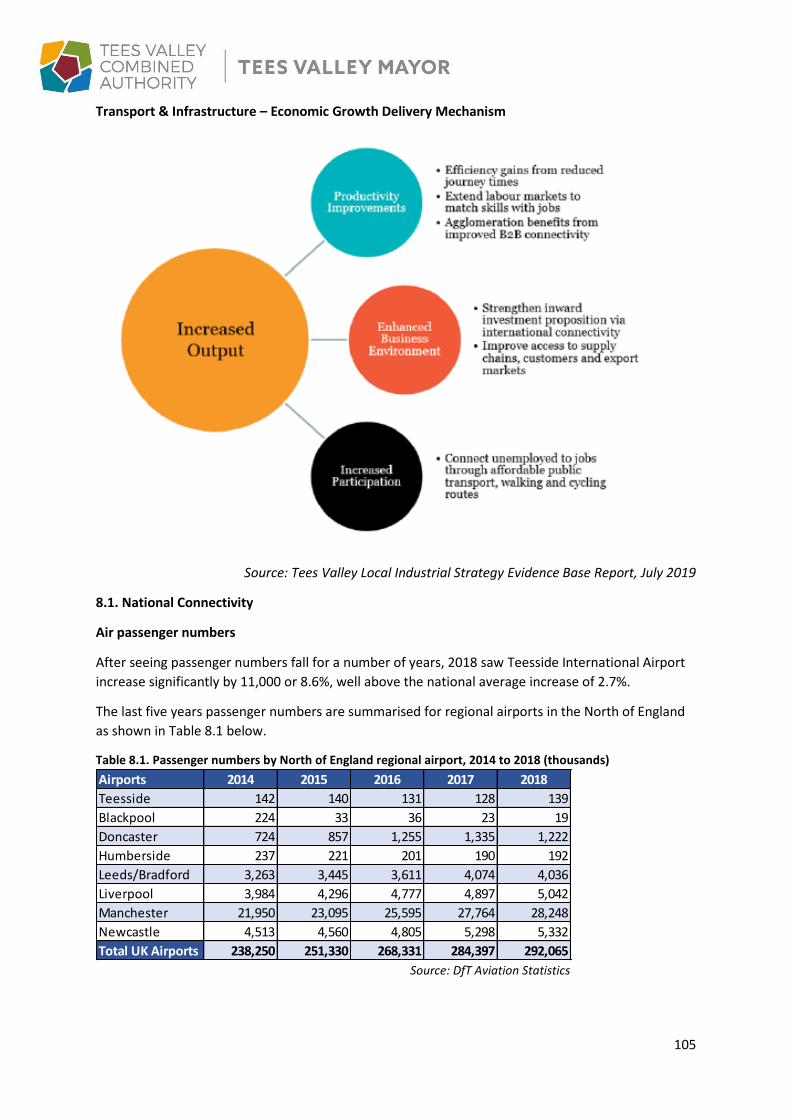
105
Transport & Infrastructure – Economic Growth Delivery Mechanism
Source: Tees Valley Local Industrial Strategy Evidence Base Report, July 2019
8.1. National Connectivity
Air passenger numbers
After seeing passenger numbers fall for a number of years, 2018 saw Teesside International Airport
increase significantly by 11,000 or 8.6%, well above the national average increase of 2.7%.
The last five years passenger numbers are summarised for regional airports in the North of England
as shown in Table 8.1 below.
Table 8.1. Passenger numbers by North of England regional airport, 2014 to 2018 (thousands)
Source: DfT Aviation Statistics
Airports 2014 2015 2016 2017 2018
Teesside 142 140 131 128 139
Blackpool 224 33 36 23 19
Doncaster 724 857 1,255 1,335 1,222
Humberside 237 221 201 190 192
Leeds/Bradford 3,263 3,445 3,611 4,074 4,036
Liverpool 3,984 4,296 4,777 4,897 5,042
Manchester 21,950 23,095 25,595 27,764 28,248
Newcastle 4,513 4,560 4,805 5,298 5,332
Total UK Airports 238,250 251,330 268,331 284,397 292,065

106
Table 8.2 provides historical trend analysis for air freight (by tonne) from a selection of airports:
Table 8.2. Air Freight by airport (tonnes)
Airport 2008 2009 2018
DTVA 290 298 1
Newcastle 1,938 2,597 5,524
Leeds/Bradford 334 359 3
Manchester 141,781 102,543 114,131
Total UK airports 2,282,153 2,047,861 2,645,710
Source: Civil Aviation Authority – Airport Data
There has been a 15.9% increase in air freight across the UK since 2008, an extra 363,557 tonnes
compared to a 17.1% fall across the North totalling 24,684 tonnes. Newcastle is the only airport to
see a rise in air freight. Teesside International has seen air freight fall to almost zero over the last
decade.
Port freight traffic
The port of Tees and Hartlepool remained the largest English port in terms of outward tonnage in
2018 with 16.8m tonnes, a drop of 0.6m tonnes from 2017. Crude Oil accounted for 69% of outward
freight as shown in the chart below. The port is the main English port for outwards Crude Oil trade
tonnage, accounting for 96% of the England total. In contrast, inward Crude Oil trade into the port of
Tees and Hartlepool was zero for a second consecutive year in 2018.
Figure 8.1. Tees & Hartlepool port freight traffic by cargo type, Outwards tonnage (thou’s)
Source: DfT Port Freight Statistics
Over the last three years, there has been a fall of 4.7m tonnes in the port of Tees and Hartlepool’s
outward tonnage, a drop of 22%. The fall is due to decreases in Crude Oil, down 1.77m tonnes (13%
lower), Iron and Steel down 2.13m tonnes (89% lower), Dry Bulk down 0.91m tonnes (56% lower)
and Other Liquid Bulk down by 0.45m tonnes (16% lower).
In 2018 the port of Tees and Hartlepool recorded 12.0m tonnes inward tonnage ranking it 8th in the
UK. Inward tonnage increased by 0.99m tonnes over the last year, an increase of 9% compared to a
3% increase across all UK major ports.
Overall tonnage (outwards plus inwards) for the port of Tees and Hartlepool stood at 28.8m tonnes
in 2018 making it the 6th largest UK port in terms of total tonnage. Overall tonnage has increased for
a second year, rising from 28.4m tonnes in 2017.

107
8.2. Local Connectivity
Travel to work patterns
Commuting in Tees Valley is relatively self-contained (one definition of a functional economic area)
when compared to many other areas. Around 247,700 people (87% of working residents) live and
work in Tees Valley with 38,100 residents commuting to surrounding areas - particularly County
Durham, North Yorkshire and Tyne & Wear - and 34,700 residents of surrounding areas choosing to
work within Tees Valley. The flows for each Tees Valley local authority area are detailed in Table 8.3
below.
Table 8.3. Tees Valley travel to work flow summary
Within LA
Outflow Inflow Net inflow (-ve=outflow)
TV Other TV Other TV Other
Darlington 33,900 5,000 15,400 4,200 18,500 -900 3,000
Hartlepool 26,000 6,400 11,900 4,400 8,400 -2,000 -3,600
Middlesbrough 33,000 16,000 21,700 24,200 30,100 8,200 8,400
Redcar & Cleveland 33,300 17,200 23,300 9,800 12,800 -7,400 -10,500
Stockton-on-Tees 56,600 20,300 30,800 21,200 30,000 800 -800
Tees Valley 247,700 - 38,100 - 34,700 - -3,300
Source: Census 2011
In terms of average travel to work time, Tees Valley commuters enjoy the shortest time spent
getting to work of any North of England LEP area outside of Lancashire. In 2016, the typical
commuting journey time for Tees Valley was 25 minutes compared to the LEP average of around 27
minutes.
Tees Valley road usage
The figure below shows that the average road speed on ‘A’ roads in Tees Valley is 30.0 miles per
hour, significantly quicker when compared against metropolitan counties across the North of
England. Average speeds in Tees Valley are also significantly faster than other built up areas in the
Midlands and South of England including West Midlands Metropolitan County at 19.8 mph, West of
England Combined Authority had a local authority average of 21.1 mph and Inner London at 10.9
mph.

108
Figure 8.2. Average speed on local ‘A’ roads (miles per hour) - Tees Valley and North of England
Metropolitan County areas, 2018
Source: DfT
Reflecting the health of the local economy and in particular its improving employment rates, the
total distance travelled by motor vehicle in Tees Valley has been increasing since 2013, as shown in
the Table 8.4.
Table 8.4. Total distance travelled by motor vehicle, Tees Valley local authorities
Million vehicle miles
2013 2014 2015 2016 2017 2018
Darlington 485 498 505 497 496 508
Hartlepool 380 384 392 396 398 412
Middlesbrough 714 737 753 741 761 786
Redcar & Cleveland 538 553 548 557 562 582
Stockton-on-Tees 873 911 926 936 936 941
Tees Valley 2,990 3,083 3,124 3,127 3,153 3,229 Source: DfT road traffic statistics
This pick-up in motor vehicle usage has been mirrored by a fall in bus patronage across all Tees
Valley districts, as shown in Table 8.5. For example, over the past three years 3.4m fewer bus
journeys were made in Tees Valley (2018/19 as compared to 2015/16).
Table 8.5. Bus patronage data (millions), Tees Valley local authorities
2013/14 2014/15 2015/16 2016/17 2017/18 2018/1918
Darlington 6.544 6.419 6.330 6.168 5.903 5.677
Hartlepool 4.581 4.582 4.366 4.328 3.981 3.785
Middlesbrough 8.983 8.680 8.168 7.736 7.308 7.216
Redcar & Cleveland 4.278 4.262 4.122 3.874 3.631 3.553
Stockton-on-Tees 8.390 8.533 8.075 7.866 7.551 7.397
Tees Valley 32.776 32.476 31.061 29.972 28.374 27.628 Source: Connect Tees Valley, TVCA
18 Figures for Go-NE are not available (Middlesbrough, Stockton and Hartlepool)
Key findings:
• Tees Valley’s average ‘A’ road
speeds are significantly quicker
than other metropolitan areas in
the North of England and well
above the national average of
24.9 mph.

109
Rail usage - journeys within Tees Valley
In terms of aggregate Tees Valley rail station usage, boardings and alightings totalled 6.57m across all stations during 2018/19, stable from the 6.56m in 2017/18. However, the total remains well above the recent low of 6.17m recorded in 2012/13. The five busiest stations in the Tees Valley – Darlington, Middlesbrough, Hartlepool, Thornaby and
Redcar Central accounted for 5.24m boardings and alightings in 2018/19, 80% of aggregate Tees
Valley station usage.
Across Tees Valley, the East Coast Mainline station (Darlington), had the highest station usage in
terms of total boardings and alightings with 2.4m in 2018/19. Middlesbrough was second with 1.3m,
Hartlepool third with 632,000 and Thornaby fourth with 592,000. Redcar Central was fifth busiest
with 324,000 boardings and alightings. Around 1.33m rail journeys (20% of the Tees Valley
aggregate) were made through other Tees Valley stations over the year, ranging from Saltburn’s
241,000 down to Teesside Airport’s 208 boardings and alightings.
Figures 8.3. to 8.7. Most common journeys to/from Tees Valley stations, 2018/19

110
8.3. Digital connectivity
Digital connectivity in Tees Valley is well above the national average, especially for Ultrafast
broadband with an average availability with 90.34% of all residential and business premises covered
compared to 59.08% nationally. Darlington is the only Tees Valley local authority that has a relatively
low level of superfast broadband availability when compared to other parts of the country.
Table 8.6. Tees Valley local authority level broadband coverage as at December 2019
Source: thinkbroadband.com
Superfast EU (>30 Mbps)
Ultrafast (>100 Mbps)
Darlington 94.71% 86.93%
Hartlepool 97.72% 90.64%
Middlesbrough 97.31% 93.57%
Redcar & Cleveland 97.87% 90.18%
Stockton-on-Tees 97.31% 90.37%
Tees Valley average 96.98% 90.34%
UK 96.06% 59.08%
Key findings;
• Newcastle was the most popular journey
to/from both Darlington and Hartlepool
stations.
• Darlington saw the majority of longer
journeys to/from other parts of the Great
Britain along the East Coast Main Line.
• Middlesbrough, Thornaby and Redcar’s
journeys were mainly to other stations
within Tees Valley, the North East and
Yorkshire.
Key points
• All five Tees Valley local
authorities score significantly
above UK average coverage for
Ultrafast broadband.
• Stockton, Redcar & Cleveland,
Middlesbrough and Hartlepool
have relatively high levels of
Superfast broadband coverage.
• Only Darlington has a slightly
lower Superfast broadband
coverage than nationally.
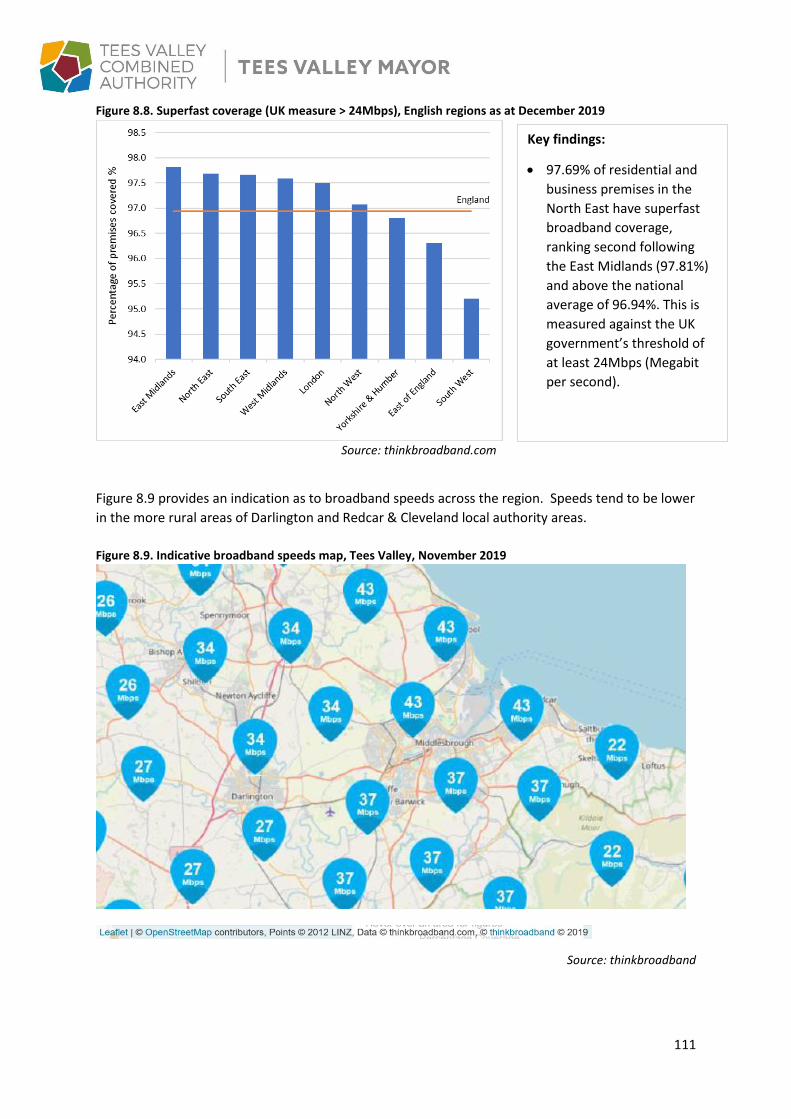
111
Figure 8.8. Superfast coverage (UK measure > 24Mbps), English regions as at December 2019
Source: thinkbroadband.com
Figure 8.9 provides an indication as to broadband speeds across the region. Speeds tend to be lower
in the more rural areas of Darlington and Redcar & Cleveland local authority areas.
Figure 8.9. Indicative broadband speeds map, Tees Valley, November 2019
Source: thinkbroadband
Key findings:
• 97.69% of residential and
business premises in the
North East have superfast
broadband coverage,
ranking second following
the East Midlands (97.81%)
and above the national
average of 96.94%. This is
measured against the UK
government’s threshold of
at least 24Mbps (Megabit
per second).

112
8.4. Transport & Digital Infrastructure SWOT analysis
Strengths Weaknesses
International gateway and deep-water port with extensive spare capacity and strong growth potential. The port of Tees and Hartlepool already accounts for 96% of England’s outward Crude Oil trade. Low levels of congestion together with some of best digital connectivity in the country providing an investment ready environment with minimal growth constraints. Excellent superfast broadband coverage in key urban centres. Busy East Coast Main Line railway station and rail gateway hub at Darlington – 2hrs 30 minute journey time to London. Relatively little road congestion and fast commuting times. A wide range of sectoral training provision e.g. Stockton Riverside College’s Logistics Academy. Major logistics investments e.g. Amazon in Darlington and strategic infrastructure projects such as Middlesbrough’s Centre Square office development, Teesside Advanced Manufacturing Park (TeesAMP) and the digital and creative hub, Boho Zone.
Over-reliance on Crude Oil outward trade (69% of Tees Valley total outward tonnage) – a declining cargo in which tonnage has more than halved since 2000 and is continuing to fall. Ageing local rail rolling stock. Limited east west rail connectivity. Existing River Tees crossing points acting as bottle-necks. Poor connectivity between dispersed and multiple concentrations of housing and industry. Broadband coverage patchy in some rural areas.
Opportunities Threats
An established international airport with the potential for rapid expansion supporting wider economic growth, including the development of a new logistics park. Ideal compact and low lying valley geography for the development of a complementary programme of cycling, walking and other sustainable transport measures. Potential productivity improvements from investing in improving all forms of connectivity between settlements and employment centres including a new Tees crossing, Middlehaven Dock Bridge and Portrack Relief Road. As a significant employer with existing sub-sectoral strength, road and rail freight is playing an increasing
Lack of investment in transport and digital infrastructures may lead to a deterioration in Tees Valley’s presently relatively strong position under this theme. Pockets of poor digital connectivity e.g. in many rural areas across Darlington and in some major commercial areas such as Middlesbrough. These digital access inequalities impact negatively on aggregate productivity.

113
important role in facilitating the movement of goods beyond Tees Valley’s borders. Planned developments include a minerals processing plant (potash from North York Moors) at Wilton with new deep-water facility on the River Tees. Potential to develop and advance proposals for the creation of a Free Zone in Tees Valley following the Chancellor’s Special Economic Zone. Strengths in Advanced Manufacturing, Chemical & Process and Energy & Circular Economy provides potential for greater than average returns to investment in industrial digitalisation. Potential supply chain opportunities for electric and self-driving vehicles.

114
Section 9: Place and Culture
The following section provides a summary of the Tees Valley place and culture offer, with a focus on
those areas that relate to the Combined Authority’s vision for the region to establish a global
reputation as a vibrant and thriving place to be, and where the culture offer supports the
development of a successful business environment.
Tees Valley has a strong and distinctive sense of place. It reflects our industrial heritage, our
geographical location and our compactness. Each of our five boroughs and main towns has distinct
economic assets and opportunities which lend themselves to particular investments. It is essential
that we can unlock these in a way that benefits all of our residents.
Place and Culture are both individual growth themes in the Strategic Economic Plan 2016. They are
central to the creation of a diversified and inclusive economy and they are the building blocks
providing the everyday social and economic infrastructure which attracts people and investment to
the region.
Ensuring a high quality environment where people and business thrive is a critical enabler to our
Local Industrial Strategy and one in which the region has long invested in, not only upgrading town
centres but also in remediating former industrial sites, protecting and enhancing natural assets.
Culture also contributes to diversifying the economy, providing new and varied employment
opportunities many of which will be available to young people, boosting the visitor economy and
changing external perceptions of potential inward investors and skilled workers, thereby helping to
ensure new investment linked to growth sectors and the low carbon economy.
The ambitions for both place and culture in the SEP are: -
Place: To implement growth and renewal plans to ensure Tees Valley is a place where people want
to live, work and play; where health and well-being flourishes and where businesses want to invest.
Culture: To change external perceptions of Tees Valley through the arts, culture and leisure offer to
create places that attract and retains businesses and business leaders and make the area more
attractive to investors, workers and visitors.
To support these ambitions we will continue to invest in place to ensure that we continue to attract
and retain the businesses and people we need. The Investment Plan 2019 – 2029 commits £110m to
support our ambitions; £50m for Place and £60m for culture over the life of the plan.
The ‘place’ offer of Tees Valley – and the culture, leisure and tourism sectors in particular – make an
important contribution to our economy, both directly and indirectly. Almost 20m people visited the
area in 2018, with tourism contributing almost £1bn to our economy and supporting 12,000 jobs. It
is estimated that the cultural sector supports 2,500 jobs, although there is likely to be some overlap
with the tourism data.
The development and effective promotion of a strong sense of place is also critical through raising
the Tees Valley’s profile and enhancing perceptions of the quality of life offer available. In turn, this
shapes our ability to attract and retain the workforce and inward investment needed to drive future
growth. Within this context, Tees Valley’s broader sense of place is also characterised by its cost
competitiveness and the availability of a plentiful supply of land for employment development.

115
Place, Culture and economic growth
Place and Culture are key drivers of economic growth. They reflect spatial patterns of development
and the inter-relationship between different settlements, as well as the built and natural
environment, cultural and recreational amenities. Businesses and highly-skilled workers are
increasingly basing their location decisions on the ‘liveability’ of a place in addition to the strength of
its economy.
Place and Culture – Economic Growth Delivery Mechanism
Source: Tees Valley Local Industrial Strategy Evidence Base Report, July 2019

116
Key messages
• The cost of living, and the quality of life this affords in Tees Valley is an attractive
proposition. With average wage rates far closer to the national average than house
prices, Tees Valley has some of the most affordable homes in the country. Average
housing rental costs also account for a significantly smaller share of wages than
nationally.
• The cost of business premises are also significantly lower than in other parts of the
country, with both office and industrial units’ occupancy costs amongst the lowest
nationally.
• There were almost 20m visitors to the Tees Valley in 2018, up by 90,000 on 2017.
• Over £960m was spent across the Tees Valley visitor economy in 2018, an annual
increase of £39m or 4.2% on 2017.
• The Tees Valley visitor economy employed over 12,000 full-time equivalent workers in
2018, up by over 1,000 in just three years.
• Outstanding cultural offer and an extensive culture asset base.
• Well-being measures broadly reflect relative deprivation levels with Middlesbrough and
Hartlepool seeing the lowest level of residential life satisfaction and happiness.
• Driven by industrial closures, Tees Valley CO2 emissions have declined by more than 60%
since 2005, including a 39% decrease between 2015 and 2016 due to the closure of SSI.
• Net emission from natural capital assets in Tees Valley is estimated at 170,000 tonnes of
CO2 equivalent per year. This has an annual social cost of around £12m.

117
9.1. Housing
The average house price paid in Tees Valley for the year ending 2018 was £155,700, a little more
than half the English average of £304,000.
After peaking in the mid-2000’s and drifting lower up to 2013, new build prices in Tees Valley have
since picked up with growth rates close to those seen nationally. However, the recovery in growth
rates for existing houses observed nationally since 2013 has not been reflected in the Tees Valley.
Figure 9.1. Mean price paid (£) – existing and new build houses, Tees Valley and LEP mean, 1996-2018
Source: ONS, House Price Statistics for Small Areas and ONS
It is more affordable to purchase a house in Tees Valley than in other areas of England. The Tees Valley average house price is only 6.2 times that of the average annual salary, whereas it is 10 times that in England. Table 9.1. Mean pay and house price ratio, Tees Valley, North of England and England
Mean annual gross pay (£ p.a.)
Mean house price (£) Ratio of house price to salary
Tees Valley 25,300 155,700 6.2
North East 25,600 164,400 6.4
England 30,400 304,000 10.0 Source: ONS, House Price Statistics for Small Areas and ONS, ASHE, 2018 estimates
Tees Valley also has very low rents in comparison to median pay, meaning rents are more affordable than in other areas. In Tees Valley, only 30% of take home pay would be spent on renting a two bedroom home whereas it would be 47% of pay in England.

118
Table 9.2. Take home pay, average rents and ratios, Tees Valley, North East and England
Median monthly net
take home pay (£)
Mean rent for one
bedroom (£)
Mean rent for two
bedrooms (£)
% of take home pay
on one bed rent
% of take home pay
on two bed rent
Tees Valley 1,549 390 465 25 30
North East 1,572 426 489 27 31
England 1,718 731 800 43 47 Source: Valuation Office Agency and ONS, ASHE, 12 months to March 2019
The English Indices of Multiple Deprivation (further analysis is included under the Area Profile section of this report on page 13) includes the domain Barriers to Housing & Services, which brings together geographical barriers (distance to services) with wider barriers covering household overcrowding, homelessness and housing affordability. Whilst Tees Valley scores as relatively less deprived on this domain across the majority of its geography, it does include some relatively deprived areas, particularly in the more rural parts of Tees Valley. This is shown in the figure below. Figure 9.2. Barriers to Housing and Services domain, Tees Valley LSOAs, 2019
Source: MHCLG. English Indices of Deprivation 2019
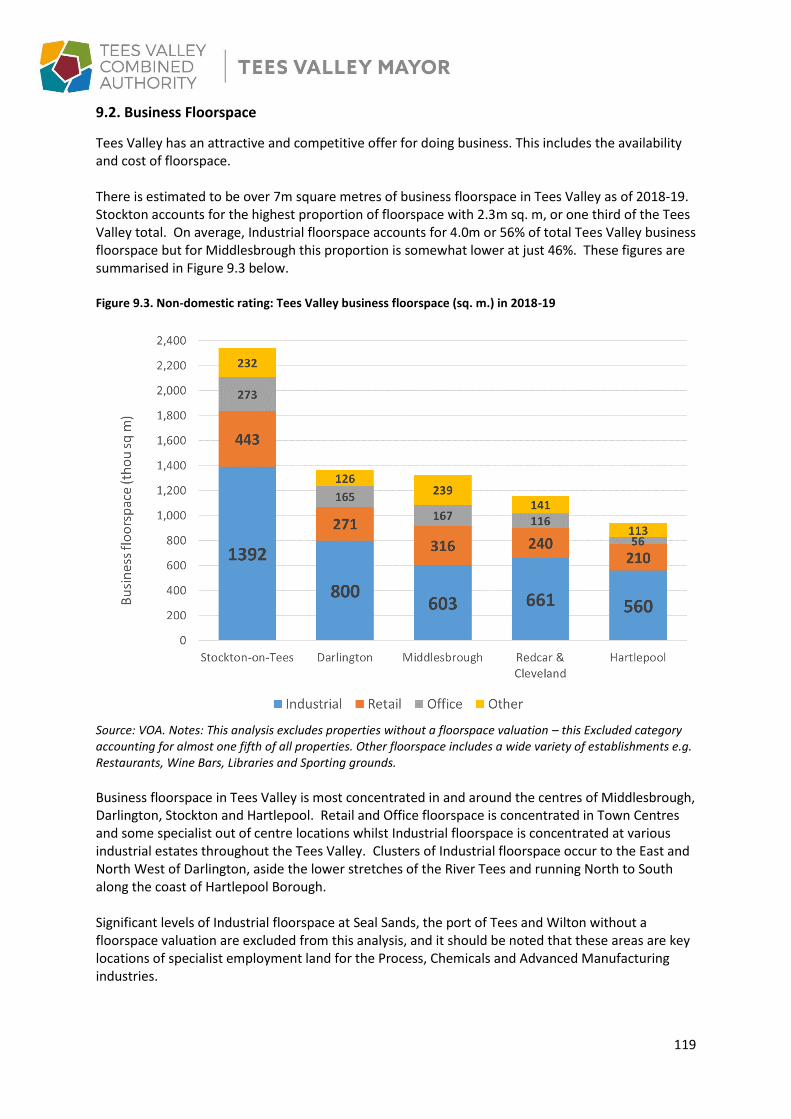
119
9.2. Business Floorspace
Tees Valley has an attractive and competitive offer for doing business. This includes the availability and cost of floorspace. There is estimated to be over 7m square metres of business floorspace in Tees Valley as of 2018-19. Stockton accounts for the highest proportion of floorspace with 2.3m sq. m, or one third of the Tees Valley total. On average, Industrial floorspace accounts for 4.0m or 56% of total Tees Valley business floorspace but for Middlesbrough this proportion is somewhat lower at just 46%. These figures are summarised in Figure 9.3 below. Figure 9.3. Non-domestic rating: Tees Valley business floorspace (sq. m.) in 2018-19
Source: VOA. Notes: This analysis excludes properties without a floorspace valuation – this Excluded category accounting for almost one fifth of all properties. Other floorspace includes a wide variety of establishments e.g. Restaurants, Wine Bars, Libraries and Sporting grounds.
Business floorspace in Tees Valley is most concentrated in and around the centres of Middlesbrough, Darlington, Stockton and Hartlepool. Retail and Office floorspace is concentrated in Town Centres and some specialist out of centre locations whilst Industrial floorspace is concentrated at various industrial estates throughout the Tees Valley. Clusters of Industrial floorspace occur to the East and North West of Darlington, aside the lower stretches of the River Tees and running North to South along the coast of Hartlepool Borough. Significant levels of Industrial floorspace at Seal Sands, the port of Tees and Wilton without a floorspace valuation are excluded from this analysis, and it should be noted that these areas are key locations of specialist employment land for the Process, Chemicals and Advanced Manufacturing industries.

120
9.3. Office and industrial units occupancy costs Tees Valley has some of the lowest operating costs in the country with rents, rates and terms significantly lower than all other major UK cities and a fraction of those in and around London. Average rents indicate that Middlesbrough in Tees Valley provides the most affordable rents in the UK, including for Grade A office space as shown in the table below. Table 9.3. Office, industrial and logistics rents and land value estimations, 2019
Location Office Rents Industrial & Logistics Rents
Grade
A
Grade
B
Big Sheds Small Sheds
Prime Secondary Land Values
Prime Secondary Land Values
Middlesbrough £13.00 £8.50 £5.00 £4.00 £175k £5.00 £4.25 £175k
Newcastle upon Tyne
£24.00 £16.50 £5.50 £4.50 £250k £6.50 £5.25 £250k
Leeds £30.00 £24.00 £6.50 £5.00 £650k £6.75 £6.00 £600k
Manchester £37.50 £28.50 £6.75 £5.50 £650k £7.25 £6.25 £550k
Heathrow £23.00 £18.00 £16.00 £12.50 £3.75m £16.50 £13.50 £4m
Source: Colliers. Notes: Rents are achievable open market rents for units (£ per sq ft) in prime locations as at
Summer 2019. Grade A/Prime rents apply to new accommodation whilst Grade B/Secondary rents apply to
second-hand units built in the 1990s. Office rents apply to units of 10,000 sq ft taken for a 10 year term whilst
Big Shed Industrial rents apply to units of 100,000+ sq ft and Small Shed rents apply to units between 10,000
and 30,000 sq ft. Land values are based on prime locations only and relate to 10+ acres for Big Sheds and up to
5 acres for Small Sheds.

121
9.4. Culture
Tees Valley has always had a small number of successful arts and cultural venues, including the likes
of Stockton Arts Centre (ARC) and Middlesbrough Institute of Modern Art (MIMA). In recent years,
the range of venues and events has grown with the development of Festival of Thrift, and the
Hippodrome and Theatre Hullabaloo at Darlington, to name just a few. Other cultural developments
would, once completed, constitute significant additional cultural assets, including Kirkleatham Estate
and the combined sites, alongside buildings and artefacts associated with the Stockton to Darlington
Railway and Hartlepool Maritime.
The graphic below identifies the locations of some of Tees Valley key cultural and visitor attractions.
Figure 9.4. Guide to the area at a glance
Source: Enjoy Tees Valley Mini Guide

122
The range of Tees Valley’s cultural and visitor offer is wide and varied. The assets associated with
offer are summarised in Table 9.4 below.
Table 9.4. Cultural and visitor assets in Tees Valley
Source: Culture and Visitor Sector Analysis and Baseline Insights, Amion Consultants, 2019
Area Profiles
Darlington has a strong industrial heritage including the first railway in the country from Darlington
to Stockton (with a bicentenary in 2025), a broad cultural offer including the newly renovated
Hippodrome Theatre and a nationally renowned children’s theatre group (Theatre Hullabaloo). As
such, the town has further opportunities to grow the visitor offer.
Hartlepool has a rich maritime heritage and is home to the National Museum of the Royal Navy.
Plans are in place to develop the Waterfront to create a mix of civic, cultural, leisure and visitor
attractions that complement the wider Hartlepool Marina area. The town is home to the Northern
School of Art, the leading provider of specialist creative art and design in the north, counting Sir
Ridley Scott among its former pupils. It is central to the opportunity to create the biggest film studios
outside London on the former council depot site, which will put Hartlepool at the centre of film
making in the north.
Middlesbrough’s Central Square will provide modern Grade A office developments and events
space. The recent upgrade of the Town Hall facility provides a cultural venue with access to a new
range of bars and restaurants, from high street chains through to the quirky Bedford and Baker
Street.

123
Redcar & Cleveland offers a wide range of outdoor pursuits and culture activities across the borough
including the North York Moors National Park, the heritage coastline, the beaches and the towns.
These culture activities include festivals (such as The Festival of Thrift) and events, and the provision
of new cultural venues including Kirkleatham, which will continue to grow the visitor offer.
Stockton is home to a mix of retail and visitor opportunities with Teesside Park and traditional
market towns such as Yarm, whilst in Stockton the vision for a repurposed High Street is being
created. This has a focus on culture, including the restoration of the Globe theatre (3,000 seat
venue), leisure, heritage and events including Stockton International Riverside Festival (SIRF) and
Great North CityGames, to appeal to more visitors. This ambition will also focus on strengthening the
links to the river – one of the Tees Valley’s greatest natural assets. The river offers enormous leisure
and development potential to maximise the ten miles of tidal controlled river frontage to create a
thriving river-based economy, building on successful attractions including the Olympic-standard
International White Water Course at the Tees Barrage, the Air Trail ropes course and Preston Park.
9.5. Urban area natural accounts
As part of the ongoing development of its national Natural Capital accounts, ONS have developed
indicators identifying the extent of natural land cover and green and blue space within built-up
areas.
The first Natural Capital Account for Tees Valley was developed in 2019, this uses the Natural Capital
Indicators of asset quantity, quality and location, and ecosystem services, to be included in local
Natural Capital Atlases.
At this stage, the Account does not provide trend data over time, or a comparator with other areas
(as not all areas have completed an Account to date). It is intended that this data will be available in
future years, to provide a fuller understanding of the relative importance of an areas’ natural assets.
Natural Capital - Tees Valley key findings
• The built-up areas of Tees Valley cover 19,586 hectares (approx. 76 square miles) representing a quarter of Tees Valley’s total geographic area. In terms of population, these built-up areas account for 98% of the total Tees Valley population.
• Natural land cover e.g. grassland, heath, scrub, orchards and coniferous trees in Tees Valley built-up areas is 5,836 hectares, 29.8% of total Tees Valley built-up area (30.7% in GB as a whole).
• Tees Valley blue space i.e. all inland water areas including rivers, lakes, ponds and canals is 117 hectares, 0.6% of Tees Valley built-up areas (1.2% GB).
• Functional green space (any green space that has a functional use) is 1,346 hectares, 6.9% of Tees Valley built-up areas (7.1% GB).
• Publicly accessible green space (these cover parks and public gardens, playing fields, cemeteries and religious grounds) is 902 hectares i.e. 67.0% of Tees Valley functional green space (67.9% GB).
• Non-publicly accessible green space (allotments and growing spaces, golf courses, bowling greens and other sports facilities such as cricket grounds) is 444 hectares.
• There are 620 functional green spaces in the built-up areas of Tees Valley of which 368 are publicly accessible.

124
9.6. CO2 emissions and flood risk
Impact of industry closure in Tees Valley on carbon emissions
Carbon emissions in the Tees Valley have reduced by over 61% in total since 2005, primarily due to
industrial closures. For example, in the local area, Redcar and Cleveland had a 61% decrease in
emissions in one year, due to the closure of SSI between 2015 and 2016. The North East region as a
whole has experienced the largest percentage decline in emissions of any part of the UK over the
past decade because of these type of closures as shown below.
Figure 9.5. CO2 emissions
Source: ONS and BEIS 2017 Local Authority Carbon Dioxide Emissions
Tees Valley CO2 emissions have fallen sharply in recent years, from 17,715 kt in 2005 to 6,875 kt in
2017, see Figure 9.6 below. CO2 emissions remain significantly above UK average rates per capita (in
2017 Tees Valley averaged 10.2 tonnes per capita and the UK 5.3 tonnes). This reflects the energy
intensive nature of the business base in Tees Valley. Managing these emissions whilst continuing to
support the Clean Energy, Low Carbon & Hydrogen sector will be a key focus for the region going
forward.
Figure 9.6. Total CO2 emissions by Tees Valley local authority, 2005 to 2017
Source: UK local authority and regional carbon dioxide emissions national statistics: 2005-2017
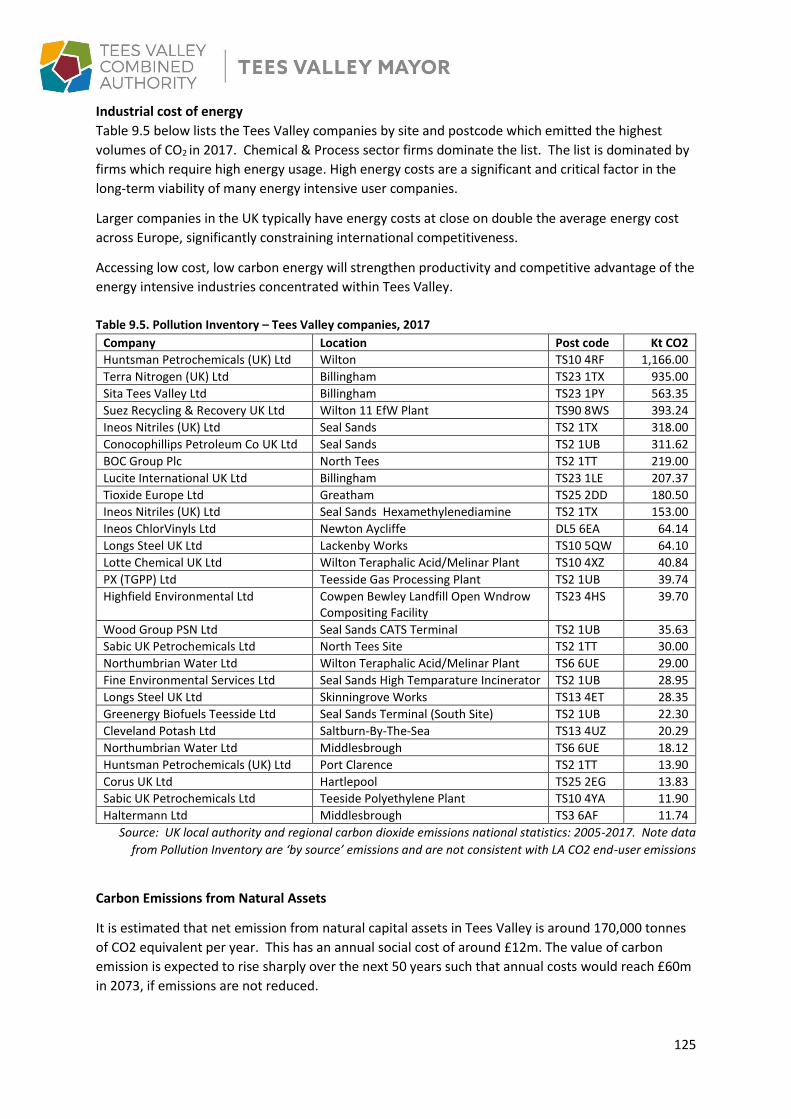
125
Industrial cost of energy
Table 9.5 below lists the Tees Valley companies by site and postcode which emitted the highest
volumes of CO2 in 2017. Chemical & Process sector firms dominate the list. The list is dominated by
firms which require high energy usage. High energy costs are a significant and critical factor in the
long-term viability of many energy intensive user companies.
Larger companies in the UK typically have energy costs at close on double the average energy cost
across Europe, significantly constraining international competitiveness.
Accessing low cost, low carbon energy will strengthen productivity and competitive advantage of the
energy intensive industries concentrated within Tees Valley.
Table 9.5. Pollution Inventory – Tees Valley companies, 2017
Company Location Post code Kt CO2
Huntsman Petrochemicals (UK) Ltd Wilton TS10 4RF 1,166.00
Terra Nitrogen (UK) Ltd Billingham TS23 1TX 935.00
Sita Tees Valley Ltd Billingham TS23 1PY 563.35
Suez Recycling & Recovery UK Ltd Wilton 11 EfW Plant TS90 8WS 393.24
Ineos Nitriles (UK) Ltd Seal Sands TS2 1TX 318.00
Conocophillips Petroleum Co UK Ltd Seal Sands TS2 1UB 311.62
BOC Group Plc North Tees TS2 1TT 219.00
Lucite International UK Ltd Billingham TS23 1LE 207.37
Tioxide Europe Ltd Greatham TS25 2DD 180.50
Ineos Nitriles (UK) Ltd Seal Sands Hexamethylenediamine TS2 1TX 153.00
Ineos ChlorVinyls Ltd Newton Aycliffe DL5 6EA 64.14
Longs Steel UK Ltd Lackenby Works TS10 5QW 64.10
Lotte Chemical UK Ltd Wilton Teraphalic Acid/Melinar Plant TS10 4XZ 40.84
PX (TGPP) Ltd Teesside Gas Processing Plant TS2 1UB 39.74
Highfield Environmental Ltd Cowpen Bewley Landfill Open Wndrow Compositing Facility
TS23 4HS 39.70
Wood Group PSN Ltd Seal Sands CATS Terminal TS2 1UB 35.63
Sabic UK Petrochemicals Ltd North Tees Site TS2 1TT 30.00
Northumbrian Water Ltd Wilton Teraphalic Acid/Melinar Plant TS6 6UE 29.00
Fine Environmental Services Ltd Seal Sands High Temparature Incinerator TS2 1UB 28.95
Longs Steel UK Ltd Skinningrove Works TS13 4ET 28.35
Greenergy Biofuels Teesside Ltd Seal Sands Terminal (South Site) TS2 1UB 22.30
Cleveland Potash Ltd Saltburn-By-The-Sea TS13 4UZ 20.29
Northumbrian Water Ltd Middlesbrough TS6 6UE 18.12
Huntsman Petrochemicals (UK) Ltd Port Clarence TS2 1TT 13.90
Corus UK Ltd Hartlepool TS25 2EG 13.83
Sabic UK Petrochemicals Ltd Teeside Polyethylene Plant TS10 4YA 11.90
Haltermann Ltd Middlesbrough TS3 6AF 11.74
Source: UK local authority and regional carbon dioxide emissions national statistics: 2005-2017. Note data
from Pollution Inventory are ‘by source’ emissions and are not consistent with LA CO2 end-user emissions
Carbon Emissions from Natural Assets
It is estimated that net emission from natural capital assets in Tees Valley is around 170,000 tonnes
of CO2 equivalent per year. This has an annual social cost of around £12m. The value of carbon
emission is expected to rise sharply over the next 50 years such that annual costs would reach £60m
in 2073, if emissions are not reduced.

126
Table 9.6. Initial Carbon Emission/Sequestration Estimate for Tees Valley
Habitat Area (hectares)
C Emission by habitat (tCO2 eq/ha/yr)
C Emission by habitat (tCO2 eq/yr)
Agriculture (area from NEVO) 40,700 5.4 219,780
Semi-Natural Grassland (NEVO) 7,000 -1.55 -10,850
Broadleaved, mixed & yew woodland (LCM)
3,714.3 -10.7 -39,743
Coniferous woodland (area from LCM)
945.5 -17.5 -16,547
Urban (NEVO) 23,600
Freshwater (NEVO) 2,700 6,86 18,522
Total 78,660 171,162 Source: Natural Capital & Environmental Economics.
Note: NEVO = Natural Environment Valuation Online Tool. LMC = Land Cover Map. Estimates for freshwater
are based on the land cover category ‘water’ in NEVO. The emission estimate from Bolt et al. (2017) is for “all
areas of water unless defined as oligotrophic, dystrotrophic, or brackish saline”.
Pollution removal by Natural Assets
Table 9.7 shows the estimated value of fine particulate matter (PM2.5) pollution removed by natural
assets in Tees Valley. These estimates are based on the tool developed by Centre for Ecology &
Hydrology alongside eftec (Economics for the Environment), to estimate quantity and value of fine
particulate matter pollution removal by vegetation.
Table 9.7. PM2.5 removed by woodland (tonnes/year) – Tees Valley
Local Authority Area of woodland (ha)
PM2.5 removed by woodland (kg/year)
PM2.5 removal rate per ha woodland (kg/ha year)
Asset value of PM2.5 removal (£ million, 2019 prices)
Asset value of PM2.5 removal per ha (£/ha, 2019 prices)
Redcar and Cleveland
2,643 15,264 5.8 47.9 18,124
Middlesborough 119 607 5.1 36.3 305,438
Hartlepool 387 2,620 6.8 32.4 83,759
Stockton 937 5,586 6 77.2 82405
Darlington 642 3,536 5.5 41.3 64402
Tees Valley 4,728 27,613 235.1 Source: Natural Capital & Environmental Economics
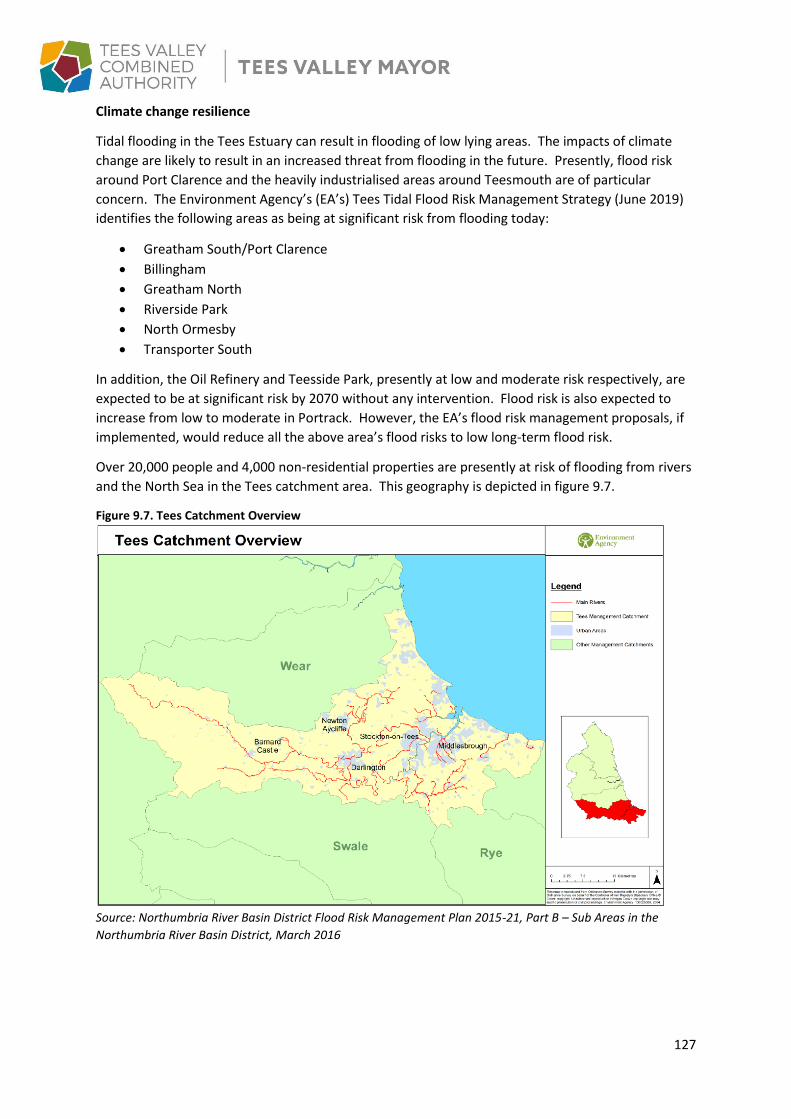
127
Climate change resilience
Tidal flooding in the Tees Estuary can result in flooding of low lying areas. The impacts of climate
change are likely to result in an increased threat from flooding in the future. Presently, flood risk
around Port Clarence and the heavily industrialised areas around Teesmouth are of particular
concern. The Environment Agency’s (EA’s) Tees Tidal Flood Risk Management Strategy (June 2019)
identifies the following areas as being at significant risk from flooding today:
• Greatham South/Port Clarence
• Billingham
• Greatham North
• Riverside Park
• North Ormesby
• Transporter South
In addition, the Oil Refinery and Teesside Park, presently at low and moderate risk respectively, are
expected to be at significant risk by 2070 without any intervention. Flood risk is also expected to
increase from low to moderate in Portrack. However, the EA’s flood risk management proposals, if
implemented, would reduce all the above area’s flood risks to low long-term flood risk.
Over 20,000 people and 4,000 non-residential properties are presently at risk of flooding from rivers
and the North Sea in the Tees catchment area. This geography is depicted in figure 9.7.
Figure 9.7. Tees Catchment Overview
Source: Northumbria River Basin District Flood Risk Management Plan 2015-21, Part B – Sub Areas in the
Northumbria River Basin District, March 2016

128
Figure 9.8, focused on the lower reaches of the River Tees, attempts to measure flood risks in terms
of anticipated likelihood e.g. green-shading indicates a once in a 50 year event.
Figure 9.8. Tees Estuary Flood Risk Resilience Under 2018 UK Climate Projections
Source: Environment Agency and Tees Valley Local Industrial Strategy Evidence Base Report, July 2019
9.7. Tourism and visitor economy
The local visitor economy contributed around £962m to the Tees Valley economy in 2018. This
represents a £39m or 4.2% increase on the 2017 estimate. In addition, both the number of visitors
(up by 110,000) and the number of visitor days (up by 90,000) were higher. Employment associated
with the visitor economy continued to grow, although at a slower rate than in 2017, with an
additional 161 full-time equivalent workers by 2018.

129
Figure 9.9. Tees Valley visitor numbers, spend and associated visitor economy employment, 2014 to 2018
Source: STEAM
At the local authority level, visitors, spend and employment are spread fairly uniformly across Tees
Valley as shown in the figure below.
Figure 9.10. Visitor numbers, spend and associated visitor economy employment, Tees Valley local
authorities, 2018
Source: STEAM

130
In terms of typical spend, the table below summarises the average amount spent by visitors
depending on the nature of their visit. Those visitors stopping overnight spend significantly more
than those who visit just for the day.
Table 9.8. Visitor spend per person
Source: STEAM
9.8. Personal well-being Health – both physical and mental – and well-being is a key driver of local economic performance. A
fit, lively and engaged labour force is significantly more productive than one that is not. Beyond the
obvious productivity improvements flowing from simply reducing the number of days lost in
absenteeism due to ill health, research (Oswald et al) suggests that workers displaying ‘positive
affect’ i.e. higher levels of happiness are up to 12% more productive.
Physical and mental activity, including activities such as volunteering, benefits both body and mind.
Sport England’s Active lives survey records the number and rate of physically inactive adults at the
local level. The survey also records those participating in volunteering.
Table 9.9 below shows the wide variation in activity levels across Tees Valley. 162,000 or almost
three in ten of Tees Valley adults are classed as physically inactive. Stockton, Middlesbrough and
Hartlepool in particular record relatively high levels of physical inactivity.
In terms of participation in volunteering, Redcar & Cleveland shows relatively high rates with over
21,400 participants representing almost one in five adults.
Serviced
Accommodation
Non Serviced
Accommodation
Staying with
friends and
Relatives
All Overnight
Visitors
Day
Visitors
Spend per person
per day £ £ 104.49 £ 49.28 £ 36.55 £ 62.55 £ 26.56
Spend per person
per trip £ £ 194.81 £ 345.80 £ 86.73 £ 140.63 £ 26.56
Spend per person
per day £ £ 68.99 £ 47.48 £ 36.55 £ 43.09 £ 26.56
Spend per person
per trip £ £ 130.26 £ 329.88 £ 82.19 £ 97.37 £ 26.56
Spend per person
per day £ £ 77.72 £ 52.34 £ 36.55 £ 47.24 £ 26.56
Spend per person
per trip £ £ 144.74 £ 365.45 £ 86.73 £ 105.60 £ 26.56
Spend per person
per day £ £ 92.49 £ 49.14 £ 36.55 £ 50.74 £ 26.56
Spend per person
per trip £ £ 154.96 £ 356.61 £ 88.07 £ 120.56 £ 26.56
Spend per person
per day £ £ 80.19 £ 50.32 £ 36.55 £ 44.54 £ 26.56
Spend per person
per trip £ £ 149.35 £ 338.30 £ 86.48 £ 105.42 £ 26.56
Spend per person
per day £ £ 87.09 £ 49.28 £ 36.55 £ 49.21 £ 26.56
Spend per person
per trip £ £ 159.82 £ 344.86 £ 85.79 £ 112.99 £ 26.56
Tees Valley
Darlington
Hartlepool
Middlesbrough
Redcar and Cleveland
Stockton-on-Tees

131
Table 9.9. Active lives survey, May 2018-19
Source: Active Lives Survey, Sport England. Inactive defined as undertaking less than 30 minutes of physical
activity (including walking, cycling, dance, fitness or sport) a week. Volunteering defined as having volunteered
to support sport and physical activity at least twice over the previous year.
Personal well-being indicators provide alternative metrics in understanding the local economic
environment and in helping to stimulate inclusive growth. ONS have identified four well-being
measures covering:
• Life satisfaction – overall, how satisfied are you with your life nowadays?
• Worthwhile – overall, to what extent do you feel the things you do in your life are
worthwhile?
• Happiness – overall, how happy did you feel yesterday?
• Anxiety – overall, how anxious did you feel yesterday?
People are asked to respond on a scale of 0 to 10 with 0 ‘not at all’ and 10 ‘completely. Thresholds
are labelled as per the table below:
Table 9.10. Well-being indicator group scales
Life satisfaction, worthwhile and happiness scores
Anxiety scores
Response on an 11 point scale
Label Response on an 11 point scale
Label
0 to 4 Low 0 to 1 Very low
5 to 6 Medium 2 to 3 Low
7 to 8 High 4 to 5 Medium
9 to 10 Very high 6 to 10 High Source: ONS
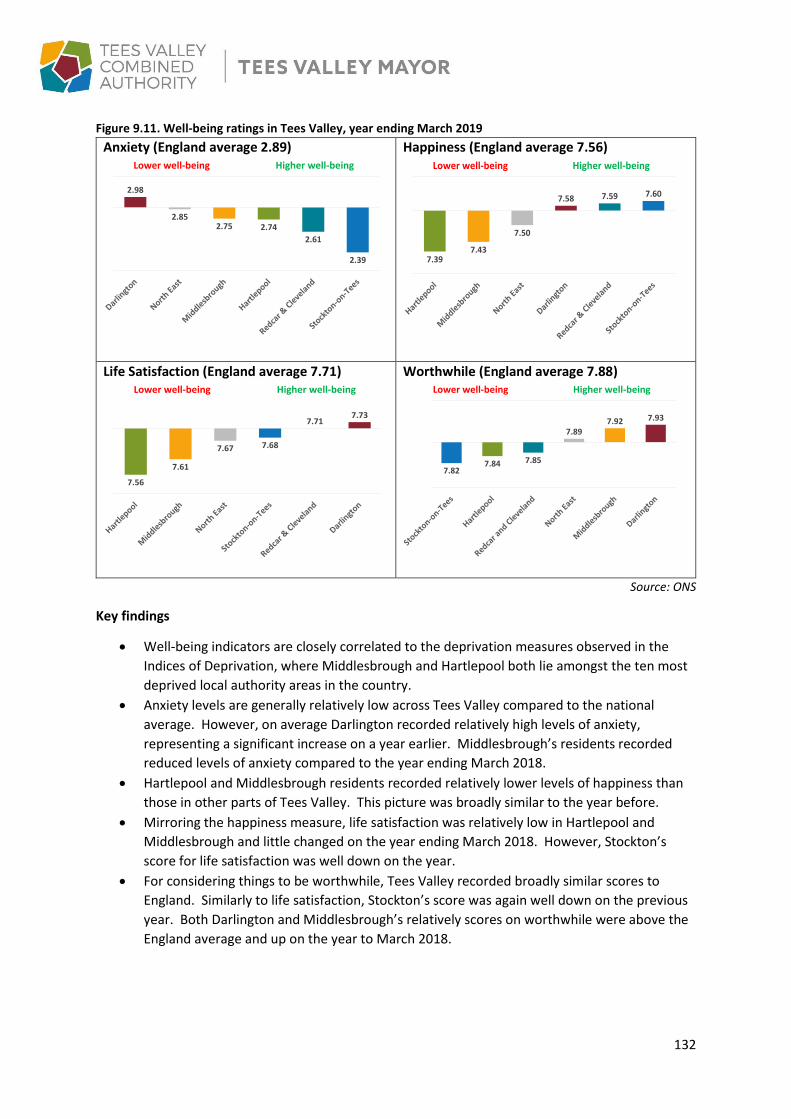
132
Figure 9.11. Well-being ratings in Tees Valley, year ending March 2019
Anxiety (England average 2.89)
Happiness (England average 7.56)
Life Satisfaction (England average 7.71)
Worthwhile (England average 7.88)
Source: ONS
Key findings
• Well-being indicators are closely correlated to the deprivation measures observed in the
Indices of Deprivation, where Middlesbrough and Hartlepool both lie amongst the ten most
deprived local authority areas in the country.
• Anxiety levels are generally relatively low across Tees Valley compared to the national
average. However, on average Darlington recorded relatively high levels of anxiety,
representing a significant increase on a year earlier. Middlesbrough’s residents recorded
reduced levels of anxiety compared to the year ending March 2018.
• Hartlepool and Middlesbrough residents recorded relatively lower levels of happiness than
those in other parts of Tees Valley. This picture was broadly similar to the year before.
• Mirroring the happiness measure, life satisfaction was relatively low in Hartlepool and
Middlesbrough and little changed on the year ending March 2018. However, Stockton’s
score for life satisfaction was well down on the year.
• For considering things to be worthwhile, Tees Valley recorded broadly similar scores to
England. Similarly to life satisfaction, Stockton’s score was again well down on the previous
year. Both Darlington and Middlesbrough’s relatively scores on worthwhile were above the
England average and up on the year to March 2018.
2.98
2.852.75 2.74
2.61
2.39
Lower well-being Higher well-being
7.397.43
7.50
7.58 7.59 7.60
Lower well-being Higher well-being
7.56
7.61
7.67 7.68
7.717.73
Lower well-being Higher well-being
7.827.84 7.85
7.897.92 7.93
Lower well-being Higher well-being

133
9.9. Place and Culture SWOT analysis
Strengths Weaknesses
A rich industrial heritage, diverse landscape, strong events programme and wide range of local attractions help make Culture and Tourism one of the fastest growing sectors in employment terms. Some of the lowest business overhead costs in the country combined with affordable housing and a low cost of living. Recently established destination marketing offer, with engaged leisure/ attraction businesses. Strong educational offer via Teesside University and the Northern School of Art in Middlesbrough and Hartlepool. Strong creative and digital hub with potential for expansion and innovation e.g. Hartlepool’s BIS centre for business start-ups in the creative industries.
Lack of wider awareness of Tees Valley and what it has to offer. Negative perceptions of the region, potentially stemming from:
• Poor quality, low value existing housing stock.
• Numerous pockets of deprivation, particularly in Middlesbrough, with households recording low levels of well-being and high levels of fuel poverty.
Lack of knowledge of the cultural sector, inadequate sub sector classifiers, no baseline for impact measurement. No clear voice/ representation of culture sector in governance and decision making. Low levels of Cultural Lottery investment compared to national average and other parts of the North East. Small cultural infrastructure, unused to Tees Valley-wide working. No cohesive culture sector networks or knowledge and skills development programme. No clarity or connectivity between culture, creative industry and leisure ‘sectors’.
Opportunities Threats
Development of a regional strategic marketing offer. A growing culture offer, with the potential to help reverse the declining working age population and make Tees Valley the place to live, work or visit. Extend Destination offer to include conferencing offer and events bidding pipeline to grow sector. Passenger rail bi-centenary 2025 and projects such as the Darlington to Stockton railway. Creative Industries Sector Deal / investment opportunities.
Potential growth constraint from labour and skill shortages. Challenge to attract and retain talent. Competition from other HEIs and urban cultural hubs. Lack of skilled ‘‘employment ready’ workforce results in lost inward investment. Competition from other cities/ city regions developing a strong place-based cultural offer.

134
Attraction of wider visitor numbers and spend from family and friends of students at the Durham University’s International Study School at Queen’s Campus, Stockton-on-Tees. Collaborative investment between culture and education/ skills sectors to develop talent pipeline & apprenticeship programmes for cultural and creative careers. Untapped potential to increase business engagement and partnerships for mutual benefit. Developing Tees Valley as an exemplar region for Clean Growth - potential to contribute significantly to the country’s CO2 reduction targets.
Lack of capacity in the culture sector to respond to opportunities. Increasing flood risk and threat to key industrial infrastructure. Relatively high levels of physical inactivity and health deprivation combined with low rates of life satisfaction and happiness impacting negatively on productivity.

135
Section 10: Performance Gaps and SEP 2016 Baselines
Figure 10.1 summarises and quantifies the key metric performance gaps identified in the Executive
Summary on page 5. The bullet points below describe the data.
Figure 10.1. Key metrics performance gaps
• Output (GDP) – Gap equals GDP required to match UK GDP per head. Source: ONS, 2018
estimates.
• Productivity (GVA per hour worked) – Gap equals GVA required to match UK GVA per hour
worked. Source: ONS, 2018 estimates.
• Enterprise (Number of registered enterprises) – Gap equals number of enterprises required
to match UK enterprises per resident population aged 16+. Source: ONS, 2019 estimates.
• Employment (Number of employed residents) – Gap equals number of employed residents
aged 16 to 64 required to match UK employment rate. Source: ONS, July 2018 / June 2019
estimates.
• Qualifications (Number of residents with an NVQ4 qualification or above) – Gap equals
number of residents aged 16 to 64 required to match proportion of UK residents with an
NVQ4+ qualification. Source: ONS, 2018 estimates.
• Commercialisation (Firms introducing either a new or significantly improved product or
service) – Gap equals proportion of firms that introduced either a new or significantly
improved product or service between 2014 and 2016 required to match the LEP average
rate. Source: Enterprise Research Centre 2019.
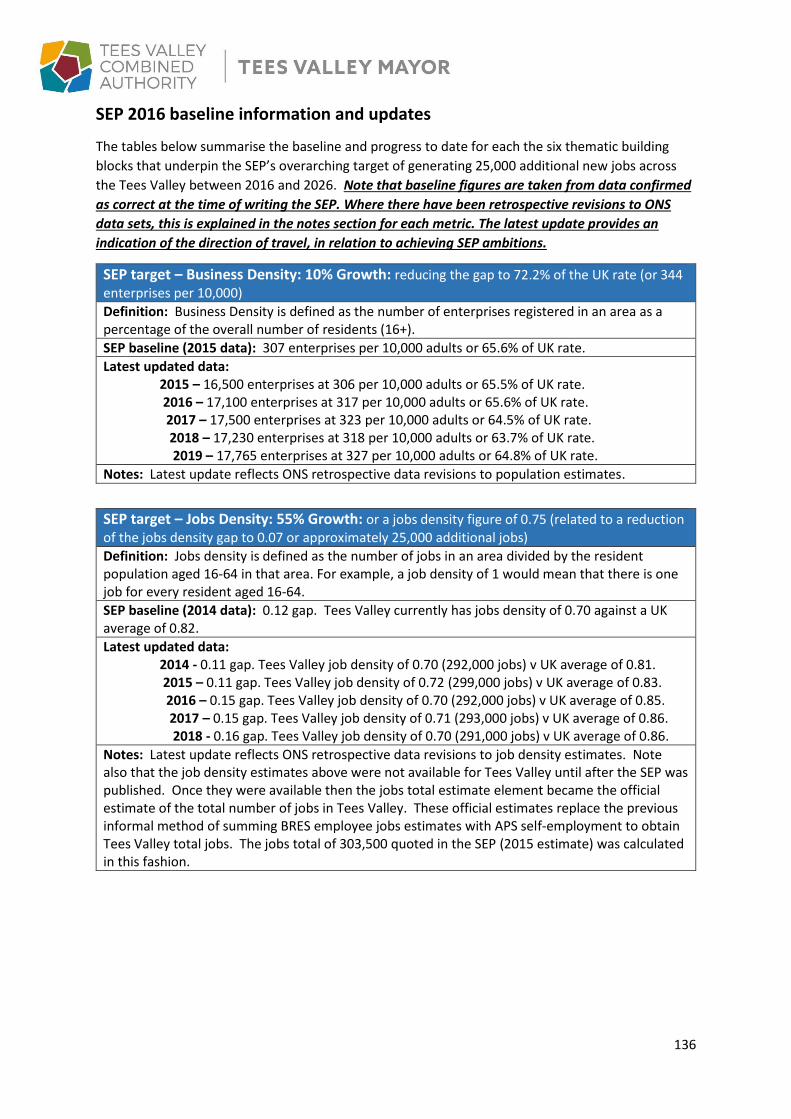
136
SEP 2016 baseline information and updates
The tables below summarise the baseline and progress to date for each the six thematic building
blocks that underpin the SEP’s overarching target of generating 25,000 additional new jobs across
the Tees Valley between 2016 and 2026. Note that baseline figures are taken from data confirmed
as correct at the time of writing the SEP. Where there have been retrospective revisions to ONS
data sets, this is explained in the notes section for each metric. The latest update provides an
indication of the direction of travel, in relation to achieving SEP ambitions.
SEP target – Business Density: 10% Growth: reducing the gap to 72.2% of the UK rate (or 344 enterprises per 10,000)
Definition: Business Density is defined as the number of enterprises registered in an area as a percentage of the overall number of residents (16+).
SEP baseline (2015 data): 307 enterprises per 10,000 adults or 65.6% of UK rate.
Latest updated data: 2015 – 16,500 enterprises at 306 per 10,000 adults or 65.5% of UK rate. 2016 – 17,100 enterprises at 317 per 10,000 adults or 65.6% of UK rate. 2017 – 17,500 enterprises at 323 per 10,000 adults or 64.5% of UK rate. 2018 – 17,230 enterprises at 318 per 10,000 adults or 63.7% of UK rate. 2019 – 17,765 enterprises at 327 per 10,000 adults or 64.8% of UK rate.
Notes: Latest update reflects ONS retrospective data revisions to population estimates.
SEP target – Jobs Density: 55% Growth: or a jobs density figure of 0.75 (related to a reduction of the jobs density gap to 0.07 or approximately 25,000 additional jobs)
Definition: Jobs density is defined as the number of jobs in an area divided by the resident population aged 16-64 in that area. For example, a job density of 1 would mean that there is one job for every resident aged 16-64.
SEP baseline (2014 data): 0.12 gap. Tees Valley currently has jobs density of 0.70 against a UK average of 0.82.
Latest updated data: 2014 - 0.11 gap. Tees Valley job density of 0.70 (292,000 jobs) v UK average of 0.81. 2015 – 0.11 gap. Tees Valley job density of 0.72 (299,000 jobs) v UK average of 0.83. 2016 – 0.15 gap. Tees Valley job density of 0.70 (292,000 jobs) v UK average of 0.85. 2017 – 0.15 gap. Tees Valley job density of 0.71 (293,000 jobs) v UK average of 0.86. 2018 - 0.16 gap. Tees Valley job density of 0.70 (291,000 jobs) v UK average of 0.86.
Notes: Latest update reflects ONS retrospective data revisions to job density estimates. Note also that the job density estimates above were not available for Tees Valley until after the SEP was published. Once they were available then the jobs total estimate element became the official estimate of the total number of jobs in Tees Valley. These official estimates replace the previous informal method of summing BRES employee jobs estimates with APS self-employment to obtain Tees Valley total jobs. The jobs total of 303,500 quoted in the SEP (2015 estimate) was calculated in this fashion.
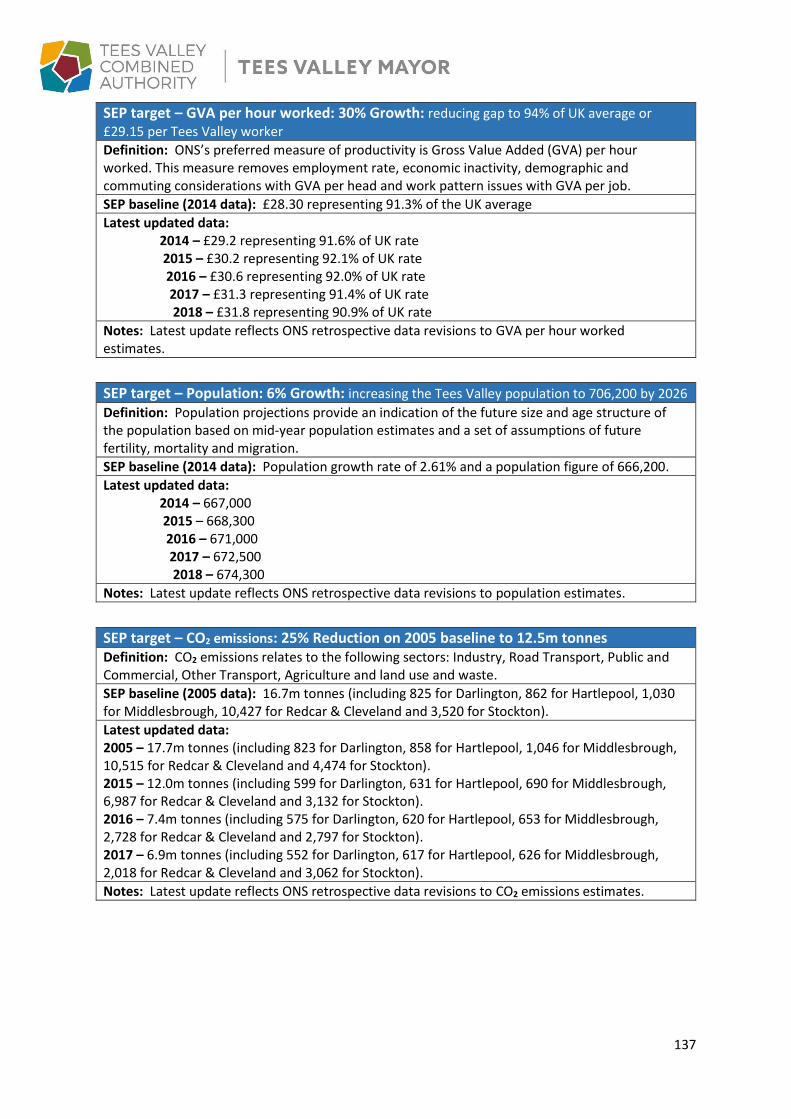
137
SEP target – GVA per hour worked: 30% Growth: reducing gap to 94% of UK average or £29.15 per Tees Valley worker
Definition: ONS’s preferred measure of productivity is Gross Value Added (GVA) per hour worked. This measure removes employment rate, economic inactivity, demographic and commuting considerations with GVA per head and work pattern issues with GVA per job.
SEP baseline (2014 data): £28.30 representing 91.3% of the UK average
Latest updated data: 2014 – £29.2 representing 91.6% of UK rate 2015 – £30.2 representing 92.1% of UK rate 2016 – £30.6 representing 92.0% of UK rate 2017 – £31.3 representing 91.4% of UK rate 2018 – £31.8 representing 90.9% of UK rate
Notes: Latest update reflects ONS retrospective data revisions to GVA per hour worked estimates.
SEP target – Population: 6% Growth: increasing the Tees Valley population to 706,200 by 2026
Definition: Population projections provide an indication of the future size and age structure of the population based on mid-year population estimates and a set of assumptions of future fertility, mortality and migration.
SEP baseline (2014 data): Population growth rate of 2.61% and a population figure of 666,200.
Latest updated data: 2014 – 667,000 2015 – 668,300 2016 – 671,000 2017 – 672,500 2018 – 674,300
Notes: Latest update reflects ONS retrospective data revisions to population estimates.
SEP target – CO2 emissions: 25% Reduction on 2005 baseline to 12.5m tonnes Definition: CO2 emissions relates to the following sectors: Industry, Road Transport, Public and Commercial, Other Transport, Agriculture and land use and waste.
SEP baseline (2005 data): 16.7m tonnes (including 825 for Darlington, 862 for Hartlepool, 1,030 for Middlesbrough, 10,427 for Redcar & Cleveland and 3,520 for Stockton).
Latest updated data: 2005 – 17.7m tonnes (including 823 for Darlington, 858 for Hartlepool, 1,046 for Middlesbrough, 10,515 for Redcar & Cleveland and 4,474 for Stockton). 2015 – 12.0m tonnes (including 599 for Darlington, 631 for Hartlepool, 690 for Middlesbrough, 6,987 for Redcar & Cleveland and 3,132 for Stockton). 2016 – 7.4m tonnes (including 575 for Darlington, 620 for Hartlepool, 653 for Middlesbrough, 2,728 for Redcar & Cleveland and 2,797 for Stockton). 2017 – 6.9m tonnes (including 552 for Darlington, 617 for Hartlepool, 626 for Middlesbrough, 2,018 for Redcar & Cleveland and 3,062 for Stockton).
Notes: Latest update reflects ONS retrospective data revisions to CO2 emissions estimates.

138
SEP target – NVQ Level 4: 20% Growth: equating to 36% of residents having a NVQ Level 4 qualification
Definition: NVQ Level 4 is defined as the percentage of Tees Valley residents aged 16-64 who are qualified to a NVQ Level 4 or above. This equates to a degree level qualification.
SEP baseline (2015 data): 30% of residents aged 16-64 presently have a NVQ Level 4 qualification
Latest updated data: 2015 – 125,300 or 30.4% of residents aged 16-64 2016 – 126,600 or 30.8% of residents aged 16-64 2017 – 123,700 or 30.1% of residents aged 16-64 2018 – 125,700 or 30.6% of residents aged 16-64
Notes: Latest update reflects ONS retrospective data revisions.
139
Bibliography
The following outlines key sources under each section of the Economic Assessment.
Further material is available at: https://teesvalley-ca.gov.uk/research-intelligence/
SEP 2016 Baseline sources
• Business Density – ONS, NOMIS: UK Business Counts - Enterprises and Mid-year Population
Estimates.
• Jobs Density - ONS, NOMIS: Jobs Density.
• GVA per hour worked – ONS: Sub-regional Productivity: Labour Productivity (GVA per hour
worked and GVA per filled job) indices by Local Enterprise Partnership.
• Population – ONS, NOMIS: Mid-year Population Estimates.
• CO2 emissions – BEIS: UK local authority and regional carbon dioxide emissions national
statistics: 2005 to 2017.
• NVQ Level 4 – ONS, NOMIS: Annual Population Survey.
Section 3: Area Profile
Sources: ONS, DEFRA, MHCLG, Census.
Section 4: Economic Growth and Productivity
Sources: ONS, Annual Business Survey, Economic Modelling Specialists International (EMSI), HMRC,
DIT.
Section 5: Business Growth
Sources: ONS, Enterprise Research Centre, ScaleUp Institute.
Section 6: Research & Development, Innovation and Energy
Sources: Enterprise Research Centre, HMRC, Eurostat, Smart Specialisation Hub, UK Research and
Innovation, BEIS; R. Harris, April 2019, TVCA Specialist data requirements to inform the Local
Industrial Strategy, Durham University Business School.
Section 7: Education, Employment and Skills
Sources: DfE, Higher Education Statistics Agency (HESA), ONS, Economic Modelling Specialists
International (EMSI), Education Skills Funding Agency (ESFA), Burning Glass Labour Insight, Working
Futures.
Section 8: Transport & Digital Infrastructure
Sources: Census, DfT, Connect Tees Valley, thinkbroadband.com, BEIS.
Section 9: Place and Culture
Sources: ONS, Valuation Office Agency (VOA), MHCLG, Colliers, BEIS, Natural Capital and
Environmental Economics, Environment Agency, Scarborough Tourism Economic Activity Monitor
(STEAM), Active Lives Survey; Oswald et al, 2009, Happiness and Productivity, IZA Discussion Paper.
