technology transfer and the economic implications of the ...technology transfer and the economic...
TRANSCRIPT
Please cite this paper as:
Park, W. G. and D. C. Lippoldt (2008), "TechnologyTransfer and the Economic Implications of theStrengthening of Intellectual Property Rights in DevelopingCountries", OECD Trade Policy Working Papers, No. 62,OECD Publishing.doi:10.1787/244764462745
OECD Trade Policy Working PapersNo. 62
Technology Transfer and theEconomic Implications ofthe Strengthening ofIntellectual Property Rightsin Developing Countries
Walter G. Park, Douglas C. Lippoldt
Unclassified TAD/TC/WP(2007)19/FINAL Organisation de Coopération et de Développement Economiques Organisation for Economic Co-operation and Development 25-Jan-2008 ___________________________________________________________________________________________
English - Or. English TRADE AND AGRICULTURE DIRECTORATE TRADE COMMITTEE
Working Party of the Trade Committee
TECHNOLOGY TRANSFER AND THE ECONOMIC IMPLICATIONS OF THE STRENGTHENING OF INTELLECTUAL PROPERTY RIGHTS IN DEVELOPING COUNTRIES OECD Trade Policy Working Paper No. 62
By Walter G. Park and Douglas C. Lippoldt
Douglas Lippoldt, Trade and Agriculture Directorate and Directorate for Science, Technology and Industry, Tel: +33 1 45 24 19 26; e-mail: [email protected]
JT03239222
Document complet disponible sur OLIS dans son format d'origine Complete document available on OLIS in its original format
TA
D/T
C/W
P(2007)19/FINA
L
Unclassified
English - O
r. English
Cancels & replaces the same document of 25 January 2008
TAD/TC/WP(2007)19/FINAL
2
ABSTRACT
This paper presents an empirical analysis of the influence of the strength of intellectual property rights (IPRs) on technology transfer to developing nations. The core contribution is to use regression analysis to examine the relationship between various measures of technology transfer and a set of indexes that quantify the strength of IPRs based on laws on the books, while controlling for other factors. For this purpose, the authors have assembled a data set covering a broad international panel of countries for an expanded time frame (1990-2005) in comparison with previous studies on IPRs by the Trade and Agriculture Directorate. Regression analysis is also used to assess the relationship between measures of local innovation and the IPR indexes. The study employs case study analysis of select countries � namely the BRIC countries (Brazil, Russia, India, and China) � to complement the statistical analysis.
Keywords: Intellectual Property Rights, Technology Transfer, Development, Trade, Investment
ACKNOWLEDGEMENTS
This paper is co-authored by Walter G. Park, American University in Washington DC, and Douglas
Lippoldt, OECD. The authors extend thanks to: Alice Lehne and Laura Munro for research assistance; Jayashree Watal for comments on the project scoping document and draft material included in this paper; Sébastien Miroudot for comments on the scoping and for peer review throughout the project; and participants at the OECD Global Forum on Trade and Innovation (15 October 2007) and the IPR staff seminar of the OECD Directorate for Science, Technology and Industry (28 September 2007), for their comments on portions of this material.
The paper is available on the OECD website: http://oecd.org/trade.
Copyright OECD, 2008. Applications for permission to reproduce or to translate all or part of this material should be made to: OECD Publication, 2 rue André Pascal, 75775 Paris Cedex 16, France.
TAD/TC/WP(2007)19/FINAL
3
TABLE OF CONTENTS
Executive Summary ....................................................................................................................... 4
1. Introduction ............................................................................................................................. 6 Motivation ............................................................................................................................... 6
2. Literature Review ..................................................................................................................... 7 2.1. Developing country perspectives on IPRs ..................................................................... 7 2.2. Technology transfer ....................................................................................................... 8 2.3. Trade and IPRs ............................................................................................................ 10 2.4. FDI and IPRs ............................................................................................................... 11 2.5. Gaps in the Literature .................................................................................................. 12
3. Conceptual Framework .......................................................................................................... 13
4. Data ........................................................................................................................................ 15 4.1. Dependent Variables ..................................................................................................... 15 4.2. Explanatory Variables .................................................................................................. 15 (A) Patent Rights Index ....................................................................................................... 15 (B) Copyrights Index .......................................................................................................... 16 (C) Trademark Rights Index ............................................................................................... 16 (D) IPR Survey .................................................................................................................... 16 (E) Control Variables .......................................................................................................... 18 4.3 Sample Statistics ........................................................................................................... 18
5. Empirical Results ................................................................................................................... 19 5.1 Technology Transfer and IPRs ..................................................................................... 20 5.2 Technology Content of Transfers in Developing Countries ......................................... 22 5.3 Summing Up ................................................................................................................. 25
6. Case Study of BRIC economies ............................................................................................ 25
7. Conclusion ............................................................................................................................. 28
References .................................................................................................................................... 30
Annex 1. Regression Analyses ................................................................................................... 34
Annex 2. Sample of Countries by Group .................................................................................... 35
Annex 3. Variables and Data Sources ........................................................................................ 36
Annex 4. Intellectual Property Rights Indices � Summary of Criteria and Measurement .......... 38
TAD/TC/WP(2007)19/FINAL
4
TECHNOLOGY TRANSFER AND THE ECONOMIC IMPLICATIONS OF THE STRENGTHENING OF INTELLECTUAL PROPERTY RIGHTS IN DEVELOPING
COUNTRIES
Executive Summary
This paper presents an empirical analysis of the influence of the strength of intellectual property rights (IPRs) on technology transfer to developing nations. The core contribution is to use regression analysis to examine the relationship between various measures of technology transfer and a set of indexes that quantify the strength of IPRs based on laws on the books, while controlling for other factors. For this purpose, the authors have assembled a data set covering a broad international panel of countries for an expanded time frame (1990-2005) in comparison with previous studies on IPRs by the Trade and Agriculture Directorate. Regression analysis is also used to assess the relationship between measures of local innovation and the IPR indexes. The study employs case study analysis of select countries � namely the BRIC countries (Brazil, Russia, India, and China) � to complement the statistical analysis.
Existing theoretical work tends to show that the influence of IPRs on technology transfer is a priori ambiguous. Stronger IPRs could have both market expansion effects, which enable rights holders to better exclude imitators and enjoy a larger market for their technologies, and market power effects, which in theory could enable rights holders to increase the rents earned on their technologies by constraining the quantity supplied (e.g. through increased prices). Hence, empirical evidence plays an important role in helping to assess which effects dominate.
Previous empirical studies on technology transfer find that stronger IPRs in developing countries help attract imports if the capacity for imitation or the level of competition in the host countries is high; otherwise, stronger IPRs could enable rights holders to exercise greater market power. Existing studies are inconclusive, though, as to whether stronger IPRs attract inward foreign direct investment (FDI). Certain studies on specific sectors or industries do find that stronger IPRs in developing countries can be associated with increased technology-intensive FDI. However, in some countries with weak IPRs, there may also be substantial flows of FDI, although these may tend to be for the purpose of establishing sales and distribution outlets rather than high-value production and research and development (R&D) facilities.
The present study is distinguished from the previous studies in at least three ways. In contrast to previous work, the present study uses more recent measures of IPRs and more recent sample periods through 2005. Much of the existing empirical evidence is based on a sample period before the World Trade Organisation�s Agreement on Trade-Related Aspects of Intellectual Property Rights (TRIPS) came into force in 1995. This study also provides a more nuanced assessment than some previous work, distinguishing between merchandise imports and services imports as measures of technology transfer via trade, and examining imports and inward FDI by sector, particularly those that are considered high-tech. The study also evaluates the relationship of IPR strengthening and the associated technology transfer to the evolution of local innovative capacity of developing countries using data on R&D and patenting by residents and non-residents.
The empirical analysis in this study centres on evaluation of two hypotheses regarding the experience of the developing world with strengthened IPRs:
H1) IPRs stimulate technology transfer, particularly the transfer of technology-intensive goods, services and capital.
H2) IPRs can directly stimulate local innovation as well as indirectly by stimulating the transfer of technologies that foster local innovation.

TAD/TC/WP(2007)19/FINAL
5
The main empirical results support a positive assessment of both hypotheses. These results are as follows:
The index for patent rights tends to be positively associated with inward FDI, merchandise imports and service imports, holding other factors constant. This relationship holds for all groups of countries � developed, developing and least developed � though quantitatively the association is strongest in developed countries.
• The indexes for copyrights and trademark rights are less strongly associated with technology transfer than is the patent rights index.
• Focusing on technology transfer to developing countries, the study finds that stronger levels of patent protection are positively and significantly associated with the inflows of high-tech products, like pharmaceutical goods, chemicals, aerospace, computer services, information, and office and telecom equipment.
• Developing country patent applications (by both residents and non-residents) and expenditure on R&D (as a percentage of GDP) tend to have a positive and significant relationship to the strength of patent rights.
• In certain specifications of the model with respect to developing country resident patent applications, the control variables for merchandise imports, services imports and inward FDI are also significant and positive. Similarly, merchandise imports also tend to be significantly and positively related to R&D expenditure. (When FDI and service imports are interacted with merchandise imports in these specifications of the model, merchandise imports tend to dominate, however.) The intuition is that the inflows of goods, services, and capital are a source of knowledge spillovers as well as a source of inputs with which to conduct innovation (such as laboratory equipment).
• Imports of goods and services and FDI inflows are also significantly and positively associated with non-resident patenting in developing countries. This association suggests that foreign imports and FDI contain patentable technological assets for which non-residents have a vested interested in seeking protection. Thus, stronger patent rights in developing countries appear to have the potential not only to stimulate international technology transfer but also to provide incentives for foreigners to transfer new technologies.
Case studies and surveys reinforce the points drawn in the regression analysis that the technology content of inward FDI and foreign trade has been substantive, particularly in the BRIC countries, and that this has taken place in association with significant IPR reforms. In the BRIC countries, technology transfer via trade and FDI has been one important input (among other factors) into developing local technological capabilities. At the same time, there are still problems with effective enforcement and administration of IPRs in these countries and there is room for additional IPR reform to contribute toward their continued economic development.
The study qualifies that IPRs do not operate in a vacuum. There are complementary factors that help facilitate technology transfer, such as the quality of infrastructure, government policies and regulations, and market structure, and complementary factors that help facilitate innovation, such as the quality of research institutions and the extent of collaboration among different research organisations. There are complex interactions to account for between innovative or absorptive capacities and intellectual property systems. Thus, reform of IPR systems should proceed based on a holistic approach, in a manner consistent with international obligations, while taking into account the state of domestic institutions and innovative capacities as well as the state of the IPR system.
TAD/TC/WP(2007)19/FINAL
6
TECHNOLOGY TRANSFER AND THE ECONOMIC IMPLICATIONS OF THE STRENGTHENING OF INTELLECTUAL PROPERTY RIGHTS IN DEVELOPING
COUNTRIES
1. Introduction
1. This paper presents an empirical analysis of the influence of the strength of intellectual property rights (IPRs) on technology transfer to developing nations. The core contribution is to use regression analysis to examine the relationship between various measures of technology transfer and a set of indexes that quantify the strength of intellectual property rights based on laws on the books, while controlling for other factors. The modes of technology transfer examined include services trade (including licensing of intangible assets), merchandise trade and foreign direct investment (FDI). The study also evaluates the relationship of IPR strengthening and the associated technology transfer to the evolution of local innovative capacity of developing countries using data on research and development (R&D) and patenting by residents and non-residents.
2. For the analysis the authors have assembled a large data set covering a broad international panel of countries for the time frame 1990 to 2005. The time frame and country coverage are significantly expanded in comparison with previous studies on IPRs by the OECD Trade and Agriculture Directorate. The study also provides a case study analysis of select countries � namely the BRIC countries (Brazil, Russia, India, and China) � to complement the statistical analysis.
3. The paper is organised as follows. Section 2 provides a review of the empirical literature on technology transfer and the role of IPRs, and discusses gaps in the existing work. Section 3 sketches the empirical framework of the study, with further technical details provided in Annex 1. Section 4 presents the data set, including the measures of IPR strength. Section 5 presents the empirical results in two parts. The first focuses on assessment of which types of IPRs are most related to the different types of technology transfer, and whether the relationship of IPRs to technology transfer vary by the level of economic development in the IPR reforming countries. The second part of Section 5 focuses on the high-technology content of the imports and inward FDI, in order to consider whether the flows of this content are related to R&D and patenting in the developing world. Section 6 provides a brief case study of the BRICs countries (Brazil, Russia, India, and China), as they are among the stronger performing developing economies. Section 6 focuses on identifying cases of technology transfer and shifts in the innovative capacity of the BRIC economies. Section 7 concludes with a summary of the main findings, implications, and suggestions for further research.
Motivation
4. The motivation for this study is to shed further light on the extent to which developing nations gain from IPR reform and, in particular, with respect to technology transfer. The intellectual property regimes of developing countries have been significantly strengthened since 1990, notably through the advent of the World Trade Organisation�s Agreement on Trade-Related Aspects of Intellectual Property Rights (TRIPS) that came into force in January 1995. Further impetus to this wave of IPR reform came about as a consequence of economic transition in formerly socialist countries. Reform of IPRs remains an ongoing process globally, including in the developing world.
5. Intense public debates sometimes arise about the efficacy and desirability of further IPR reform in developing countries. Theoretical analyses sometimes provide conflicting views on the role of IPRs in

TAD/TC/WP(2007)19/FINAL
7
economic development.1 This situation highlights the need for empirical evaluations of the effects of IPR reform to date, in order to anchor future discussions and policy making with findings from actual experience. Previous empirical work ranges from informal, anecdotal evidence to formal case studies and regression-based statistical analyses. The formal evidence, however, is still scant and not definitive, particularly as regards to the extent to which IPR reforms in developing countries help substantively attract foreign technologies or spur local innovation.
6. A key constraint in a number of previous empirical studies is the lack of up-to-date measures of the progress of global IPR reform. Much of the existing empirical analysis is based on data for the pre-TRIPS period; that is, the studies were largely conducted on data sets where the time period ended before 1995. Of course, lags in the generation of data for such indicators as FDI, trade and R&D are to be expected, but up-to-date quantitative measures for IPR strength have lagged even further. This study fills a gap by updating and extending indexes of IPR strength up to 2005, thereby incorporating recent developments in international IPR protection. This enables the whole sample period to be brought up to 2005, and allows more recent data on technology transfer to be used than was the case in previous studies.
7. Basing policy on empirical relationships derived for standards of protection that prevailed prior to the TRIPS Agreement is somewhat problematic since changes in the policy regime are likely to have affected public expectations and behaviour. The �elasticities� or responsiveness of innovation and technology transfer, for example, may be quite different under different IPR regimes. Moreover, TRIPS is a relatively recent agreement and studies attempting to evaluate the effects of IPRs based on the first few years of data may have missed substantive effects, especially where technology transfer and technological changes respond to IPR reforms with a lag.2 Some time needs to pass in order to observe fundamental rather than transient impacts. The present study has at least a ten year window of observation since the TRIPS Agreement came into effect.
2. Literature Review
2.1. Developing country perspectives on IPRs
8. Developing country perspectives vary on the importance of IPRs as a component of economic policy. Public debate on IPRs in these countries is sometimes caught up in emotive issues such as implications for public health and access to medicine3 or the need to prioritise among many competing demands for limited government resources. Critics point to significant implementation costs that can be associated with IPR commitments undertaken in the various international agreements.4,5 Correa (2005) and
1 See Park and Lippoldt (2003, 2005) for a review of the academic and policy debates. 2 E.g. Liu and Lin (2005) using a dataset covering 1989 � 2000 find no evidence of a structural change in the
relationship between Taiwanese exports and foreign patent rights after TRIPS is implemented. 3 At the Doha Ministerial Conference in 2001, WTO members issued the Declaration on The TRIPS Agreement
and Public Health, to make clear their intention for the TRIPS Agreement to contribute positively to public health; this document is available at: http://www.wto.org/english/thewto_e/minist_e/min01_e/mindecl_trips_e.htm .
4 Finger and Schuler (1999) provide an assessment of costs related to the implementation of WTO Uruguay Round commitments with respect to IPR reform, among other issues.
5 The criticism is certainly not limited to developing country observers. Scholars such as L. Lessig and M. Boldrin and D. K. Levine have questioned the strengthening of IPRs more generally. E.g. Lessig has challenged the privatisation of the so-called �intellectual commons� (Lessig, 2002) and the expanded range of patentable innovation in the US that now includes such areas as Internet business methods (Lessig, 1999). Boldrin and Levine (2007) recognise the need for innovators to be rewarded and to have the right of sale with regard to their ideas. However, they challenge the right to regulate the use of innovations after their sale,
TAD/TC/WP(2007)19/FINAL
8
others have challenged the legal and economic implications of strengthening of IPR, alleging that the system of international IPR rules is imposing a burden on developing countries. The accusation is that the emerging standards raise the cost of intellectual content in products sought by developing countries, while developing countries may not have the capacity to capitalise on their own potential in a similar manner. Moreover, Correa alleges that the implicit bargain underlying the strengthening of the international IPR regime has not been satisfied. Some developing countries have argued in the World Trade Organisation (WTO) and World Intellectual Property Organisation (WIPO) that promises of technology transfer as contained in the TRIPS Agreement (see Box 1, below) do not appear to be yielding corresponding benefits for developing countries, whereas the strengthened IPR may raise costs for developing countries seeking to upgrade their technological capabilities.6
9. On the other hand, some developing countries have sought to exploit strengthened IPRs strategically as a development tool. For example, they may see IPR policy as a means to draw in investment and to encourage domestic innovation, with the potential to boost development on both the extensive dimension (overall size of the economy) as well as the intensive dimension (i.e. the value-added per employee). Government officials from a range of economies have pointed to strengthened IPRs as a plank in their strategies to enhance FDI inflows and trade.7 For example, experts in some poor developing countries have seen the institution of trademark protection as a vehicle for reassuring investors in manufacturing industries that they can combat knock-offs. For wealthier countries, enhancement of IPRs may be seen as a means to draw in high technology that can boost worker productivity and contribute to intensification of growth.
2.2. Technology transfer
10. The empirical economic literature is increasingly tending to lend support to the view that international trade and FDI provide means by which technologies can be spread internationally (e.g. see Keller 2004 for a survey). Acharya and Keller (2007) show how the extent of international technology transfer activities can explain cross-country differences in per capita incomes. They find that imports are an especially important channel of technology transfer, although the volume of transfer varies by country, being greater in countries with stronger absorptive capacities (as measured by the level of local education attainment and research and development investments). Other studies on imports as a channel of transfer focus on producer goods and intangible assets. For example, Eaton and Kortum (2002) focus on imports of intermediate inputs and show that trade can increase the productivity of importing countries by increasing their access to foreign inputs and technologies. Coe and Helpman (1995) focus on spillovers of research knowledge transmitted through trade; that is, the extent of spillovers from country X into country Y depends on the share of X�s products in the total imports of country Y. Xu and Wang (1999) argue that it is the share of capital good imports that matter most in conveying knowledge spillovers.
proposing instead that innovators should make better efforts to capitalise on their first-mover advantages when they first sell their ideas.
6 Expressing similar concerns, in 2004 Brazil and Argentina proposed for WIPO to launch a new development agenda. The text of their original proposal is available here: http://www.wipo.int/documents/en/document/govbody/wo_gb_ga/pdf/wo_ga_31_11.pdf . The ensuing debate led to an evolution of the concept and eventual endorsement of a development agenda by the WIPO General Assembly on 28 September 2007: http://www.wipo.int/pressroom/en/articles/2007/article_0071.html .
7 E.g., Cambodia, China and Singapore have integrated IPRs in their national economic strategies and affirmed the importance of IPRs on their national intellectual property office web sites: http://www.moc.gov.kh/laws_regulation/development_of_cambodia's_ipr.htm , http://www.sipo.gov.cn/sipo_English/gysipo_e/fzgh/t20020430_33893.htm , http://www.ipos.gov.sg/main/aboutus/aboutipos/visionmission.html .
TAD/TC/WP(2007)19/FINAL
9
Box 1. The TRIPS Agreement and technology transfer The TRIPS Agreement makes explicit the signatories� intention to promote technology transfer. Article 7 includes a corresponding reference as part of the general objectives of the Agreement: �The protection and enforcement of intellectual property rights should contribute to the promotion of technological innovation and to the transfer and dissemination of technology, to the mutual advantage of producers and users of technological knowledge and in a manner conducive to social and economic welfare, and to a balance of rights and obligations.� Moreover, in the provisions governing patent rights the Agreement provides for a mechanism for rights holders to transfer their property for use by others: �Patent owners shall also have the right to assign, or transfer by succession, the patent and to conclude licensing contracts.� (Article 28.2) The Agreement includes other provisions aimed at preventing abuses that would limit technology transfer. For example, Article 8. 2 states the principle that: �Appropriate measures, provided that they are consistent with the provisions of this Agreement, may be needed to prevent the abuse of intellectual property rights by right holders or the resort to practices which unreasonably restrain trade or adversely affect the international transfer of technology.� Article 40 addresses issues related to control of anti-competitive practices in contractual licences, specifying the approach to dealing with this issue, beginning with the following point of understanding: �Members agree that some licensing practices or conditions pertaining to intellectual property rights which restrain competition may have adverse effects on trade and may impede the transfer and dissemination of technology.� Article 66.2 provides for incentives to encourage technology transfer from developed countries to LDCs: �Developed country Members shall provide incentives to enterprises and institutions in their territories for the purpose of promoting and encouraging technology transfer to least-developed country Members in order to enable them to create a sound and viable technological base.� At the WTO Ministerial Conference in Doha in November 2001, ministers issued a decision on Implementation-related issues and concerns that elaborated upon Article 66..2 (WTO document WT/MIN(01)/17, para 11.2): �Reaffirming that the provisions of Article 66.2 of the TRIPS Agreement are mandatory, it is agreed that the TRIPS Council shall put in place a mechanism for ensuring the monitoring and full implementation of the obligations in question. To this end, developed-country members shall submit prior to the end of 2002 detailed reports on the functioning in practice of the incentives provided to their enterprises for the transfer of technology in pursuance of their commitments under Article 66.2. These submissions shall be subject to a review in the TRIPS Council and information shall be updated by Members annually.� In its Decision of 19 February 2003 (WTO document IP/C/28), the Council for TRIPS put in place the reporting mechanism which is now operational. Developed countries submit annual reports on their actions in relation to Article 66.2. A review of the annual reports at the October 2006 meeting of the Council for TRIPS, however, revealed continuing divergence between some developed and developing countries in the interpretation of Article 66.2. The minutes from this meeting (WTO document IP/C/M/52) and other Council documents highlight differences with respect to the definition of �technology transfer�, the ability to measure �technology transfer� and the role of both developed and developing countries under the Agreement, among other issues. For example, there is debate as to whether technical assistance related to implementation of the TRIPS Agreement can be considered as contributing to satisfaction of Article 66.2.
11. A portion of the literature concentrates on FDI as a means of international technology transfer. Hoekman and Javorcik (2007) provide cross-country as well as country studies of FDI as a conduit for knowledge transfer. Such transfers help recipient countries develop their own capacity to export high-tech goods and learn-by-exporting. Other studies explore the mechanisms by which FDI transfers knowledge to the local economy. For example, the transmission of technology can occur when technology is transferred from the parent firm to the subsidiary (see Markusen, 2002) or when technological goods produced by subsidiaries find uses locally (see Blomström and Kokko, 1998). The transmission of technology or
TAD/TC/WP(2007)19/FINAL
10
knowledge can also occur through labour mobility between subsidiaries and domestic enterprises (Fosfuri et al., 2001).
12. Although there is mounting evidence that FDI and imports can be vehicles for technology transfer, the studies referenced above do not explicitly examine the role of IPRs in stimulating technology transfer via trade and FDI. Maskus (2004) provides a more focused survey of IPR policies and regimes, noting in particular that they affect incentives for engaging in international technology transfer, influencing the volume of flows via different mechanisms of transfers as well as the choice of means of transferring technologies.
13. Furthermore, the literature points to complexity in the influence of IPRs on such processes. A priori, IPRs create possibilities for both expanding and restricting technology transfer. For example, Maskus and Penubarti (1995) identify two opposing theoretical effects of stronger IPRs on trade: a market expansion effect and a market power effect. These effects could also be present in other forms of technology transfer activities. Consider a firm in country A that exports patentable commodities to country B, and suppose country B strengthens its IPRs. On the one hand, the firm perceives an expansion in its market due to a reduction in imitation by local firms. The demand curve it faces in country B shifts out. On the other hand, stronger IPRs in country B increase the firm�s market power, reducing the elasticity of the demand it faces. The market expansion effect is likely to dominate in countries where the degree of market rivalry and competition is high, but the market power effect could in theory prevail in countries where local competitors pose a weak threat of imitation.
2.3. Trade and IPRs
14. Although a number of studies have considered the influence of IPRs on trade flows, the evidence is far from complete. Maskus and Penubarti (1995) use data for 1984 and examine manufacturing exports from OECD member countries (as of 1984) to developing nations. Empirically they find that the market expansion effect tends to dominate the market power effect so that stronger IPRs on balance expand trade. Fink and Primo Braga (1999), using a sample of 89 countries in 1989, find a positive link between IPRs and trade flows for total non-fuel trade but a weak link between IPRs and high technology trade (such as trade in chemicals, electrical and office machinery, telecommunications apparatus, and so forth). One reason may be that the market power effect of IPRs dominates in high-technology sectors. The plausibility of this is that firms in technology-intense industries may already possess some market dominance from their technological superiority. Stronger patent protection would then largely raise their rents. Another possibility, and one that affects many studies of technology transfer that focus on one mode of technology transfer, is that stronger IPRs lead firms to switch among different modes of transfer, say from exporting to FDI.8
15. However, later studies do find that stronger IPRs, in certain situations, can stimulate trade in high-tech products. Using state-level U.S. exports to 92 countries for the period 1992, Smith (1999) finds that the impact of stronger patent protection on trade depends on the importing country�s capacity to imitate (using R&D/GDP ratios as an indicator of the capacity to imitate). In countries with a weak capacity to imitate, the weak capacity acts as a de facto form of protection. Firms would not actually need IPRs to appropriate the returns to their innovation. Thus in such circumstances stronger patent rights provide greater market power, which could outweigh any market expansion effects. The empirical results in Smith (1999) confirm that where the capacity for imitation is high, a strengthening of IPRs increases the flow of trade. This holds in high-technology sectors as well, such as chemicals and scientific instruments.
8 See Blonigen (2001) for an analysis of the substitution effects or complementarities between a multinational
firm�s exports and production by its foreign affiliates, using product-level data.
TAD/TC/WP(2007)19/FINAL
11
16. IPRs alone may not stimulate knowledge transfers. Bascavusoglu and Zuniga (2002) examine the exports of French technology services to 19 country destinations and 29 sectors for the year 1999. They find that foreign IPRs can enhance such exports if the destination markets have commercial potential in terms of large markets and strong technological capacities. Stronger IPRs in low-income countries have an insignificant effect and may even deter technology flows in low-technology sectors.
17. In all of the studies cited above, cross-sectional data were used. Co (2004) uses panel data (i.e. cross-sectional and time-series data) that allow for dynamic changes in IP institutions and market structure. The data set covers U.S. exports to 71 countries during the period 1970-1992. The study finds that stronger IPRs stimulate U.S. exports of goods that are R&D-intensive (such as drugs and electronics) conditional on the importing country having at least a moderate capacity to imitate. Stronger IPRs are found to reduce U.S. exports of non R&D-intensive goods to countries with a low capacity for imitation, holding other factors constant.
2.4. FDI and IPRs
18. Empirical evidence on the effects of IPRs on FDI is rather mixed. Braga and Fink (1998) examine the stocks of outward U.S. direct foreign investment in 42 countries in 1992 and find that they weakly correlate with the strength of patent protection in those countries, holding other factors constant. In contrast, Lee and Mansfield (1996) examine a panel of 14 developing countries around the same period studied in Braga and Fink (1998) and find that the strength of IPRs (as perceived by managers in the Mansfield (1994) survey) is a significant determinant of the volume of U.S. outward FDI flows. Lee and Mansfield (1996) also find that weaker IPRs can affect the composition of FDI, causing firms to invest in non-manufacturing and non-R&D activities, like sales and distribution outlets.
19. More recently, Nunnenkamp and Spatz (2004) using aggregate national data find that intellectual property rights are a significant determinant of U.S. outward FDI stocks, particularly in developing countries. Branstetter et al. (2005) concur using firm level data in 16 countries during the period 1982 � 1999. They find that host country IPR reforms encourage U.S. multinational firms (especially those parent firms with large patent portfolios) to expand their sales, employment, investment, and production abroad.
20. In contrast, Mayer and Pfister (2001) using French multinational firm data for the periods 1981-1983 and 1988-1992 find that stronger patent rights have a negative influence on the location decisions of multinational firms. When they split their sample into developed and developing host countries, they find that the strength of a developing country�s patent laws has a statistically insignificant influence on the probability that a French multinational firm will locate in that developing country. The strength of a developed country�s patent laws has a quadratic (inverse-U) effect on the firm�s probability of locating in the developed country; that is, increasing the probability and then decreasing it after some critical level of patent law strength is reached.9 It is important to note that Mayer and Pfister (2001) study location decisions, not FDI flows or stocks. For firms already located in a country, the intensity of technology transfer in response to changes in patent laws is not captured in the location data alone.
21. Using firm-level data for Eastern Europe and the former Soviet Union states, Javorcik (2004) finds that stronger patent rights have a positive and statistically significant effect on the probability of foreign investment in high-technology sectors and an insignificant effect in other sectors. Moreover, foreign investors are more likely to invest in sales and distribution outlets rather than in manufacturing or R&D facilities when patent protection is weaker; this propensity is found in all sectors, not just in high-
9 Mayer and Pfister (2001) also obtain an inverse-U relationship for developing countries if the level of
corruption and political rights in the host country are not controlled for. They argue that patent indexes may be picking up the effects of institutional factors and the regulatory climate.
TAD/TC/WP(2007)19/FINAL
12
technology. These findings conflict with those of Mayer and Pfister (2001) but are consistent with those of Lee and Mansfield (1996).
22. Thus while the evidence on the effects of IPRs on FDI is mixed, studies using sectoral or industrial data seem to find that technology-sensitive FDI does respond to developing country IPRs. Moreover IPRs seem to affect the functional composition of FDI, namely between sales and distribution outlets and production and R&D facilities.
2.5. Gaps in the Literature
23. The present study differs from the previous literature in several respects. First, previous studies have largely covered the time period before the TRIPS agreement went into effect. The levels of IPRs did not change significantly before then. Thus previous studies depended mostly on cross-country variations in IPRs to explain differences in technology inflows across countries. Moreover, the structure of economies, globally and nationally, may have shifted in the post-TRIPS era (e.g. regime shifts), so that it would be useful to estimate relationships using more recent data. This study examines the period 1990 � 2005 and utilizes up-to-date measures of IPRs.
24. Second, previous studies have not separated merchandise trade and services trade. Trade in services has expanded along with increases in world FDI. FDI is a conduit for �exporting� services. Another reason to distinguish between services and merchandise trade is that technology transfer can consist of tangible goods (such as technological machinery) made available through merchandise trade and intangible goods (such as technological know-how) made available through services trade. Indeed, Miroudot (2005) discusses how increasingly innovative the services sector has become and how trade in services is an important vehicle for knowledge diffusion.
25. A third aspect that distinguishes this study from previous studies is that more attention is paid on ascertaining the technology content of imports and inward FDI into developing countries. A key issue in the international technology debate is whether trade or FDI actually introduces new technologies to developing countries or just older vintages of technology.10 In the case of FDI, plants were often established to serve as outlets for sales and distribution or for low-value added manufacturing, rather than centers for research and high-value added manufacturing. This may be understandable if developing economies had weak IPR systems and posed risks of imitation. Indeed, Contractor (1981) presents evidence that U.S. firms tended to transfer older technologies to unaffiliated parties in developing countries compared to those transferred to agents in industrialized economies.11 Mansfield�s (1994) survey provides concurring evidence that technology-intensive firms are reluctant to transfer new technologies to countries with weak IP laws. More recently, Nunnenkamp and Spatz (2004) find that weaker IPRs are associated with lower quality FDI as judged by the small increases in local R&D, employment, and value added that accompany the FDI. Further evidence on the technology transfer dimension of these flows is provided in Branstetter et al. (2006). Their analysis of US multilateral firms� responses to IPR reform in 16 economies during 1982 � 1999 �reveals that royalty payments for technology transferred to affiliates increase at the time of reforms, as do affiliate R&D expenditures and total levels of foreign patent applications.� The findings point to prospects of increased technology transfer from US firms to affiliates in countries that engaged in IPR reform.
10 Another dimension of this issue is at which point this may matter for development. To the extent that older
vintages of technology increase productivity and growth, they can still promote increased incomes. 11 The commercial age of a technology is defined as the time from commercial introduction to the inception of a
transfer agreement.
TAD/TC/WP(2007)19/FINAL
13
26. In this study, the response of technology-intensive imports and inward FDI to the strength of IPRs is examined. The study also examines the response of local innovation and technology diffusion to IPRs and inward technology transfer.
3. Conceptual Framework
27. The core contribution of this study is to present evidence, based on regression analysis, of the impact of IPRs on technology transfer to developing countries.12 This section provides a brief sketch of the empirical strategy. The technical details are relegated to Annex 1.
28. The primary objective is to analyze the relationship between technology transfer and intellectual property rights, controlling for other factors:
(1) Technology Transfer = f(IPR, Control Variables) + error term
where f denotes �function of� and IPR denotes intellectual property rights. The error term exists because the �model� (or equation) imperfectly captures the actual variation in technology transfer. The error term is decomposed into a country-specific, time-invariant effect that captures country-specific omitted variables and a random error term that captures the idiosyncratic heterogeneity (or volatility uncorrelated to the other variables)
29. The measures of technology transfer considered are inward FDI, merchandise imports, and service imports. The types of intellectual property rights considered are patent protection, copyrights, and trademark protection. The study also looks at the enforcement of IPRs in general by using a survey variable which measures the perception of IPR strength and experiences of business executives in different countries.
30. To ensure that the empirical analysis picks up the relationship between IPRs and technology transfer, it is necessary to control for variables that may also influence technology transfer, as well as variables whose influence on technology transfer that IPRs may be picking up instead. For example, strong institutions or property rights (to physical property) are correlated with levels of IPRs. Thus, unless those institutional features are controlled for, the IPR variable may simply be a proxy for institutional quality or for property rights in general. That is, if a positive relationship between IPRs and technology transfer is picked up, the relationship may be due to the role of institutions or property rights per se rather than IPRs. Hence it is important to control for these other institutional features.
31. The control variables that this study includes are property rights in general, legal effectiveness, governance, the business environment, the nature of the trade regime, and per capita GDP. When assessing the response of local innovation to IPRs and technology transfer, the study also controls for the quality of research institutions and the degree of university and industry research collaboration.
32. A key question in the global IPR debate is the extent to which stronger IPRs enable developing countries to acquire new technologies. Thus the next exercise is to assess the technology content of imports and FDI into developing and least developed economies. Two approaches are examined. First, equation (1) above is re-estimated using sectoral or industrial level data. In particular, the inward FDI and imports 12 Regression analysis is used here to consider the association of change in indicators for the strength of
intellectual property rights with changes in key economic variables, controlling for other factors. It does not explicitly measure causality. Nevertheless, IPR reforms are generally signaled in advance and, in effect, are likely to have preceded the changes recorded in the dependent economic variables considered in the regression analysis. See also footnote 19, which discusses a further test using regression analysis with lagged dependent variables.

TAD/TC/WP(2007)19/FINAL
14
of high-tech sectors or industries, such as pharmaceuticals, chemicals, computers, and others, are related to the strength of IPRs in the developing world. The empirical estimates would indicate the extent to which IPR reform attracts technology intensive imports and capital, holding other factors constant.
33. A second approach is to relate measures of innovation in the developing world, such as R&D and patenting, to measures of IPR and technology transfer:
(2) Innovation = f(IPR, Technology Transfer, Control Variables) + error term
34. The intuition is as follows: if inward FDI or imports are associated with new technological products or processes, foreign producers would have an interest in applying for local patents to protect against copying.13 Thus a rise in technology-intensive imports or inward FDI would be associated with a rise in non-resident patenting, holding other factors constant. In contrast, if foreign producers� exports to, or FDI in, the developing world were low in technology content or consisted of outdated technology, firms would less likely file for patent protection. Thus a statistically significant rise in non-resident patenting could reflect the degree to which imports or inward FDI introduce new technologies to developing markets.
35. Local or domestic R&D and patenting could also be affected by the technological content of imports and inward FDI. Imports or foreign direct investments that are high in technology content have the potential to generate knowledge spillovers, benefiting local researchers and innovators. Moreover, technology-intensive imports or inward FDI provide useful equipment (such as laboratory capital) and materials (such as chemical ingredients, biological samples) to aid research and innovation. In contrast, if developing country imports and inward FDI are low in technological content, such inflows would insignificantly contribute to local R&D and patenting. Hence a statistically significant rise in local R&D and resident patenting could reflect the degree to which imports or inward FDI are high in technology content. Thus to the extent that IPRs stimulate technology transfer, IPRs can indirectly affect local innovation by increasing access to new knowledge and directly by affecting incentives to innovate.
36. These potential effects of IPRs can be summarised in the following two hypotheses:
! Hypothesis 1: IPRs stimulate technology transfer, particularly the transfer of technology-intensive goods, services, and capital.
! Hypothesis 2: IPRs can directly stimulate local innovation as well as indirectly by stimulating the transfer of technologies that foster local innovation.
37. The goal of the empirical work is to evaluate these two hypotheses for developing and least developed countries. Of course, good theoretical reasons also exist as to why IPRs could hinder technology transfer (e.g. where the market power effects of IPRs dominate the market expansion effects) or why IPRs could hinder innovation (e.g. by increasing the costs of research inputs, by creating patent thickets which require costly licensing negotiations to resolve, or by blocking important technological components needed by other innovators). Thus the hypotheses above concern the net empirical effects of IPRs.
38. There are also limitations with the use of patent data to measure innovation and technology diffusion. Not all new innovations are patented. Some firms may prefer to keep new inventions a trade secret or may have developed innovations that are not patentable in some jurisdictions such as software, biotechnological innovations, or business methods. Other firms may not bother to apply for patent protection in jurisdictions where the capacity for imitation is weak. Thus drawing conclusions about the
13 See Taylor (1993) and Grossman and Lai (2004) for a theoretical analysis of the linkages among IPRs,
innovation, and openness.

TAD/TC/WP(2007)19/FINAL
15
technology content of imports and FDI based on variations in patent filings must be subject to these qualifications.
4. Data
39. This section describes the dataset, data sources, and some sample statistics.
4.1. Dependent Variables
40. A large sample of countries has been assembled for this study, covering the time period 1990 � 2005. The sample of countries is diverse, representing different income groups and institutional environments (see Annex 2 for a list of countries and Annex 3 for a list of data sources).
41. As measures of inward technology transfer, the study employs the stock of inward FDI, merchandise imports, and service imports.14 Data on inward FDI and services trade (including services by sector) are from UNCTAD, while data on merchandise trade are from the WTO. This study also looks at the sectoral or industrial composition of inward FDI and imports of merchandise goods and services. Data on merchandise trade by sector are from the WTO and the UN Comtrade database, while data on services trade by sector are from UNCTAD. Sectoral data on global FDI are not widely available. Hence, as a substitute, this study examines U.S. outward FDI-related data by sector. Data on U.S. direct investment abroad are from the Bureau of Economic Analysis (BEA). The dependent variables for FDI and trade are given in constant (2000) U.S. dollars and included as levels.
42. In addition to measures of technology transfer, the study examines measures of innovation such as R&D and patenting. R&D can be considered an �input� into innovation whereas patents can be considered �outputs� of innovation. The R&D data employed here are from the OECD and UNESCO, and the patent data are from WIPO.
4.2. Explanatory Variables
43. As explanatory variables, the key independent variables of interest are the strength of IPRs. Four measures of IPRs are considered in this study: an index of patent rights, index of copyrights, index of trademark rights, and a survey rating of IPRs. The first three indexes are based on membership in corresponding international treaties (which influence IPRs, see Box 2), statutory laws and legislation, as well as case law. The fourth measure is based on the perceptions and experiences of business executives in different countries. A description of each measure is provided below, and Annex 4 provides a summary of the legal features in the indexes of patent rights, copyrights, and trademark rights.
(A) Patent Rights Index
44. The measure of patent rights is based on Ginarte and Park (1997) and Park and Wagh (2002). This present study updates the index to 2005 and extends it in order to incorporate the patentability of new technological fields like software and biotechnology. The index of patent rights ranges from zero (weakest) to five (strongest). The value of the index is obtained by aggregating the following five components: extent of coverage, membership in international treaties, duration of protection, absence of restrictions on rights, and statutory enforcement provisions. Coverage refers to the subject material (type of invention) that can be protected; duration refers to the length of protection; restrictions refer to the less than exclusive use of those rights; membership in international treaties indicates the adoption into national law of certain substantive and procedural laws of those international agreements. Membership in an international treaty may also signal the willingness of particular nations to adhere to shared international principles such as non-discrimination. The enforcement component consists of mechanisms that aid in enforcing one�s patent
14 A discussion of technology and globalisation indicators can be found in OECD (2005).
TAD/TC/WP(2007)19/FINAL
16
rights (such as preliminary injunctions against infringers). Each of these components is scored on a scale from 0 to 1 (reflecting the fraction of legal features that are available). The overall value of the patent rights index is the unweighted sum of the component scores.
(B) Copyrights Index
45. This index is based on Park (2005) and Reynolds (2003), and this present study updates the index to 2005. The copyright index consists of four components: coverage, usage, enforcement, and membership in international treaties. Coverage again refers to the subject matter that is protected and is intertwined with copyright duration (since the length of protection varies with subject matter). The usage component addresses the degree to which copyright holders have control over their copyrights (vis-à-vis the use of their works by others). The enforcement component also includes provisions that aid in enforcing a copyright holder�s rights (such as the availability of criminal penalties for infringement). The treaties cover various global conventions and agreements (as described in Annex 1). Each component is scored on a scale from 0 to 1, again reflecting the fraction of legal features that are available. The overall score for the copyright index is the unweighted average of the four components. Hence, the copyright index ranges from zero (lowest) to one (highest).
(C) Trademark Rights Index
46. This index is also based on Park (2005) and Reynolds (2003), and for this study the index is updated to 2005. The trademark index consists of three components: coverage, procedures (which incorporates enforcement features and possible restrictions on the rights holder), and international treaties. The coverage component refers to types of names and symbols that can be trademarked. The procedures component addresses the manner in which trademark rights are procured and enforced; hence the procedures component incorporates enforcement features. The international treaties component incorporates various global conventions and agreements on statutory and procedural laws. Each component is scored on a scale of 0 to 1, indicating again the fraction of legal features that are available. The overall score for the trademark index is an unweighted average of the three components.
(D) IPR Survey
47. This index is from the World Economic Forum surveys of business executives. Business executives in the country surveyed are asked to rate the country�s strength of intellectual property laws on a scale of 1 (weakest) to 7 (strongest). Their ratings are based on their experiences and perceptions, as well as on any information or observation they may have of the laws, procedures, and institutions. This makes the survey ratings a useful complement to the statutory indexes above. Nonetheless, there are a few limitations with this index. First, it is highly aggregative in terms of not distinguishing among copyrights, trademark rights, or patent rights. It is difficult to know which aspects of IPR laws or practice drive the ratings to be high or low. Second, the ratings of different countries are not fully comparable because the same group of survey participants is not evaluating the full sample of countries. Rather, participants in country A rate country A�s IPRs laws, while participants in country B rate country B�s IPRs laws. Participants in A may have stricter standards than those in B. Hence the ratings are less comparable than if the same participants were to rank country A versus country B. Third, the time series dimension is limited. Data covering a large number of countries are available for 2004-2007, but a smaller sample of countries is available for 2000. Due to the limited time dimension of this variable, this study takes the average values for 2004-5 and treats the data as a time invariant variable).
TAD/TC/WP(2007)19/FINAL
17
Box 2. TRIPS and Ratification of WIPO-Administered Treaties
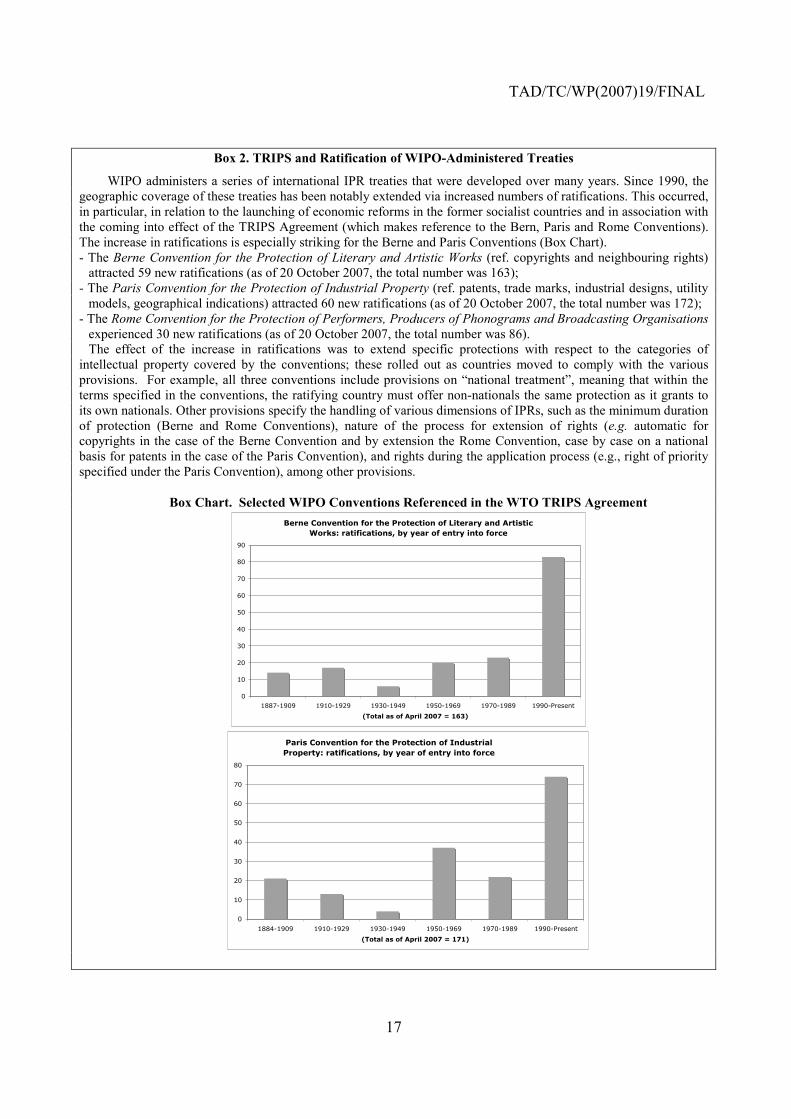
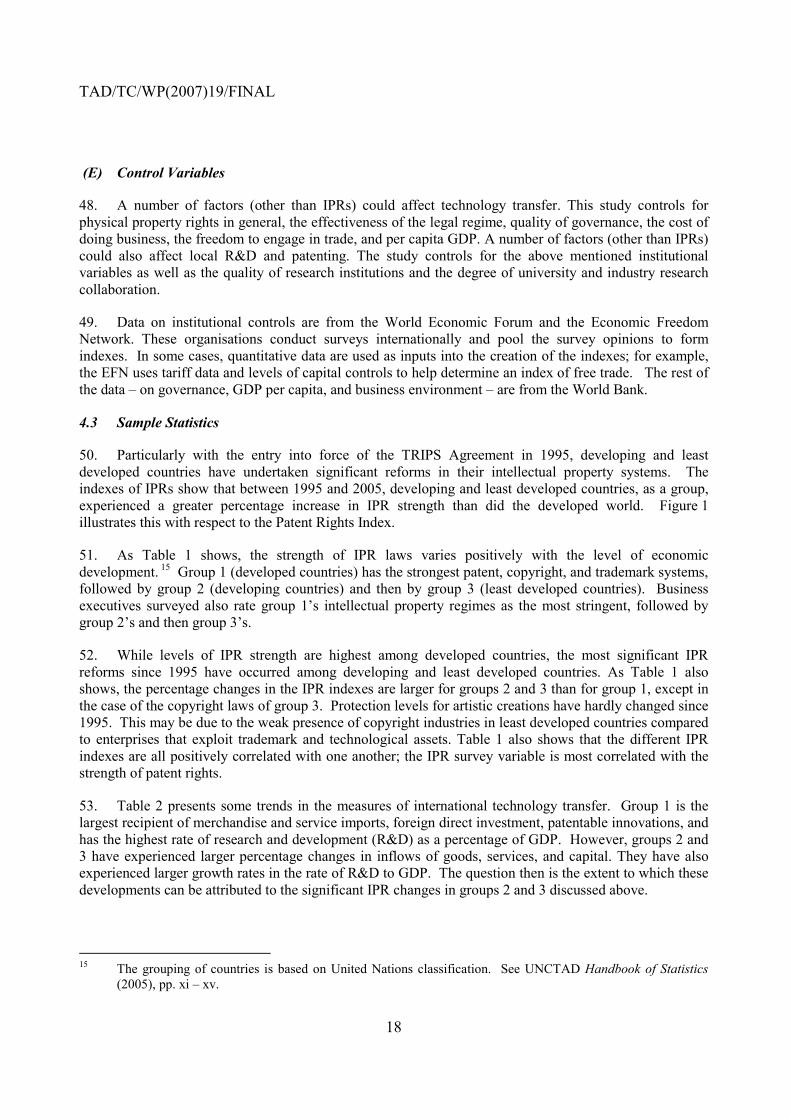
WIPO administers a series of international IPR treaties that were developed over many years. Since 1990, the geographic coverage of these treaties has been notably extended via increased numbers of ratifications. This occurred, in particular, in relation to the launching of economic reforms in the former socialist countries and in association with the coming into effect of the TRIPS Agreement (which makes reference to the Bern, Paris and Rome Conventions). The increase in ratifications is especially striking for the Berne and Paris Conventions (Box Chart). - The Berne Convention for the Protection of Literary and Artistic Works (ref. copyrights and neighbouring rights)
attracted 59 new ratifications (as of 20 October 2007, the total number was 163); - The Paris Convention for the Protection of Industrial Property (ref. patents, trade marks, industrial designs, utility
models, geographical indications) attracted 60 new ratifications (as of 20 October 2007, the total number was 172); - The Rome Convention for the Protection of Performers, Producers of Phonograms and Broadcasting Organisations
experienced 30 new ratifications (as of 20 October 2007, the total number was 86). The effect of the increase in ratifications was to extend specific protections with respect to the categories of
intellectual property covered by the conventions; these rolled out as countries moved to comply with the various provisions. For example, all three conventions include provisions on �national treatment�, meaning that within the terms specified in the conventions, the ratifying country must offer non-nationals the same protection as it grants to its own nationals. Other provisions specify the handling of various dimensions of IPRs, such as the minimum duration of protection (Berne and Rome Conventions), nature of the process for extension of rights (e.g. automatic for copyrights in the case of the Berne Convention and by extension the Rome Convention, case by case on a national basis for patents in the case of the Paris Convention), and rights during the application process (e.g., right of priority specified under the Paris Convention), among other provisions.
Box Chart. Selected WIPO Conventions Referenced in the WTO TRIPS Agreement
Berne Convention for the Protection of Literary and Artistic Works: ratifications, by year of entry into force
0
10
20
30
40
50
60
70
80
90
1887-1909 1910-1929 1930-1949 1950-1969 1970-1989 1990-Present
(Total as of April 2007 = 163)
Paris Convention for the Protection of Industrial Property: ratifications, by year of entry into force
0
10
20
30
40
50
60
70
80
1884-1909 1910-1929 1930-1949 1950-1969 1970-1989 1990-Present
(Total as of April 2007 = 171)
TAD/TC/WP(2007)19/FINAL
18
(E) Control Variables
48. A number of factors (other than IPRs) could affect technology transfer. This study controls for physical property rights in general, the effectiveness of the legal regime, quality of governance, the cost of doing business, the freedom to engage in trade, and per capita GDP. A number of factors (other than IPRs) could also affect local R&D and patenting. The study controls for the above mentioned institutional variables as well as the quality of research institutions and the degree of university and industry research collaboration.
49. Data on institutional controls are from the World Economic Forum and the Economic Freedom Network. These organisations conduct surveys internationally and pool the survey opinions to form indexes. In some cases, quantitative data are used as inputs into the creation of the indexes; for example, the EFN uses tariff data and levels of capital controls to help determine an index of free trade. The rest of the data � on governance, GDP per capita, and business environment � are from the World Bank.
4.3 Sample Statistics
50. Particularly with the entry into force of the TRIPS Agreement in 1995, developing and least developed countries have undertaken significant reforms in their intellectual property systems. The indexes of IPRs show that between 1995 and 2005, developing and least developed countries, as a group, experienced a greater percentage increase in IPR strength than did the developed world. Figure 1 illustrates this with respect to the Patent Rights Index.
51. As Table 1 shows, the strength of IPR laws varies positively with the level of economic development. 15 Group 1 (developed countries) has the strongest patent, copyright, and trademark systems, followed by group 2 (developing countries) and then by group 3 (least developed countries). Business executives surveyed also rate group 1�s intellectual property regimes as the most stringent, followed by group 2�s and then group 3�s.
52. While levels of IPR strength are highest among developed countries, the most significant IPR reforms since 1995 have occurred among developing and least developed countries. As Table 1 also shows, the percentage changes in the IPR indexes are larger for groups 2 and 3 than for group 1, except in the case of the copyright laws of group 3. Protection levels for artistic creations have hardly changed since 1995. This may be due to the weak presence of copyright industries in least developed countries compared to enterprises that exploit trademark and technological assets. Table 1 also shows that the different IPR indexes are all positively correlated with one another; the IPR survey variable is most correlated with the strength of patent rights.
53. Table 2 presents some trends in the measures of international technology transfer. Group 1 is the largest recipient of merchandise and service imports, foreign direct investment, patentable innovations, and has the highest rate of research and development (R&D) as a percentage of GDP. However, groups 2 and 3 have experienced larger percentage changes in inflows of goods, services, and capital. They have also experienced larger growth rates in the rate of R&D to GDP. The question then is the extent to which these developments can be attributed to the significant IPR changes in groups 2 and 3 discussed above.
15 The grouping of countries is based on United Nations classification. See UNCTAD Handbook of Statistics
(2005), pp. xi � xv.
TAD/TC/WP(2007)19/FINAL
19
54. Table 3 shows the industrial composition of these inflows of FDI and trade in developing and least developed countries, focusing on those industries that tend to be technologically-intensive, for example chemicals, pharmaceuticals, computer and information goods, optics, and others.
55. As noted earlier, data on a sectoral breakdown of world foreign direct investment are not widely available. Therefore this study turns to U.S. FDI data for which detailed breakdown by sector is available. U.S. FDI behavior may not be representative of the world as a whole, but the U.S. does account for the largest share of world FDI. Using UNCTAD data sources (see Annex 3), we can calculate that the U.S. accounts for 20% of the world�s outward stock of FDI (during 2003-2005).
56. Table 3 compares shares between 1995 and 2005 (except for U.S. FDI, where 2005 is compared to 2000).16 The shares refer to a commodity group�s or sector�s share in the given activity; for example, the share of pharmaceutical imports in total merchandise imports or the share of communication service imports in total service imports. The key highlights are as follows: there appears to be a shift in the composition of imports and inward investments away from chemicals to other sectors in the developing world. For example, a greater share of U.S. FDI assets is in the service and computer industries in developing countries. A greater share of merchandise imports in groups 2 and 3 in 2005 is in pharmaceuticals, electrical and electronic goods, office and telecom equipment, and optics and precision equipment, and a smaller share in chemicals and aerospace. Between 1995 and 2005, communication services imports account for a smaller share while computer services account for a larger share, as do royalties. Royalties pertain to the importation of technological services, and measure the license fees and royalties paid for the use of foreign intangible assets (like intellectual property and know-how). While technologically-intensive goods, services, and capital are relatively small shares of foreign inflows into the developing world, they have expanded considerably in developing markets since 1995.
57. Table 4 examines some of the control variables used in this study. The table shows, for 2005, the economic and institutional characteristics of groups 2 and 3 relative to group 1. The average per capita GDP of developing countries is 15% of that of developed countries, while the average per capita GDP of least developed countries is 1% of that of developed countries. Uniformly, group 2 ranks lower than group 1 in terms of the degree to which agents are free to engage in international trade, the business climate, the security of property rights, the integrity of the legal system, governance, and innovative capacity. Group 3 in turn ranks lower than group 2 in terms of these characteristics. As the sample correlations in Table 4 show, strong patent rights tend to exist in countries with strong governance, property rights, business climate, open markets, and effective legal systems.
5. Empirical Results
58. In this section, the empirical results using regression analysis are discussed. The main results are in Tables 5 � 16. First, it would be useful to give an overview. Table 5 shows how the stock of inward FDI relates to the different measures of intellectual property strength, holding other factors constant. Table 6 repeats the analysis for different country groups: developed, developing, and least developed. Tables 7 and 8 do the same for merchandise imports, and Tables 9 and 10 for service imports.
59. Having established a link between imports, FDI, and IPRs, the next step is to evaluate the extent to which those inflows of capital, goods, and services are associated with effective technology transfer. This study offers two ways in which to assess the technological content of these inflows. The first is a direct approach, namely to assess the sectoral composition of these inflows. Do, for example, IPRs stimulate the inflows of high-tech goods, services, and capital? The results of this approach are given in Tables 11-13.
16 The industrial categories in the BEA data have changed since 1999 so that some sectoral matching with prior
years is difficult.
TAD/TC/WP(2007)19/FINAL
20
The second is indirect, namely to assess the response of local innovation and technology diffusion to technology transfer. Are increased inward FDI and imports associated with a higher R&D intensity and patenting? The results of this second approach are provided in Tables 14-16.
5.1 Technology Transfer and IPRs
60. In Table 5, the inward stock of foreign direct investment is investigated. In columns 1 � 3, the different IPR measures are examined separately and then jointly in column 4. The results show that individually patent rights, copyrights, and trademark rights are statistically significant determinants of inward FDI. However, when all three measures are entered together, only the patent rights variable remains strongly significant.17 This suggests that when the index of copyrights or trademark rights is examined alone (along with the control variables), it tends to pick up the effects of patent rights. If so, inward FDI that helps establish plants or subsidiaries is largely sensitive to the protection of inventive output rather than business names, symbols, or artistic creations. But in some sectors, copyrights and trademark rights may be more important if they are the only legal means of protecting an intellectual property asset; for example, software may only be copyrightable, not patentable.
61. The negative coefficients of copyrights and trademark rights in column 4, though statistically insignificant, likely arise because all three indexes are positively correlated but the copyright and trademark variables are poorer proxies for IPRs that matter to FDI.18 On the whole, the estimates suggest that a 1% strengthening of patent rights is associated with a more than 2% increase in the stock of inward FDI. The model explains about 60% of the variation in the data.
62. Of course, some of this FDI could be for the establishment of plants whose main purpose is sales and distribution or manufacturing, rather than research. The fact that multinational firm investments are sensitive to patent rights, holding other factors constant, suggests that there are valuable intangible assets at stake, whether they are for production, research, or sales.
63. As for the control variables, real GDP per capita is a statistically significant explanatory variable as is the index of free trade. The variable, IPR survey, which reflects business executives� perceptions (or experiences) of IPR strength is also a significant determinant. Legal effectiveness in general is not consistently an important factor in inward FDI. This could be due to the possibility that investors are more concerned with specialized legal protection, as it relates to intellectual property, rather than general property rights and legal institutions in general. The doing business variable has the right sign (negative, since lower scores reflect higher rank) but is not statistically significant, meaning that the cost of starting and operating a business is conducive to FDI but is not a primary influence. Governance has a statistically significant negative influence on inward FDI but this stems from two factors. First, governance and intellectual property rights are positively correlated such that when the two variables are entered together, the positive effect of IPR variables dominates. Second, the net negative influence could suggest some substitution effects (although the result should be interpreted with some caution due to the aforementioned correlation): that stronger governance favours domestic capital formation rather than foreign investment, such that domestic capital crowds out some inward FDI.
64. In Table 6, the results of dividing the sample into different country groups are shown. This provides an indication whether the effects of IPR on inward FDI vary by level of economic development. To conserve space, only the results with patent rights are shown since patent protection is the more important 17 The results of the regression assessment simultaneously taking into account all three IPR indexes should be
interpreted with caution due to potential multicollinearity issues, discussed below. 18 Typically if two variables are positively correlated and are entered together in a model, their coefficient signs
may be opposite. See Greene (2003), Chapter 4.9.

TAD/TC/WP(2007)19/FINAL
21
intellectual property factor concerning inward FDI. As the table shows, the positive relationship of IPRs to inward FDI is present for all three country income groups. In each case, the inward FDI stock is positively and significantly related to stronger patent protection. However, the quantitative relationship does vary by level of development. The impact is largest among developed countries. A 1% strengthening of patent laws is associated with an 11.2% increase in the stock of inward FDI in group 1, but with a less than 2% increase among groups 2 and 3 countries.19 This may be due to the existence of complementary factors in group 1 that make FDI more profitable in developed country markets.
65. The IPR survey variable also shows that business perceptions of a stronger intellectual property regime have a stronger impact on inward FDI in group 1 than in group 2. The estimated coefficient of IPR survey is 6.88 for group 1 versus 1.63 for group 2. However, the coefficient of IPR survey for group 3 is negative. There are three possible reasons. For group 3 countries, again the survey and the index are positively correlated, but what matters in least developed countries is not just the perception of strength but actual legislative changes and statutory rights which give a clear signal to agents as to what their intellectual property rights are and what means of enforcement exist. Also, the IPR survey reflects not just patent strength but intellectual property rights in general, including copyrights and trademark rights. The net negative effect may then reflect the possibility that strong, comprehensive IP enforcement exerts some market power effects. Firms that enjoy increased market power have an incentive to reduce the stock of inward FDI and consequently the supply of output of plants.
66. As for the control variables, GDP per capita or income per person has little predictive value for the inward FDI of developed countries. The high levels of GDP per capita in richer countries may reflect relatively high labour costs which in some cases create offsetting incentives to increase the stock of inward FDI that higher income per person might otherwise generate. The index of free trade is also a weak influence on FDI in group 1. Generally, group 1 countries all have open markets so that this variable exhibits little variability among developed economies. The other institutional variables are not consistently important factors and they are, as pointed out earlier, correlated with IPRs. The important demonstration here is that the patent rights variable remains statistically significant even after controlling for these other institutional factors � factors which some might argue are what the intellectual property rights indexes really pick up. Instead the results indicate that IPRs have influences beyond any institutional aspects that are correlated with strong IPRs. These influences specifically affect incentives to transfer knowledge-related assets which are easy to imitate and difficult to appropriate.
67. Judging by the goodness of fit measure (pseudo-R2), the model overall does not fit group 2 as well as it does for groups 1 and 3. Only a third of the variation in the inward FDI of group 2 is captured by the model. There are a lot more countries in group 2 and more heterogeneity among them. The group consists of new emerging markets like Bulgaria, the Czech Republic, Slovakia, Hungary, and Poland, newly industrialized countries like South Korea, Taiwan, Singapore, and Hong Kong, as well as lower income economies like Egypt, Sri Lanka, and Pakistan.
68. Table 7 repeats the analysis displayed in Table 5 with merchandise imports as the variable to be explained. The results show that patent rights are a positive, statistically significant determinant of
19 FDI inflows normally respond to changes in the host country policy environment with a lag, e.g. due in part to
the time it takes to plan and negotiate an investment. On the other hand, IPR reform in a given country generally rolls out over a multi-year period and hence there is an advance signalling effect to investors of the intentions of the government even before the laws on the books (and hence the IPR index scores) change. Thus, the model naturally includes a degree of built-in lag that may offset the effect of the stickiness of FDI. Nevertheless, in order to test whether there is a need for additional steps in the model to account for the lag in FDI response, the model was re-run with a lag of 1 five year period. Overall, and for groups 1 and 2, the patent rights index was still strongly significant, although the significance was reduced for group 3 (LDCs).

TAD/TC/WP(2007)19/FINAL
22
merchandise imports. Copyrights are an insignificant influence and trademark rights a mild influence on merchandise imports. But overall the effects of patent rights dominate. Enforcement of IPRs in practice is also a significant influence on inflows of merchandise imports. Other factors like the freedom to trade and GDP per capita also positively and significantly influence merchandise imports. Again, patent rights are an important determinant even after controlling for related institutional variables, like legal effectiveness, governance, property rights in general, and the business environment. Around 60% of the variation in merchandise imports is accounted for by the model.
69. Table 8 shows the results of splitting the sample by country groups. Patent rights are a statistically significant determinant of merchandise imports for both developed and developing countries; however, the quantitative impact of a percentage change in patent reform is larger for developed countries than it is for developing. For least developed countries, the qualitative and quantitative impacts of patent rights on merchandise imports are weaker. The patent rights variable is statistically significant at only the 10% level and a 1% increase in the strength of patent protection is associated with less than a 1% increase in merchandise imports. Moreover, the IPR survey variable is largely irrelevant to the merchandise imports of least developed countries. One possibility is that stronger IPR enforcement prevents continued importation of cheap imitations which in some cases might offset increases of other types of merchandise imports.
70. As for the control variables, income per person positively affects the demand for merchandise imports in groups 2 and 3 but negligibly in group 1. The ability to engage in free trade positively influences the merchandise imports of developing countries but may induce substitution effects in developed countries and in least developed countries; that is, encourage a switch from merchandise imports to inward FDI. Overall the model explains more than two-thirds of the variation in merchandise imports in groups 1 and 3 but only one-third of it in group 2.
71. Table 9 shows how service imports relate to intellectual property protection and other variables. Columns 1 � 3 examine the different indexes of IPRs one at a time while column 4 examines all of them jointly. Again, patent rights are a dominant influence in that service imports are more sensitive to levels of patent protection, holding other variables constant. Most of the control variables (index of free trade, GDP per capita, IPR enforcement, and legal effectiveness) exert a positive influence on service imports. About 60% of the variation in service imports is explained by the model.
72. Table 10 shows the results of splitting the sample by country groups. Again, the positive and statistically significant influence of patent rights on service imports does not vary by level of economic development, but the quantitative impact on such imports is largest in richer countries. The enforcement of IPRs in practice is important in developing countries, but not significant in the developed and least developed markets. In those regions, the market expansion effects of stronger IPR laws and enforcement may be balanced by the increased market power effects. The model explains almost 70% of the variation in the data for developed and least developed countries but only a third for developing countries. Again, the middle sample is more heterogeneous.
5.2 Technology Content of Transfers in Developing Countries
73. The results thus far have established a positive association between patent rights and technology transfer, controlling for other variables, and that this association is not qualitatively different across different income groups of countries. This supports the view that the recent increase in developing country trade and FDI can be attributed to the strengthening of IPRs in developing countries, among other factors. Next, the technological content and technological implications of the increased trade and FDI are assessed. For example, are there increased inflows of technologically-intensive goods, services, and capital in
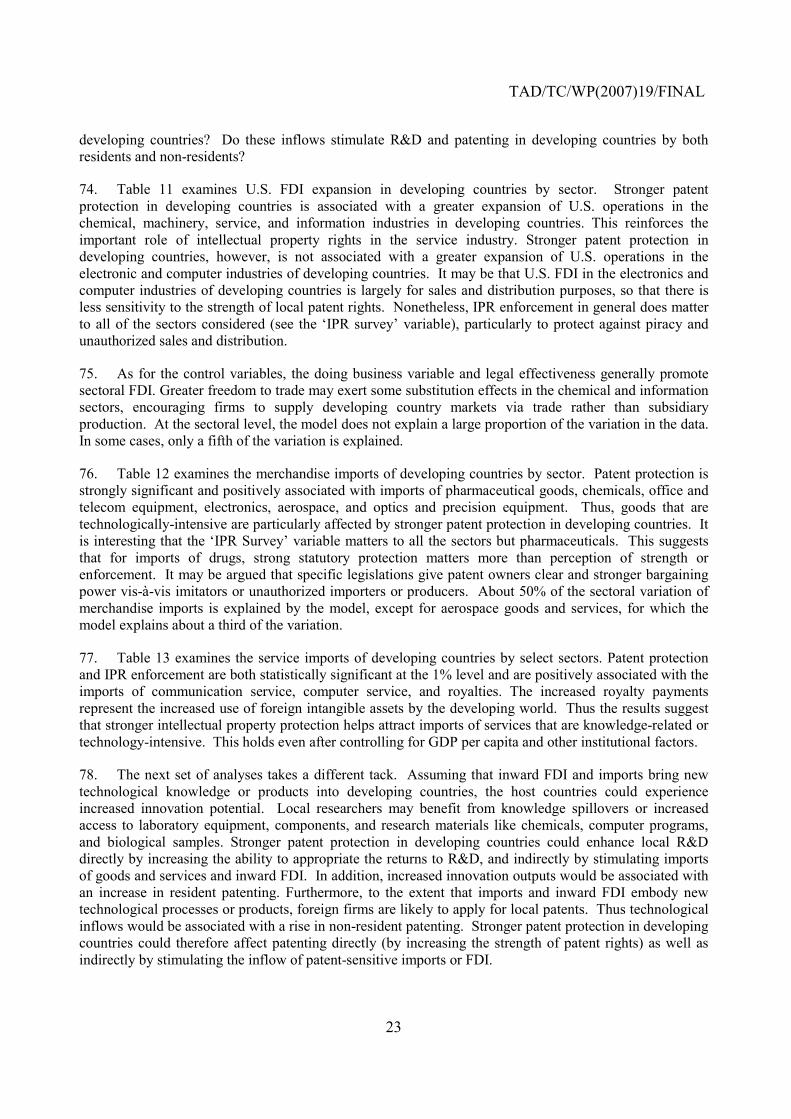
TAD/TC/WP(2007)19/FINAL
23
developing countries? Do these inflows stimulate R&D and patenting in developing countries by both residents and non-residents?
74. Table 11 examines U.S. FDI expansion in developing countries by sector. Stronger patent protection in developing countries is associated with a greater expansion of U.S. operations in the chemical, machinery, service, and information industries in developing countries. This reinforces the important role of intellectual property rights in the service industry. Stronger patent protection in developing countries, however, is not associated with a greater expansion of U.S. operations in the electronic and computer industries of developing countries. It may be that U.S. FDI in the electronics and computer industries of developing countries is largely for sales and distribution purposes, so that there is less sensitivity to the strength of local patent rights. Nonetheless, IPR enforcement in general does matter to all of the sectors considered (see the �IPR survey� variable), particularly to protect against piracy and unauthorized sales and distribution.
75. As for the control variables, the doing business variable and legal effectiveness generally promote sectoral FDI. Greater freedom to trade may exert some substitution effects in the chemical and information sectors, encouraging firms to supply developing country markets via trade rather than subsidiary production. At the sectoral level, the model does not explain a large proportion of the variation in the data. In some cases, only a fifth of the variation is explained.
76. Table 12 examines the merchandise imports of developing countries by sector. Patent protection is strongly significant and positively associated with imports of pharmaceutical goods, chemicals, office and telecom equipment, electronics, aerospace, and optics and precision equipment. Thus, goods that are technologically-intensive are particularly affected by stronger patent protection in developing countries. It is interesting that the �IPR Survey� variable matters to all the sectors but pharmaceuticals. This suggests that for imports of drugs, strong statutory protection matters more than perception of strength or enforcement. It may be argued that specific legislations give patent owners clear and stronger bargaining power vis-à-vis imitators or unauthorized importers or producers. About 50% of the sectoral variation of merchandise imports is explained by the model, except for aerospace goods and services, for which the model explains about a third of the variation.
77. Table 13 examines the service imports of developing countries by select sectors. Patent protection and IPR enforcement are both statistically significant at the 1% level and are positively associated with the imports of communication service, computer service, and royalties. The increased royalty payments represent the increased use of foreign intangible assets by the developing world. Thus the results suggest that stronger intellectual property protection helps attract imports of services that are knowledge-related or technology-intensive. This holds even after controlling for GDP per capita and other institutional factors.
78. The next set of analyses takes a different tack. Assuming that inward FDI and imports bring new technological knowledge or products into developing countries, the host countries could experience increased innovation potential. Local researchers may benefit from knowledge spillovers or increased access to laboratory equipment, components, and research materials like chemicals, computer programs, and biological samples. Stronger patent protection in developing countries could enhance local R&D directly by increasing the ability to appropriate the returns to R&D, and indirectly by stimulating imports of goods and services and inward FDI. In addition, increased innovation outputs would be associated with an increase in resident patenting. Furthermore, to the extent that imports and inward FDI embody new technological processes or products, foreign firms are likely to apply for local patents. Thus technological inflows would be associated with a rise in non-resident patenting. Stronger patent protection in developing countries could therefore affect patenting directly (by increasing the strength of patent rights) as well as indirectly by stimulating the inflow of patent-sensitive imports or FDI.
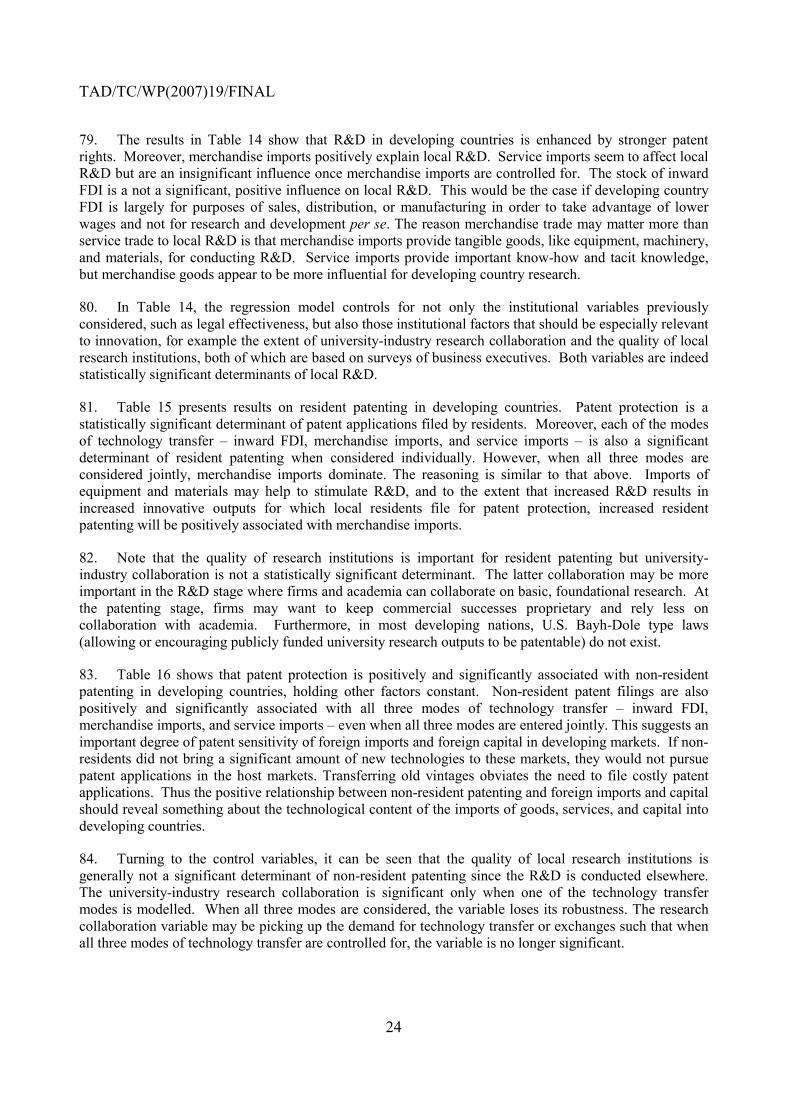
TAD/TC/WP(2007)19/FINAL
24
79. The results in Table 14 show that R&D in developing countries is enhanced by stronger patent rights. Moreover, merchandise imports positively explain local R&D. Service imports seem to affect local R&D but are an insignificant influence once merchandise imports are controlled for. The stock of inward FDI is a not a significant, positive influence on local R&D. This would be the case if developing country FDI is largely for purposes of sales, distribution, or manufacturing in order to take advantage of lower wages and not for research and development per se. The reason merchandise trade may matter more than service trade to local R&D is that merchandise imports provide tangible goods, like equipment, machinery, and materials, for conducting R&D. Service imports provide important know-how and tacit knowledge, but merchandise goods appear to be more influential for developing country research.
80. In Table 14, the regression model controls for not only the institutional variables previously considered, such as legal effectiveness, but also those institutional factors that should be especially relevant to innovation, for example the extent of university-industry research collaboration and the quality of local research institutions, both of which are based on surveys of business executives. Both variables are indeed statistically significant determinants of local R&D.
81. Table 15 presents results on resident patenting in developing countries. Patent protection is a statistically significant determinant of patent applications filed by residents. Moreover, each of the modes of technology transfer � inward FDI, merchandise imports, and service imports � is also a significant determinant of resident patenting when considered individually. However, when all three modes are considered jointly, merchandise imports dominate. The reasoning is similar to that above. Imports of equipment and materials may help to stimulate R&D, and to the extent that increased R&D results in increased innovative outputs for which local residents file for patent protection, increased resident patenting will be positively associated with merchandise imports.
82. Note that the quality of research institutions is important for resident patenting but university-industry collaboration is not a statistically significant determinant. The latter collaboration may be more important in the R&D stage where firms and academia can collaborate on basic, foundational research. At the patenting stage, firms may want to keep commercial successes proprietary and rely less on collaboration with academia. Furthermore, in most developing nations, U.S. Bayh-Dole type laws (allowing or encouraging publicly funded university research outputs to be patentable) do not exist.
83. Table 16 shows that patent protection is positively and significantly associated with non-resident patenting in developing countries, holding other factors constant. Non-resident patent filings are also positively and significantly associated with all three modes of technology transfer � inward FDI, merchandise imports, and service imports � even when all three modes are entered jointly. This suggests an important degree of patent sensitivity of foreign imports and foreign capital in developing markets. If non-residents did not bring a significant amount of new technologies to these markets, they would not pursue patent applications in the host markets. Transferring old vintages obviates the need to file costly patent applications. Thus the positive relationship between non-resident patenting and foreign imports and capital should reveal something about the technological content of the imports of goods, services, and capital into developing countries.
84. Turning to the control variables, it can be seen that the quality of local research institutions is generally not a significant determinant of non-resident patenting since the R&D is conducted elsewhere. The university-industry research collaboration is significant only when one of the technology transfer modes is modelled. When all three modes are considered, the variable loses its robustness. The research collaboration variable may be picking up the demand for technology transfer or exchanges such that when all three modes of technology transfer are controlled for, the variable is no longer significant.
TAD/TC/WP(2007)19/FINAL
25
5.3 Summing Up
85. The strength of patent protection is positively associated with inward FDI, merchandise imports, and service imports. This relationship holds for all groups of countries � developed, developing, or least developed � though quantitatively the association is strongest in developed countries. Copyrights and trademark rights matter less than patent rights. In addition, stronger levels of patent protection in developing countries are positively and significantly associated with the inflows of high-tech products, like pharmaceutical goods, chemicals, computer services, information, and office and telecom equipment. Those inflows of goods, services, and capital, in turn are positively associated with local R&D and patenting, as well as non-resident patenting. The latter association suggests that foreign imports and FDI contain patentable technological assets for which non-residents have a vested interested in seeking protection. Thus stronger patent rights in developing countries have the potential not only to attract technology transfer but also encourage foreigners to transfer new technologies.20 The evidence here is thus supportive of certain classes of theoretical analyses of North-South models that find mutual gains from IPR reform. For example, Naghavi (2007) develops a model in which stronger Southern IPRs can attract FDI into developing countries and stimulate local innovation.
6. Case Study of BRIC economies
86. An advantage of case studies is that some country details on IPR changes and technology transfer activities can be provided, whereas in the pooled regression analyses, individual countries are anonymous. This section reviews some available case study evidence. The issue is whether IPR reforms stimulate trade and FDI, and whether the increased trade and FDI are associated with substantive technological inflows. Case studies can complement the econometric evidence in shedding light on these issues; particularly in highlighting nuances that statistical averaging tends to miss.21
87. A recent report by Goldman Sachs projects that by 2050, the BRIC economies � Brazil, Russia, India, and China � will achieve a combined output that rivals that of the G6 (i.e. U.S., Germany, Japan, U.K., France, and Italy) as a whole.22 The basis for this projection is that the BRIC economies are building institutions that are supportive of economic growth. The projection is predicated on the BRIC economies sustaining their institutional development paths. Whatever the plausibility of this projection, it would be useful to review some of the current IP developments and technology transfer activities in the BRIC economies, given the attention these countries have received.
88. These four countries are among those that have undergone significant reforms in their intellectual property regimes in recent years.23 For decades, Brazil, China, and India provided little effective patent protection (e.g. for pharmaceutical product inventions, chemicals and foodstuffs). With the exception of Brazil, these countries were not parties to the Paris Convention or the Patent Cooperation Treaty. There were instances of compulsory licensing and pre-trial injunctions were not available. With the advent of the TRIPS Agreement, the BRIC economies all strengthened their patent regimes. Figure 2 shows the time path of the patent rights index for the BRIC economies. Before 1995, Brazil, China, and India scored below 1.50 with respect to this index (comparable data for Russia were not available for the period prior to
20 It is useful to remember that technologies are not patentable unless they are novel (i.e. new and not part of
prior art as is the case for older technologies). 21 For a comparison of the two approaches (case studies vs. econometrics) in presenting evidence of technology
transfer in developing countries, see chapter 2 of Hoekman and Javorcik (2006). 22 See Wilson and Purushothama (2003) in the References section. 23 This point is underscored in the OECD Trade and Agriculture Directorate country trade reviews of the BRIC
countries being carried out in the context of the 2007-2008 PWB.
TAD/TC/WP(2007)19/FINAL
26
1993). They were well below the median level of patent strength among group 2 (developing) countries, scoring even below several least developed economies.
89. By 2005, IPR reform in all four countries led to patent rights index scores above 3.50. As shown in Table 1, these scores are above the mean for developing countries and are even above the strength of patent rights in some developed countries. While the average developing country experienced a 37.5% change in the patent rights index over the period 1995-2005 (see Table 1), Brazil, China, and India experienced more than a doubling of their scores. The Russian Federation in 1993 initially started with a relatively high patent rights index score (above 3.0), which strengthened somewhat further with accession to additional major international intellectual property treaties (as did the other transition, former socialist countries, like Bulgaria, Czech Republic, Slovakia, Hungary, Poland, and Romania).
90. Despite significant patent law reforms and � in some cases � campaigns to raise public awareness24, the BRIC countries continue to have difficulties with intellectual property enforcement and administration. This is especially the case in the area of copyrights and piracy of films, books and musical recordings (see USTR 2006). Software piracy rates are especially high; for example, in China and Russia, pirated products are estimated by one source to account for more than 80% of installed software units, in India 72% and Brazil 64%.25 The problems may in part lie with the fact the BRIC economies are still developing. First, for the intellectual property user population, the temptation to copy is high because the income levels of developing country users are relatively low and intellectual property protection may tend to raise the cost of technological goods. Secondly, the legal authorities, unlike their counterparts in developed countries, have fewer resources for the administration and enforcement of IPRs and may not adequately prioritise IPR protection. Another factor often cited for higher rates of IPR infringement in the BRIC nations is weak effective punishment levels for IPR infringement. There are at least two possible reasons for this. First, the public concept of �intellectual� property is still not well-understood, according to a report of the U.S. General Accounting Office (2004). Consequently, the authorities may establish punishment levels that are relatively low because intellectual property infringement is not regarded as seriously as physical property infringement. Another reason for the weak effective punishment levels is that even if punishments are severe, the probability of being caught is low due to inadequate resources for enforcement, rendering effective levels of punishment low.
91. Nonetheless, the authorities in BRIC countries have exhibited a willingness to pursue stronger IPR policies, in part because of the recognition that infringement activities impose a cost in terms of forgone tax revenues and job creation, and that such activities may adversely affect inward technology transfer (as well as domestic innovation). Indeed, as the BRIC countries have strengthened their IPR systems during the past decade, they have experienced increases in real flows of imports and increases in the real stock of inward FDI. This has occurred despite the enforcement and administrative difficulties discussed above. The large markets, commercial potential and stronger IPR rules on the books may have helped to offset a portion of the drag caused by enforcement difficulties.
92. Accompanying the increases in imports and inward FDI into the BRIC economies were large increases in non-resident patent filings. As shown in Figure 3, India experienced a doubling of non-resident patent applications between 1995 and 2005 while Brazil experienced a tripling of non-resident patent applications. China experienced an 8-fold increase in non-resident patenting during the same period. Russia experienced only a small increase, perhaps because it is not yet a member of the WTO and perhaps
24 E.g., for discussion of the case of China see Greene, M., Dihel, N., Kowalski, P. and Lippoldt, D. (2006),
China�s Trade and Growth: Impact on Selected OECD Countries, Trade Policy Working Papers No. 44, OECD, Paris.
25 See Business Software Alliance (2006).
TAD/TC/WP(2007)19/FINAL
27
also because other issues beyond IPR enforcement are raising concerns (e.g. perceptions of legal uncertainty).
93. The increased exposure to foreign technology through trade and FDI in the BRIC countries appears to have played an important role in indigenous technological development. For example, a Thomson survey finds Russia to be among the leading inventive countries.26 Nearly 40% of Russian patents are in chemicals, 17% in food and agriculture, 15% in pharmaceuticals and medicines, and 10% in telecom, information technology, and electronics. A Thomson survey on China finds that the inflows of research knowledge and capital have made China not just a manufacturing center but a locus of R&D activities in high-technology sectors such as electronics, telecom, medicine, pharmaceuticals, and aerospace.27 The survey also documents large increases in scientific publications authored by Chinese residents during the past decade. China, for example, accounts for 10% of mathematics, physics, and chemistry publications in 2005. There has also been an increase in inventions by Chinese residents. The five leading fields of resident inventions are: natural products and polymers, digital computers, telecom and data transmission systems, fermentation, and foodstuffs.
94. Guinet et al. (2007) conduct a review of China�s innovation system and also find China to be a major player in international science and technology. However, Guinet et al. (2007) observe a lot of unexploited potential. As yet, most of China�s R&D is in experimental development (rather than research) and its R&D in high-tech sectors is relatively low compared to that in OECD economies. A condition for further exploitation of its potential is that China would need to strengthen its intellectual property enforcement activities. Infringement is very widespread and acts as impediment to innovation by foreign firms operating locally. Another area for growth is privately funded and performed R&D. Currently, R&D in China is concentrated in public research institutes, foreign firms, and state-owned enterprises. R&D by business enterprises is very limited.
95. As for Brazil, Marques (2004) provides a case study of the Brazilian aircraft industry, illustrating the role of foreign technology transfer � through FDI and international joint ventures � in developing this sector. Brazil is the only developing country in which a civilian aircraft manufacturing industry exists. Brazil�s specialty is in aircraft parts, like the wings and undercarriage. Brazil does not make the jet engines; instead the Brazilian subsidiaries of Rolls-Royce and General Electric manufacture and supply the engines. Kesidou (2004) presents a case study of the Brazilian automobile industry. Brazil is the host country to a number of global automobile manufacturers. Over time, inward FDI, technology spillovers, and local technology policies, helped to develop an indigenous capacity for automobile manufacturing. Brazil stands to be the 5th largest automobile producer in the world.
96. Lastly turning to India, Friedman (2005) and Vijayabaskar and Krishnaswamy (2004) document the emergence of the software industry in India, clustered for example in the city of Bangalore. Again, a number of variables and conditions worked to develop this sector, but here too foreign trade and inward FDI have helped to transfer knowledge and build local capacity. Initially, leading multinational firms such as Hewlett Packard, Texas Instruments, and Motorola set up subsidiaries in India for purposes of outsourcing tasks from developed countries. Over time, those tasks became more complex from serving as call centers to writing software modules. Moreover, indigenous firms have emerged as global players, such as Infosys Technologies, IC.Net, Mastek, and Tata Consultancy Services.
97. In conclusion, the case studies and surveys reinforce the point drawn in the regression analysis that the technology content of inward FDI and foreign trade has been substantive, especially in the BRIC countries. In these countries, technology transfer via trade and FDI has been an important input into 26 See http://scientific.thomson.com/media/newsletterpdfs/2005-11/ft-innovation_indicator.pdf 27 See http://scientific.thomson.com/news/newsletter/2006-05/8322540 .

TAD/TC/WP(2007)19/FINAL
28
developing local technological capabilities, among other factors. Indeed a recent survey by INSEAD ranks India 23rd out of 108 countries in terms of innovation potential, China 29th, Brazil 40th, and Russia 54th, based on an assessment of local human capital and technology absorptive capacities.28 Independently, the World Economic Forum ranks India 28th out of 125 countries, Brazil 29th, China 43rd, and Russia 49th. To the extent that strong IPRs promote inward technology transfer and insofar as the transfers influence the innovation capabilities of the host countries, intellectual property rights matter to developing innovation potential.
7. Conclusion
98. Since the TRIPS Agreement came into force in 1995, developing and least developed countries have undertaken significant reforms in their intellectual property systems. The indexes of IPRs show that between 1995 and 2005, developing and least developed countries, as a group, experienced a greater percentage increase in IPR strength than did the developed world. During the same period, compared to developed countries, the developing and least developed countries experienced large growths in inflows of inward FDI, merchandise and service imports, patent applications by foreigners, as well as increases in their R&D to GDP ratios and patenting by local residents.
99. The empirical analysis examined the extent to which these developments can be attributed to intellectual property reforms in the developing world, holding other factors constant. Specifically the study evaluated two hypotheses regarding the experience of the developing world with strengthened IPRs:
H1) IPRs stimulate technology transfer, particularly the transfer of technology-intensive goods, services and capital.
H2) IPRs can directly stimulate local innovation as well as indirectly by stimulating the transfer of technologies that foster local innovation.
100. The main empirical results support a positive assessment of both hypotheses. These results are as follows:
• The index for patent rights tends to be positively associated with inward FDI, merchandise imports and service imports, holding other factors constant. This relationship holds for all groups of countries � developed, developing and least developed � though quantitatively the association is strongest in developed countries.
• The indexes for copyrights and trademark rights are less strongly associated with technology transfer than is the patent rights index.
• Focusing on technology transfer to developing countries, the study finds that stronger levels of patent protection are positively and significantly associated with the inflows of high-tech products, like pharmaceutical goods, chemicals, aerospace, computer services, information, and office and telecom equipment.
• Developing country patent applications (by both residents and non-residents) and expenditure on R&D (as a percentage of GDP) tend to have a positive and significant relationship to the strength of patent rights.
• In certain specifications of the model with respect to developing country resident patent applications, the control variables for merchandise imports, services imports and inward FDI are also significant and positive. Similarly, merchandise imports also tend to be significantly
28 See http://www.worldbusinesslive.com/article/625443/the-worlds-top-innovators-brics-potential .

TAD/TC/WP(2007)19/FINAL
29
and positively related to R&D expenditure. (When FDI and service imports are interacted with merchandise imports in these specifications of the model, merchandise imports tend to dominate, however.) The intuition is that the inflows of goods, services, and capital are a source of knowledge spillovers as well as a source of inputs with which to conduct innovation (such as laboratory equipment).
• Imports of goods and services and FDI inflows are also significantly and positively associated with non-resident patenting in developing countries. This association suggests that foreign imports and FDI contain patentable technological assets for which non-residents have a vested interested in seeking protection. Thus, stronger patent rights in developing countries appear to have the potential not only to stimulate international technology transfer but also to provide incentives for foreigners to transfer new technologies.
101. Case studies and surveys reinforce the point drawn in the regression analysis that the technology content of inward FDI and foreign trade has been substantive, particularly in the BRIC countries, and that this has taken place in association with significant IPR reforms. In the BRIC countries, technology transfer via trade and FDI has been one important input (among other factors) into developing indigenous technological capabilities. They are moving into the group of leading world innovators in terms of patenting and production of high-tech goods like software, electronics, transportation, and chemicals. At the same time, there are still problems with effective enforcement and administration of IPRs in these countries and there is room for additional IPR reform to contribute toward their further economic development.
102. The case studies are a reminder that IPRs alone do not determine technological success or even increased access to technology. Indeed, regression analysis is conditional on other factors being held constant. It is important to note that IPRs do not operate in a vacuum.29 There are complementary factors that help facilitate technology transfer, such as the quality of infrastructure, government policies and regulations, and market structure, among others. There are also complementary factors that specifically affect innovation and technology diffusion, such as the quality of knowledge institutions (e.g. academia, public research institutes, or industrial research centres like science parks), the financial system (e.g. access to equity, credit and venture capital), availability of trained human capital, and networks for research collaboration or interaction (e.g. university-industry research collaboration or international collaboration), among others.
103. In terms of a future research agenda, it would useful to explore the requisite complements to IPR reform, as part of an integrated policy for development of domestic technological capacity. What are the underlying technical, institutional, and policy determinants of innovative and absorptive capacities? What role does the multilateral trading system play in shaping these determinants? What feedback mechanisms exist with respect to IPR strengthening? In particular, what influence do IPRs have, if any, on opportunities and incentives for agents to acquire greater capabilities or for firms to aggressively seek and absorb new technologies including via international trade and investment.
29 This is also a theme stressed in Park and Lippoldt (2003).
TAD/TC/WP(2007)19/FINAL
30
REFERENCES
Acharya, Ram and Keller, Wolfgang (2007), �Technology Transfer Through Imports,� National Bureau of Economic Research Working Paper No. 13086, Cambridge, MA.
Bascavusoglu, Elif, and Zuniga, M.P. (2002), �Foreign Patent Rights, Technology and Disembodied Knowledge Transfer Cross Borders: An Empirical Application,� Université de Paris I Panthéon Sorbonne, TEAM, Théorie Macroéconomique et Microéconomique Appliquées, CNRS, available at: http://www.econ.kuleuven.ac.be/smye/abstracts/p502.pdf.
Blomström, Magnus and Kokko Ari (1998), �Multinational Corporation and Spillovers,� Journal of Economic Surveys, Vol. 12, No. 3, pp. 247-277.
Blonigen, Bruce (2001), �In Search of Substitution Effects between Foreign Production and Exports,� Journal of International Economics, Vol. 53, No. 1, pp. 81-104.
Boldrin, Michele and Levine, David K. (2007), Against Intellectual Monopoly, posted on UCLA Department of Economics website at: http://www.dklevine.com/general/intellectual/againstnew.htm.
Branstetter, Lee G., Fisman, Raymond, Foley, C. Fritz, and Saggi, Kamal (2005), �Do Stronger Intellectual
Property Rights Increase International Technology Transfer? Empirical Evidence from U.S. Firm-Level Panel Data,� Columbia University Working Paper.
Branstetter, Lee G., Fisman, Raymond, and Foley, C. Fritz (2006), �Do Stronger Intellectual Property Rights Increase International Technology Transfer? Empirical Evidence from U.S. Firm-Level Panel Data�, Quarterly Journal of Economics, Vol. 121, No. 1, pp. 321-349.
Business Software Alliance (2006) Third Annual BSA and IDC Global Software Piracy Study, Washington, D.C.
Co, Catherine (2004), �Do Patent Regimes Matter?� Review of International Economics, Vol. 12, No. 3, pp. 359-373.
Coe, David and Helpman, Elhanan (1995), �International R&D Spillovers,� European Economic Review, Vol. 39, No. 5, pp. 859-887.
Contractor, Farok (1981), International Technology Licensing, D.C. Heath and Company, Massachusetts.
Correa, Carlos Maria (2005), �How Intellectual Property Rights Can Obstruct Progress�, SciDev.Net, 4 April.
Eaton, Jonathan and Kortum, Sam (2002), �Technology, Geography, and Trade,� Econometrica, Vol. 70, No. 5, pp. 1741-1779.
Finger, Michael and Schuler, Philip (1999), �Implementation of Uruguay Round Commitments: The Development Challenge,� World Bank Policy Research Working Paper No. 2215.
TAD/TC/WP(2007)19/FINAL
31
Fink, Carsten and Primo Braga, Carlos A. (1999), �How Stronger Protection of Intellectual Property Rights Affects International Trade Flows,� World Bank Working Paper No. 2051.
Fosfuri, Andrea, Motta, Massimo, and Ronde, Thomas (2001), �Foreign Direct Investment and Spillovers through Workers� Mobility,� Journal of International Economics, Vol. 53, No. 1, pp. 205-222.
Friedman, Thomas (2006), The World is Flat: A Brief History of the 21st Century (Updated and Revised), Farrar, Straus, and Giroux, New York.
Ginarte, Juan C. and Park, Walter G. (1997) �Determinants of Patent Rights: A Cross-National Study,� Research Policy, Vol. 26, pp. 283-301.
Greene, William (2003), Econometric Analysis, 5th edition, Prentice-Hall, New Jersey.
Grossman, Gene and Lai, Edwin (2004) �International Protection of Intellectual Property,�American Economic Review, Vol. 95, pp.1635-1653.
Guinet, Jean, Zhang, Gang, and Hutschenreiter, Gernot (2007), �Review of China�s Innovation System and Policy,� OECD DSTI/STP 2007-3.
Hoekman, Bernard and Javorcik, Beata (2006) (eds.) Global Integration and Technology Transfer, World Bank, Washington, D.C.
Javorcik, Beata (2002), �The Composition of Foreign Direct Investment and Protection of Intellectual Property Rights: Evidence from Transition Economies,� European Economic Review, Vol. 48, pp. 39-62.
Keller, Wolfgang (2004), �International Technology Diffusion,� Journal of Economic Literature, Vol. 42, No. 3, pp. 752-782.
Kesidou, Effie (2004), �The Political Economy of Technology Policy: The Automotive Sector in Brazil (1950-2000),� in Sunil Mani and Henny Romijn (eds.) Innovation, Learning, and Technological Dynamism of Developing Countries, United Nations Press, New York, pp. 107-134.
Lee, Jeong-Yeon and Mansfield, Edwin (1996), �Intellectual Property Protection and U.S. Foreign Direct Investment,� Review of Economics and Statistics, Vol. 78, pp. 181-186.
Lessig, Lawrence (2002), �The Architecture of Innovation�, Duke Law Journal, No. 51.
Lessig, Lawrence (1999), �The Problem with Patents�, The Industry Standard, 23 April.
Liu, Wen-Hsein and Lin, Ya-Chi (2005), �Foreign Patent Rights and High-Tech Exports: Evidence from Taiwan,� Applied Economics, Vol. 37, pp. 1543-1555.
Mansfield, Edwin (1994), �Intellectual Property Protection, Foreign Direct Investment, and Technology Transfer�, International Finance Corporation Discussion Paper No. 19, World Bank, Washington, DC.
Markusen, James (2002), Multinational Firms and the Theory of International Trade, MIT Press, Cambridge.
TAD/TC/WP(2007)19/FINAL
32
Maskus, Keith (2004), �Encouraging International Technology Transfer,� United Nations Conference on Trade and Development, International Centre for Trade and Sustainable Development, Issue Paper No.7.
Maskus, Keith and M. Penubarti (1995), �How Trade-Related Are Intellectual Property Rights?� Journal of International Economics, Vol. 39, pp 227-48.
Marques, Rosane A. (2004), �Evolution of the Civil Aircraft Manufacturing System of Innovation: A Case Study in Brazil,� in Sunil Mani and Henny Romijn (eds.) Innovation, Learning, and Technological Dynamism of Developing Countries, United Nations Press, New York, pp. 77-106.
Mayer, Thierry and Etienne Pfister (2001), �Do Stronger Patent Rights Attract Foreign Direct Investment? Evidence from French Multinationals� Location� Région et Dévelopment Vol. 13, pp. 99-122.
Miroudot, Sébastien (2005), �The Linkages between Open Services Markets and Technology Transfer,� OECD Trade Policy Working Paper No. 29.
Naghavi, Alireza (2007), �Strategic Intellectual Property Rights Policy and North-South Technology Transfer,� Weltwirtschaftliches Archiv Vol. 143, pp. 55 � 78.
Nunnenkamp, Peter and Julius Spatz (2004), �Intellectual Property Rights and Foreign Direct Investment: A Disaggregated Analysis,� Weltwirtschaftliches Archiv Vol. 140, No. 3, pp. 393-414.
OECD (2005), Measuring Globalisation: OECD Handbook on Economic Globalisation Indicators, Organisation for Economic Co-operation and Development, Paris.
Park, Walter G. (2005), �Do Intellectual Property Rights Stimulate R&D and Productivity Growth? Evidence from Cross-national and Manufacturing Industries Data,� in Jonathan Putnam (ed.), Intellectual Property and Innovation in the Knowledge-Based Economy, Industry Canada, Ottawa, pp. 9:1 � 9:51.
Park, Walter G. and Lippoldt, Douglas (2003), �The Impact of Trade-Related Intellectual Property Rights on Trade and Foreign Direct Investment in Developing Countries,� OECD Papers: Special Issue on Trade Policy, Vol. 4, No. 11, Issue 294.
Park, Walter G. and Lippoldt, Douglas (2005), �International Licensing and the Strengthening of Intellectual Property Rights in Developing Countries during the 1990s�, OECD Economic Studies, 40: pp. 7-48.
Park, Walter G. and Wagh, Smita (2002), �Index of Patent Rights, 2000 Update,� Chapter 2, in James Gwartney and Robert Lawson (eds.) Economic Freedom of the World Annual Report 2002, Fraser Institute, Vancouver, B.C., pp. 33-42.
Primo Braga, Carlos A. and Fink, Carsten (1998), �The Relationship between Intellectual Property Rights and Foreign Direct Investment,� Duke Journal of Comparative and International Law, Vol. 9, pp. 163-188.
Reynolds, Taylor W. (2003), Quantifying the Evolution of Copyright and Trademark Law, American University, doctoral dissertation.
Smith, Pamela (1999), �Are Weak Patent Rights a Barrier to U.S. Exports?�, Journal of International Economics, Vol. 48, pp. 151-177.
TAD/TC/WP(2007)19/FINAL
33
Taylor, M. Scott (1994), �Trips, Trade, and Growth,� International Economic Review, Vol. 35, No. 2, pp. 361-381.
United Nations Conference on Trade and Development (UNCTAD), Least Developed Countries Report 2007: Knowledge, Technological Learning and Innovation for Development, Geneva, Switzerland.
United States Government Accounting Office (GAO), Intellectual Property: U.S. Efforts Have Contributed to Strengthened Laws Overseas, but Challenges Remain, GAO-04-912, U.S. Government Printing Office, Washington, D.C.
United States Trade Representative (USTR), National Trade Estimate: Report on Foreign Trade Barriers 2006. Washington, D.C.: Office of the USTR.
Vijayabaskar, M and Krishnaswamy, Girija (2004), �Understanding Growth Dynamism and its Constraints in High Technology Clusters in Developing Countries: A Study of Bangalore, Southern India,� in Sunil Mani and Henny Romijn (eds.) Innovation, Learning, and Technological Dynamism of Developing Countries, United Nations Press, New York, pp. 178-201.
Wilson, Dominic and Purushothaman, Roopa (2003), �Dreaming with BRICs: The Path to 2050, Goldman Sachs Group, Global Economics Paper No. 99.
World Economic Forum, Global Competitiveness Report 2000, Oxford University Press, NY.
World Economic Forum, Global Competitiveness Report 2004-2005, Palgrave Macmillan, NY.
World Economic Forum, Global Competitiveness Report 2005-2006, Palgrave Macmillan, NY.
World Economic Forum, Global Competitiveness Report 2006-2007, Palgrave Macmillan, NY.
Xu, Bin and Wang, Jianmao (1999), �Capital Goods Trade and R&D Spillovers in the OECD,� Canadian Journal of Economics, Vol. 32, No. 5, pp. 1258-1274.
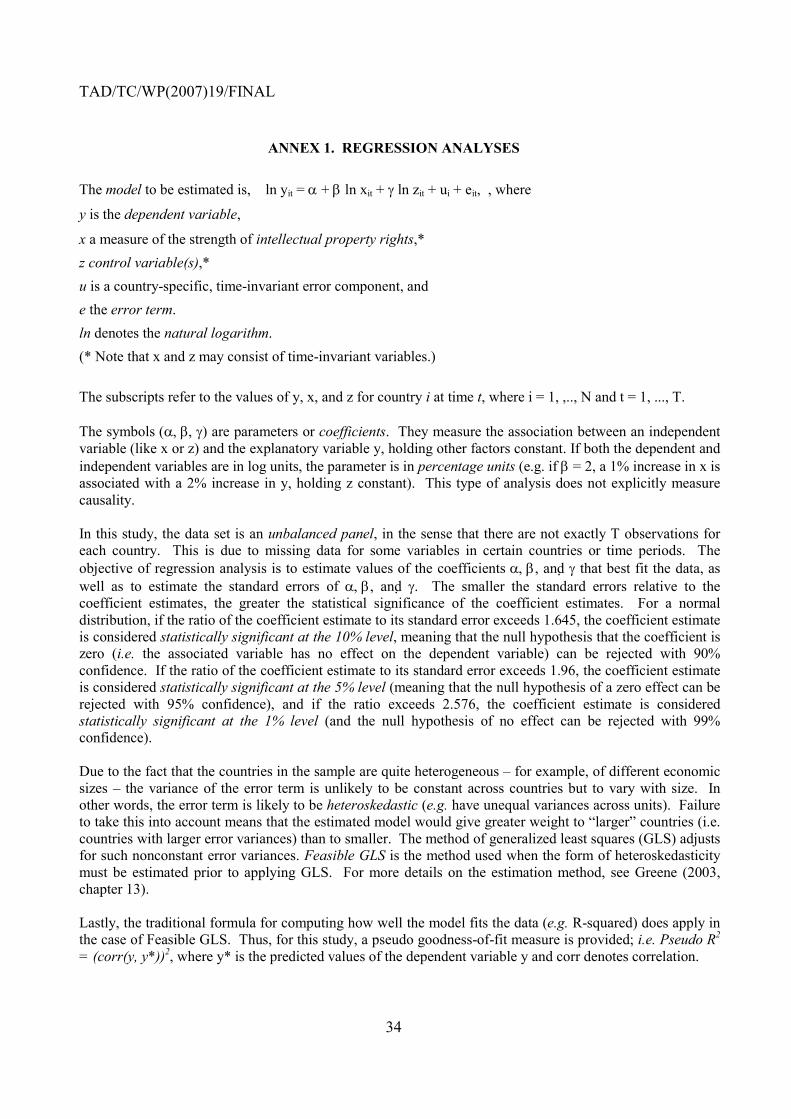
TAD/TC/WP(2007)19/FINAL
34
ANNEX 1. REGRESSION ANALYSES
The model to be estimated is, ln yit = α + β ln xit + γ ln zit + ui + eit, , where
y is the dependent variable,
x a measure of the strength of intellectual property rights,* z control variable(s),* u is a country-specific, time-invariant error component, and e the error term. ln denotes the natural logarithm. (* Note that x and z may consist of time-invariant variables.) The subscripts refer to the values of y, x, and z for country i at time t, where i = 1, ,.., N and t = 1, ..., T. The symbols (α, β, γ) are parameters or coefficients. They measure the association between an independent variable (like x or z) and the explanatory variable y, holding other factors constant. If both the dependent and independent variables are in log units, the parameter is in percentage units (e.g. if β = 2, a 1% increase in x is associated with a 2% increase in y, holding z constant). This type of analysis does not explicitly measure causality. In this study, the data set is an unbalanced panel, in the sense that there are not exactly T observations for each country. This is due to missing data for some variables in certain countries or time periods. The objective of regression analysis is to estimate values of the coefficients α, β, and γ that best fit the data, as well as to estimate the standard errors of α, β, and γ. The smaller the standard errors relative to the coefficient estimates, the greater the statistical significance of the coefficient estimates. For a normal distribution, if the ratio of the coefficient estimate to its standard error exceeds 1.645, the coefficient estimate is considered statistically significant at the 10% level, meaning that the null hypothesis that the coefficient is zero (i.e. the associated variable has no effect on the dependent variable) can be rejected with 90% confidence. If the ratio of the coefficient estimate to its standard error exceeds 1.96, the coefficient estimate is considered statistically significant at the 5% level (meaning that the null hypothesis of a zero effect can be rejected with 95% confidence), and if the ratio exceeds 2.576, the coefficient estimate is considered statistically significant at the 1% level (and the null hypothesis of no effect can be rejected with 99% confidence). Due to the fact that the countries in the sample are quite heterogeneous � for example, of different economic sizes � the variance of the error term is unlikely to be constant across countries but to vary with size. In other words, the error term is likely to be heteroskedastic (e.g. have unequal variances across units). Failure to take this into account means that the estimated model would give greater weight to �larger� countries (i.e. countries with larger error variances) than to smaller. The method of generalized least squares (GLS) adjusts for such nonconstant error variances. Feasible GLS is the method used when the form of heteroskedasticity must be estimated prior to applying GLS. For more details on the estimation method, see Greene (2003, chapter 13). Lastly, the traditional formula for computing how well the model fits the data (e.g. R-squared) does apply in the case of Feasible GLS. Thus, for this study, a pseudo goodness-of-fit measure is provided; i.e. Pseudo R2 = (corr(y, y*))2, where y* is the predicted values of the dependent variable y and corr denotes correlation.
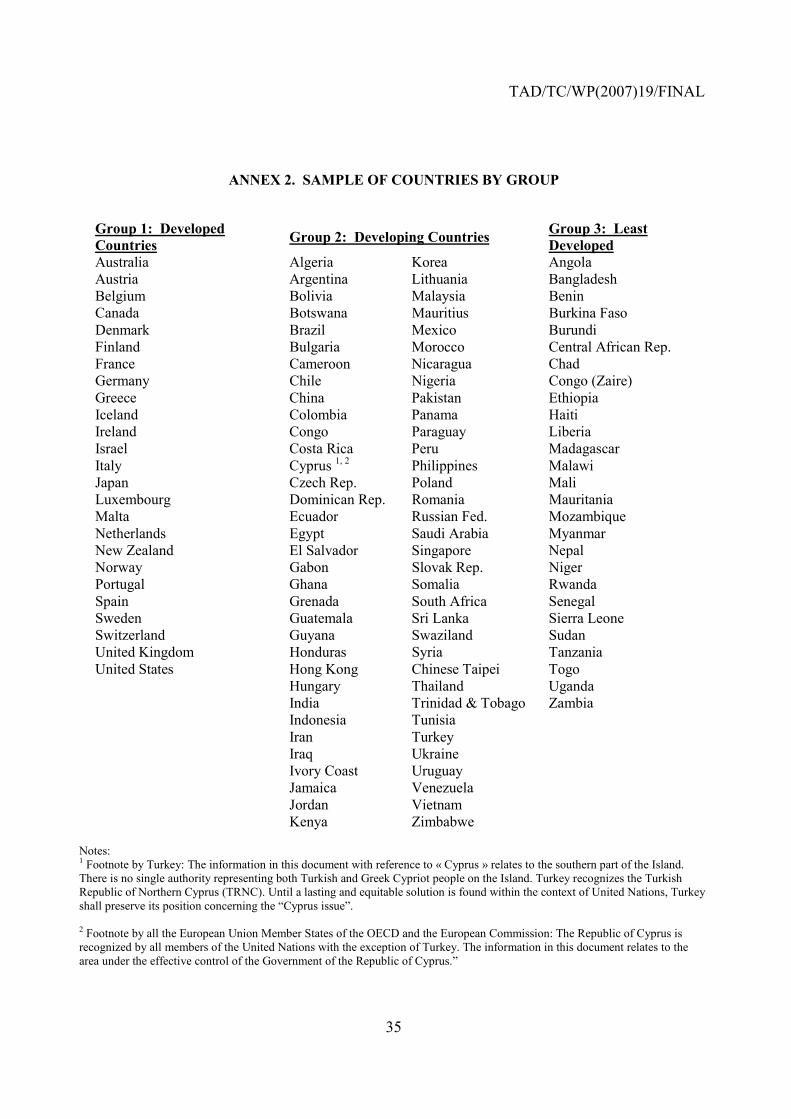
TAD/TC/WP(2007)19/FINAL
35
ANNEX 2. SAMPLE OF COUNTRIES BY GROUP
Group 1: Developed Countries Group 2: Developing Countries Group 3: Least
Developed Australia Algeria Korea Angola Austria Argentina Lithuania Bangladesh Belgium Bolivia Malaysia Benin Canada Botswana Mauritius Burkina Faso Denmark Brazil Mexico Burundi Finland Bulgaria Morocco Central African Rep. France Cameroon Nicaragua Chad Germany Chile Nigeria Congo (Zaire) Greece China Pakistan Ethiopia Iceland Colombia Panama Haiti Ireland Congo Paraguay Liberia Israel Costa Rica Peru Madagascar Italy Cyprus 1, 2 Philippines Malawi Japan Czech Rep. Poland Mali Luxembourg Dominican Rep. Romania Mauritania Malta Ecuador Russian Fed. Mozambique Netherlands Egypt Saudi Arabia Myanmar New Zealand El Salvador Singapore Nepal Norway Gabon Slovak Rep. Niger Portugal Ghana Somalia Rwanda Spain Grenada South Africa Senegal Sweden Guatemala Sri Lanka Sierra Leone Switzerland Guyana Swaziland Sudan United Kingdom Honduras Syria Tanzania United States Hong Kong Chinese Taipei Togo Hungary Thailand Uganda India Trinidad & Tobago Zambia Indonesia Tunisia Iran Turkey Iraq Ukraine Ivory Coast Uruguay Jamaica Venezuela Jordan Vietnam Kenya Zimbabwe
Notes: 1 Footnote by Turkey: The information in this document with reference to « Cyprus » relates to the southern part of the Island. There is no single authority representing both Turkish and Greek Cypriot people on the Island. Turkey recognizes the Turkish Republic of Northern Cyprus (TRNC). Until a lasting and equitable solution is found within the context of United Nations, Turkey shall preserve its position concerning the �Cyprus issue�. 2 Footnote by all the European Union Member States of the OECD and the European Commission: The Republic of Cyprus is recognized by all members of the United Nations with the exception of Turkey. The information in this document relates to the area under the effective control of the Government of the Republic of Cyprus.�
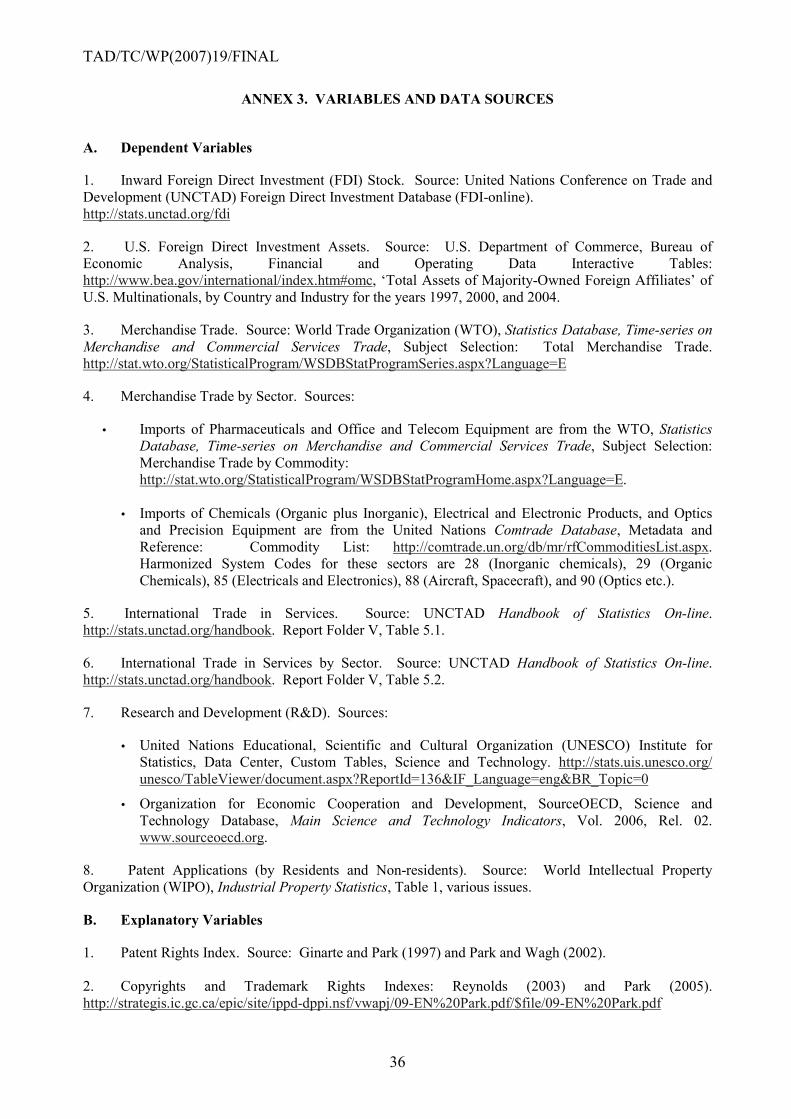
TAD/TC/WP(2007)19/FINAL
36
ANNEX 3. VARIABLES AND DATA SOURCES
A. Dependent Variables
1. Inward Foreign Direct Investment (FDI) Stock. Source: United Nations Conference on Trade and Development (UNCTAD) Foreign Direct Investment Database (FDI-online). http://stats.unctad.org/fdi
2. U.S. Foreign Direct Investment Assets. Source: U.S. Department of Commerce, Bureau of Economic Analysis, Financial and Operating Data Interactive Tables: http://www.bea.gov/international/index.htm#omc, �Total Assets of Majority-Owned Foreign Affiliates� of U.S. Multinationals, by Country and Industry for the years 1997, 2000, and 2004.
3. Merchandise Trade. Source: World Trade Organization (WTO), Statistics Database, Time-series on Merchandise and Commercial Services Trade, Subject Selection: Total Merchandise Trade. http://stat.wto.org/StatisticalProgram/WSDBStatProgramSeries.aspx?Language=E
4. Merchandise Trade by Sector. Sources:
! Imports of Pharmaceuticals and Office and Telecom Equipment are from the WTO, Statistics Database, Time-series on Merchandise and Commercial Services Trade, Subject Selection: Merchandise Trade by Commodity:
http://stat.wto.org/StatisticalProgram/WSDBStatProgramHome.aspx?Language=E.
! Imports of Chemicals (Organic plus Inorganic), Electrical and Electronic Products, and Optics and Precision Equipment are from the United Nations Comtrade Database, Metadata and Reference: Commodity List: http://comtrade.un.org/db/mr/rfCommoditiesList.aspx. Harmonized System Codes for these sectors are 28 (Inorganic chemicals), 29 (Organic Chemicals), 85 (Electricals and Electronics), 88 (Aircraft, Spacecraft), and 90 (Optics etc.).
5. International Trade in Services. Source: UNCTAD Handbook of Statistics On-line. http://stats.unctad.org/handbook. Report Folder V, Table 5.1.
6. International Trade in Services by Sector. Source: UNCTAD Handbook of Statistics On-line. http://stats.unctad.org/handbook. Report Folder V, Table 5.2.
7. Research and Development (R&D). Sources:
! United Nations Educational, Scientific and Cultural Organization (UNESCO) Institute for Statistics, Data Center, Custom Tables, Science and Technology. http://stats.uis.unesco.org/ unesco/TableViewer/document.aspx?ReportId=136&IF_Language=eng&BR_Topic=0
! Organization for Economic Cooperation and Development, SourceOECD, Science and Technology Database, Main Science and Technology Indicators, Vol. 2006, Rel. 02. www.sourceoecd.org.
8. Patent Applications (by Residents and Non-residents). Source: World Intellectual Property Organization (WIPO), Industrial Property Statistics, Table 1, various issues.
B. Explanatory Variables
1. Patent Rights Index. Source: Ginarte and Park (1997) and Park and Wagh (2002). 2. Copyrights and Trademark Rights Indexes: Reynolds (2003) and Park (2005). http://strategis.ic.gc.ca/epic/site/ippd-dppi.nsf/vwapj/09-EN%20Park.pdf/$file/09-EN%20Park.pdf

TAD/TC/WP(2007)19/FINAL
37
3. IPR Survey. Source: World Economic Forum, Global Competitiveness Reports 2000 (Table 7.09), 2004-5 (Table 6.04), 2005-6 (Table 6.04), and 2006-7 (Table 9.07), Oxford University Press. This variable measures Business Executive opinions on the stringency of intellectual property protection (1 = is weak or nonexistent, ... , 7 = is equal to the world�s most stringent). 4. Physical Property Rights. Source: World Economic Forum, Global Competitiveness Reports 2000 (Table 3.11), 2004-5 (Table 6.03), 2005-6 (Table 6.03), and 2006-7 (Table 1.01), Oxford University Press. This variable measures Business Executive opinions on how well private property is protected, including financial assets (1 = are poorly defined and not protected by law, ... , 7 = are clearly defined and well-protected by law). 5. Innovative Capacity. Source: World Economic Forum, Global Competitiveness Reports 2000 (Table 7.01), 2004-5 (Table 9.04), 2005-6 (Table 8.03), and 2006-7 (Table 9.08), Oxford University Press. This variable measures Business Executive opinions on companies� capacity for innovation (1 = obtains technology by imitation of foreign technology or licensing, ... , 7 = obtains technology by conducting formal research and pioneering their own new products and processes). 6. Quality of Research Institutions. Source: World Economic Forum, Global Competitiveness Reports 2000 (Table 7.04), 2004-5 (Table 3.05), 2005-6 (Table 3.05), and 2006-7 (Table 9.01), Oxford University Press. This variable measures Business Executive opinions on the quality of scientific research institutions (1 = nonexistent, ... , 7 = the best in their fields internationally). 7. University-Industry Research Collaboration. Source: World Economic Forum, Global Competitiveness Reports 2000 (Table 7.06), 2004-5 (Table 3.08), 2005-6 (Table 3.07), and 2006-7 (Table 9.03), Oxford University Press. This variable measures Business Executive opinions on the extent to which businesses collaborate with local universities to engage in R&D (1 = minimal or nonexistent, ... , 7 = intensive and ongoing). 8. Index of Legal Effectiveness. This variable is a composite score of judicial independence, impartial courts, security of property rights (tangible and intellectual), and integrity of the legal system. Source: Economic Freedom Network (EFN), 2006 Dataset: http://www.freetheworld.com/release.html. 9. Index of Freedom to Trade Internationally. This variable is a composite score of minimal taxes or interference with trade (including tariffs and non-tariff barriers to trade), minimal capital controls and foreign ownership restrictions. Source: Economic Freedom Network (EFN), 2006 Dataset: http://www.freetheworld.com/release.html. 10. Real GDP per capita (in real 2000 U.S. dollars). Source: World Bank, World Development Indicators (WDI) 2007, CD-Rom. 11. Doing Business Rank. This variable measures the ease of doing business (for example, the number of procedures required in starting a business, dealing with licenses, employing workers, registering property, getting credit, protecting investors, enforcing contracts, paying taxes, trading across borders, and closing down a business). Countries are ranked in ascending order (1=easiest place to do business, 2=next easiest, etc.) Source: World Bank Group http://www.doingbusiness.org/CustomQuery. 12. Governance. Source: World Bankhttp://info.worldbank.org/governance/wgi2007. There are six dimensions of governance: Voice and Accountability (VA), Political Stability (PS), Government Effectiveness (GE), Regulatory Quality (RQ), Rule of Law (RL), and Control of Corruption (CC). For purposes of this study, the six measures are averaged: Governance Index = (VA + PS + GE + RQ + RL + CC)/6 13. U.S. Price Index (GDP Deflator). Source: Economic Report of the President, http://www.gpoaccess.gov/eop/download.html.
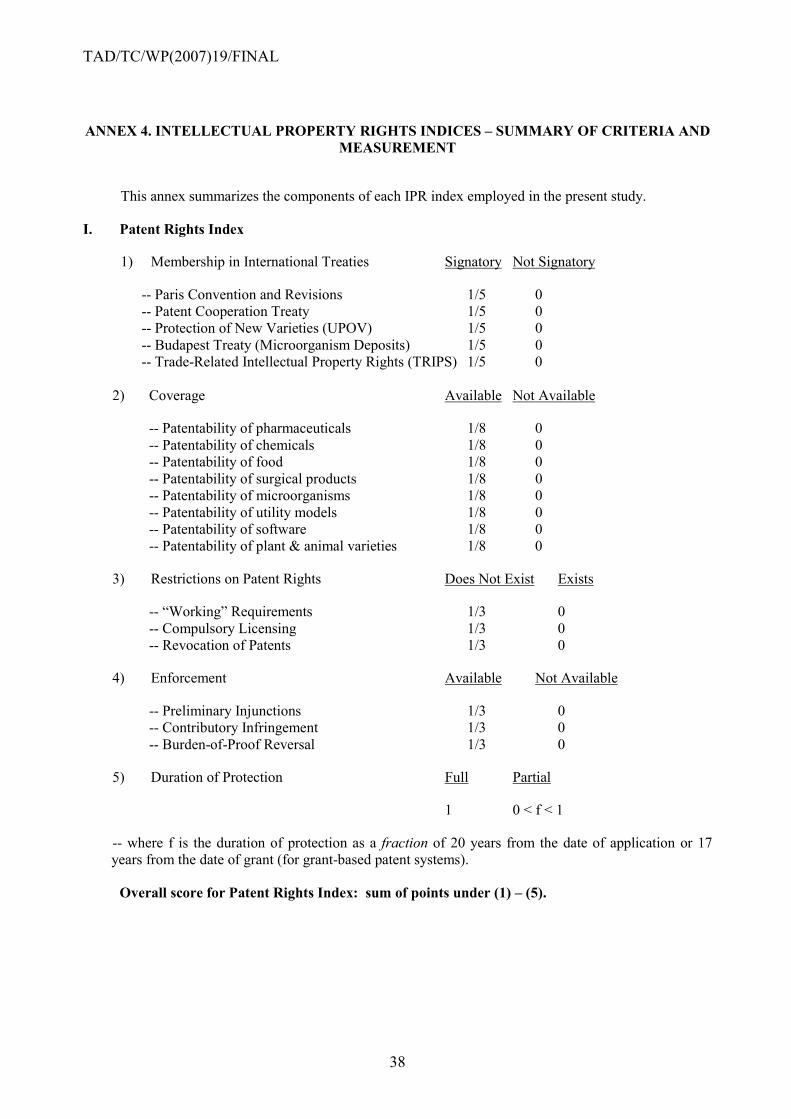
TAD/TC/WP(2007)19/FINAL
38
ANNEX 4. INTELLECTUAL PROPERTY RIGHTS INDICES � SUMMARY OF CRITERIA AND MEASUREMENT
This annex summarizes the components of each IPR index employed in the present study.
I. Patent Rights Index
1) Membership in International Treaties Signatory Not Signatory
-- Paris Convention and Revisions 1/5 0 -- Patent Cooperation Treaty 1/5 0 -- Protection of New Varieties (UPOV) 1/5 0 -- Budapest Treaty (Microorganism Deposits) 1/5 0 -- Trade-Related Intellectual Property Rights (TRIPS) 1/5 0
2) Coverage Available Not Available
-- Patentability of pharmaceuticals 1/8 0 -- Patentability of chemicals 1/8 0 -- Patentability of food 1/8 0 -- Patentability of surgical products 1/8 0 -- Patentability of microorganisms 1/8 0 -- Patentability of utility models 1/8 0 -- Patentability of software 1/8 0 -- Patentability of plant & animal varieties 1/8 0
3) Restrictions on Patent Rights Does Not Exist Exists
-- �Working� Requirements 1/3 0 -- Compulsory Licensing 1/3 0 -- Revocation of Patents 1/3 0
4) Enforcement Available Not Available
-- Preliminary Injunctions 1/3 0 -- Contributory Infringement 1/3 0 -- Burden-of-Proof Reversal 1/3 0
5) Duration of Protection Full Partial
1 0 < f < 1
-- where f is the duration of protection as a fraction of 20 years from the date of application or 17 years from the date of grant (for grant-based patent systems).
Overall score for Patent Rights Index: sum of points under (1) � (5).
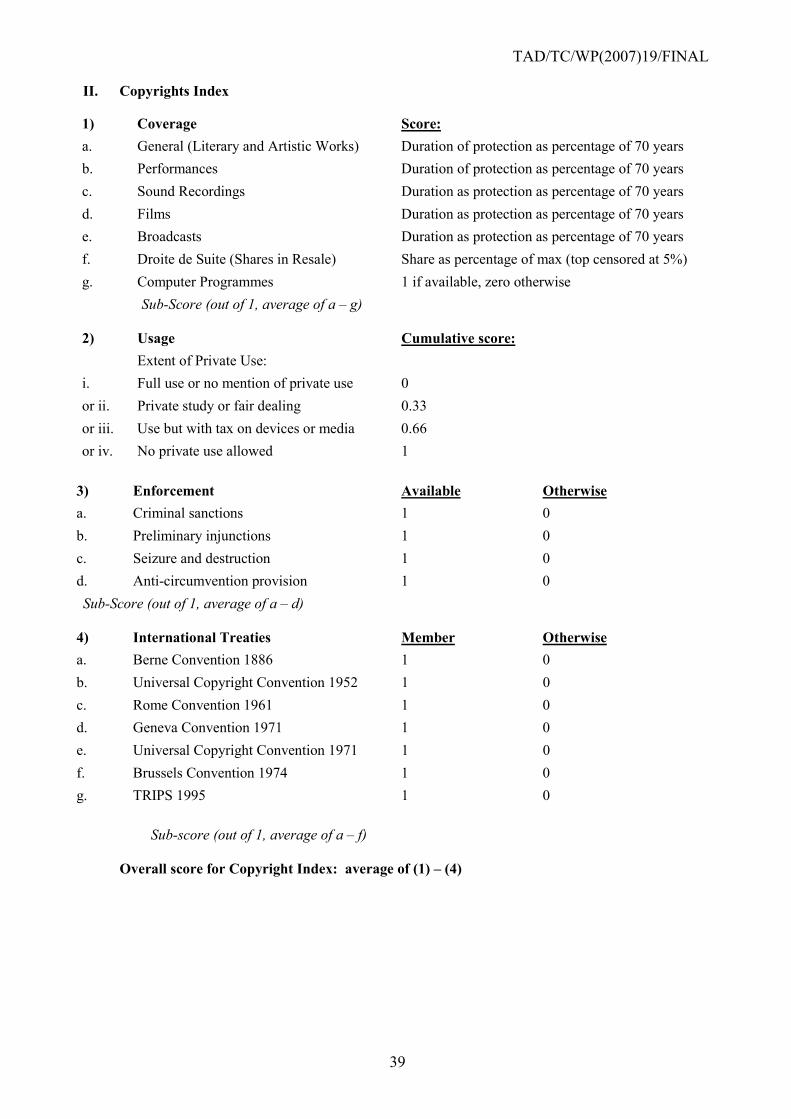
TAD/TC/WP(2007)19/FINAL
39
II. Copyrights Index
1) Coverage Score: a. General (Literary and Artistic Works) Duration of protection as percentage of 70 years b. Performances Duration of protection as percentage of 70 years c. Sound Recordings Duration as protection as percentage of 70 years d. Films Duration as protection as percentage of 70 years e. Broadcasts Duration as protection as percentage of 70 years f. Droite de Suite (Shares in Resale) Share as percentage of max (top censored at 5%) g. Computer Programmes 1 if available, zero otherwise
Sub-Score (out of 1, average of a � g) 2) Usage Cumulative score: Extent of Private Use:
i. Full use or no mention of private use 0
or ii. Private study or fair dealing 0.33
or iii. Use but with tax on devices or media 0.66 or iv. No private use allowed 1
3) Enforcement Available Otherwise a. Criminal sanctions 1 0 b. Preliminary injunctions 1 0 c. Seizure and destruction 1 0 d. Anti-circumvention provision 1 0 Sub-Score (out of 1, average of a � d)
4) International Treaties Member Otherwise a. Berne Convention 1886 1 0 b. Universal Copyright Convention 1952 1 0 c. Rome Convention 1961 1 0 d. Geneva Convention 1971 1 0 e. Universal Copyright Convention 1971 1 0 f. Brussels Convention 1974 1 0 g. TRIPS 1995 1 0 Sub-score (out of 1, average of a � f)
Overall score for Copyright Index: average of (1) � (4)
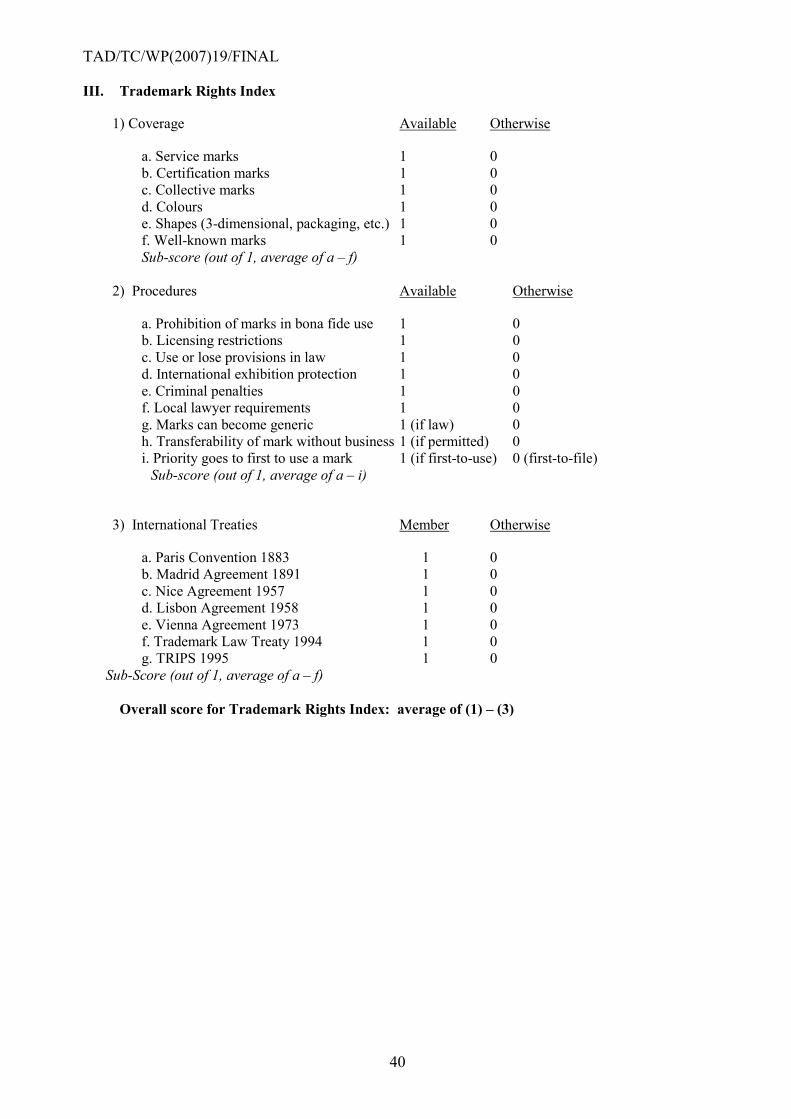
TAD/TC/WP(2007)19/FINAL
40
III. Trademark Rights Index
1) Coverage Available Otherwise
a. Service marks 1 0 b. Certification marks 1 0 c. Collective marks 1 0 d. Colours 1 0 e. Shapes (3-dimensional, packaging, etc.) 1 0 f. Well-known marks 1 0 Sub-score (out of 1, average of a � f)
2) Procedures Available Otherwise
a. Prohibition of marks in bona fide use 1 0 b. Licensing restrictions 1 0 c. Use or lose provisions in law 1 0 d. International exhibition protection 1 0 e. Criminal penalties 1 0 f. Local lawyer requirements 1 0 g. Marks can become generic 1 (if law) 0 h. Transferability of mark without business 1 (if permitted) 0 i. Priority goes to first to use a mark 1 (if first-to-use) 0 (first-to-file)
Sub-score (out of 1, average of a � i)
3) International Treaties Member Otherwise
a. Paris Convention 1883 1 0 b. Madrid Agreement 1891 1 0 c. Nice Agreement 1957 1 0 d. Lisbon Agreement 1958 1 0 e. Vienna Agreement 1973 1 0 f. Trademark Law Treaty 1994 1 0 g. TRIPS 1995 1 0
Sub-Score (out of 1, average of a � f)
Overall score for Trademark Rights Index: average of (1) � (3)

TAD/TC/WP(2007)19/FINAL
41
Table 1. Intellectual Property Rights (IPR) Sample Statistics
Part A: Index of Patent Rights Index of Copyrights Index of Trademark Rights IPR Survey Group Mean in 2005 Group Mean in 2005 Group Mean in 2005 Group Mean in 2005 (%∆ since 1995) (%∆ since 1995) (%∆ since 1995) (%∆ since 1995) Group 1 4.4 0.8 0.7 5.5 (10%) (14.3%) (16.7%) (n/a) Group 2 3.3 0.6 0.6 3.5 (37.5%) (20%) (20%) (n/a) Group 3 2.4 0.42 0.36 2.7 (26.3%) (0%) (33.3%) (n/a) Part B: Correlations Patent Rights Copyrights Trademarks IPR Survey Patent Rights 1.0 Copyrights 0.53 1.0 Trademark Rights 0.57 0.58 1.0 IPR Survey 0.62 0.36 0.37 1.0 Notes:
! Group 1 consists of developed countries, Group 2 of developing countries, and Group 3 of least developed countries. See Annex 2 for a list of countries in each group.
! �IPR Survey� refers to the rating of the strength of national intellectual property rights by business executives in the World Economic Forum�s Global Competitiveness Report survey.
! Each entry shows the within group mean in year 2005 and the percentage growth in the group mean from 1995 to 2005 in parenthesis. ! The index of patent rights varies from 0 (weak) to 5 (strong); index of copyrights from 0 (weak) to 1 (strong); index of trademark rights from 0 (weak) to 1
(strong); IPR survey ratings from 1 (weak) to 7 (strong). n/a denotes not available. See Annex 4 for more details on the construction of the IPR indices.

TAD/TC/WP(2007)19/FINAL
42
Table 2. Trends in Technology Transfer and Innovation
Mode of Transfer Country Group Mean Value in 2005 Percentage Growth since 1995
Inward Foreign Direct Investment (FDI)
Stock
1 $244.9 169.8%2 $35.8 234.3%3 $2.05 262.8%
Merchandise Imports 1 $236.2 56.2%2 $47.3 91.4%3 $2.2 103.8%
Service Imports 1 $58.4 53.4%2 $9.2 70.4%3 $0.92 91.1%
Research and Development (as a %
of GDP)
1 2.3 13.5%2 0.73 22.1%3 0.32 72.3%
Resident Patent Applications
1 57,577 68.2%2 18,163 687%3 n/a n/a
Non-resident Patent Applications
1 60,862 99%2 24,939 1419%3 n/a n/a
Notes: Group 1 consists of developed countries, Group 2 of developing countries, and Group 3 of least developed countries (see Annex 2). FDI and trade figures are in billions of real 2000 U.S. dollars. n/a indicates not available (due to incomplete data).
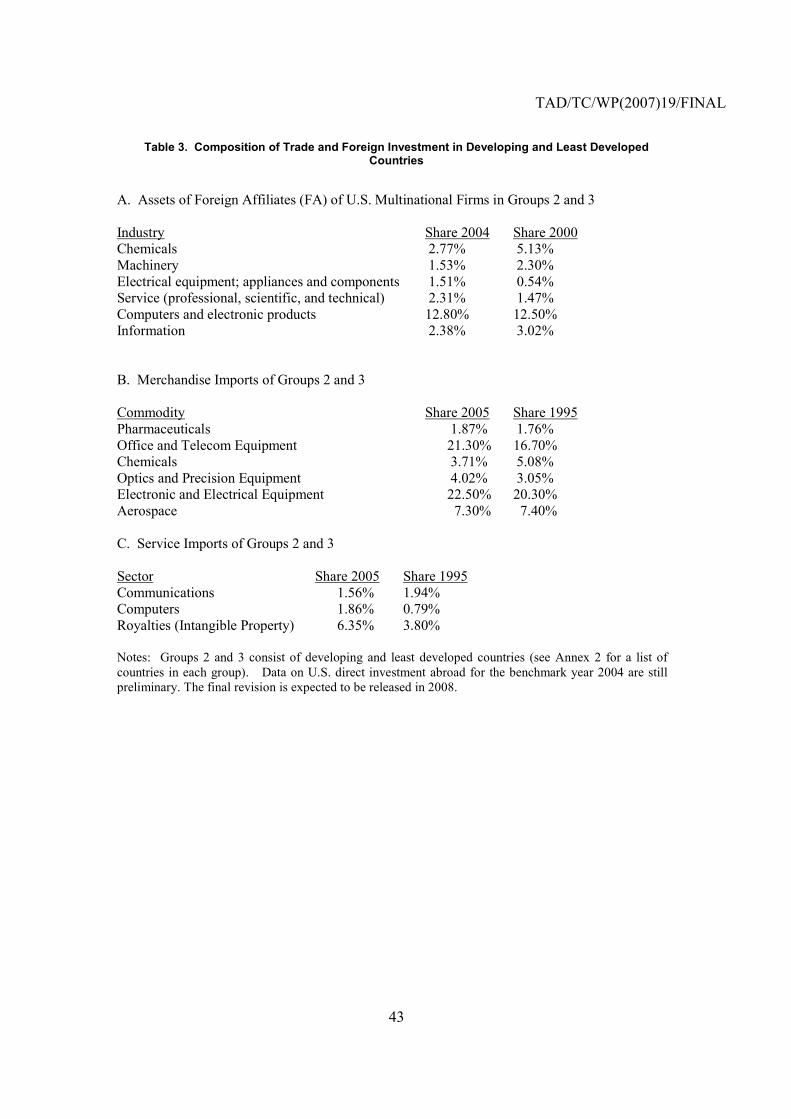
TAD/TC/WP(2007)19/FINAL
43
Table 3. Composition of Trade and Foreign Investment in Developing and Least Developed Countries
A. Assets of Foreign Affiliates (FA) of U.S. Multinational Firms in Groups 2 and 3 Industry Share 2004 Share 2000 Chemicals 2.77% 5.13% Machinery 1.53% 2.30% Electrical equipment; appliances and components 1.51% 0.54% Service (professional, scientific, and technical) 2.31% 1.47% Computers and electronic products 12.80% 12.50% Information 2.38% 3.02% B. Merchandise Imports of Groups 2 and 3 Commodity Share 2005 Share 1995 Pharmaceuticals 1.87% 1.76% Office and Telecom Equipment 21.30% 16.70% Chemicals 3.71% 5.08% Optics and Precision Equipment 4.02% 3.05% Electronic and Electrical Equipment 22.50% 20.30% Aerospace 7.30% 7.40% C. Service Imports of Groups 2 and 3 Sector Share 2005 Share 1995 Communications 1.56% 1.94% Computers 1.86% 0.79% Royalties (Intangible Property) 6.35% 3.80% Notes: Groups 2 and 3 consist of developing and least developed countries (see Annex 2 for a list of countries in each group). Data on U.S. direct investment abroad for the benchmark year 2004 are still preliminary. The final revision is expected to be released in 2008.
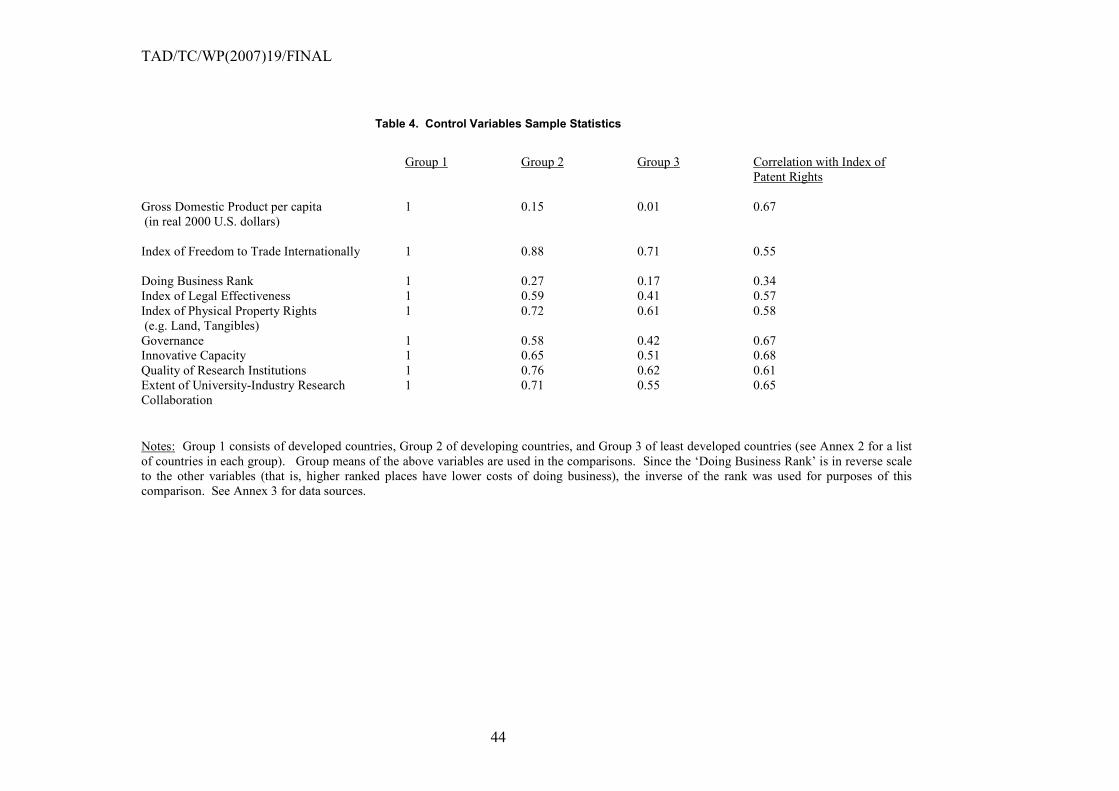
TAD/TC/WP(2007)19/FINAL
44
Table 4. Control Variables Sample Statistics
Group 1 Group 2 Group 3 Correlation with Index of
Patent Rights
Gross Domestic Product per capita (in real 2000 U.S. dollars)
1 0.15 0.01 0.67
Index of Freedom to Trade Internationally
1 0.88 0.71 0.55
Doing Business Rank 1 0.27 0.17 0.34 Index of Legal Effectiveness 1 0.59 0.41 0.57 Index of Physical Property Rights (e.g. Land, Tangibles)
1 0.72 0.61 0.58
Governance 1 0.58 0.42 0.67 Innovative Capacity 1 0.65 0.51 0.68 Quality of Research Institutions 1 0.76 0.62 0.61 Extent of University-Industry Research Collaboration
1 0.71 0.55 0.65
Notes: Group 1 consists of developed countries, Group 2 of developing countries, and Group 3 of least developed countries (see Annex 2 for a list of countries in each group). Group means of the above variables are used in the comparisons. Since the �Doing Business Rank� is in reverse scale to the other variables (that is, higher ranked places have lower costs of doing business), the inverse of the rank was used for purposes of this comparison. See Annex 3 for data sources.
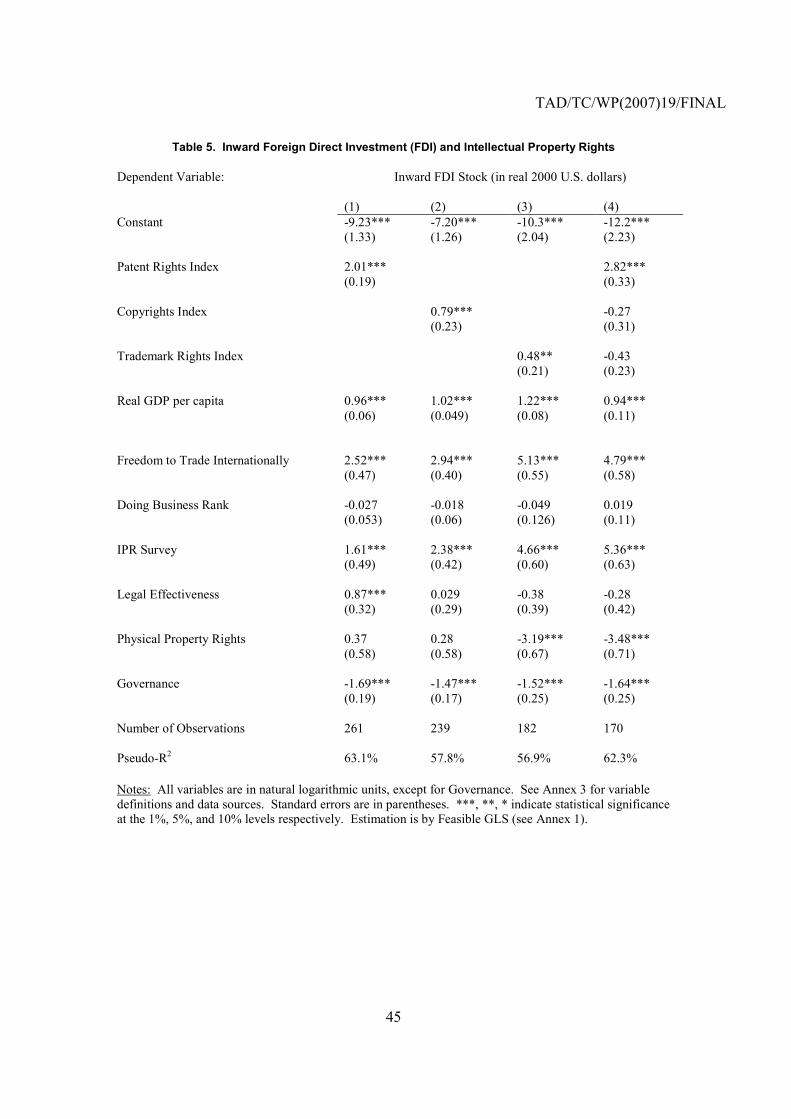
TAD/TC/WP(2007)19/FINAL
45
Table 5. Inward Foreign Direct Investment (FDI) and Intellectual Property Rights
Dependent Variable:
Inward FDI Stock (in real 2000 U.S. dollars)
(1) (2) (3) (4) Constant -9.23*** -7.20*** -10.3*** -12.2*** (1.33) (1.26) (2.04) (2.23) Patent Rights Index 2.01*** 2.82*** (0.19) (0.33) Copyrights Index 0.79*** -0.27 (0.23) (0.31) Trademark Rights Index 0.48** -0.43 (0.21) (0.23) Real GDP per capita 0.96*** 1.02*** 1.22*** 0.94*** (0.06) (0.049) (0.08) (0.11) Freedom to Trade Internationally 2.52*** 2.94*** 5.13*** 4.79*** (0.47) (0.40) (0.55) (0.58) Doing Business Rank -0.027 -0.018 -0.049 0.019 (0.053) (0.06) (0.126) (0.11) IPR Survey 1.61*** 2.38*** 4.66*** 5.36*** (0.49) (0.42) (0.60) (0.63) Legal Effectiveness 0.87*** 0.029 -0.38 -0.28 (0.32) (0.29) (0.39) (0.42) Physical Property Rights 0.37 0.28 -3.19*** -3.48*** (0.58) (0.58) (0.67) (0.71) Governance -1.69*** -1.47*** -1.52*** -1.64*** (0.19) (0.17) (0.25) (0.25) Number of Observations 261 239 182 170 Pseudo-R2 63.1% 57.8% 56.9% 62.3% Notes: All variables are in natural logarithmic units, except for Governance. See Annex 3 for variable definitions and data sources. Standard errors are in parentheses. ***, **, * indicate statistical significance at the 1%, 5%, and 10% levels respectively. Estimation is by Feasible GLS (see Annex 1).
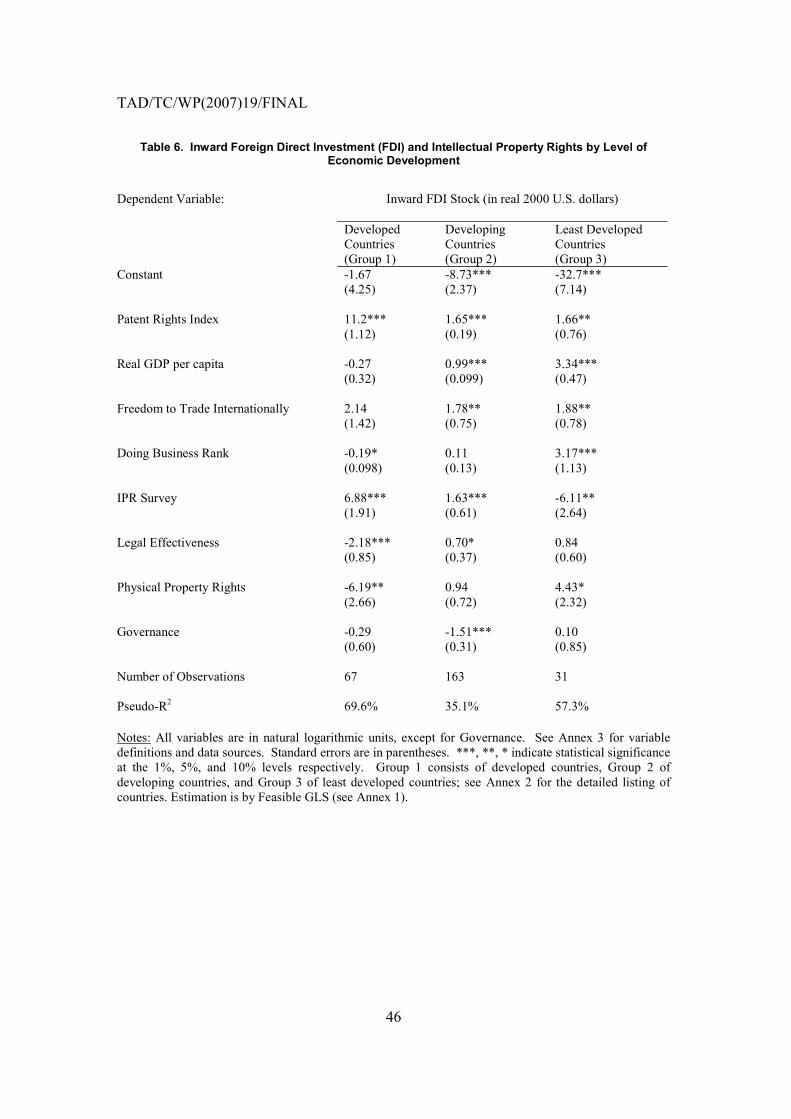
TAD/TC/WP(2007)19/FINAL
46
Table 6. Inward Foreign Direct Investment (FDI) and Intellectual Property Rights by Level of Economic Development
Dependent Variable:
Inward FDI Stock (in real 2000 U.S. dollars)
Developed Countries (Group 1)
Developing Countries (Group 2)
Least Developed Countries (Group 3)
Constant -1.67 -8.73*** -32.7*** (4.25) (2.37) (7.14) Patent Rights Index 11.2*** 1.65*** 1.66** (1.12) (0.19) (0.76) Real GDP per capita -0.27 0.99*** 3.34*** (0.32) (0.099) (0.47) Freedom to Trade Internationally 2.14 1.78** 1.88** (1.42) (0.75) (0.78) Doing Business Rank -0.19* 0.11 3.17*** (0.098) (0.13) (1.13) IPR Survey 6.88*** 1.63*** -6.11** (1.91) (0.61) (2.64) Legal Effectiveness -2.18*** 0.70* 0.84 (0.85) (0.37) (0.60) Physical Property Rights -6.19** 0.94 4.43* (2.66) (0.72) (2.32) Governance -0.29 -1.51*** 0.10 (0.60) (0.31) (0.85) Number of Observations 67 163 31 Pseudo-R2 69.6% 35.1% 57.3% Notes: All variables are in natural logarithmic units, except for Governance. See Annex 3 for variable definitions and data sources. Standard errors are in parentheses. ***, **, * indicate statistical significance at the 1%, 5%, and 10% levels respectively. Group 1 consists of developed countries, Group 2 of developing countries, and Group 3 of least developed countries; see Annex 2 for the detailed listing of countries. Estimation is by Feasible GLS (see Annex 1).

TAD/TC/WP(2007)19/FINAL
47
Table 7. Merchandise Trade and Intellectual Property Rights
Dependent Variable:
Merchandise Imports (in real 2000 U.S. dollars)
(1) (2) (3) (4) Constant 9.44*** -11.0*** 10.5*** 8.03*** (0.98) (0.93) (1.70) (1.81) Patent Rights Index 1.42*** 2.15*** (0.15) (0.26) Copyrights Index 0.001 -0.96*** (0.12) (0.26) Trademark Rights Index 0.37* -0.22 (0.19) (0.20) Real GDP per capita 0.83*** 0.91*** 0.77*** 0.61*** (0.042) (0.039) (0.088) (0.11) Freedom to Trade Internationally 1.05*** 1.19*** 1.96*** 2.21*** (0.31) (0.32) (0.49) (0.42) Doing Business Rank -0.065 -0.073** -0.075 0.028 (0.048) (0.033) (0.072) (0.064) IPR Survey 1.88*** 1.92*** 3.92*** 5.34*** (0.35) (0.39) (0.64) (0.67) Legal Effectiveness 0.25 0.15 0.63* 0.66** (0.19) (0.21) (0.37) (0.33) Physical Property Rights 0.99** 0.49 -1.41** -2.93*** (0.41) (0.35) (0.58) (0.67) Governance -1.41*** -1.14*** -1.45*** -1.52*** (0.12) (0.13) (0.23) (0.21) Number of Observations 264 241 184 172 Pseudo-R2 64.0% 57.1% 55.6% 60.8% Notes: All variables are in natural logarithmic units, except for Governance. See Annex 3 for variable definitions and data sources. Standard errors are in parentheses. ***, **, * indicate statistical significance at the 1%, 5%, and 10% levels respectively. Estimation is by Feasible GLS (see Annex 1).

TAD/TC/WP(2007)19/FINAL
48
Table 8. Merchandise Trade and Intellectual Property Rights by Level of Economic Development
Dependent Variable:
Merchandise Imports (in real 2000 U.S. dollars)
Developed Countries (Group 1)
Developing Countries (Group 2)
Least Developed Countries (Group 3)
Constant 14.2*** 10.6*** 13.2*** (3.12) (1.82) (2.88) Patent Rights Index 9.86*** 1.34*** 0.54* (0.93) (0.16) (0.31) Real GDP per capita 0.09 0.56*** 2.18*** (0.21) (0.088) (0.22) Freedom to Trade Internationally -2.45*** 1.56*** -0.64* (0.66) (0.41) (0.37) Doing Business Rank 0.17** -0.027 -0.80** (0.069) (0.07) (0.39) IPR Survey 5.26*** 3.31*** -0.82 (1.38) (0.49) (0.55) Legal Effectiveness 0.91 0.37 -0.10 (0.70) (0.27) (0.22) Physical Property Rights -5.03** -0.39 1.15 (2.40) (0.60) (0.72) Governance -1.06*** -1.20*** 0.37** (0.36) (0.19) (0.16) Number of Observations 69 164 31 Pseudo-R2 66.9% 36.5% 74.0% Notes: All variables are in natural logarithmic units, except for Governance. See Annex 3 for variable definitions and data sources. Standard errors are in parentheses. ***, **, * indicate statistical significance at the 1%, 5%, and 10% levels respectively. Group 1 consists of developed countries, Group 2 of developing countries, and Group 3 of least developed countries; see Annex 2 for the detailed listing of countries. Estimation is by Feasible GLS (see Annex 1).
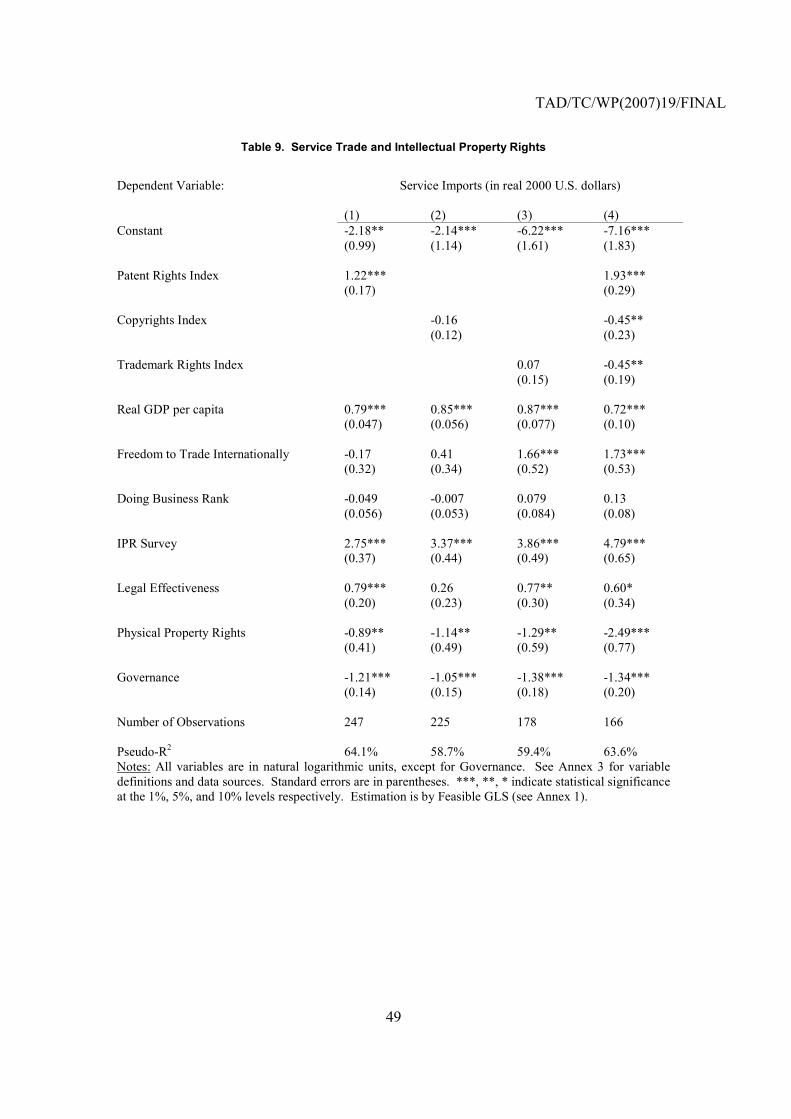
TAD/TC/WP(2007)19/FINAL
49
Table 9. Service Trade and Intellectual Property Rights
Dependent Variable:
Service Imports (in real 2000 U.S. dollars)
(1) (2) (3) (4) Constant -2.18** -2.14*** -6.22*** -7.16*** (0.99) (1.14) (1.61) (1.83) Patent Rights Index 1.22*** 1.93*** (0.17) (0.29) Copyrights Index -0.16 -0.45** (0.12) (0.23) Trademark Rights Index 0.07 -0.45** (0.15) (0.19) Real GDP per capita 0.79*** 0.85*** 0.87*** 0.72*** (0.047) (0.056) (0.077) (0.10) Freedom to Trade Internationally -0.17 0.41 1.66*** 1.73*** (0.32) (0.34) (0.52) (0.53) Doing Business Rank -0.049 -0.007 0.079 0.13 (0.056) (0.053) (0.084) (0.08) IPR Survey 2.75*** 3.37*** 3.86*** 4.79*** (0.37) (0.44) (0.49) (0.65) Legal Effectiveness 0.79*** 0.26 0.77** 0.60* (0.20) (0.23) (0.30) (0.34) Physical Property Rights -0.89** -1.14** -1.29** -2.49*** (0.41) (0.49) (0.59) (0.77) Governance -1.21*** -1.05*** -1.38*** -1.34*** (0.14) (0.15) (0.18) (0.20) Number of Observations 247 225 178 166 Pseudo-R2 64.1% 58.7% 59.4% 63.6% Notes: All variables are in natural logarithmic units, except for Governance. See Annex 3 for variable definitions and data sources. Standard errors are in parentheses. ***, **, * indicate statistical significance at the 1%, 5%, and 10% levels respectively. Estimation is by Feasible GLS (see Annex 1).

TAD/TC/WP(2007)19/FINAL
50
Table 10. Service Trade and Intellectual Property Rights by Level of Economic Development
Dependent Variable:
Service Imports (in real 2000 U.S. dollars))
Developed Countries (Group 1)
Developing Countries (Group 2)
Least Developed Countries (Group 3)
Constant -8.02*** -1.32 -0.31 (3.15) (2.07) (3.32) Patent Rights Index 9.99*** 0.99*** 0.97** (0.88) (0.19) (0.40) Real GDP per capita 0.39* 0.64*** 2.12*** (0.21) (0.10) (0.22) Freedom to Trade Internationally -2.21** 0.54 -1.68*** (0.87) (0.58) (0.49) Doing Business Rank 0.10 -0.15 -0.72 (0.07) (0.11) (0.46) IPR Survey 0.18 3.98*** 1.15 (1.25) (0.53) (0.91) Legal Effectiveness 0.98 0.87*** 0.28 (0.98) (0.29) (0.31) Physical Property Rights 1.72 -2.34*** -0.81 (2.04) (0.64) (1.12) Governance -1.05*** -1.31*** -0.06 (0.41) (0.22) (0.28) Number of Observations 67 153 27 Pseudo-R2 68.1% 33.3% 69.9% Notes: All variables are in natural logarithmic units, except for Governance. See Annex 3 for variable definitions and data sources. Standard errors are in parentheses. ***, **, * indicate statistical significance at the 1%, 5%, and 10% levels respectively. Group 1 consists of developed countries, Group 2 of developing countries, and Group 3 of least developed countries; see Annex 2 for the detailed listing of countries. Estimation is by Feasible GLS (see Annex 1).
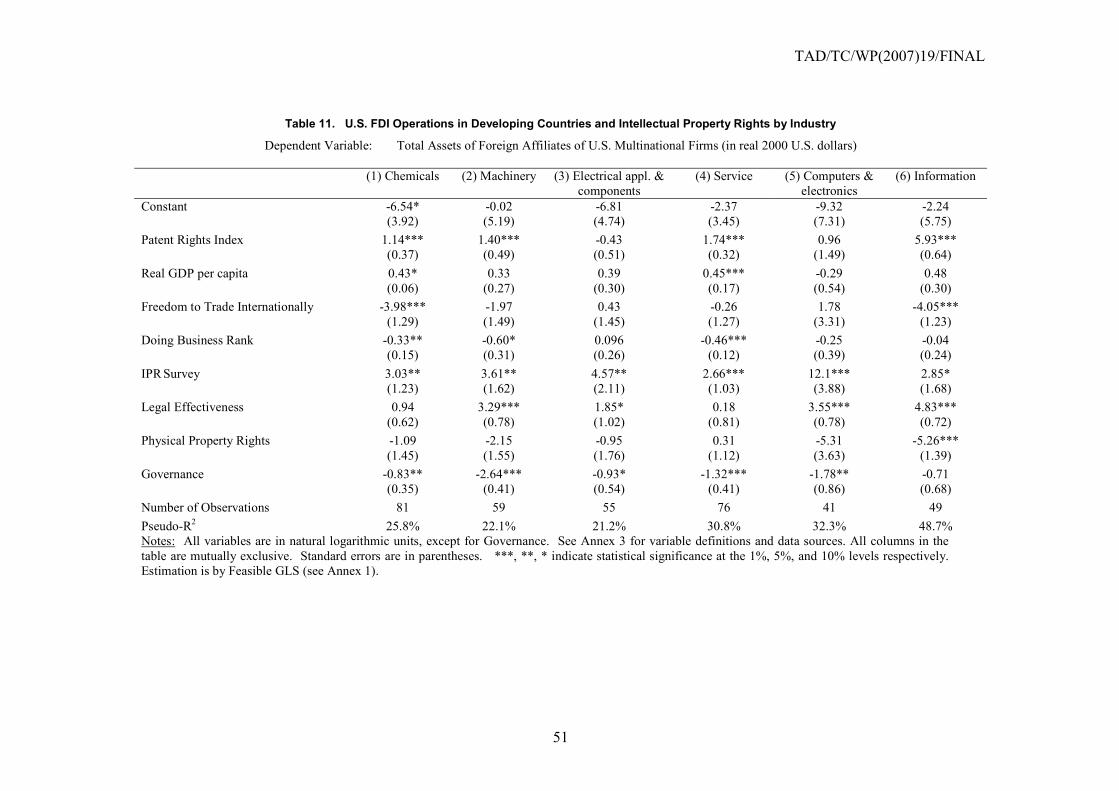
TAD/TC/WP(2007)19/FINAL
51
Table 11. U.S. FDI Operations in Developing Countries and Intellectual Property Rights by Industry
Dependent Variable: Total Assets of Foreign Affiliates of U.S. Multinational Firms (in real 2000 U.S. dollars) (1) Chemicals (2) Machinery (3) Electrical appl. &
components (4) Service (5) Computers &
electronics (6) Information
Constant -6.54* -0.02 -6.81 -2.37 -9.32 -2.24 (3.92) (5.19) (4.74) (3.45) (7.31) (5.75) Patent Rights Index 1.14*** 1.40*** -0.43 1.74*** 0.96 5.93*** (0.37) (0.49) (0.51) (0.32) (1.49) (0.64) Real GDP per capita 0.43* 0.33 0.39 0.45*** -0.29 0.48 (0.06) (0.27) (0.30) (0.17) (0.54) (0.30) Freedom to Trade Internationally -3.98*** -1.97 0.43 -0.26 1.78 -4.05*** (1.29) (1.49) (1.45) (1.27) (3.31) (1.23) Doing Business Rank -0.33** -0.60* 0.096 -0.46*** -0.25 -0.04 (0.15) (0.31) (0.26) (0.12) (0.39) (0.24) IPR Survey 3.03** 3.61** 4.57** 2.66*** 12.1*** 2.85* (1.23) (1.62) (2.11) (1.03) (3.88) (1.68) Legal Effectiveness 0.94 3.29*** 1.85* 0.18 3.55*** 4.83*** (0.62) (0.78) (1.02) (0.81) (0.78) (0.72) Physical Property Rights -1.09 -2.15 -0.95 0.31 -5.31 -5.26*** (1.45) (1.55) (1.76) (1.12) (3.63) (1.39) Governance -0.83** -2.64*** -0.93* -1.32*** -1.78** -0.71 (0.35) (0.41) (0.54) (0.41) (0.86) (0.68) Number of Observations 81 59 55 76 41 49 Pseudo-R2 25.8% 22.1% 21.2% 30.8% 32.3% 48.7% Notes: All variables are in natural logarithmic units, except for Governance. See Annex 3 for variable definitions and data sources. All columns in the table are mutually exclusive. Standard errors are in parentheses. ***, **, * indicate statistical significance at the 1%, 5%, and 10% levels respectively. Estimation is by Feasible GLS (see Annex 1).
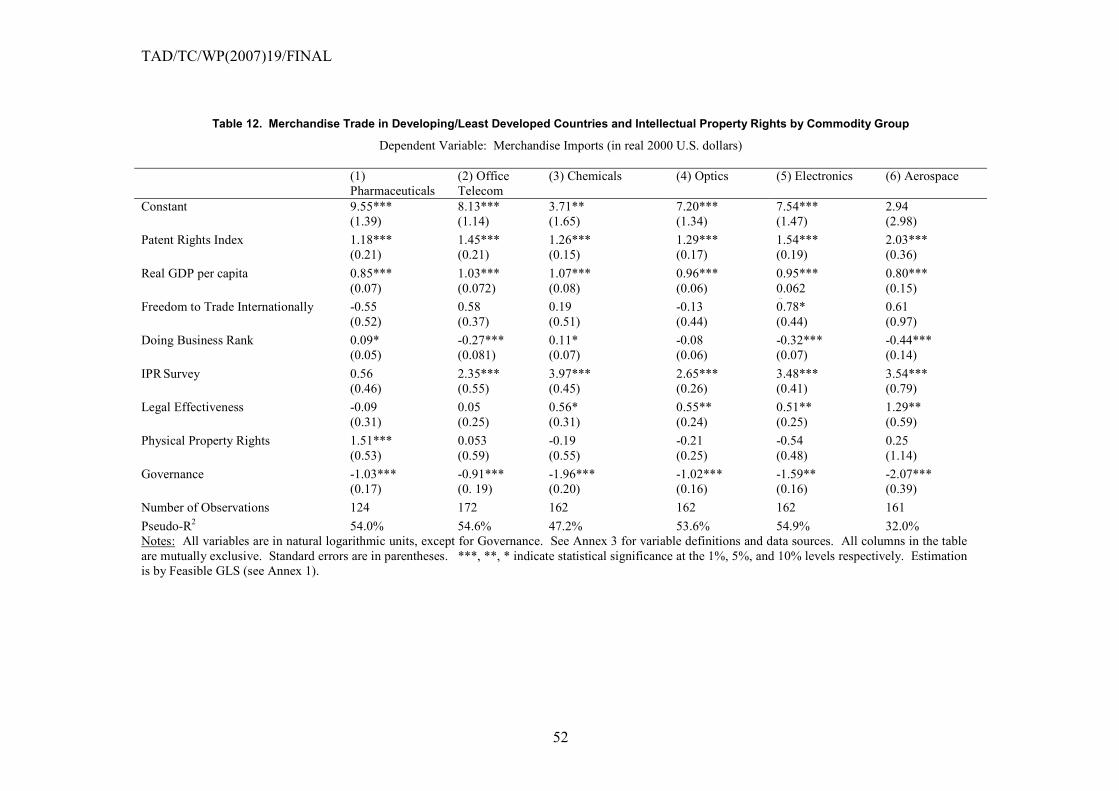
TAD/TC/WP(2007)19/FINAL
52
Table 12. Merchandise Trade in Developing/Least Developed Countries and Intellectual Property Rights by Commodity Group
Dependent Variable: Merchandise Imports (in real 2000 U.S. dollars) (1)
Pharmaceuticals (2) Office Telecom
(3) Chemicals (4) Optics (5) Electronics (6) Aerospace
Constant 9.55*** 8.13*** 3.71** 7.20*** 7.54*** 2.94 (1.39) (1.14) (1.65) (1.34) (1.47) (2.98) Patent Rights Index 1.18*** 1.45*** 1.26*** 1.29*** 1.54*** 2.03*** (0.21) (0.21) (0.15) (0.17) (0.19) (0.36) Real GDP per capita 0.85*** 1.03*** 1.07*** 0.96*** 0.95*** 0.80*** (0.07) (0.072) (0.08) (0.06) 0.062 (0.15)
()Freedom to Trade Internationally -0.55 0.58 0.19 -0.13 0.78* 0.61 (0.52) (0.37) (0.51) (0.44) (0.44) (0.97) Doing Business Rank 0.09* -0.27*** 0.11* -0.08 -0.32*** -0.44*** (0.05) (0.081) (0.07) (0.06) (0.07) (0.14) IPR Survey 0.56 2.35*** 3.97*** 2.65*** 3.48*** 3.54*** (0.46) (0.55) (0.45) (0.26) (0.41) (0.79) Legal Effectiveness -0.09 0.05 0.56* 0.55** 0.51** 1.29** (0.31) (0.25) (0.31) (0.24) (0.25) (0.59) Physical Property Rights 1.51*** 0.053 -0.19 -0.21 -0.54 0.25 (0.53) (0.59) (0.55) (0.25) (0.48) (1.14) Governance -1.03*** -0.91*** -1.96*** -1.02*** -1.59** -2.07*** (0.17) (0. 19) (0.20) (0.16) (0.16) (0.39) Number of Observations 124 172 162 162 162 161 Pseudo-R2 54.0% 54.6% 47.2% 53.6% 54.9% 32.0% Notes: All variables are in natural logarithmic units, except for Governance. See Annex 3 for variable definitions and data sources. All columns in the table are mutually exclusive. Standard errors are in parentheses. ***, **, * indicate statistical significance at the 1%, 5%, and 10% levels respectively. Estimation is by Feasible GLS (see Annex 1).

TAD/TC/WP(2007)19/FINAL
53
Table 13. Trade in Services in Developing and Least Developed Countries and Intellectual Property Rights by Sector
Dependent Variable:
Service Imports (in real 2000 U.S. dollars)
Communications (1)
Computers (2)
Royalties (3)
Constant -9.01*** -14.7*** -6.10** (1.67) (2.56) (2.63) Patent Rights Index 1.55*** 3.32*** 1.73*** (0.27) (0.34) (0.31) Real GDP per capita 0.67*** 0.97*** 0.97*** (0.08) (0.11) (0.12) Freedom to Trade Internationally 1.75*** 0.43 0.02 (0.53) (0.86) (1.45) Doing Business Rank 0.06 0.40** -0.38** (0.14) (0.18) (0.16) IPR Survey 2.62*** 2.38*** 5.26*** (0.59) (0.79) (0.89) Legal Effectiveness 0.30 1.19*** 1.01** (0.31) (0.46) (0.44) Physical Property Rights -0.89 -0.53 -3.95*** (0.62) (0.78) (1.07) Governance -0.88** -1.41*** -1.67*** (0.21) (0.29) (0.27) Number of Observations 142 91 136 Pseudo-R2 43.3% 41.9% 42.3% Notes: All variables are in natural logarithmic units, except for Governance. See Annex 3 for variable definitions and data sources. Standard errors are in parentheses. ***, **, * indicate statistical significance at the 1%, 5%, and 10% levels respectively. Estimation is by Feasible GLS (see Annex 1).
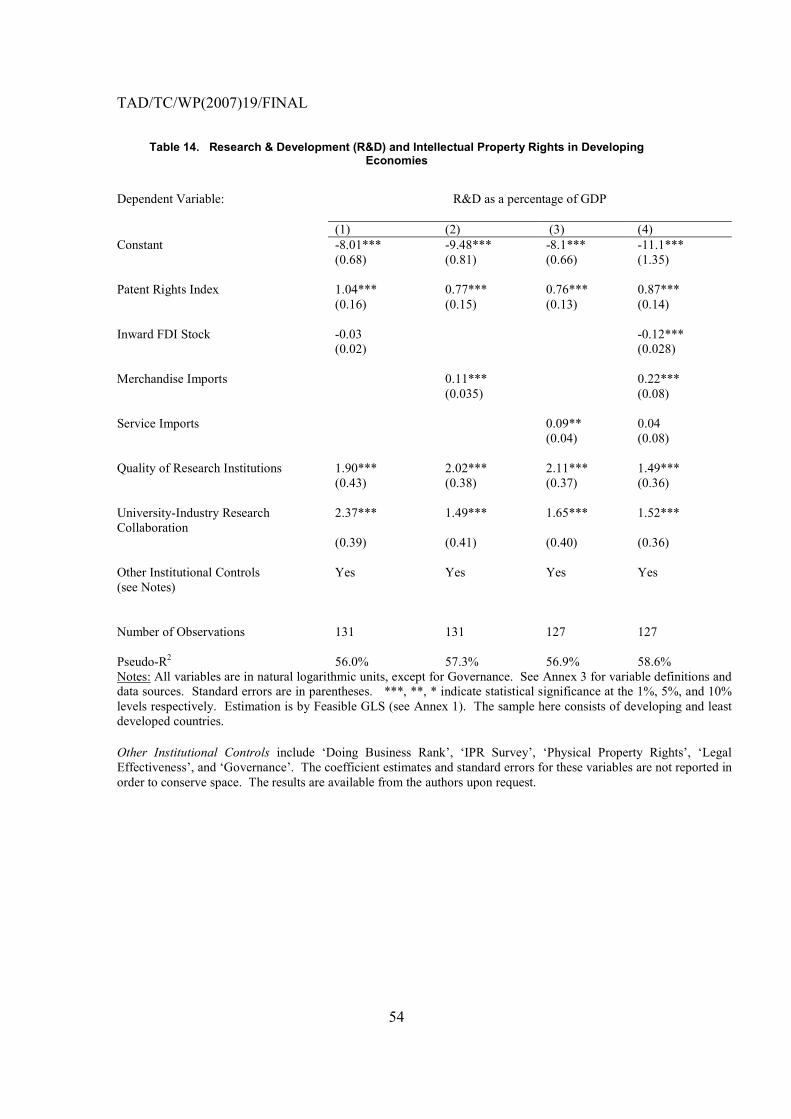
TAD/TC/WP(2007)19/FINAL
54
Table 14. Research & Development (R&D) and Intellectual Property Rights in Developing Economies
Dependent Variable:
R&D as a percentage of GDP
(1) (2) (3) (4) Constant -8.01*** -9.48*** -8.1*** -11.1*** (0.68) (0.81) (0.66) (1.35) Patent Rights Index 1.04*** 0.77*** 0.76*** 0.87*** (0.16) (0.15) (0.13) (0.14) Inward FDI Stock -0.03 -0.12*** (0.02) (0.028) Merchandise Imports 0.11*** 0.22*** (0.035) (0.08) Service Imports 0.09** 0.04 (0.04) (0.08) Quality of Research Institutions 1.90*** 2.02*** 2.11*** 1.49*** (0.43) (0.38) (0.37) (0.36) University-Industry Research Collaboration
2.37*** 1.49*** 1.65*** 1.52***
(0.39) (0.41) (0.40) (0.36) Other Institutional Controls (see Notes)
Yes Yes Yes Yes
Number of Observations 131 131 127 127 Pseudo-R2 56.0% 57.3% 56.9% 58.6% Notes: All variables are in natural logarithmic units, except for Governance. See Annex 3 for variable definitions and data sources. Standard errors are in parentheses. ***, **, * indicate statistical significance at the 1%, 5%, and 10% levels respectively. Estimation is by Feasible GLS (see Annex 1). The sample here consists of developing and least developed countries. Other Institutional Controls include �Doing Business Rank�, �IPR Survey�, �Physical Property Rights�, �Legal Effectiveness�, and �Governance�. The coefficient estimates and standard errors for these variables are not reported in order to conserve space. The results are available from the authors upon request.
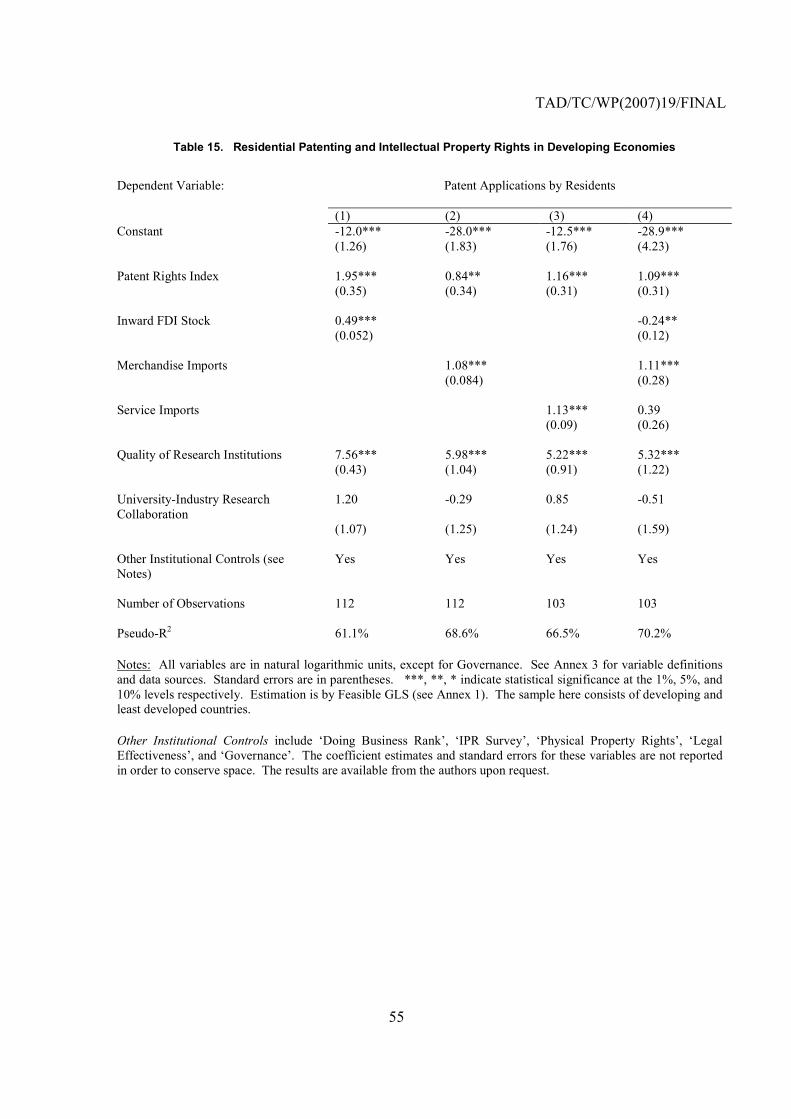
TAD/TC/WP(2007)19/FINAL
55
Table 15. Residential Patenting and Intellectual Property Rights in Developing Economies
Dependent Variable:
Patent Applications by Residents
(1) (2) (3) (4) Constant -12.0*** -28.0*** -12.5*** -28.9*** (1.26) (1.83) (1.76) (4.23) Patent Rights Index 1.95*** 0.84** 1.16*** 1.09*** (0.35) (0.34) (0.31) (0.31) Inward FDI Stock 0.49*** -0.24** (0.052) (0.12) Merchandise Imports 1.08*** 1.11*** (0.084) (0.28) Service Imports 1.13*** 0.39 (0.09) (0.26) Quality of Research Institutions 7.56*** 5.98*** 5.22*** 5.32*** (0.43) (1.04) (0.91) (1.22) University-Industry Research Collaboration
1.20 -0.29 0.85 -0.51
(1.07) (1.25) (1.24) (1.59) Other Institutional Controls (see Notes)
Yes Yes Yes Yes
Number of Observations 112 112 103 103 Pseudo-R2 61.1% 68.6% 66.5% 70.2% Notes: All variables are in natural logarithmic units, except for Governance. See Annex 3 for variable definitions and data sources. Standard errors are in parentheses. ***, **, * indicate statistical significance at the 1%, 5%, and 10% levels respectively. Estimation is by Feasible GLS (see Annex 1). The sample here consists of developing and least developed countries. Other Institutional Controls include �Doing Business Rank�, �IPR Survey�, �Physical Property Rights�, �Legal Effectiveness�, and �Governance�. The coefficient estimates and standard errors for these variables are not reported in order to conserve space. The results are available from the authors upon request.
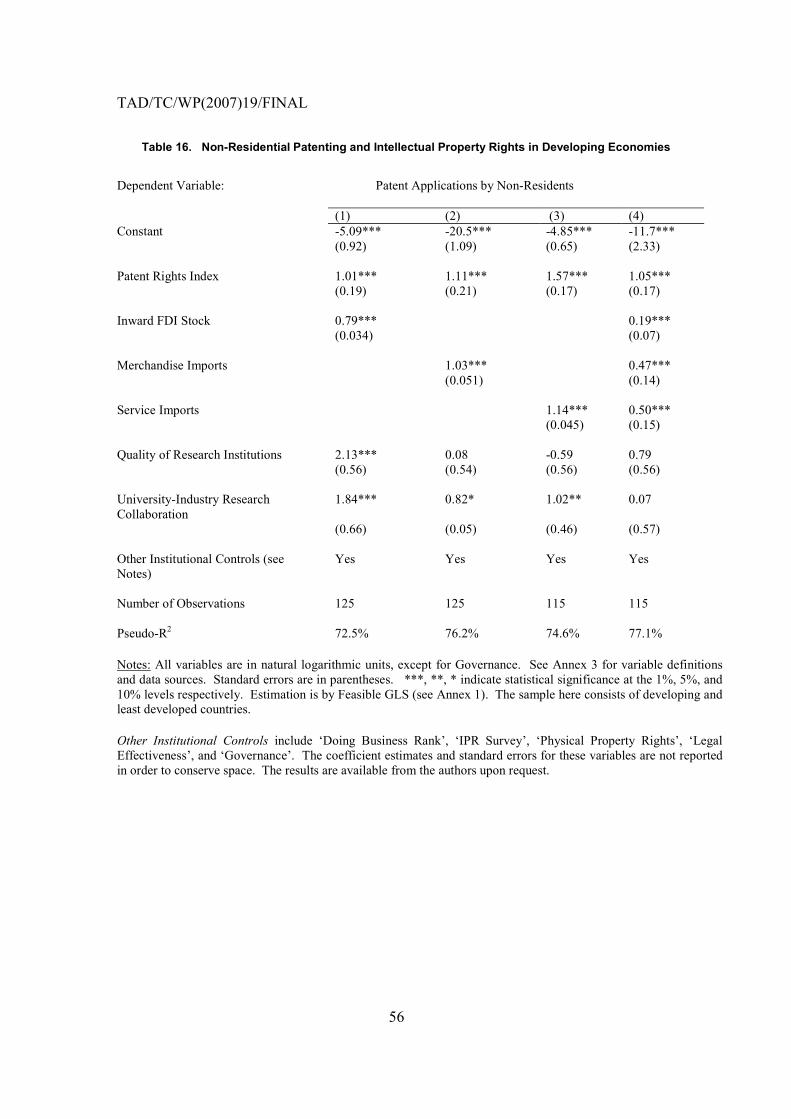
TAD/TC/WP(2007)19/FINAL
56
Table 16. Non-Residential Patenting and Intellectual Property Rights in Developing Economies
Dependent Variable:
Patent Applications by Non-Residents
(1) (2) (3) (4) Constant -5.09*** -20.5*** -4.85*** -11.7*** (0.92) (1.09) (0.65) (2.33) Patent Rights Index 1.01*** 1.11*** 1.57*** 1.05*** (0.19) (0.21) (0.17) (0.17) Inward FDI Stock 0.79*** 0.19*** (0.034) (0.07) Merchandise Imports 1.03*** 0.47*** (0.051) (0.14) Service Imports 1.14*** 0.50*** (0.045) (0.15) Quality of Research Institutions 2.13*** 0.08 -0.59 0.79 (0.56) (0.54) (0.56) (0.56) University-Industry Research Collaboration
1.84*** 0.82* 1.02** 0.07
(0.66) (0.05) (0.46) (0.57) Other Institutional Controls (see Notes)
Yes Yes Yes Yes
Number of Observations 125 125 115 115 Pseudo-R2 72.5% 76.2% 74.6% 77.1% Notes: All variables are in natural logarithmic units, except for Governance. See Annex 3 for variable definitions and data sources. Standard errors are in parentheses. ***, **, * indicate statistical significance at the 1%, 5%, and 10% levels respectively. Estimation is by Feasible GLS (see Annex 1). The sample here consists of developing and least developed countries. Other Institutional Controls include �Doing Business Rank�, �IPR Survey�, �Physical Property Rights�, �Legal Effectiveness�, and �Governance�. The coefficient estimates and standard errors for these variables are not reported in order to conserve space. The results are available from the authors upon request.
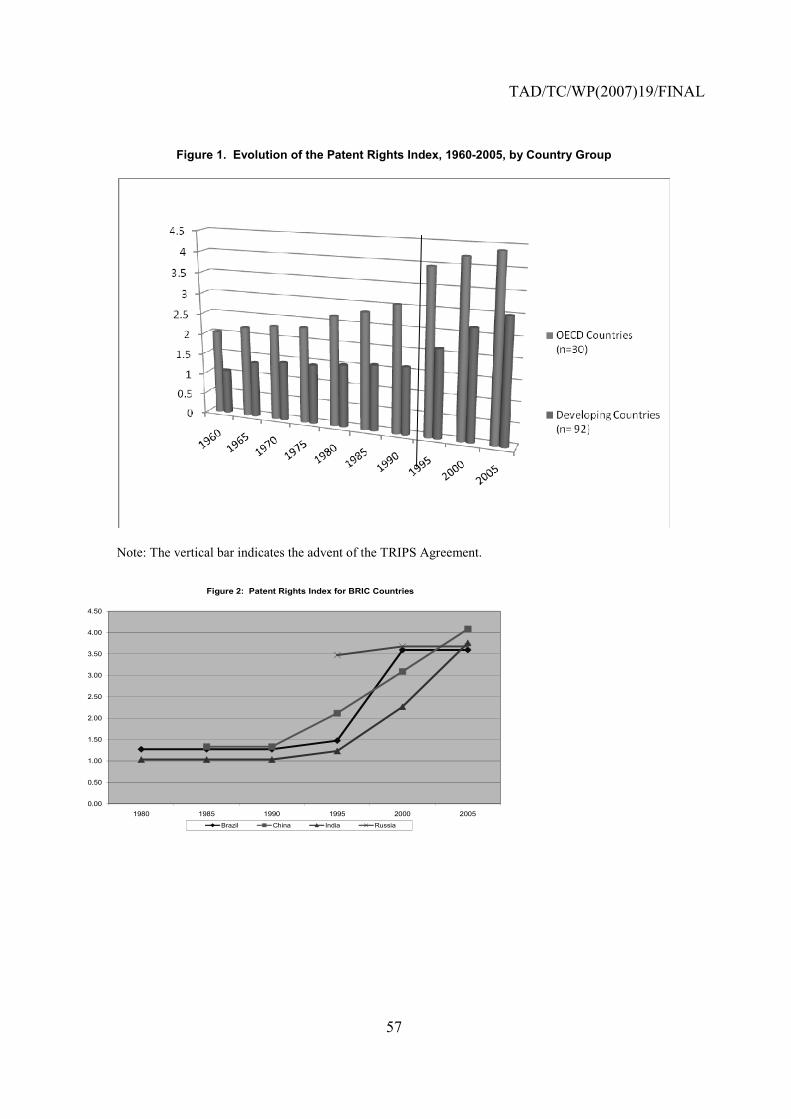
TAD/TC/WP(2007)19/FINAL
57
Figure 1. Evolution of the Patent Rights Index, 1960-2005, by Country Group
Note: The vertical bar indicates the advent of the TRIPS Agreement.
0.00
0.50
1.00
1.50
2.00
2.50
3.00
3.50
4.00
4.50
1980 1985 1990 1995 2000 2005
Figure 2: Patent Rights Index for BRIC Countries
Brazil China India Russia
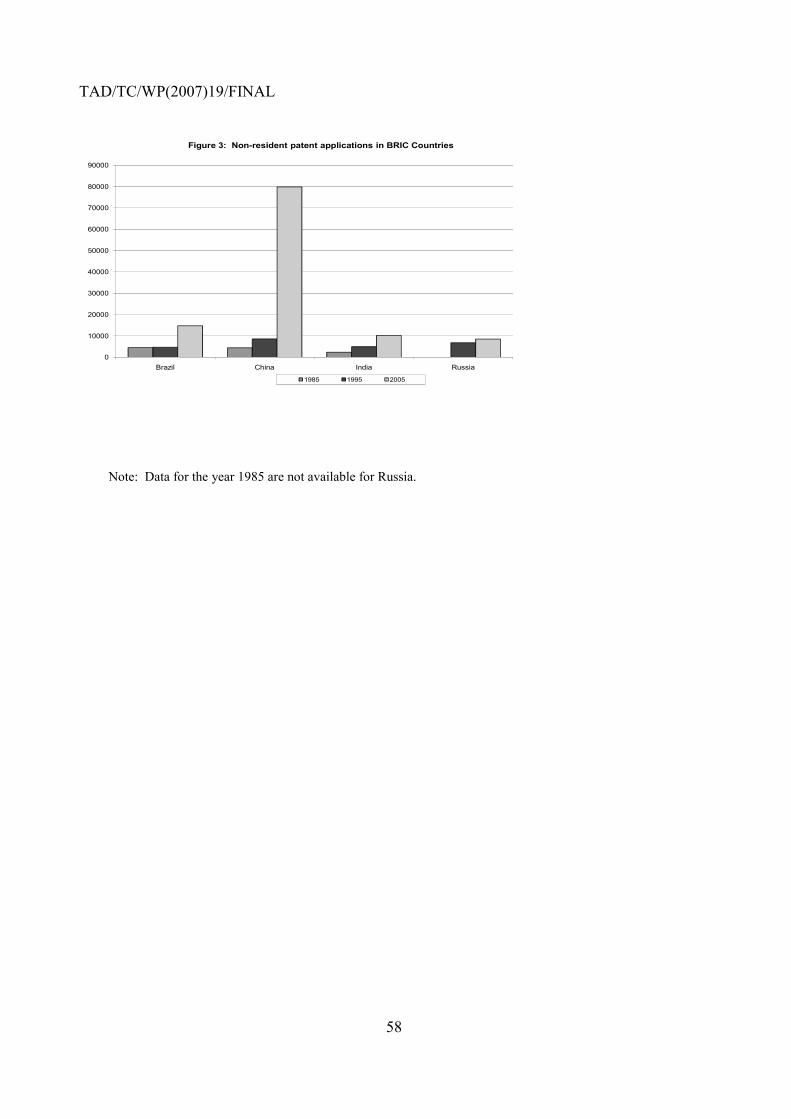
TAD/TC/WP(2007)19/FINAL
58
0
10000
20000
30000
40000
50000
60000
70000
80000
90000
Brazil China India Russia
Figure 3: Non-resident patent applications in BRIC Countries
1985 1995 2005
Note: Data for the year 1985 are not available for Russia.