technology sector scorecard · pwc technology sector scorecard 3 ... new cross-industry alliances...
TRANSCRIPT

Technology Sector ScorecardQ1 2016
www.pwc.com

PwCTechnology Sector Scorecard
2
Q1 2016 Executive summary
PwCTechnology Sector Scorecard
3
Q1 2016 Executive summary
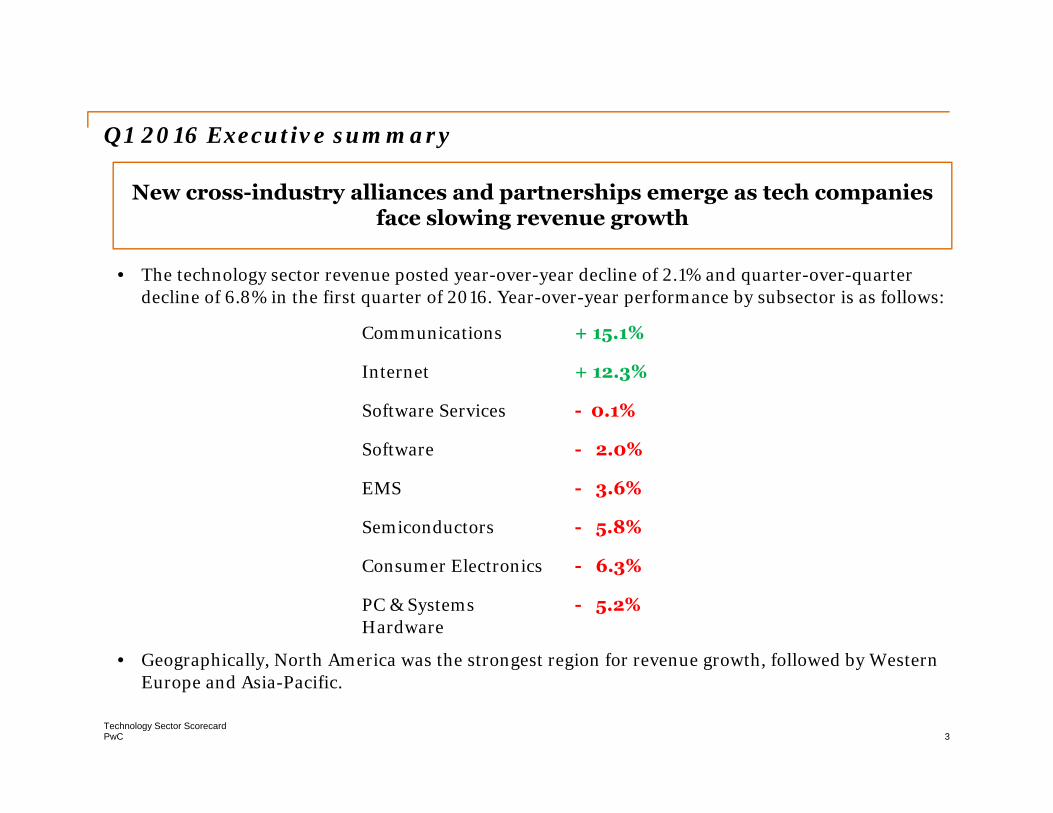
• The technology sector revenue posted year-over-year decline of 2.1% and quarter-over-quarter decline of 6.8% in the first quarter of 2016. Year-over-year performance by subsector is as follows:
• Geographically, North America was the strongest region for revenue growth, followed by Western Europe and Asia-Pacific.
New cross-industry alliances and partnerships emerge as tech companies face slowing revenue growth
Communications + 15.1%
Internet + 12.3%
Software Services - 0.1%
Software - 2.0%
EMS - 3.6%
Semiconductors - 5.8%
Consumer Electronics - 6.3%
PC & Systems Hardware
- 5.2%
PwCTechnology Sector Scorecard
4
• The Internet subsector remained the growth driver for the technology sector. However, currency volatility continues to impact company revenues. The subsector reported a strong quarter with 11% year-over-year revenue growth, led by LinkedIn (+35%) and Yelp (+34%); Amazon (+28%), Netflix (+24%) and Google (+17%) also reported positive revenue growth.
• The Communications subsector was also a strong revenue performer this quarter with year-over-year growth of 15%. However, this performance was due to inorganic growth, specifically the acquisition of Alcatel-Lucent by Nokia.
• Internet-based private companies are experiencing a lack of funding at their current valuations. Some of these companies are facing a challenge raising funds publicly as well which is leading to investor concern about the vulnerability of this group.
• While still posting a year-over-year decline in revenue, the global semiconductor industry reported worldwide sales of US$26.1 billion for the month of March 2016, a slight increase of 0.3% compared to the previous month’s total of US$26.0 billion, but importantly, the first increase in five months.1
Q1 2016 Executive summary (continued)
1. Semiconductors,org, May 2016
PwCTechnology Sector Scorecard
5
• The first quarter saw a number of strategic alliances among technology companies. Comcast began selling its products through Amazon, with the latter charging a fee from customers signing up for Comcast subscription through the Amazon.com website. SAP expanded its partnerships with Azure and Amazon Web Services, announcing broader support for SAP HANA on Microsoft Azure. This will enable big data apps to run while still being protected by enterprise-level security and compliance. Cisco announced a collaboration with Ericsson and Intel to develop the industry's first 5G (fifth-generation mobile networks) router for business and residential services. As part of the Verizon 5G Technology Forum, the trio is also partnering with Verizon to accelerate the pace of critical 5G innovations.
• On the economic front, the quarter was marked by mixed performance. Weak financial markets and volatile oil prices impacted the US economy. Consumer spending, which accounts for more than two-thirds of US economic activity, increased 1.9%, a deceleration from the 2.4% in Q4 2015. This resulted in businesses placing fewer orders for goods and intensifying efforts to reduce inventory. Businesses in Q1 2016 accumulated US$60.9 billion worth of excess inventory, down from US$78.3 billion in the previous quarter.2 The Eurozone economy, on the other hand, posted strong results, growing at its fastest pace in the last year. The strong labor market in Germany helped bring down the Eurozone unemployment rate to 10.2% in March 2016 from 11.2% in March 2015 and the annual inflation rate in the Eurozone also improved from -0.2% in February 2016 to zero in March 2016.3
Q1 2016 Executive summary (continued)
2. CNBC, April 20163. International Business Times, April 2016
PwCTechnology Sector Scorecard
6
• Chinese stocks, which made gains in the previous quarter, once again witnessed volatile movement in Q1 2016. The Shanghai Composite Index started the quarter at 3,296.3 and declined 19% to reach 2,688.0 on 29 February. Weak manufacturing data and worries about tighter liquidity in the market sparked a sudden selloff among investors. It was also reported that some Chinese banks were no longer accepting stocks as collateral for loans, creating further panic.4, 5 However, policy makers soon loosened controls on margin lending. China Securities Finance Corp announced it would restart loans to securities firms for periods ranging from 7 days to 182 days. This resulted in sharp gains in brokerage and technology companies.6 The index subsequently witnessed upward movement and closed at 3,003.9 on 31 March 2016, gaining 12% since 29 February.
• The mixed performance of major markets was mirrored by the Volatility Index, which began the quarter at 20.70 on 1 January and dropped to its quarter-wide low of 13.95 on 31 March, shedding 33%. During this time, the S&P 500 index rose more than 12% from its low in February, buoyed by the Federal Reserve announcement that it would proceed cautiously on raising interest rates.7
• The Dow Jones Industrial Average began the quarter at 17,148.94 and witnessed a sharp decline in the first half of the quarter. Weak manufacturing data from China renewed concerns of a considerable slowdown in the world’s second-largest economy. Investors were also worried that a further slowdown in the Chinese economy would affect the United States and Europe.8 However, higher oil prices and positive US manufacturing and construction data in the month of March improved investor confidence and the Dow Jones Industrial Average witnessed an upward movement to settle at 17,685.09 on 31 March.9
Q1 2016 Executive summary (continued)
4. CBC News, Jan 20165. MarketWatch, Feb 20166. Bloomberg, March 20167. Financial Times, March 20168. International Business Times, Jan 20169. International Business Times, March 2016
PwCTechnology Sector Scorecard
7
• Against this backdrop, the technology initial public offering (IPO) market took a nosedive from 22 IPOs worth US$10.8 billion in Q4 2015 to just 10 IPOs worth US$769 million in Q1 2016—a 93% decline in proceeds and a 55% decline in number of IPOs. Total Q1 2016 proceeds for the technology sector were weaker than any of the previous five quarters.10
Q1 2016 Executive summary (continued)
10. Q1 2016 Global Tech IPO Review, PwC

PwCTechnology Sector Scorecard
8
Source: ISM
50.8 52
.951
.0
51.4 54
.6 58.2
56.2
54.4 57
.0 61.0
56.4
51.0 52
.453
.352
.750
.350
.6 52.9
50.2
55.8
56.5
53.7 55
.2 57.6
56.9
52.6
52.6
51.3
30
35
40
45
50
55
60
65
1Q07
2Q07
3Q07
4Q07
1Q08
2Q08
3Q08
4Q08
1Q09
2Q09
3Q09
4Q09
1Q10
2Q10
3Q10
4Q10
1Q11
2Q11
3Q11
4Q11
1Q12
2Q12
3Q12
4Q12
1Q13
2Q13
3Q13
4Q13
1Q14
2Q14
3Q14
4Q14
1Q15
2Q15
3Q15
4Q15
1Q16
Quarter
Recession Threshold (42.7)
High volatility in the US market during the quarter created uncertainty and the first quarter PMI (Purchasing Managers Index) stood at 49.8%. Although this is a slight improvement over the 48.6% in Q4 2015, a PMI below 50% indicates contraction in the manufacturing sector.
US Purchasing Manager’s Index (PMI) trendsQ1 2007 – Q1 2016
PwCTechnology Sector Scorecard
9
Snapshot by subsector
Communications
PwCTechnology Sector Scorecard
10
Market analysisCommunications• The Communications sector posted below par performance with most companies showing
declines in revenue and a sharp drop in net income. Nokia was the exception with positive year-over-year revenue growth of 68% to US$6.1 billion, owing to the Alcatel-Lucent acquisition.
• The combined consumer and enterprise worldwide wireless local area network (WLAN) market segments increased 4.5% year over year in Q1 2016, while they declined 10.7% on a sequential basis. The enterprise segment grew 8.6% year over year in this quarter, its highest in more than a year. The rise in demand is due to refresh cycles, the easing of economic concerns, the greater availability of Wave 2 802.11ac products, and continued fulfillment of e-rate contracts in the education vertical in the United States. The 802.11ac standard continues to have quick adoption and now accounts for 59.6% of dependent access point unit shipments and 75.6% of dependent access point revenues. Meanwhile, consumer WLAN market revenue was flat on a year-over-year basis in Q1 2016. The adoption of the 802.11ac standard in the consumer market has been significantly slower than in the enterprise segment. Many new network refreshes came during the quarter, leading to improved WLAN spending.
• The strongest growth rate for the WLAN market was once again in Asia/Pacific (excluding Japan), which saw 19.7% year-over-year growth this quarter. North America grew by 14.0% year over year. The Middle East & Africa (MEA) region recorded 4.5% year-over-year growth followed by Western Europe, which increased by 2.7% in the same period. Central and Eastern Europe (CEE) and Japan continue to experience softness, declining 8.8% and 9.2%, respectively, in Q1 2016.1
1. IDC.com, June 2016
PwCTechnology Sector Scorecard
11
Market analysis (continued)Communications
• Videoconferencing equipment experienced mixed results in Q1 2016, with overall revenue decreasing 21.1% quarter over quarter, but increasing 2.3% year over year. Total worldwide enterprise video equipment revenue in Q1 2016 was over US$495 million, down from about US$628 million in Q4 2015. The number of videoconferencing units sold in Q1 2016 (101,391) decreased 8.0% quarter over quarter, but increased 9.9% compared to Q1 15.
• The worldwide enterprise videoconferencing equipment market was mostly negative quarter over quarter, but had some positive year over year numbers, including overall revenue and unit shipments growing 2.3% and 9.9% year over year, respectively. The quarterly declines are mainly due to the normal seasonality, with the first quarter which is always the weakest of the year, and the fourth quarter usually the strongest.2
• Results for Nokia in the first quarter reflect the completed Alcatel-Lucent merger. Revenue in Q1 2016 was €5.6 billion, a 9% decline compared to the year earlier of €6.1 billion on a pro-forma basis. The decline was attributed to the network business segment. Though revenue was off, Nokia’s gross profit margin increased 250 basis points to 39.4% compared to 36.9% last year.
• Motorola Solutions delivered quarterly sales of US$1.2 billion, down 2% year over year. Sales were negatively impacted by an unfavorable foreign currency impact but a favorable impact of US$61 million from the Airwave acquisition.
2. IDC.com, June 2016
PwCTechnology Sector Scorecard
12
Market analysis (continued)Communications• Ericsson and Cisco reported significant progress in all areas of their next-generation strategic
partnership. Both companies have engaged with their customers across the world on business deals spanning networking, mobility and cloud technologies, IP transformation and managed services agreements, resulting in new and expanded business opportunities. The partnership was developed to drive growth, accelerate innovation and speed up digital transformation. In the three months since the partnership was announced, close to 200 customer engagements have resulted in multiple customer wins. Cisco has also announced a collaboration with Ericsson and Intel to develop a next-generation 5G router for business and residential services. Together they will begin to develop and test what is expected to be the industry's first 5G router. As members of the Verizon 5G Technology Forum, Cisco, Ericsson and Intel are partnering with Verizon within an ecosystem to accelerate the pace of critical 5G innovations.3
3. Ericsson press release, May 2016; Seeking Alpha May 2016
PwCTechnology Sector Scorecard
13
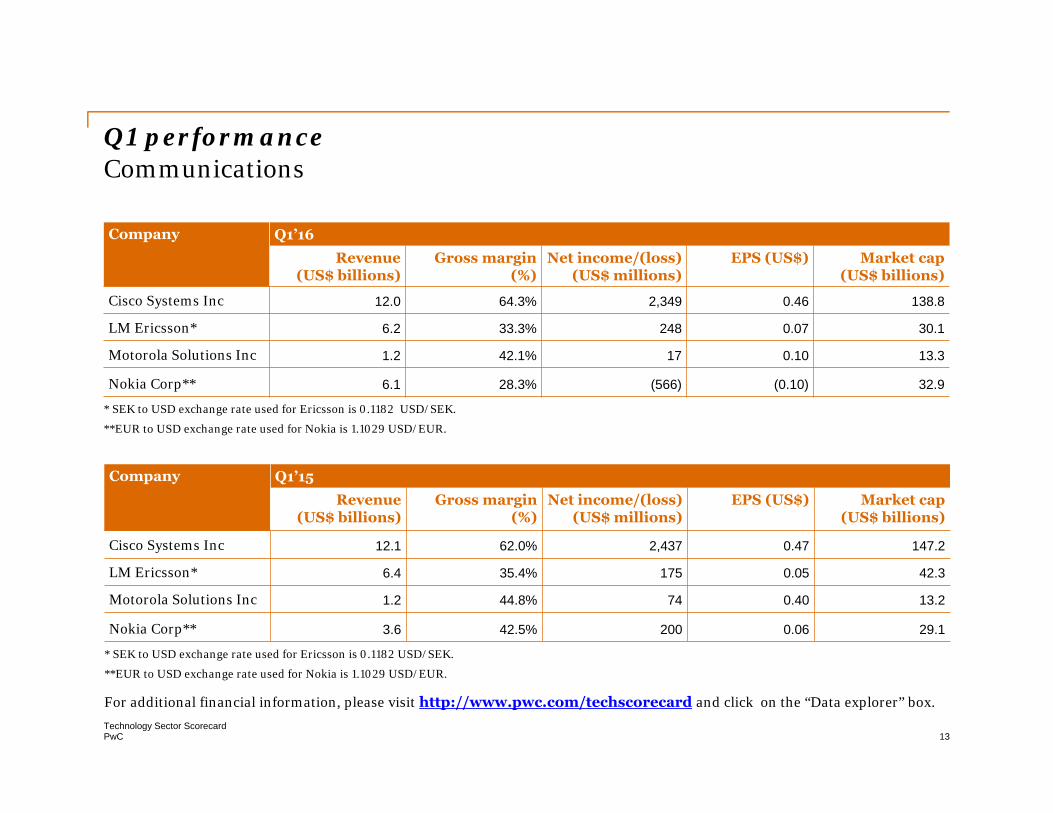
Q1 performanceCommunications
Company Q1’16Revenue
(US$ billions)Gross margin
(%)Net income/(loss)
(US$ millions)EPS (US$) Market cap
(US$ billions)
Cisco Systems Inc 12.0 64.3% 2,349 0.46 138.8
LM Ericsson* 6.2 33.3% 248 0.07 30.1
Motorola Solutions Inc 1.2 42.1% 17 0.10 13.3
Nokia Corp** 6.1 28.3% (566) (0.10) 32.9
* SEK to USD exchange rate used for Ericsson is 0.1182 USD/SEK.
**EUR to USD exchange rate used for Nokia is 1.1029 USD/EUR.
For additional financial information, please visit http://www.pwc.com/techscorecard and click on the “Data explorer” box.
Company Q1’15Revenue
(US$ billions)Gross margin
(%)Net income/(loss)
(US$ millions)EPS (US$) Market cap
(US$ billions)
Cisco Systems Inc 12.1 62.0% 2,437 0.47 147.2
LM Ericsson* 6.4 35.4% 175 0.05 42.3
Motorola Solutions Inc 1.2 44.8% 74 0.40 13.2
Nokia Corp** 3.6 42.5% 200 0.06 29.1
* SEK to USD exchange rate used for Ericsson is 0.1182 USD/SEK.
**EUR to USD exchange rate used for Nokia is 1.1029 USD/EUR.

PwCTechnology Sector Scorecard
14
Snapshot by subsector
Consumer Electronics
PwCTechnology Sector Scorecard
15
Market analysisConsumer Electronics• The Consumer Electronics (CE) sector in Q1 2016 witnessed a year-over-year decline of 6.3% and a
quarter-over-quarter decline of 17.1%. The first quarter of the year is generally weak for CE companies, owing to the conclusion of holiday sales in the preceding quarter. However, several companies under the scope of our study also suffered from issues such as internal restructuring and a general decline in demand for products, further impacting performance.
• Despite the weak performance of the sector, the Consumer Technology Association (CTA) Index of Consumer Expectations (ICE), which measures US consumer sentiment about the broader economy, jumped 6.6 points to 178.7 in March. A rise in consumer spending, as a result of wage growth and employment gains, helped lift consumer confidence in the economy. The US stock market also recovered, reversing the downward movement seen in the first two months of the quarter.1
• With a rebound in US consumer sentiment in the overall economy, optimism toward technology spending also saw an increase. The CTA Index of Consumer Technology Expectations (ICTE), which measures consumer expectations about technology spending, also rose, moving up 1.5 points to 86.4 in March.1
• Biometric technology is enjoying strong growth in the US Consumer Electronics (CE) sector. With the rising number of CE products featuring biometric sensors, it comes as a huge opportunity. Sixty-two percent of American adults who have used biometric technology are comfortable with it. Moreover, 63% of these adults are open to the use of biometric technologies for altruistic purposes such as medical research and in assistive devices for individuals with disabilities.1
1. Consumer Technology Association, March 2016
PwCTechnology Sector Scorecard
16
Market analysis (continued)Consumer Electronics • Reflecting the overall sector results, among the companies under study, Apple and Canon posted
both year-over-year and sequential revenue declines during Q1 2016. Philips and Sony were flat year over year and declined quarter over quarter. Toshiba declined sequentially, but posted 14% growth year over year in US dollar terms, but when reported as Japanese yen (JPY), experienced a year-over-year decline in Q1 2016.
• In specific company news, Apple’s Q1 2016 revenue decreased 13% or US$7.5 billion compared to the same quarter in 2015, primarily due to lower iPhone sales, which declined for the first time in its nine-year history. Average selling prices (ASPs) for iPhones were lower year over year during the quarter due to a change in iPhone mix and the impact of weakness in foreign currencies relative to the US dollar. Despite lagging phone sales, Apple witnessed strong year-over-year growth in Services and Other Products. Geographically, the company’s revenue increased year over year in Japan (+24%), but saw a steep decline in Greater China (-26%), Rest of Asia-Pacific (-25%), Americas (-10%) and to a lesser extent, Europe (-5%).
• On 17 March 2016, Toshiba sold its medical equipment business to Canon for US$5.9 billion (JPY665.5 billion). Subsequently, on 31 March 2016, the company also sold an 80.1% stake in its home appliance business to China's Midea Group for US$473.0 million. As a result, Toshiba has reclassified its Healthcare Systems & Services and Home Appliances businesses as discontinued operations. Toshiba’s Q1 2016 revenue declined 15% year over year, but increased 14% quarter over quarter in US dollar terms. However, in terms of its reporting currency, JPY, the company’s revenue declined 36% year over year and 14% quarter over quarter. The decline was led by Lifestyle Products & Services, which posted a revenue decline of JPY34.1 billion in Q1 2016 compared to revenue increases of JPY209.4 billion in Q4 2015 and JPY277.4 billion in Q1 2015.

PwCTechnology Sector Scorecard
17
Q1 performance Consumer ElectronicsCompany Q1’16
Revenue(US$ billions)
Grossmargin (%)
Net income /(loss)(US$ millions)
EPS(US$)
Market cap (US$ billions)
Apple Inc 50.6 39.4% 10,516 1.90 576.3
Canon Inc 6.9 50.8% 243 0.22 32.5
Philips* 6.1 41.1% 35 0.03 26.1
Sony Corp 16.1 35.3% (782) (0.62) 32.4
Toshiba Corporation 13.6 6.7% (109) (0.02) 8.0
*EUR to USD exchange rate used for Philips is 1.1029 USD/EUR.
**JPY to USD exchange rate used for Toshiba is 0.0087 USD/JPY.
For additional financial information, please visit http://www.pwc.com/techscorecard and click on the “Data explorer” box.
Company Q1’15
Revenue(US$ billions)
Grossmargin (%)
Net income /(loss)(US$ millions)
EPS(US$)
Market cap (US$ billions)
Apple Inc 58.0 40.8% 13,569 2.33 723.0
Canon Inc 7.2 51.1% 285 0.26 38.6
Philips* 6.0 39.6% 113 0.12 25.8
Sony Corp 16.1 33.1% (890) (0.76) 31.3
Toshiba Corporation 16.1 20.3% (1,209) (0.22) 17.7
*EUR to USD exchange rate used for Philips is 1.1283 USD/EUR.
**JPY to USD exchange rate used for Toshiba is 0.0084 USD/JPY.

PwCTechnology Sector Scorecard
18
Snapshot by subsector
EMS/Distributors
PwCTechnology Sector Scorecard
19
Market analysis EMS/Distributors
• In Q1 2016, the EMS companies under study reported a year-over-year revenue decline of 3.6%. The decline was led by Ingram and Avnet. But the sequential revenue decline for EMS companies was more pronounced, at 15.2%. Quarter over quarter, Arrow Electronics and Ingram Micro reported dips of 18.9% and 17.5%, respectively. Ingram’s revenue declined year over year in part due to foreign currency exchange rates, which had a negative impact of 3 percentage points on worldwide sales. An overall sales decline of 6% was due to soft demand for high volume product categories. Arrow Electronics reported 9.4% revenue growth year on year, but a sequential decline due to the year-end holiday quarter having a stronger demand compared to the first quarter of the year. In terms of net income, all the companies under study showed significant decline both year on year and sequentially, except for Arrow Electronics and Avnet, both of which reported flat net income. Ingram Micro experienced the greatest decline in net income both year over year and sequentially. Ingram’s results were negatively impacted by increased costs due to the pending merger with Tianjin Tianhai, as well as higher reorganization, amortization and selling, and general and administrative costs.
• With the life cycles of electronic products continuing to shorten and consumers demanding devices with more functions at lower costs, original equipment manufacturers (OEMs) are challenged to reduce production costs and streamline manufacturing. As a result, they are outsourcing manufacturing to specialized companies providing electronic manufacturing services (EMS). In recent years, EMS in the US has grown steadily. In 2016 it is expected to reach US$4.2 billion. With year-on-year growth of 1.06%, US EMS revenue will reach US$5.3 billion by 2020. The consumption of domestic appliances in the US, Canada and Latin America currently exceeds production, representing huge export opportunities for EMS companies.1
1. Manufacturing Market Insider, March 2016
PwCTechnology Sector Scorecard
20
Market analysis (continued) EMS/Distributors
• The EMS industry is also undergoing significant consolidation, although this is not deterring new entrants from entering the market. The financial and structural advantages of outsourcing have been well proven for many years, as evidenced by very few OEM companies planning or investing in manufacturing automation, thus leaving the expertise of electronics production to EMS companies. More recently, this trend is starting to apply to new Asian OEM companies as original design manufacturers and EMS companies line up to secure contracts to manufacture new hardware innovations from established OEMs.2
• As part of its effort to expand in the next-generation display market, Foxconn Technology announced the acquisition of Sharp Corporation for about ¥389 billion (US$3.5 bn), significantly less than the originally anticipated price due to concern around the viability of Sharp’s financial performance. Foxconn will acquire 66% of Sharp.
2. Manufacturing Market Insider, March 2016
PwCTechnology Sector Scorecard
21
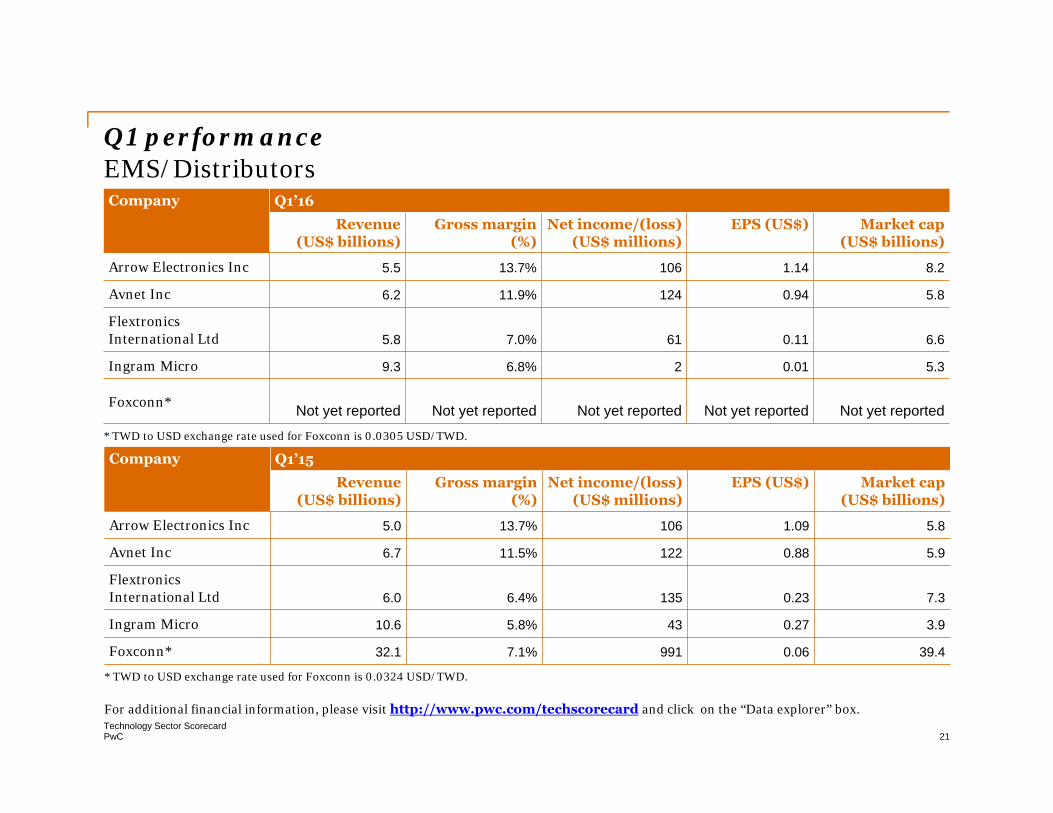
Q1 performanceEMS/DistributorsCompany Q1’16
Revenue(US$ billions)
Gross margin (%)
Net income/(loss)(US$ millions)
EPS (US$) Market cap (US$ billions)
Arrow Electronics Inc 5.5 13.7% 106 1.14 8.2
Avnet Inc 6.2 11.9% 124 0.94 5.8
Flextronics International Ltd 5.8 7.0% 61 0.11 6.6
Ingram Micro 9.3 6.8% 2 0.01 5.3
Foxconn* Not yet reported Not yet reported Not yet reported Not yet reported Not yet reported
* TWD to USD exchange rate used for Foxconn is 0.0305 USD/TWD.
Company Q1’15Revenue
(US$ billions)Gross margin
(%)Net income/(loss)
(US$ millions)EPS (US$) Market cap
(US$ billions)
Arrow Electronics Inc 5.0 13.7% 106 1.09 5.8
Avnet Inc 6.7 11.5% 122 0.88 5.9
Flextronics International Ltd 6.0 6.4% 135 0.23 7.3
Ingram Micro 10.6 5.8% 43 0.27 3.9
Foxconn* 32.1 7.1% 991 0.06 39.4
* TWD to USD exchange rate used for Foxconn is 0.0324 USD/TWD.
For additional financial information, please visit http://www.pwc.com/techscorecard and click on the “Data explorer” box.
PwCTechnology Sector Scorecard
22
Snapshot by subsectorInternet

PwCTechnology Sector Scorecard
23
Market analysisInternet
• Overall, Internet sector growth is slowing, as investors are interestingly now focusing on net income in addition to revenue growth, especially for the mature companies.
• Social media has emerged as an attractive Internet subsector, with positive revenue growth reported by both LinkedIn and Facebook.
• Despite the market challenges, the Internet subsector in Q1 2016 reported year-over-year revenue growth of 18%, led by LinkedIn (+35%) and Yelp (+34%); Yahoo (-11%) was the only laggard. Amazon (+28%), Netflix (+24%) and Google (+17%) also reported positive growth.
• However, on a quarter-over-quarter basis, the Internet subsector reported a 5% decline in revenue due primarily to seasonality. All the Internet companies except for Netflix and Yelp reported sequential drops in revenue. Amazon had the biggest loss, at 19%, followed by Yahoo with a drop of 15%. eBay and Google revenues declined by 8% and 5%, respectively. In terms of net income, performance was subpar as most of the companies reported a decline, with LinkedIn having the sharpest drop in profits. LinkedIn, Yahoo and Yelp all reported negative net income of (-US$46mn), (-US$99mn) and (-US$15mn), respectively.
PwCTechnology Sector Scorecard
24
Market analysis (continued)Internet
• On a company level, LinkedIn delivered strong financial results and growth across core product lines. As a result of its new mobile experience, members are increasing their activity on LinkedIn, helping drive strong levels of engagement across the platform. Revenue increased 35% year over year to US$861 million. Talent Solutions revenue increased 41% year over year to US$558 million. Hiring revenue contributed US$502 million in revenue, up 27% year over year. Adjusted EBITDA was US$222 million, or 26% of revenue. Engagement materially strengthened across the member platform, driven by the new flagship mobile experience. In addition, core monetization products—Recruiter and Sponsored Updates—showed continued growth, while emerging strategic investments, such as Sales Navigator and Learning & Development, continued to show progress. Finally, the company has shown significant improvements in its ability to increase ROI across the business.
• Amazon partnered with Comcast Corp. Comcast has begun selling its TV, Internet and phone service through Amazon.com, creating a high-profile online retail partnership. A new landing page on Amazon.com now welcomes visitors to the "Amazon Cable Store," which sells Comcast's Xfinity-branded bundles, including dedicated customer service for Amazon customers. The two companies created a way to sell TV, Internet and phone service in a way that simplifies the process. Amazon helped Comcast reduce the number of clicks that it takes for a customer to complete a transaction. Amazon will take a fee each time a customer signs up for a Comcast subscription through its site. Going forward, Comcast could sell other products, like its home security service, through Amazon as well.3
1. Dow Jones News, April 2016

PwCTechnology Sector Scorecard
25
Market analysis (continued)Internet
• Yahoo is in the process of finalizing several asset sales, including Internet websites, patents and real estate. Various bidders, including US telecommunications rivals Verizon Communications and AT&T, are set to go through to the third and final round of bidding in the auction for Yahoo's core Internet assets. A consortium led by Quicken Loans founder Dan Gilbert, and backed by Berkshire Hathaway Chairman Warren Buffett, is also expected to make it through to the final round. It is indicated that all offers do not involve exactly the same assets, with some bidders indicating that they are interested in only certain patents and real estate. Verizon is primarily interested in Yahoo's advertising technology tools. It has been examining how the other assets up for sale, such as search, mail and messenger services, could be combined with the corresponding businesses of AOL, which it acquired last year for US$4.4 billion.2 AT&T has been trying to compete with Verizon in advertising technology as it seeks to expand in mobile video offerings. A sale of Yahoo's Internet assets would leave the company owning just a 35.5 percent stake in Yahoo Japan, as well as a 15% stake in Chinese e-commerce company Alibaba, which accounts for most of its value.3
3. The Wall Street Journal , April 2016
2. CNBC.com, June 2016
PwCTechnology Sector Scorecard
26
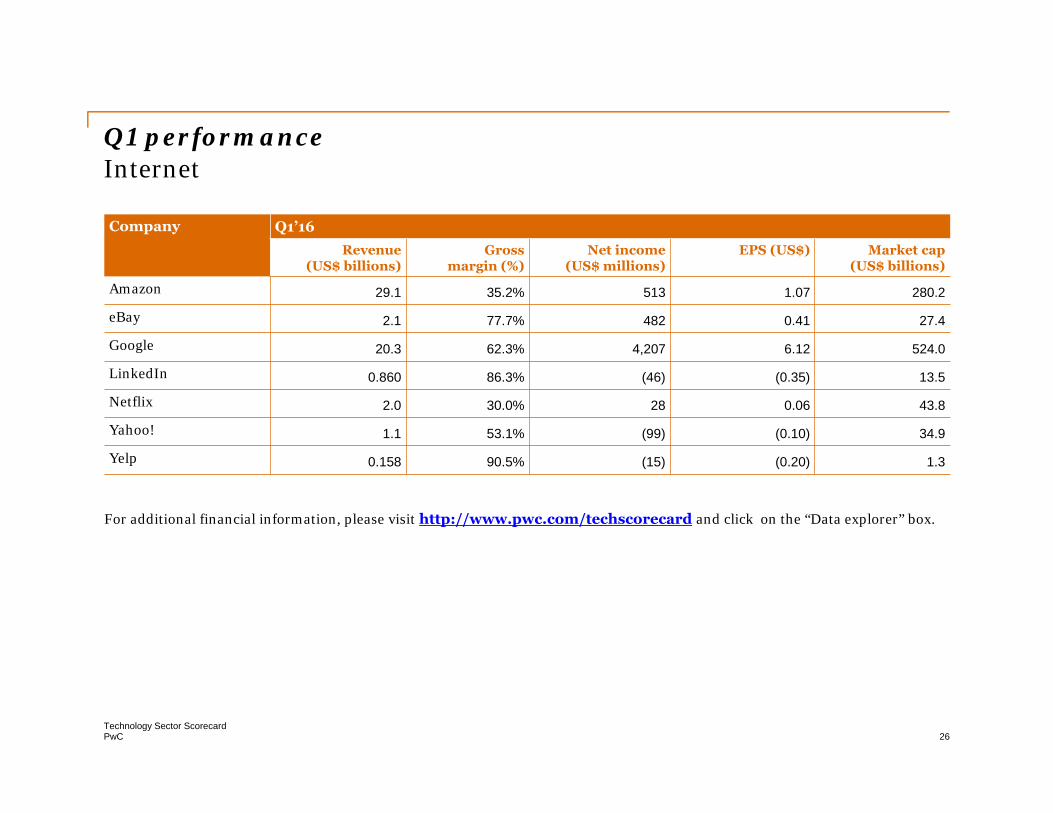
Q1 performance Internet
Company Q1’16Revenue
(US$ billions)Gross
margin (%)Net income
(US$ millions)EPS (US$) Market cap
(US$ billions)
Amazon 29.1 35.2% 513 1.07 280.2
eBay 2.1 77.7% 482 0.41 27.4
Google 20.3 62.3% 4,207 6.12 524.0
LinkedIn 0.860 86.3% (46) (0.35) 13.5
Netflix 2.0 30.0% 28 0.06 43.8
Yahoo! 1.1 53.1% (99) (0.10) 34.9
Yelp 0.158 90.5% (15) (0.20) 1.3
For additional financial information, please visit http://www.pwc.com/techscorecard and click on the “Data explorer” box.
PwCTechnology Sector Scorecard
27
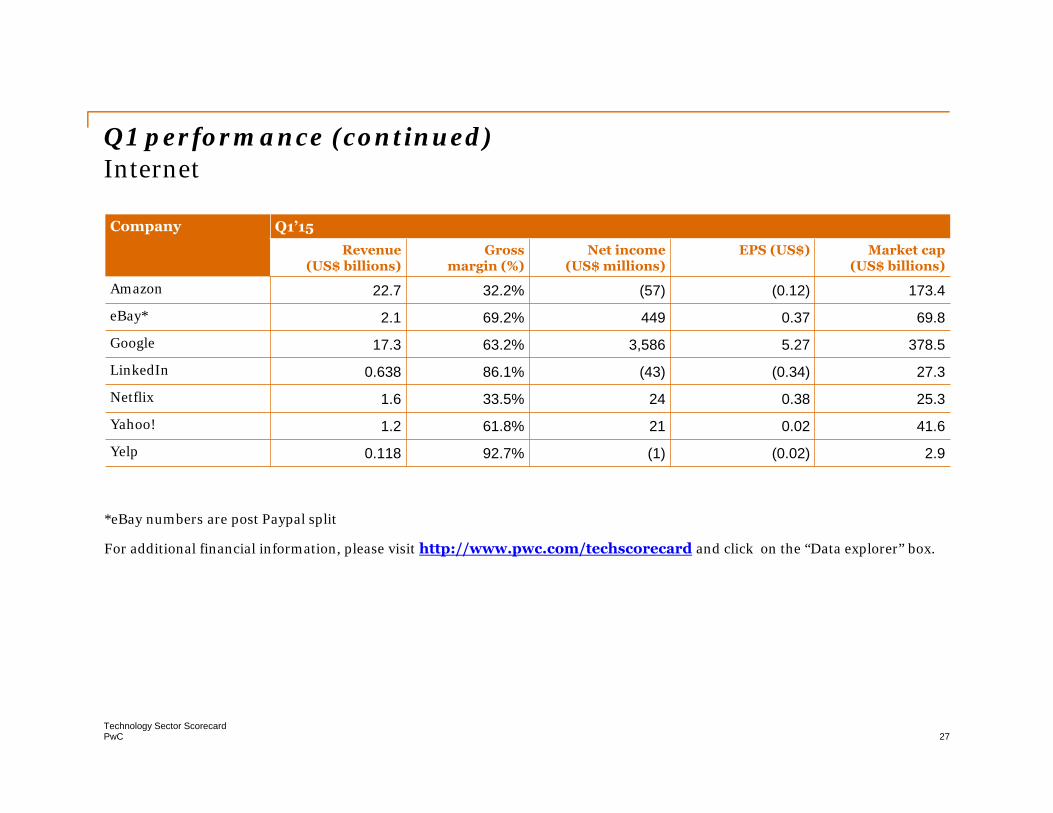
Q1 performance (continued) Internet
Company Q1’15Revenue
(US$ billions)Gross
margin (%)Net income
(US$ millions)EPS (US$) Market cap
(US$ billions)
Amazon 22.7 32.2% (57) (0.12) 173.4
eBay* 2.1 69.2% 449 0.37 69.8
Google 17.3 63.2% 3,586 5.27 378.5
LinkedIn 0.638 86.1% (43) (0.34) 27.3
Netflix 1.6 33.5% 24 0.38 25.3
Yahoo! 1.2 61.8% 21 0.02 41.6
Yelp 0.118 92.7% (1) (0.02) 2.9
*eBay numbers are post Paypal split
For additional financial information, please visit http://www.pwc.com/techscorecard and click on the “Data explorer” box.
PwCTechnology Sector Scorecard
28
Snapshot by subsectorSemiconductors
PwCTechnology Sector Scorecard
29
Market analysisSemiconductors
• Out of the five semiconductor companies tracked, Intel was the only company to report year-over-year revenue growth, posting a 7.2% increase, but net income dropped sharply from the prior quarter by 43.4%. Sequentially, overall revenues declined by 2.1%. For the group as a whole, net income also declined year over year by 3.8% on average and 17.3% sequentially. Applied Materials was the only company with significant quarter-over-quarter growth in profit of 11.9%.
• The global semiconductor industry reported worldwide sales of semiconductors of US$26.1 billion for the month of March 2016, a slight increase of 0.3% compared to the previous month’s total of US$26.0 billion, but importantly, the first increase in five months. Sales from the first quarter of 2016 were US$78.3 billion, down 5.5% compared to the previous quarter and 5.8% lower than the first quarter of 2015. Q1 sales lagged behind last quarter across nearly all regional markets, with the Americas showing the sharpest decline.1
• Regionally, month-to-month sales increased in Japan (4.8%), Asia Pacific/All Other (2.3%) and Europe (0.1%), but fell in China (-1.1%) and the Americas (-2.8%). Compared to the same month last year, sales in March increased in Japan (1.8%) and China (1.3%), but decreased in Asia Pacific/All Other (-6.4%), Europe (-9.8%) and the Americas (-15.8%).1
• A significant 83% of US semiconductor industry sales are into markets outside the US, therefore access to overseas markets is essential to the long-term health of the US semi industry. The Trans-Pacific Partnership, a landmark trade agreement that would lower the barriers to trade with countries in Asia-Pacific, is supported by the US semi industry.1
1. Semiconductors.org, Nov 2015
PwCTechnology Sector Scorecard
30
Market analysis (continued)Semiconductors
• Semiconductor capital spending is projected to decline 2% in 2016, to US$62.8 billion. Although the Q1 2016 forecast has improved from a projected decline of 4.7% in the previous quarter's forecast, the 2% decline in the market for 2016 is still a low point. The forecasted decline is due to excess inventory and weak demand for PCs, tablets and mobile products, resulting in a slowing growth rate that began in late 2015.
• The slowdown in the devices market is only one reason for semiconductor producers to be conservative with their capital spending plans. In addition, the pursuit of semiconductor manufacturing capability by the Chinese government is also impacting spending. In the last year, there has been consolidation as well as merger and acquisition activity with specific offers from various Chinese-based entities, pointing to a dramatically different competitive landscape of global semiconductor manufacturing in the next few years. The market is expected to return to growth in 2017. Increased demand for 10 nanometer (nm) and 3D NAND process development in memory and logic/foundry will drive overall spending to grow 4.4% in 2017.2
2. Gartner.com, Jan 2016
PwCTechnology Sector Scorecard
31
Market analysis (continued) Semiconductors
• Intel reported Q1 2016 revenue of US$13.7 billion, operating income of US$2.6 billion and net income of US$2.0 billion. Net income was 2% higher than Q1 2015, but represented a sharp decline of 43% sequentially. The decline was due to lower revenue and an increase in cost of goods sold. The company generated approximately US$4.0 billion in cash from operations and used US$793 million to repurchase 27 million shares of stock. The acquisition of Altera was completed in Q1 2016. As a result of the Altera acquisition, Intel had acquisition-related charges that were primarily non-cash.
• TSMC reported revenue of US$6.14 billion and net income of US$1.95 billion for Q1 2016. Year over year, revenue decreased 12.8% while net income decreased 22.0%. The decline in net income was due to lower capacity utilization and the adverse impact of the earthquake in February. Compared to Q4 2015, revenue was flat, and net income declined by 12.4%. The earthquake also negatively impacted TSMC’s gross margin by 2.2% and operating margin by 2.4%. Advanced technologies, defined as 28-nanometer and more advanced technologies, accounted for 53% of total wafer revenues.

PwCTechnology Sector Scorecard
32
Q1 performance Semiconductors
Company Q1’16
Revenue(US$ billions)
Grossmargin (%)
Net income/(loss)(US$ millions)
EPS(US$)
Market cap (US$ billions)
Intel 13.7 59.3% 2,046 0.42 153.2
Applied Materials 2.5 41.0% 320 0.29 22.9
Texas Instruments 3.0 60.6% 668 0.65 99.9
TSMC 6.1 44.9% 1,955 0.38 135.9
Qualcomm Inc 5.6 61.4% 1,164 0.78 73.6
Company Q1’15
Revenue(US$ billions)
Grossmargin (%)
Net income/(loss)(US$ millions)
EPS(US$)
Market cap (US$ billions)
Intel 12.8 60.5% 1,992 0.41 152.0
Applied Materials 2.4 41.6% 364 0.29 26.8
Texas Instruments 3.1 57.7% 656 0.61 99.5
TSMC 7.0 49.3% 2,505 0.48 121.7
Qualcomm Inc 6.9 61.9% 1,053 0.63 111.8
For additional financial information, please visit http://www.pwc.com/techscorecard and click on the “Data explorer” box.

PwCTechnology Sector Scorecard
33
Snapshot by subsectorSoftware

PwCTechnology Sector Scorecard
34
Market analysis Software• The software sector had mixed results in Q1 2016 with two companies reporting a marginal decline
and three companies reporting marginal growth in revenue year over year. Adobe reported significant growth of 24.7% year over year to US$1.4bn. Symantec, on the other hand, reported the sharpest decline in revenue of 42.5% to US$873 million. The sector’s total net income was also very volatile this quarter due to acquisition and divestiture activity. Adobe, Intuit and Symantec each more than doubled their net income year over year.
• Worldwide revenues for big data and business analytics is expected to grow from nearly US$122 billion in 2015 to more than US$187 billion in 2019, an increase of more than 50% over the five-year forecast period. The services-related opportunity may account for more than half of all big data and business analytics revenue, with IT Services generating close to three times the annual revenues of Business Services. Software is predicted to be the second largest category, generating more than US$55 billion in revenues in 2019.1
• The industries that present the largest revenue opportunities are Discrete Manufacturing (US$22.8 billion in 2019), Banking (US$22.1 billion), and Process Manufacturing (US$16.4 billion). Large and very large companies will be the primary driver of the big data and business analytics opportunity, generating revenues of more than US$140 billion in 2019. However, small and medium businesses will also remain a significant contributor.1
• Internet of Things (IoT) security spend is also rising. Worldwide spending on IoT security is expected to reach US$348 million in 2016, a 23.7% increase from 2015’s US$281.5 million. Spending on IoT security is expected to reach US$547 million by 2018. Although overall spending will initially be moderate, IoT security market spending will increase at a faster rate after 2020, as
1. IDC.com, May 2016
PwCTechnology Sector Scorecard
35
Market analysis (continued) Software
improved skills, organizational change and more scalable service options improve execution. While the market for IoT security products is currently small, it is growing as both consumers and businesses use connected devices in ever greater numbers. It is forecasted that 6.4 billion connected things will be in use worldwide in 2016, up 30% from 2015, and will reach 11.4 billion by 2018. However, considerable variation exists among different industry sectors as a result of different levels of prioritization and security awareness.2
• From a geographic perspective, more than half of all big data and business analytics revenue is expected to come from the United States. The US market for big data and business analytics solutions is expected to reach more than US$98 billion. The second largest geographic region will be Western Europe, followed by Asia/Pacific (excluding Japan) and Latin America.
• On February 1, 2016 Intuit completed the sale of its Demandforce business. On April 1, 2016 it also completed the sales of its QuickBase and Quicken businesses. The company received US$463 million in cash and reported a US$354 million pre-tax gain on the disposal of these three businesses. The pre-tax gain was partially offset by a related income tax provision of US$178 million. Intuit has progressed well in its move towards cloud. Due to the gradual change in the company's revenue model, there is an anticipated decline in near-term revenue. Intuit also plans to make further enhancements to its tax offerings, which should support future growth. During the third quarter, QuickBooks’ ‘total paying’ Online subscribers (the largest operating segment, contributing approximately 50% of the revenue) grew by 14% sequentially. By replicating its offerings in the cloud, the company is expected to gain more predictable and recurring revenue streams.
2. Gartner.com, April 2016
PwCTechnology Sector Scorecard
36
Market analysis (continued) Software
• Symantec plans to cut 1,200 jobs and close a quarter of its offices in an ambitious move to cut costs. Symantec faces challenges amid a broad migration to next-generation subscription products. In line with Symantec’s previous capital structure plans, the company has returned US$4.2 billion of the previously announced US$5.5 billion capital return program related to the sale of Veritas. The company is expected to return the remaining US$1.3 billion by the end of the current fiscal year. Symantec has said that to support its capital structure plans, it has entered into a US$2 billion credit facility, including a US$1 billion refinancing of revolving credit facility and a new US$1 billion pre-payable term loan.
PwCTechnology Sector Scorecard
37
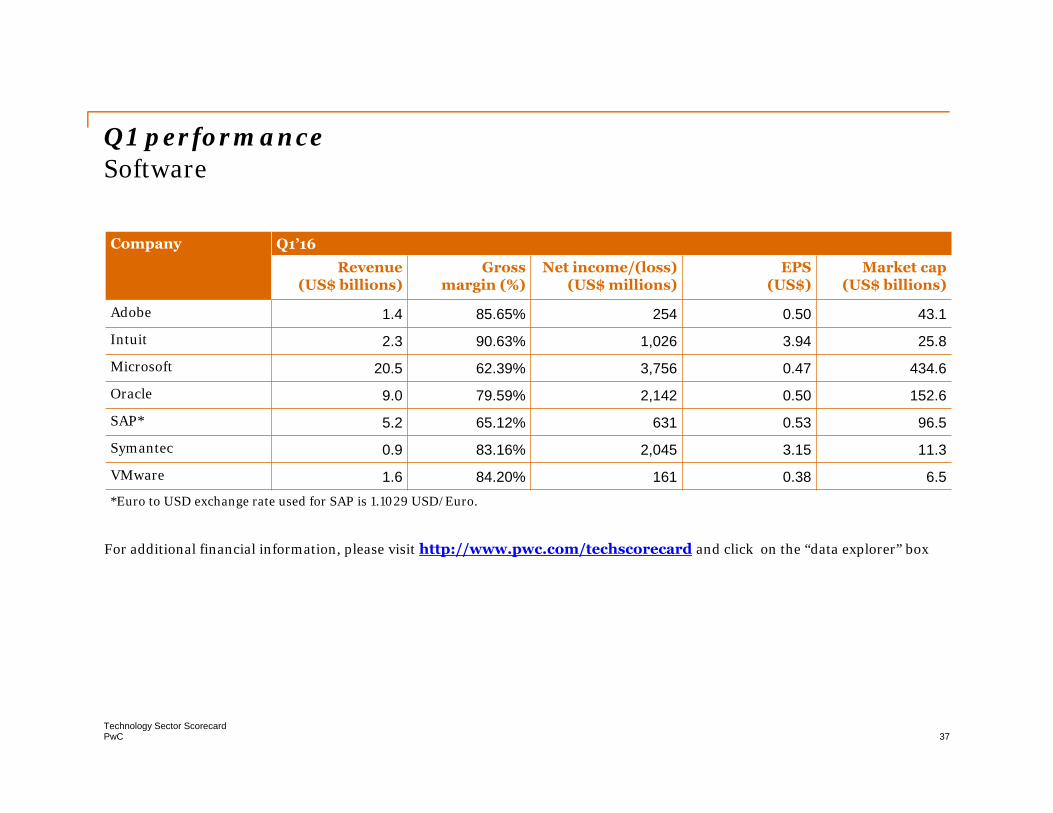
Q1 performance Software
Company Q1’16Revenue
(US$ billions)Gross
margin (%)Net income/(loss)
(US$ millions)EPS
(US$)Market cap
(US$ billions)
Adobe 1.4 85.65% 254 0.50 43.1
Intuit 2.3 90.63% 1,026 3.94 25.8
Microsoft 20.5 62.39% 3,756 0.47 434.6
Oracle 9.0 79.59% 2,142 0.50 152.6
SAP* 5.2 65.12% 631 0.53 96.5
Symantec 0.9 83.16% 2,045 3.15 11.3
VMware 1.6 84.20% 161 0.38 6.5*Euro to USD exchange rate used for SAP is 1.1029 USD/Euro.
For additional financial information, please visit http://www.pwc.com/techscorecard and click on the “data explorer” box
PwCTechnology Sector Scorecard
38
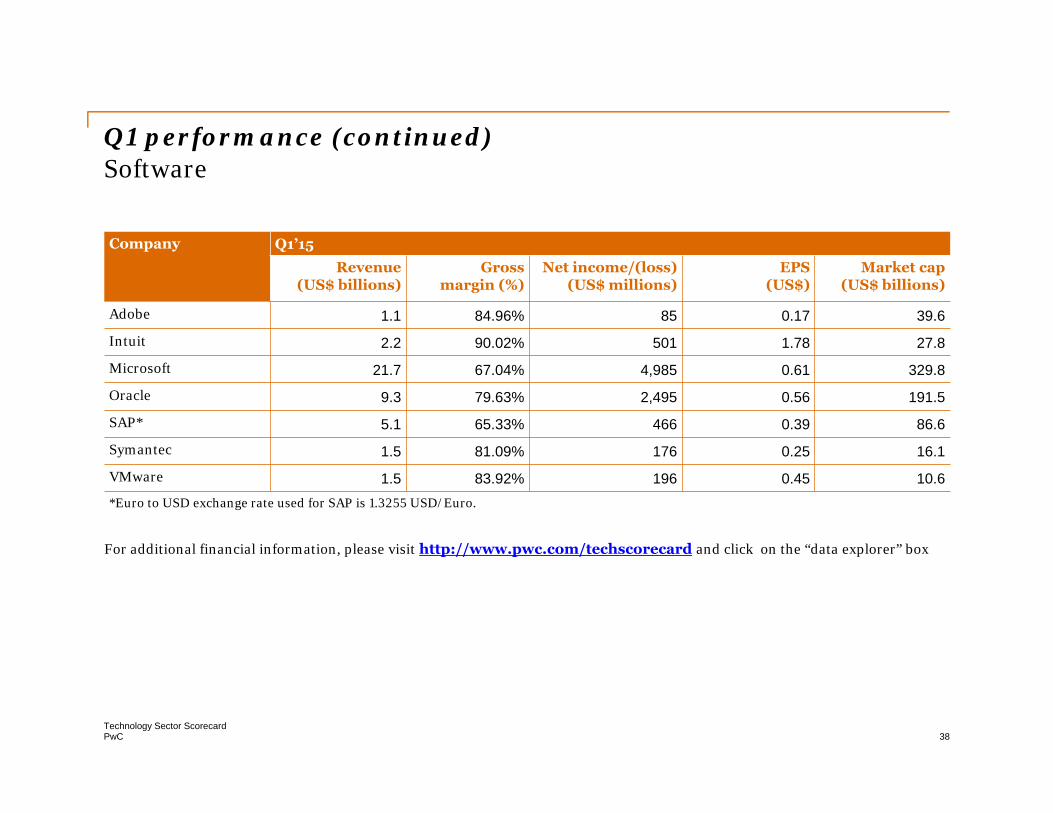
Q1 performance (continued)Software
Company Q1’15Revenue
(US$ billions)Gross
margin (%)Net income/(loss)
(US$ millions)EPS
(US$)Market cap
(US$ billions)
Adobe 1.1 84.96% 85 0.17 39.6
Intuit 2.2 90.02% 501 1.78 27.8
Microsoft 21.7 67.04% 4,985 0.61 329.8
Oracle 9.3 79.63% 2,495 0.56 191.5
SAP* 5.1 65.33% 466 0.39 86.6
Symantec 1.5 81.09% 176 0.25 16.1
VMware 1.5 83.92% 196 0.45 10.6*Euro to USD exchange rate used for SAP is 1.3255 USD/Euro.
For additional financial information, please visit http://www.pwc.com/techscorecard and click on the “data explorer” box
PwCTechnology Sector Scorecard
39
Snapshot by subsectorSoftware Services

PwCTechnology Sector Scorecard
40
• Outsourcing contracts worldwide grew strongly in Q1 2016, both in terms of value and volume, driven by an increase in smaller deals and a record number of contract restructurings. The Q1 2016 Annual Contract Value (ACV) rose by 20%, to US$6.1 billion. The total annual value of smaller deals, below US$40 million, increased 40%, to US$4.1 billion, while the value of restructured contracts soared 48%, to US$2.8 billion. Overall, volume was up 32% versus the prior year, driven by growth in restructurings, up 78%, to a record 173 contracts, and information technology outsourcing (ITO), up 51%, to 301 contracts. The number of high value contracts, worth US$100 million or more, totaled only five for the quarter, down from seven in the prior year.
• In general, 2016 has been a better performer compared to last year, with ACV exceeding US$6 billion. The strong growth in ITO value and volume also indicates that technology solutions are having a positive impact in many areas, even as the emerging trends of work moving to cloud takes shape. The total value of ITO contracts in the first quarter rose 24%, to US$4.2 billion, while the value of business process outsourcing (BPO) deals grew 12%, to US$1.9 billion.1
• EMEA posted ACV of US$2.8 billion, up 19% from the prior year, while contract counts, at 160, were up 28%. Restructuring activity drove the market, with ACV up 115% and volume up 91%, the most active quarter in the last two years. Meanwhile, new scope value dropped 13%, to US$1.5 billion, its lowest level since the third quarter of 2014.
Market analysisSoftware Services
1. The Global ISG (Information Services Group) Outsourcing Index, May 2016
PwCTechnology Sector Scorecard
41
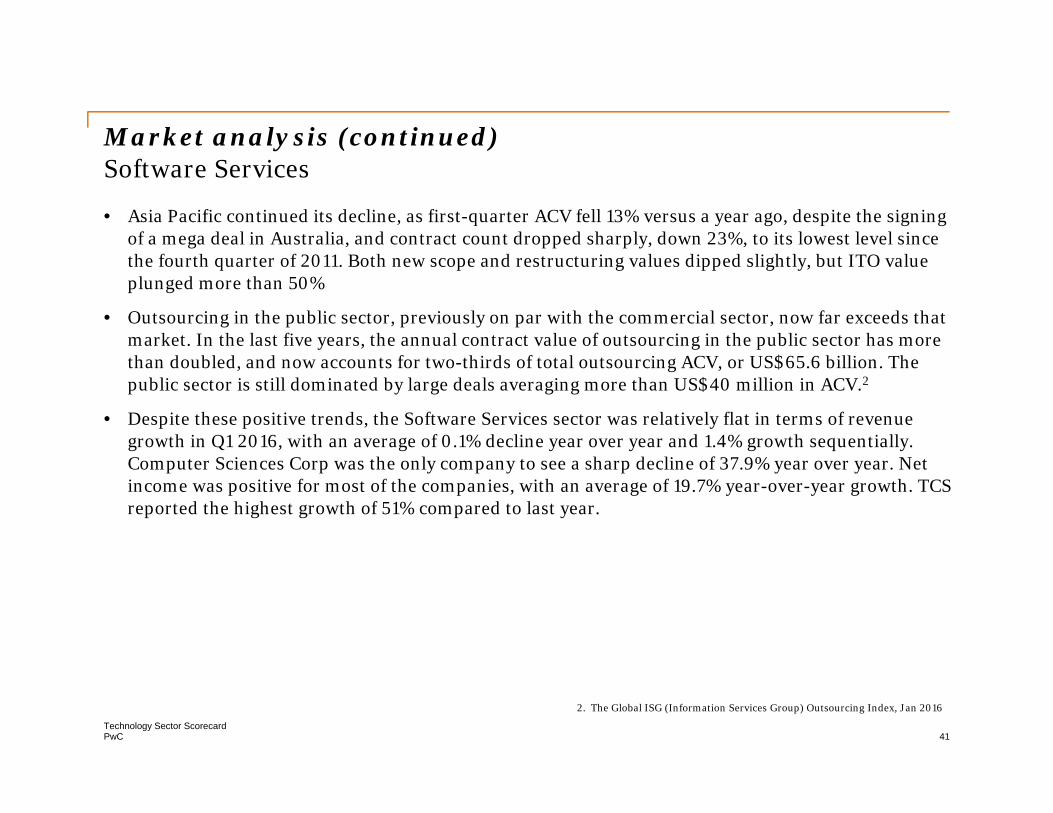
• Asia Pacific continued its decline, as first-quarter ACV fell 13% versus a year ago, despite the signing of a mega deal in Australia, and contract count dropped sharply, down 23%, to its lowest level since the fourth quarter of 2011. Both new scope and restructuring values dipped slightly, but ITO value plunged more than 50%
• Outsourcing in the public sector, previously on par with the commercial sector, now far exceeds that market. In the last five years, the annual contract value of outsourcing in the public sector has more than doubled, and now accounts for two-thirds of total outsourcing ACV, or US$65.6 billion. The public sector is still dominated by large deals averaging more than US$40 million in ACV.2
• Despite these positive trends, the Software Services sector was relatively flat in terms of revenue growth in Q1 2016, with an average of 0.1% decline year over year and 1.4% growth sequentially. Computer Sciences Corp was the only company to see a sharp decline of 37.9% year over year. Net income was positive for most of the companies, with an average of 19.7% year-over-year growth. TCS reported the highest growth of 51% compared to last year.
Market analysis (continued)Software Services
2. The Global ISG (Information Services Group) Outsourcing Index, Jan 2016

PwCTechnology Sector Scorecard
42
• TCS posted unusually strong results in a seasonally weak first quarter, driven by its core portfolios in BFSI, Manufacturing, Retail, Life Sciences and Travel & Hospitality. Revenue for TCS in Q1 2016 was US$4.2 billion, up 2% quarter over quarter and 8% year over year. On a sequential basis, growth during the quarter was led by BFSI (+3.2%), Manufacturing (+3.9%) and Retail (+2.1%) in constant currency. On a year-over-year basis, growth was led by BFSI (+11.8%), Life Sciences (+19.0%), Travel & Hospitality (+18.2%) and Manufacturing (+10.7%) in constant currency. The company’s investments in building high impact digital platforms is also paying off, with 15.5% of total Q1 2016 revenues coming from Digital. In terms of key markets, growth in Q1 2016 was led by Europe (+3.6% quarter over quarter and +10.3% year over year) and North America (+2.4% quarter over quarter and +11.7% year over year) in constant currency. Net income for TCS in Q1 2016 was US$938 million, up 1.3% quarter over quarter and 51% year over year.
Market analysis (continued)Software Services
PwCTechnology Sector Scorecard
43
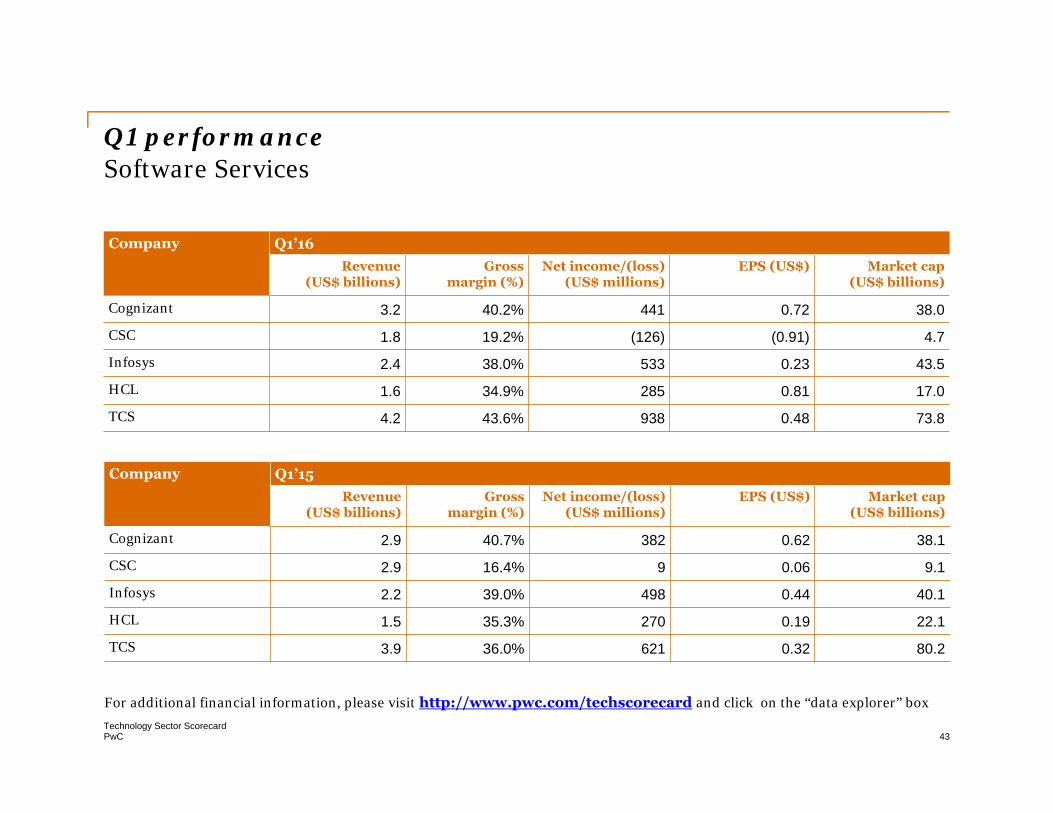
Q1 performanceSoftware Services
Company Q1’16Revenue
(US$ billions)Gross
margin (%)Net income/(loss)
(US$ millions)EPS (US$) Market cap
(US$ billions)
Cognizant 3.2 40.2% 441 0.72 38.0
CSC 1.8 19.2% (126) (0.91) 4.7
Infosys 2.4 38.0% 533 0.23 43.5
HCL 1.6 34.9% 285 0.81 17.0
TCS 4.2 43.6% 938 0.48 73.8
Company Q1’15Revenue
(US$ billions)Gross
margin (%)Net income/(loss)
(US$ millions)EPS (US$) Market cap
(US$ billions)
Cognizant 2.9 40.7% 382 0.62 38.1
CSC 2.9 16.4% 9 0.06 9.1
Infosys 2.2 39.0% 498 0.44 40.1
HCL 1.5 35.3% 270 0.19 22.1
TCS 3.9 36.0% 621 0.32 80.2
For additional financial information, please visit http://www.pwc.com/techscorecard and click on the “data explorer” box
PwCTechnology Sector Scorecard
44
Snapshot by subsector
Systems and PC Hardware

PwCTechnology Sector Scorecard
45
Market analysisSystems and PC Hardware
• The Systems and PC Hardware sector performed poorly in Q1 2016, with an average revenue decline of 21% year on year and 16% sequentially. The sharpest decline in revenue was from HP, which declined 57% year over year to US$11.6 billion. In terms of net income it was a mixed result, with three out of the five companies reporting a decline year over year.
• Worldwide PC shipments totaled 64.8 million units in Q1 2016, a 9.6% decline year over year. Q1 2016 was the sixth consecutive quarter of PC shipment declines, and the first time since 2007 that shipment volume fell below 65 million units. The deterioration of local currencies against the US dollar exacerbated already declining sales. All major regions showed year-over-year PC shipment declines, with Latin America showing the largest drop of 32.4%. The Latin American PC market was primarily impacted by Brazil, where the problematic economy and political instability adversely affected the market. Lower oil prices also negatively impacted PC demand in Latin America and Russia. The ongoing decline in US PC shipments—shipment volume was the lowest in three years—confirmed that the installed base is still declining. PCs are not being adopted in new households at the same ratio as in the past, especially in emerging markets. In these markets, smartphones are now the first choice.1
1. Gartner, April, 2016
PwCTechnology Sector Scorecard
46
Market analysis (continued)Systems and PC Hardware
• Lenovo maintained the top position in worldwide PC shipments in Q1 2016 despite a 7.2% decline in shipments. Lenovo experienced a shipment decline in all regions except North America, where the company's PC units increased 14.6% year over year.1 Lenovo’s continued success is attributable to their complete line of products—from mobile devices through to the data center. Lenovo’s foresight to acquire both the Motorola phone business from Google and the x86 server business and ThinkPad line of notebook computers from IBM has helped the company to act as an IT partner to customers.2
• To generate increased demand, PCs will need to deliver in areas that smartphones and tablets cannot, with larger screens, ergonomic keyboards, greater storage and more powerful computer processors. With an oversaturated market and falling average selling prices, PC vendors must focus on optimizing profitability to sustain growth.2
2. ExtremTech.com, Jan 2016
PwCTechnology Sector Scorecard
47
Market analysis (continued)Systems and PC Hardware
• In company news, EMC shareholders are receiving a portion of their Dell deal payout in the form of VMware stock. EMC has reported gains as VMware share prices increased 13.6% due to better-than-expected Q1 2016 revenue and news of a US$1.2 billion buyback.
• EMC’s Information Storage revenue dropped 6% year over year to US$3.45 billion. Within the segment, product revenue fell by 10% to US$1.96 billion, while services revenue rose marginally to US$1.49 billion. EMC sales were negatively impacted by a higher-than-expected build-up in unshipped storage product orders of approximately US$75 million.
3. prnewswire.com, Oct 2015
PwCTechnology Sector Scorecard
48
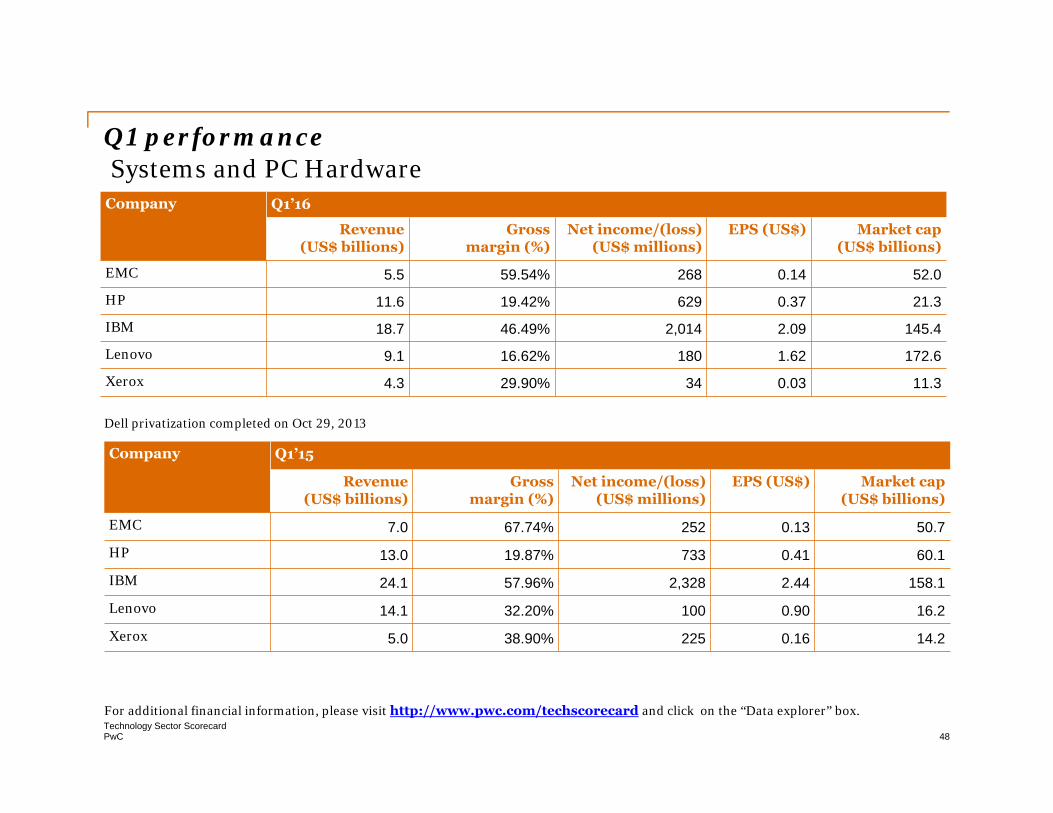
Q1 performance Systems and PC Hardware
Company Q1’16
Revenue(US$ billions)
Grossmargin (%)
Net income/(loss) (US$ millions)
EPS (US$) Market cap (US$ billions)
EMC 5.5 59.54% 268 0.14 52.0
HP 11.6 19.42% 629 0.37 21.3
IBM 18.7 46.49% 2,014 2.09 145.4
Lenovo 9.1 16.62% 180 1.62 172.6
Xerox 4.3 29.90% 34 0.03 11.3
For additional financial information, please visit http://www.pwc.com/techscorecard and click on the “Data explorer” box.
Company Q1’15
Revenue(US$ billions)
Grossmargin (%)
Net income/(loss) (US$ millions)
EPS (US$) Market cap (US$ billions)
EMC 7.0 67.74% 252 0.13 50.7
HP 13.0 19.87% 733 0.41 60.1
IBM 24.1 57.96% 2,328 2.44 158.1
Lenovo 14.1 32.20% 100 0.90 16.2
Xerox 5.0 38.90% 225 0.16 14.2
Dell privatization completed on Oct 29, 2013

PwCTechnology Sector Scorecard
49
Methodology
We analyzed a selection of the largest technology companies included in the S&P 500 index as well as a selection of large international technology companies that regularly report financial results.
In order to present the information by calendar year or calendar quarter, the financial information for companies with non-calendar years or quarters was included in the nearest calendar year or quarter.
We analyzed technology companies that operate predominantly within the following sectors:
• Communications
• Consumer Electronics
• EMS/Distributors
• Internet
• Semiconductors
• Software
• Software Services
• Systems and PC Hardware
PwCTechnology Sector Scorecard
50
Methodology
We analyzed a selection of the largest technology companies included in the S&P 500 index as well as a selection of large international technology companies that regularly report financial results.
In order to present the information by calendar year or calendar quarter, the financial information for companies with non-calendar years or quarters was included in the nearest calendar year or quarter.
We analyzed technology companies that operate predominantly within the following sectors:
• Communications
• Consumer Electronics
• EMS/Distributors
• Internet
• Semiconductors
• Software
• Software Services
• Systems and PC Hardware
PwCTechnology Sector Scorecard
51
Technology industry leadersRaman ChitkaraGlobal Technology LeaderPhone: +1 408 817 3746Email: [email protected]
Rod Dring – Australia Werner Ballhaus – Germany Yury Pukha – RussiaPhone: +61 2 8266 7865Email: [email protected]
Phone: +49 211 981 5848Email: [email protected]
Phone: +7 495 223 5177Email: [email protected]
Estela Vieira – Brazil Sandeep Ladda – India Mark Jansen – SingaporePhone: +55 1 3674 3802Email: [email protected]
Phone: 91 22 6689 1444Email: [email protected]
Phone: +65 6236 7388Email: [email protected]
Christopher Dulny– Canada Masahiro Ozaki– Japan Philip Shepherd ― UAEPhone: +416 869 2355Email: [email protected]
Phone: +81 3 5326 9090Email: [email protected]
Phone: +97 1 43043501Email: [email protected]
Jianbin Gao – China & Hong Kong Hoonsoo Yoon – Korea Jass Sarai – UKPhone: +86 21 2323 3362Email: [email protected]
Phone: +82 2 709 0201Email: [email protected]
Phone: +44 0 1895 52 2206Email: [email protected]
Pierre Marty – France Ilja Linnemeijer – The Netherlands Pierre-Alain Sur – USPhone: +33 1 5657 5815Email: [email protected]
Phone: +31 88 792 4956Email: [email protected]
Phone: +1 646 471 6973Email: [email protected]

We exercised reasonable professional care and diligence in the collection, processing and reporting of this information. However, the data used is from third-party sources and PricewaterhouseCoopers has not independently verified, validated or audited the data. PricewaterhouseCoopers makes no representations or warranties with respect to the accuracy of the information, nor whether it is suitable for the purposes to which it is put by users.
PricewaterhouseCoopers shall not be liable to any user of this report or to any other person or entity for any inaccuracy of this information or any errors or omissions in its content, regardless of the cause of such inaccuracy, error or omission.
Furthermore, in no event shall PricewaterhouseCoopers be liable for consequential, incidental or punitive damages to any person or entity for any matter relating to this information.
© 2016 PricewaterhouseCoopers LLP. All rights reserved. In this document, “PwC” refers to PricewaterhouseCoopers LLP, which is a member firm of PricewaterhouseCoopers International Limited, each member firm of which is a separate legal entity.
pwc.com/techscorecard