pwc.com/techscorecard technology sector scorecard · since fundamentals have remained strong, ......
TRANSCRIPT

Technology SectorScorecardQ1 2015
pwc.com/techscorecard

PwCTechnology Sector Scorecard
2
Q1 2015 Executive summary

PwCTechnology Sector Scorecard
3
Q1 2015 Executive summary
• First-quarter financial results were mixed in the technology sector with Internet, Software and Semiconductor subsectors outperforming Communications, Consumer Electronics, and Systems and PC Hardware. Though guidance was conservative overall, the strong dollar created revenue challenges for most US-based companies, tech and non-tech alike. However, earnings generally remained in line for tech companies. Since fundamentals have remained strong, the market has shrugged off the currency impact. Nevertheless, companies are reassessing cost structure, pricing and product mix to enhance margin and offset currency fluctuations.
• Geographically, North America produced the strongest growth, followed by Western Europe and Asia-Pacific. Most companies showed year-over-year growth, but sequential performance took a dip as the first quarter is traditionally a slow quarter. M&A activity continued in full steam, with 73 technology deals valued at $22.3bn in the first quarter. Though deal volume was high, mega deals were scarce owing in large part to the domination of deals in the Software sector. Cross-border deals saw an uptick. US acquirers led with investments in Europe.
• Factors such as weak international currencies against the US dollar and geopolitical unrest across multiple regions were unfavorable for business. However, the situation has been steadily improving, boosted by inter-governmental participation to mitigate geopolitical unrest and quantitative easing measures initiated by several governments. This was strongly reflected in the VIX Index, which showed a downward trend during the quarter. Although the VIX price reached a
Strong dollar created revenue challenges for US-based companies but earnings generally remained in line

PwCTechnology Sector Scorecard
4
quarterly high of 22.39 in mid-January, it quickly dropped to 13.04 in early-March, shedding as much as 42% in just 45 days. Since March 31 it’s remained in a trading range between roughly 12 and 15.
• Macroeconomic factors for the tech industry in the first quarter were weak, with the biggest consumer—the US economy—expanding by only 0.2% against a forecast of 1%. Although the economy bounced back after a similar slowdown in the first quarter of 2014, the strong US dollar is weighing on exports and there is weakness in Asia.1 In contrast, the Eurozone grew by 0.4% against a forecast of 0.5%, posting its fastest rate in almost two years and outpacing the US.2 In Asia, China grew at its slowest pace in six years and weakness in key sectors suggested that the world's second-largest economy was still losing momentum. GDP grew at 7% in Q1 2015, slowing from 7.3% in Q4 2014.3 In contrast, Japan expanded by 2.4% against a forecast of 1.5%, indicating that it may be headed toward a path of steady growth.2 India's GDP advanced 7.5% year on year in the first quarter of 2015, up from a downwardly revised growth of 6.6%.
• In contrast to the negative macroeconomic factors, the PMI (Purchasing Managers Index) remained above 50% in the first quarter, indicating growth in manufacturing for the 28th consecutive month. US markets have also remained strong, with the Dow Jones Industrial Average breaking the 18,200 level in early March and then the 18,300 level in mid-May. Against this backdrop, the technology sector recorded 23 new IPOs in Q1 2015, slightly less than the 26 IPOs recorded in Q1 2014. First-quarter proceeds were the second-highest amongst all first quarters since 2010, at US$6.1bn.4
1. International Business Times, April 20152. CNBC, May 20153. Reuters, April 20154. Q1 Global Tech IPO Review, PwC
Q1 2015 Executive summary (continued)

PwCTechnology Sector Scorecard
5
• Worldwide IT spending is currently expected to shrink 1.3% on an annual basis, from US$3.71trn in 2014 to US$3.66trn in 2015. Data center system spending is projected to reach US$142bn in 2015, an increase of just 0.4% from 2014. While external controller-based storage, enterprise network equipment and servers have been impacted by the depreciation of several currencies against the USD, the server segment has seen the biggest impact due to greater pricing pressure and lower margins. Growth in spending on telecom services in 2015 is expected to shrink by 2.6%, from US$1.61trn in 2014 to US$1.57trn in 2015.5
• The market for the Internet of Things is expected to grow 19% in 2015 with the digital signage market projected to be a major driver of growth. Thanks to growing use in the retail market, this area of IoT is expected to grow from US$6bn in 2013 to US$27.5bn in 2018, representing a 35.7% five-year compound annual growth rate (CAGR). While certain segments of the consumer market are seeing some IoT infiltration, and companies are starting to collect data based on sensors, there are still a number of contentious security and privacy issues to be addressed.6
5. Gartner, April 20156. IDC, March 2015
Q1 2015 Executive summary (continued)

PwCTechnology Sector Scorecard
6
Source: ISM
55.1
53.9
52.6
51.0
50.8 52
.951
.0
51.4 54
.6 58.2
56.2
54.4 57
.0 61.0
56.4
51.0 52
.453
.352
.750
.350
.6 52.9
50.2
55.8
56.5
53.7 55
.2 57.6
56.9
52.6
30
35
40
45
50
55
60
651Q
062Q
063Q
064Q
061Q
072Q
073Q
074Q
071Q
082Q
083Q
084Q
081Q
092Q
093Q
094Q
091Q
102Q
103Q
104Q
101Q
112Q
113Q
114Q
111Q
122Q
123Q
124Q
121Q
132Q
133Q
134Q
131Q
142Q
143Q
144Q
14Q
115
Quarter
Recession Threshold (42.7)
The Purchasing Manager’s Index decreased by 4.3 percentage points from 56.9% in Q4’14 to 52.6% this quarter. However, since PMI® in Q1’15 was above 50%, it indicates that even though manufacturing contracted sharply quarter on quarter, the sector continued to grow. Manufacturing expanded in April and May as the PMI® registered 51.5% and 52.8%, respectively, indicating growth in manufacturing for the 28th consecutive month.
US Purchasing Manager’s Index (PMI) trends (Q1’06-Q1’15)
PwCTechnology Sector Scorecard
7
Snapshot by subsector
Communications

PwCTechnology Sector Scorecard
8
Market analysisCommunications
• The Communications market witnessed a continuing decline in the first quarter of 2015, in which all the companies tracked reported double-digit sequential decline compared to the previous quarter. The steepest sequential decline was reported by Ericsson, whose revenue fell by 35.3%. On a year-over-year basis, Motorola Solutions witnessed a revenue decline of 32.1%, the highest among Communications companies.
• Geographically, growth in Communications was primarily driven by mobile broadband and network equipment installations in China, India and the Middle East. Growth in North America was slow as telecom operators remained focused on cash flow optimization in order to finance major acquisitions and spectrum auctions. Most companies managed to fight slow growth in North America via earlier inorganic expansions. In Europe, the Communications market declined, but was partially offset by good growth seen in Italy and Russia. In contrast, the Latin American Communications market declined, dragged down by poor performance in Brazil. 1, 2
• Growth in spending on telecom services in 2015 is expected to shrink by 2.6%, from US$1.61trn in 2014 to US$1.57trn in 2015. 3
1. FierceWireless, April 20152. WirelessWeek, May 20153. Gartner, April 2015

PwCTechnology Sector Scorecard
9
Market analysis (continued)Communications• Motorola’s US$1.2bn revenue in Q1 2015 saw a year-over-year decline of 32.1% against US$1.8bn
in Q1 2014 due to the sale of its Enterprise segment in 2014. On a pro-forma basis, revenue was flat. Although the North American business grew by US$43mn, growth was offset by unfavorable foreign currency fluctuations of US$40mn, primarily within Europe, Africa and Asia-Pacific. The Products segment grew 1% year over year, from US$752mn in Q1 2014 to US$758mn in Q1 2015. On a geographic basis, revenue increased in North America and the Middle East, and declined in Latin America, Europe, Africa and Asia-Pacific.
• Ericsson’s revenue in Q1 2015 reached US$6.4bn, a year-over-year decline of 12% against US$7.3bn in Q1 2014 and a quarter-over-quarter decline of 35.3% against US$9.9bn in Q4 2014. However, in terms of its reporting currency, the SEK, revenue witnessed a year-over-year rise of 13% and a quarter-over-quarter decline of 21%. The difference can be attributed to seasonality and a rising USD against the SEK, which greatly reduced earnings expressed in USD. During the quarter, the highest revenue growth was witnessed in Global Services (+17%) and Support Solutions (+11%). The fast pace of 4G deployments in China continued to stimulate earnings. However, revenue was hampered by slow growth in the North American mobile broadband business as operators remained focused on cash flow optimization in order to finance major acquisitions and spectrum auctions. Ericsson also faced cost escalations, with net margins of 2.7% in Q1 2015, compared to 3.6% in Q1 2014 and 6.2% in Q4 2014. Net income of US$174.6mn in Q1 2015 dipped 32.9% against US$260.2mn in Q1 2014 and 71.7% against US$617.4mn in Q4 2014.

PwCTechnology Sector Scorecard
10
Market analysis (continued)Communications• Nokia has agreed to buy Alcatel-Lucent in a US$16.6bn (€15.6bn) all-stock deal likely to close in
the first half of 2016. It has also initiated a review of strategic options for its HERE business, including a potential divestment. The company’s Q1 2015 revenue totaled US$3.6bn, a year-over-year decline of 1.6% against US$3.7bn in Q1 2014 and a quarter-over-quarter decline of 28.6% against US$5.1bn in Q4 2014. However, in terms of its reporting currency, the EUR, revenue witnessed a year-over-year rise of 20% and a quarter-over-quarter decline of 16%. The year-over-year rise was primarily due to higher revenue in Nokia Networks, Nokia Technologies and HERE. The sequential decline was primarily due to seasonally lower net sales in Nokia Networks and HERE. Nokia Technologies in particular posted a 103% year-over-year rise and a 79% sequential rise in revenue due to intellectual property-related income. Nokia’s net income of US$199.7mn in Q1 2015 jumped 163.4% against US$(314.9)mn in Q1 2014 due to an adjustment of loss from discontinued operations (the Devices & Services business, which was sold off to Microsoft) in Q1 2014. On a pro-forma basis, net income rose 65% year on year in reporting currency.

PwCTechnology Sector Scorecard
11
Q1 performanceCommunications
Company Q1’15Revenue
(US$ billions)Gross margin
(%)Net income/(loss)
(US$ millions)EPS (US$) Market cap
(US$ billions)
Cisco Systems Inc 12.1 62.0% 2,437 0.47 147.2
LM Ericsson* 6.4 35.4% 175 0.05 42.2
Motorola Solutions Inc 1.2 44.8% 74 0.40 13.2
Nokia Corp** 3.6 42.5% 200 0.06 29.1
* SEK to USD exchange rate used for Ericsson is 0.1201 USD/SEK.
**EUR to USD exchange rate used for Nokia is 1.1283 USD/EUR.
For additional financial information, please visit http://www.pwc.com/techscorecard and click on the “Data explorer” box.
Company Q1’14Revenue
(US$ billions)Gross margin
(%)Net income/(loss)
(US$ millions)EPS (US$) Market cap
(US$ billions)
Cisco Systems Inc 11.5 60.7% 2,181 0.42 119.4
LM Ericsson* 7.3 36.5% 260 0.10 43.1
Motorola Solutions Inc 1.8 46.9% 127 0.49 16.3
Nokia Corp** 3.7 45.7% (315) (0.08) 27.3
* SEK to USD exchange rate used for Ericsson is 0.1547 USD/SEK.
**EUR to USD exchange rate used for Nokia is 1.3702 USD/EUR.

PwCTechnology Sector Scorecard
12
Snapshot by subsector
Consumer Electronics

PwCTechnology Sector Scorecard
13
Market analysisConsumer Electronics• The Consumer Electronics industry saw a sharp decline in the first quarter of 2015, with most
companies showing negative results compared to the fourth quarter of the previous year. Most of the companies under study reported double-digit declines both sequentially and year over year. One notable exception is Apple, which posted a double-digit sequential decline, as a result of the release of iPhone 6 in November 2014 as well as a strong dollar, but a double-digit gain year over year.
• Following a record high in February, consumer sentiment toward the overall economy slipped slightly in March. The Consumer Electronics Association Index of Consumer Expectations (ICE), which measures consumer expectations about the broader economy, decreased 2.8 points from February to 178.4 in March. However, this is the highest ICE value recorded for the month of March since the Consumer Electronics Association Index began tracking in 2007, surpassing 173.6 in March 2012. Moreover, the ICE value of March 2015 is 4.8% higher than the 170.2 recorded in March 2014—the highest year-over-year increase for the month since the index began tracking in 2007.1
• The Consumer Electronics Association Index of Consumer Technology Expectations (ICTE), which measures consumer expectations about technology spending, fell 5.4 points from February to reach 89.5 in March. This is likely due to the end of the holiday season last quarter, coupled with the expectation that winter weather will affect businesses.1
• Despite poor performance by companies during the quarter and falling consumer sentiment for technology products, the Consumer Electronics industry in 2015 is expected to reach US$286bn in terms of manufacturer sales to the retail channel.2 Growth will likely be spearheaded by new products, such as smart watches. The revenue from smart watches alone is expected to exceed US$3.1bn in 2015, growing 474% over 2014.2
1. Consumer Electronics Association, March 20152. Consumer Electronics Association, April 2015

PwCTechnology Sector Scorecard
14
Market analysis (continued)Consumer Electronics
• Apple’s Q1 2015 revenue of US$58.0bn rose 27.1% year over year against US$45.6bn in Q1 2014, but slid 22.2% quarter over quarter against US$74.6bn in Q1 2015. The sequential decline can be attributed to seasonal changes (sales in the December quarter are higher due to the holiday season) and exchange rate risk (an appreciating USD hurt earnings realized in foreign currencies). In terms of regions, Greater China performed the best, growing 71% against the same quarter last year and 4% against the previous quarter. Japan performed the poorest, showing both year-over-year and quarter-over-quarter declines (-15% and -37%, respectively). In terms of business segments, Services—which includes iTunes Store, App Store and Apple Pay, among others—performed the best, growing 9% against the same quarter last year and 4% against the previous quarter. The segments showing both year-over-year and quarter-over-quarter declines were iPad and Other Products (which includes iPod, Apple TV and Beats Electronics, among others). iPad revenues fell 29% year over year and 40% quarter over quarter.
• Philips’ revenue in Q1 2015 reached US$6.0bn, a year-over-year decline of 12.7% against US$6.9bn in Q1 2014 and a quarter-over-quarter decline of 26.2% against US$8.2bn in Q4 2014. However, in terms of its reporting currency, the EUR, revenue witnessed a year-over-year rise of 13.8% and a quarter-over-quarter decline of 18.3%. The difference can be attributed to the falling EUR against the USD, which greatly reduced earnings expressed in USD. Philips also faced cost escalations, with net margin in US dollar terms standing at just 1.9% in Q1 2015, compared to 2.7% in Q1 2014 and 2.1% in Q4 2014. Net income of US$112.8mn in Q1 2015 dipped 40.1% against US$188.4mn in Q1 2014 and 32.6% against US$167.4mn in Q4 2014.

PwCTechnology Sector Scorecard
15
Market analysis (continued)Consumer Electronics
• Sony’s performance during the quarter was dragged down by lower revenue from mobiles, PS4 hardware, cameras, audio and video equipment, and theatrical and home entertainment. However, revenue was boosted by network services, televisions, image sensors for mobile devices and recorded music. First-quarter revenue of US$16.2bn declined 11.1% year over year against US$18.2bn in Q4 2014 and 23.6% quarter over quarter against US$21.2bn in Q4 2014. In terms of Sony’s reporting currency, the JPY, revenue witnessed a year-over-year rise of 3.6% and a quarter-over-quarter decline of 23.6%. The sequential decline can be attributed to seasonal changes (sales in the December quarter are higher due to the holiday season). For the year-over-year comparison, even though revenue increased in terms of JPY, a falling JPY against the USD for the quarter greatly reduced earnings when expressed in USD. Sony also reported US$73mn in PC exit costs, US$72mn of impairment charges and US$536mn of restructuring charges for the quarter. As a result, it reported a net loss of US$890mn against a net profit of US$736mn in the previous quarter.

PwCTechnology Sector Scorecard
16
Q1 performance Consumer ElectronicsCompany Q1’15
Revenue(US$ billions)
Grossmargin (%)
Net income /(loss)(US$ millions)
EPS(US$)
Market cap (US$ billions)
Apple Inc 58.0 40.8% 13,569 2.33 723.0
Canon Inc 7.2 51.2% 285 0.26 38.6
Philips* 6.0 39.6% 113 0.12 25.8
Sony Corp 16.1 33.1% (890) (0.76) 31.3
Toshiba Corporation** N/A N/A N/A N/A N/A
*EUR to USD exchange rate used for Philips is 1.283 USD/EUR.
** Toshiba has declared an indefinite delay in earnings release due to an impending investigation of accounting policies.
For additional financial information, please visit http://www.pwc.com/techscorecard and click on the “Data explorer” box.
Company Q1’14
Revenue(US$ billions)
Grossmargin (%)
Net income /(loss)(US$ millions)
EPS(US$)
Market cap (US$ billions)
Apple Inc 45.6 39.3% 10,223 11.62 482.8
Canon Inc 8.4 49.7% 462 0.41 34.8
Philips* 6.9 40.2% 188 0.21 32.1
Sony Corp 18.2 30.5% (1,342) (1.29) 19.8
Toshiba Corporation 19.1 26.4% 118 0.03 18.0
*EUR to USD exchange rate used for Philips is 1.3702 USD/EUR.

PwCTechnology Sector Scorecard
17
Snapshot by subsector
EMS/Distributors

PwCTechnology Sector Scorecard
18
Market analysis EMS/Distributors
• In 2014, combined sales of the top 50 EMS providers reached nearly US$265bn. While not all of this revenue is pure EMS—there is some ODM and other non-EMS business—it is a clear indication of how much OEMs now depend on the EMS industry. The combined 2014 sales of the top 50 EMS companies increased 4.0% from the previous year. This result should not be surprising, given Apple’s launch of the iPhone 6 and the iWatch series, which increasingly contributed to revenue for a few EMS providers.1
• There were four completed M&A transactions in the EMS industry during Q1 2015. These include Summit Equity Group's acquisition of Niche Electronics Technologies Inc. (March), Season Group USA's acquisition of Xytronics Ltd (March), Cyient Limited's acquisition of Rangsons Electronics Pvt Ltd (February) and Corridor Capital's acquisition of Circuitronics Inc. (January).2
• EMS consolidations were down from last quarter, representing one, or 25% of Q1 2015 transactions, compared to two in Q4 2014. On a comparative basis, this is down significantly from the six EMS consolidations in Q1 2014.2
• There was one vertical/horizontal convergence in Q1 2015, down from three in Q4 2014 and also down on a comparative basis from the three reported in Q1 2014. Vertical/horizontal convergences have continued in recent quarters as companies outside of the “pure play” EMS industry have renewed their interest in EMS and expanded horizontally.2
1. Manufacturing Market Insider, March 2015
2. I-Connect007, May 2015

PwCTechnology Sector Scorecard
19
Market analysis (continued) EMS/Distributors
• In the next five years, the mobile phone market is expected to have the highest growth potential in the EMS and ODM industry. The success of Xiaomi, a company that focuses on marketing and brand promotion while entirely outsourcing manufacturing to its contract vendors, propels EMS and ODM services. Xiaomi's success has led a large number of mobile phone companies to follow suit, which opens a wide space for EMS and ODM vendors. Samsung and LG may commission EMS and ODM vendors to partially conduct manufacturing. The EMS and ODM market for communication terminals is expected to jump from US$30.8bn in 2013 to US$35.2bn in 2017.
• In the global EMS and ODM industry, there are about 300-350 companies with high industrial concentration. The top eight enterprises have about 81% of market share and serve large customers. Accordingly, medium-sized enterprises find it hard to see growth. About 75% of EMS and ODM vendors globally are Taiwanese companies represented by Hon Hai, Quanta, Pegatron, Compal, Wistron, Inventec, New Kinpo and Universal Scientific Industrial (ASE)3
3. PR Newswire, March 2015

PwCTechnology Sector Scorecard
20
Market analysis (continued) EMS/Distributors
• Arrow Electronics reported Q1’15 net income of US$106.1mn compared with net income of US$107.1mn in the first quarter of 2014. In Non-GAAP terms the first quarters’ of 2015 and 2014 net income would have been US$127.8mn in the first quarter of 2015, compared with net income of US$124.0mn in 2014. First-quarter revenues, adjusted for the impact of acquisitions and changes in foreign currencies, increased 3% year over year. First-quarter revenues declined by 2%, to US$5bn, from revenues of US$5.08bn in the prior year. Components sales in the Americas were flat year over year. European components sales grew 10% year over year on a constant currency basis. Sales in the region, as reported, declined 7% year over year after including the impact of foreign exchange rates. Global enterprise computing solutions segment’s Americas sales grew 8% year over year. European sales grew 8% on an as-adjusted basis. First-quarter cash flow from operations was a negative US$242mn.
• Flextronics’ net sales for the quarter ending March 31, 2015 were just under US$6.0bn. Despite lower revenues, adjusted operating income only decreased US$4.0mn compared to the same quarter last year, with operating margins improving by 30 basis points to 3.0% from 2.7%. Flextronics’ adjusted income grew 8% to US$157mn for the quarter. In other news, Flextronics has entered into a definitive agreement to acquire Mirror Controls International (MCi) from private equity firm Egeria in an all-cash transaction valuing its share capital at €457mn (US$494mn). MCi is a global manufacturer of glass and power-fold mirror actuators in the automotive market and generated approximately €200mn (US$216mn) in LTM revenue, growing over 20% year over year.
PwCTechnology Sector Scorecard
21
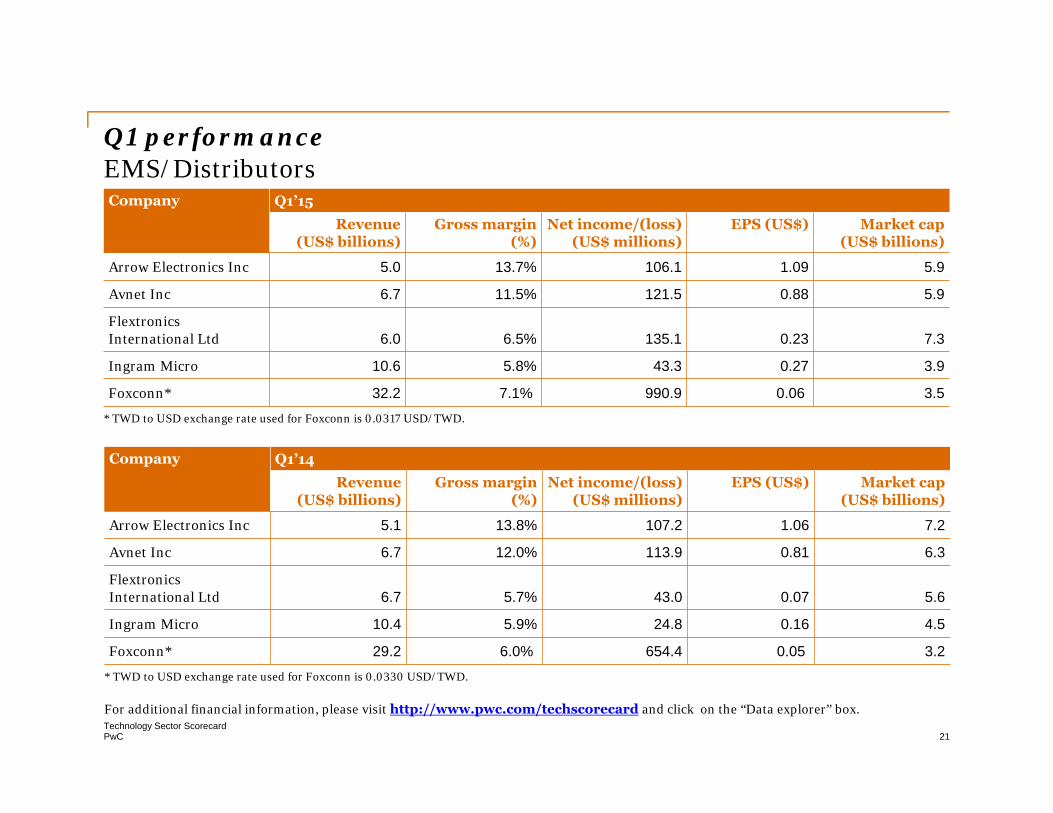
Q1 performanceEMS/DistributorsCompany Q1’15
Revenue(US$ billions)
Gross margin (%)
Net income/(loss)(US$ millions)
EPS (US$) Market cap (US$ billions)
Arrow Electronics Inc 5.0 13.7% 106.1 1.09 5.9
Avnet Inc 6.7 11.5% 121.5 0.88 5.9
Flextronics International Ltd 6.0 6.5% 135.1 0.23 7.3
Ingram Micro 10.6 5.8% 43.3 0.27 3.9
Foxconn* 32.2 7.1% 990.9 0.06 3.5
* TWD to USD exchange rate used for Foxconn is 0.0317 USD/TWD.
Company Q1’14Revenue
(US$ billions)Gross margin
(%)Net income/(loss)
(US$ millions)EPS (US$) Market cap
(US$ billions)
Arrow Electronics Inc 5.1 13.8% 107.2 1.06 7.2
Avnet Inc 6.7 12.0% 113.9 0.81 6.3
Flextronics International Ltd 6.7 5.7% 43.0 0.07 5.6
Ingram Micro 10.4 5.9% 24.8 0.16 4.5
Foxconn* 29.2 6.0% 654.4 0.05 3.2
* TWD to USD exchange rate used for Foxconn is 0.0330 USD/TWD.
For additional financial information, please visit http://www.pwc.com/techscorecard and click on the “Data explorer” box.

PwCTechnology Sector Scorecard
22
Snapshot by subsectorInternet

PwCTechnology Sector Scorecard
23
Market analysisInternet
• Most tracked Internet companies ended Q1 2015 with a year-over-year revenue growth of more than20%, but sequentially revenue stayed the same. Compared to the previous quarter, net incomeslightly declined for all tracked companies in Q1 2015, likely due to the end of the holiday season in2014.
• Smart cities represent a great revenue opportunity for technology and services providers (TSPs). Itis forecasted that 1.1 billion connected devices will be used by smart cities in 2015, rising to 9.7billion by 2020. Smart homes and smart commercial buildings will represent 45% of the totalconnected devices in use in 2015 and this is forecasted to increase to 80% in 2020.1
• The market for the Internet of Things, which includes everything from Nest thermostats, to dishwashers, to heart monitors—is expected to grow 19% in 2015. The digital signage market is projected to be a major driver of growth and is expected to grow from US$6bn in 2013 to US$27.5bn in 2018, representing a 35.7% five-year compound annual growth rate (CAGR). While certain segments of the consumer market are seeing some IoT infiltration and companies are starting to collect data based on sensors, there are still a number of contentious security and privacy issues that need to be worked out. In the United States, the hottest market is expected to be in connected vehicles, with nearly 35% year-over-year growth anticipated in 2015.2
1. Gartner, April 20152. IDC.com, March 2015

PwCTechnology Sector Scorecard
24
Market analysis (continued)Internet
• LinkedIn announced that it has agreed to acquire online professional development company, Lynda.com, for roughly US$1.5bn in stock and cash. Lynda.com is a subscription service platform providing access to online courses taught by industry experts. LinkedIn reported revenue of US$638mn in Q1 2015, a 35% increase compared to US$473mn in Q1 2014. Net loss for Q1 2015 was US$43mn, compared to net loss of US$13mn from the first quarter in 2014. Revenue from the US totaled US$389mn, growing 0.3% sequentially against US$388mn in Q4 2014 and 37% year over year against US$285mn in Q1 2014. As a percentage of total revenue, US revenue stood at 61%, marginally higher than the 60% achieved in both the previous quarter and the first quarter of the previous year. Revenue from the international market totaled US$248mn, dipping 2.7% sequentially against US$255mn in Q4 2014 and growing 32% year on year against US$188mn in Q1 2014.
• In Q1 2015, Yelp acquired Eat24, a US food delivery business, giving Yelp more contact points with restaurants. Users will now have the ability to order their food and have it brought to them wherever they are. Yelp delivered topline growth of 55% year over year as local businesses increasingly adopted performance-based advertising, and in the first quarter, cost-per-click advertisers represented approximately 40% of local advertising revenue, an increase from 32% in the fourth quarter of 2014. With 92% growth in adjusted EBITDA year over year, it is expected to grow its business through the rest of the year. Net loss in the first quarter of 2015 was US$(1.3)mn, compared to a net loss of US$(2.6)mn, or $(0.04) per share, in the first quarter of 2014.

PwCTechnology Sector Scorecard
25
Market analysis (continued)Internet
• Netflix acquired a record 4.9 million new members globally in Q1 2015, compared to the 4.0 million of the first quarter of 2014, bringing the total global streaming membership to 62.3 million. In the US, the company gained 2.3 million new members, well above the expected 1.8 million due to both acquiring and retaining more members than forecasted. Internationally, Netflix acquired 2.6 million members in Q1 2015. The strong growth in the US was due to improved content, including the launch of the third season of House of Cards and new shows Unbreakable Kimmy Schmidt and Bloodline. In Q1 2015, higher-than-forecasted net adds and US revenue, coupled with lower-than-forecasted content spending, resulted in a US contribution margin of 31.7%. In 2015, the company forecasts improved margins because they expect a greater share of global and original content costs will be absorbed by growth in international territories.

PwCTechnology Sector Scorecard
26
Q1 performance Internet
Company Q1’15
Revenue(US$ billions)
Gross margin (%)
Net income/(loss)
(US$ millions)
EPS Market cap (US$ billions)
Amazon 22.7 32% (57) (0.12) 173.3
eBay 4.4 67% 626 0.51 69.8
Google 17.3 63% 3,586 5.27 378.5
LinkedIn 0.63 86% (43) (0.34) 27.3
Netflix 1.6 33% 24 0.38 25.3
Yahoo! 1.2 62% 21 0.02 41.6
Yelp 0.12 93% (1) (0.02) 2.9
For additional financial information, please visit http://www.pwc.com/techscorecard and click on the “Data explorer” box.
PwCTechnology Sector Scorecard
27
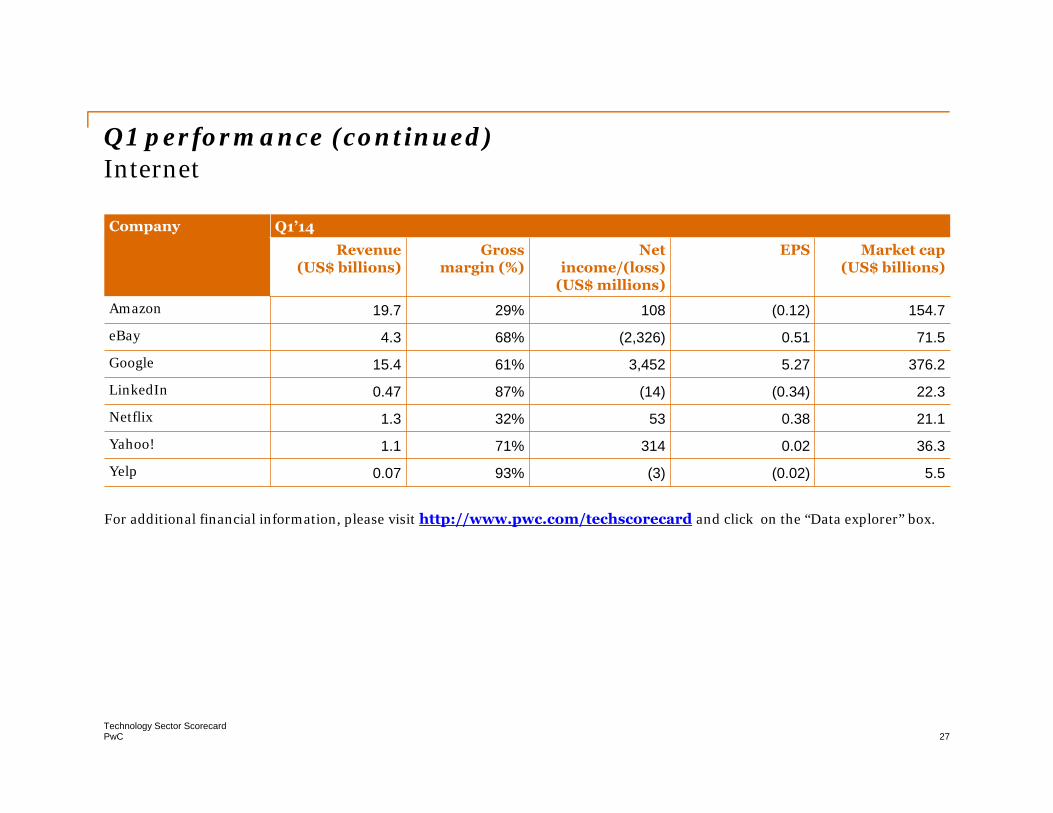
Q1 performance (continued) Internet
Company Q1’14Revenue
(US$ billions)Gross
margin (%)Net
income/(loss)(US$ millions)
EPS Market cap (US$ billions)
Amazon 19.7 29% 108 (0.12) 154.7
eBay 4.3 68% (2,326) 0.51 71.5
Google 15.4 61% 3,452 5.27 376.2
LinkedIn 0.47 87% (14) (0.34) 22.3
Netflix 1.3 32% 53 0.38 21.1
Yahoo! 1.1 71% 314 0.02 36.3
Yelp 0.07 93% (3) (0.02) 5.5
For additional financial information, please visit http://www.pwc.com/techscorecard and click on the “Data explorer” box.

PwCTechnology Sector Scorecard
28
Snapshot by subsectorSemiconductors

PwCTechnology Sector Scorecard
29
Market analysisSemiconductors
• The Semiconductor industry reported flat to negative growth quarter over quarter and year over year with the exception of TSMC which grew by 43.7% year over year. This was due to seasonality and a saturation level reached by smartphones in the emerging and fast-growth markets. The Semiconductor Industry Association reported that worldwide sales of semiconductors reached US$83.1bn during Q1 2015, an increase of 6.0% compared to Q1 2014. Global sales for the month of March 2015 were US$27.7bn, 6.0% higher than the March 2014 total of $26.1bn and 0.1 % lower than February’s total. Companies under the scope of study reported an average of 12% growth in revenue year over year, but flat quarter-over-quarter numbers. Net income also dipped by 22.3% on average quarter on quarter, but reported positive growth of 17.6% year over year. Results were impacted by seasonality on a quarter-over-quarter basis, but slower demand for end products like smartphones and tablets accelerated the decline.1
• The Americas region posted its sixth straight month of double-digit, year-over-year growth to lead all regional markets, and DRAM and analog products were key drivers of all global sales growth.1
• Regionally, sales were up compared to February in Asia Pacific/All Other (3.1%), Europe (2.7%) and China (1.0%). Japan (-0.4%) and the Americas (-6.9%) both saw sales decrease compared to February. Compared to March 2014, sales increased in the Americas (14.2%), China (13.3%) and Asia Pacific/All Other (3.8%), but decreased in Europe (-4.0%) and Japan (-9.6%).1
• The US is considering a legislative initiative called Trade Promotion Authority (TPA) that would help promote continued growth in the semiconductor sector and throughout the US economy. Free trade is vital to the US semiconductor industry. In 2014, US semiconductor company sales totaled US$173bn, representing over half the global market, and 82% of those sales were to customers outside the United States.1
1. Semiconductors.org, April 2015

PwCTechnology Sector Scorecard
30
Market analysis (continued)Semiconductors
• Worldwide semiconductor revenue is expected to reach US$354bn in 2015, a 4% increase from 2014. There are concerns about semiconductor revenue growth in 2015 as system suppliers start to grapple with the rapid depreciation in value of global currencies relative to the US dollar, excess inventories in the semiconductor and electronics supply chains and the end of a PC upgrade cycle.2
• The strong dollar is causing system suppliers and system buyers to re-evaluate their strategies. System suppliers are expected to raise prices in select regions such as Europe to keep their margins intact as well as de-feature some products to maintain current price points. System buyers will push out purchases in select regions, extending product life cycles as well as buying down the price curve. All this will adversely affect semiconductor growth in 2015.2
• From an application point of view, smartphones, solid-state drives (SSDs) and ultra-mobiles are expected to see the largest semiconductor growth, while the traditional PC segment is forecast to experience the greatest decline. The end of support for Windows XP, which lifted the replacement demand for traditional PCs, particularly in the professional market, faded out in late 2014. Through 2015, the replacement demand is expected to remain slow, as consumers delay migrating to Windows 10. The next critical season for the PC and ultra-mobile markets is in the third quarter of 2015, when Windows 10 and Intel's Skylake products come to market.2
• DRAM is expected to be a primary growth driver for the overall industry. DRAM revenue is expected to increase 7.9% in 2015, following a 32% increase in 2014. Demand for DRAM will slow down by the end of 2016 and early 2017 when DRAM industry revenue is expected to decline by 20.2% and 8.4%, respectively.2
2. Gartner, April 2015
PwCTechnology Sector Scorecard
31
Market analysis (continued) Semiconductors
• TSMC reported consolidated revenue of NT$222.03bn, net income of NT$78.99bn and diluted earnings per share of NT$3.05 (US$0.48 per ADR unit) for the first quarter ended March 31, 2015. Year over year, first-quarter revenue increased 49.8%, while net income and diluted EPS both increased 65.0%. Compared to fourth quarter 2014, first-quarter results represent a 0.2% decrease in revenue, a 1.2% decrease in net income and a 1.3% decline in EPS. In US dollars, first-quarter revenue decreased 2.6% from the previous quarter and increased 43.7% year over year. Shipments of 20-nanometer process technology accounted for 16% of total wafer revenues and 28-nanometer accounted for 30% of total wafer revenues. Advanced technologies, defined as 28-nanometer and 20-nanometer technologies, accounted for 46% of total wafer revenues. The demand for TSMC’s wafers remained strong in the first quarter.
• Applied Materials posted its highest quarterly revenue of the past three years. Net sales were US$2.44bn, up 4% sequentially and up 4% year over year. The company recorded GAAP gross margin of 41.6%, operating income of US$416mn, and net income of US$364mn or US$0.29 per diluted share. First-quarter orders were US$2.52bn, up 11% sequentially but down 4% year over year.
• Qualcomm's quarterly revenue declined 3% sequentially and is expected to fall further in coming quarters. Loss of 100% of its Samsung business, heightened chip competition and further decline in royalty rates has adversely impacted earnings. Qualcomm had revenue of US$6.9bn and EPS of US$1.17. Revenue from equipment and services was off 16%, largely due to the loss of the Samsung business. Last quarter Samsung announced it had dropped Qualcomm's Snapdragon processor in its Galaxy S6 for its in-house Exynos chip.3
3. Seekingalpha.com, February 2015

PwCTechnology Sector Scorecard
32
Q1 performance Semiconductors
Company Q1’15
Revenue(US$ billions)
Grossmargin (%)
Net income/(loss)(US$ millions)
EPS(US$)
Market cap (US$ billions)
Intel 12.8 60.5% 1,992.0 0.41 152.0
Applied Materials 2.4 41.6% 364.0 0.29 26.8
Texas Instruments 3.2 57.7% 656.0 0.61 99.5
TSMC 7.0 49.3% 2,505.0 0.48 121.8
Qualcomm Inc 6.9 61.9% 1,053.0 0.63 111.9
Company Q1’14
Revenue(US$ billions)
Grossmargin (%)
Net income/(loss)(US$ millions)
EPS(US$)
Market cap (US$ billions)
Intel 12.8 59.8% 1,947.0 0.38 127.4
Applied Materials 2.4 42.5% 262.0 0.21 22.5
Texas Instruments 3.0 53.9% 487.0 0.44 82.1
TSMC 4.9 47.5% 1,582.0 0.31 103.8
Qualcomm Inc 6.4 61.0% 1,959.0 1.16 133.6
For additional financial information, please visit http://www.pwc.com/techscorecard and click on the “Data explorer” box.

PwCTechnology Sector Scorecard
33
Snapshot by subsectorSoftware

PwCTechnology Sector Scorecard
34
Market analysis Software
• Compared to last quarter, most companies in the Software sector reported a decline in Q1 2015 revenues, however year-over-year revenues increased. The largest sequential decline was reported by SAP, whose revenue fell by 25.6%. On a year-over-year basis, VMware reported the highest revenue growth at 11.1%. Cloud services provided a significant boost to most companies’ revenues, notably SAP and Microsoft, whose cloud revenues grew by 130% and 106%, respectively, when compared to Q1 2014.
• Geographically, growth in the Software market was spearheaded by the Americas, especially the US. The EMEA market also showed moderate growth, most notably in Western Europe. On the other hand, Asia-Pacific showed mixed results, with Japan outperforming other countries.
• Many service providers are shifting their product strategy after struggling to gain significant market traction for cloud infrastructure as a service (IaaS). As a result, many service providers have made changes to their platform and some have or plan to completely end investments in cloud IaaSofferings. All providers seek contractual commitments that do not allow the provider to substantially modify or discontinue the offering without at least 12 months notice. However, global spending on IaaS is expected to reach almost US$16.5bn in 2015, an increase of 33% from 2014, with a compound annual growth rate (CAGR) from 2014 to 2019 forecast at 29%, but this is due to more demand from current clients, not an increase in the number of clients.1
1 .Gartner, May 2015

PwCTechnology Sector Scorecard
35
Market analysis (continued) Software
• Spending in the enterprise software market is on pace to total US$320bn in 2015, a 2.3% increase from US$313bn in 2014. However, this is lower than the US$335bn forecast by Gartner in late 2014. The downward revision is the result of substantial reduction in office suite spending caused by the accelerating adoption of Office 365. Office 365 is disrupting traditional revenue flows because its cost is prorated over the life of the subscription, resulting in significantly lower revenue growth compared to traditional “out of the box” software modules. Another reason for a lower forecast in the enterprise software market is the rising US dollar, which will greatly reduce earnings realized in non-US currencies.2
• Adobe’s Q1 2015 revenue of US$1.1bn was similar to Q4 2014’s revenue. Adobe and Microsoft Corporation formed a strategic partnership to integrate Adobe’s Marketing Cloud Solutions with Microsoft’s Dynamics CRM. The integration will improve how enterprises manage their marketing, sales and services to better engage with their customers.
2. Gartner, April 2015

PwCTechnology Sector Scorecard
36
Q1 performance Software
Company Q1’15Revenue
(US$ billions)Gross
margin (%)Net
income/(loss)(US$ millions)
EPS(US$)
Market cap (US$ billions)
Adobe 1.1 85.0% 84.9 0.17 39.6
Intuit 2.2 90.0% 501.0 1.78 27.8
Microsoft 21.7 67.0% 4,985.0 0.61 329.8
Oracle 9.3 79.6% 2,495.0 0.56 191.5
SAP* 5.1 65.3% 466.0 0.39 86.6
Symantec 1.5 81.1% 176.0 0.25 16.1
VMware 1.5 83.9% 196.0 0.45 10.6 *Euro to USD exchange rate used for SAP is 1.1283 USD/Euro.
For additional financial information, please visit http://www.pwc.com/techscorecard and click on the “data explorer” box

PwCTechnology Sector Scorecard
37
Q1 performance (continued)Software
Company Q1’14Revenue
(US$ billions)Gross
margin (%)Net
income/(loss)(US$ millions)
EPS(US$)
Market cap (US$ billions)
Adobe 1.0 85.2% 47.0 0.09 34.2
Intuit 2.4 93.1% 984.0 3.47 21.6
Microsoft 20.4 70.9% 5,660.0 0.28 338.6
Oracle 9.3 82.0% 2,565.0 0.56 177.4
SAP* 5.1 66.6% 734.4 0.62 97.0
Symantec 1.6 82.6% 217.0 0.31 13.9
VMware 1.4 85.2% 199.0 0.46 46.5 *Euro to USD exchange rate used for SAP is 1.3702 USD/Euro.
For additional financial information, please visit http://www.pwc.com/techscorecard and click on the “data explorer” box

PwCTechnology Sector Scorecard
38
Snapshot by subsectorSoftware Services

PwCTechnology Sector Scorecard
39
• The global outsourcing market slowed in the first quarter of 2015 from its near-record high revenues in Q1 2014, with contract values falling due to increased competition. First-quarter Annual Contract Value (ACV) fell 18%, to US$5.1bn, one of the lowest first quarter ACVs in the last decade. Q1 2015 revenue was also flat compared to the fourth quarter of 2014, but up 6.3% year over year. Most of the tracked companies experienced a slight decline in net income compared to last quarter and year over year. Computer Sciences Corp (CSC) reported the sharpest decline in net income of 103% quarter over quarter and 94.8% year over year.
• The total number of first quarter contracts (305) was down 7% from Q1 2014. Still, the volume of smaller deals, those with ACV of under US$30mn, remained steady compared to Q1 2014 totaling 269 contracts valued at US$2.5bn. However, larger deals, worth more than US$30mn annually, declined about 25% in number (28 contracts) and value (US$1.3bn in ACV) from the previous year. By domain, information technology outsourcing (ITO) slowed in the first quarter, with US$3.5bn in ACV awarded, down by 27% from last year and the lowest first quarter ACV since 2004. Conversely, business process outsourcing (BPO) saw contract volume grow by 18% and ACV by 13% to US$1.6bn. This was the second consecutive quarter BPO had an ACV of more than US$1.5bn.1
Market analysisSoftware Services
1. The Global ISG (Information Services Group) Outsourcing Index, April 2015
PwCTechnology Sector Scorecard
40
• In Q1 2015 the Americas had the strongest quarter compared to EMEA and Asia Pacific. The Americas ACV increased by 10% compared to Q1 2014 to US$2.1bn. This makes Q1 2015 the fourth consecutive quarter the Americas region posted ACV higher than US$2bn. A total of 143 contracts were awarded in the quarter, up 27%. Restructured ACV reached more than US$1bn in consecutive quarters, and the value of restructured contracts were higher than that of new-scope contracts, which has happened only twice before. Among industries, the Energy sector’s ACV increased by 125% and its volume soared by 150% as the pace of sourcing activity picks up in the face of falling oil prices. Healthcare and Pharma also had a strong quarter, with ACV more than tripling and volume up nearly 150%, reflecting the growing need to provide services at lower cost amid increasing regulatory and compliance pressures.1
Market analysis (continued)Software Services
1. The Global ISG (Information Services Group) Outsourcing Index, April 2015

PwCTechnology Sector Scorecard
41
• Computer Sciences Corporation plans to divide into two separate publicly traded companies. One company will serve commercial and government clients globally and the other will serve public sector clients in the US.
CSC Global Commercial will be the information technology (IT) services and solutions partner for Fortune 1,000 companies and non-US government clients. With US$8.1bn in FY 15 revenue, CSC Global Commercial will have more than 1,000 customers (including 175 of the Fortune 500), 51,000 employees and 34 delivery centers globally. The business will retain its leadership status across multiple markets, along with innovative offerings and industry-leading strategic partnerships.
CSC US Public Sector will be a provider of mission-specific IT, infrastructure and business services to US federal, state and defense agencies. The public sector business had FY 15 revenues of US$4.1bn and employs 14,000 people.
Market analysis (continued)Software Services

PwCTechnology Sector Scorecard
42
Q1 performanceSoftware Services
Company Q1’15Revenue
(US$ billions)Gross
margin (%)Net income/(loss)
(US$ millions)EPS (US$) Market cap
(US$ billions)
Cognizant 2.9 40.7% 382.9 0.62 38.1
CSC 2.9 16.4% 9.0 0.06 9.1
Infosys 2.2 39.0% 498.0 0.44 40.1
HCL 1.5 35.3% 270.4 0.19 22.1
TCS 3.9 36.0% 621.0 0.32 80.2
Company Q1’14Revenue
(US$ billions)Gross
margin (%)Net income/(loss)
(US$ millions)EPS (US$) Market cap
(US$ billions)
Cognizant 2.4 40.9% 348.9 0.57 30.8
CSC 3.3 27.6% 174.0 1.19 8.8
Infosys 2.1 37.0% 487.0 0.85 31.0
HCL 1.4 38.9% 264.2 0.37 16.3
TCS 3.5 46.8% 861.0 0.44 70.0
For additional financial information, please visit http://www.pwc.com/techscorecard and click on the “data explorer” box

PwCTechnology Sector Scorecard
43
Snapshot by subsector
Systems and PC Hardware
PwCTechnology Sector Scorecard
44
Market analysisSystems and PC Hardware
• The continuing transition from desktop and traditional laptop PCs to notebooks, hybrids (a combination of tablet and laptop computer) and Windows tablets meant mixed results for Systems and PC Hardware companies in the first quarter.
• Worldwide PC shipments1 totaled 71.7 million units in Q1 2015, a 5.2% decline from 75.7 million units in Q1 2014 when the PC industry received a boost from the end of Windows XP support, leading many companies to replace PCs. That replacement cycle faded in Q1 2015. Desk-based PC shipments declined rapidly due to the continuing transition to notebooks, hybrids and Windows tablets, with business desk-based PCs being impacted the most. However, the overall PC decline is not expected to be long term in nature. Mobile PCs, including laptops, notebooks, hybrids and Windows tablets, grew compared with a year ago. Mobile PC sales increases are due to a separate underlying replacement cycle driven by thin and light notebooks with tablet functionality, leading to the uptick in mobiles in the first quarter. Hybrid notebooks are expected to see some growth, especially in mature markets. 2
• Lenovo and HP were the only two vendors among the top five worldwide that experienced an increase in PC shipments in Q1 2015. Lenovo shipped 13.6 million units in Q1 2015, a 5.7% increase over the 12.8 million units in Q1 2014. It experienced its strongest growth in Europe, the Middle East and Africa (EMEA) and the US. It has become one of the top providers of hybrid notebooks. HP performed moderately well in the first quarter, with shipments growing by 2.5% from 12.1 million units in Q1 2014 to 12.4 million units in Q1 2015. It increased its US market share from 24.9% in Q1 2014 to 26.1% in Q1 2015, and maintained its top position in both the US and EMEA.2
1. Desk-based PCs, notebook PCs, and premium ultramobiles2. Gartner, May 2015
PwCTechnology Sector Scorecard
45
Market analysis (continued)Systems and PC Hardware
• PC shipments in EMEA reached 20.2 million units in the first quarter of 2015—a 7.7% decrease year over year.3
• Device vendors are expected to raise PC prices to offset the effects of currency devaluation against the US dollar. Prices of PCs in the Eurozone and Japan, in particular, are expected to increase by up to 10% during 2015.3
• The Western European printer and multifunction printer (MFP) market increased 2.6% in unit terms in Q1 2015 (5.49 million units—an increase of 138,621 units), with positive growth for both inkjet and laser segments. Revenues also increased by an impressive 8.4% as more high-speed laser MFPs and business inkjets were shipped.
• Business inkjets had a strong Q1 2015, with a 21.6% year-over-year increase and MFP products showing the highest growth rates. Germany alone represents 30% of the business inkjet market, followed by the UK and France. MFP products accounted for 78.1% of all shipments. Both the MFP and printer markets increased, at 2.7% and 2.4%, respectively. The Laser market showed an overall 4.1% year-over-year increase.
3. IDC, May 2015

PwCTechnology Sector Scorecard
46
Market analysis (continued)Systems and PC Hardware
• IBM’s Q1 2015 net income from continuing operations was US$2.4bn, down 5% year over year, including losses from discontinued operations related to the Microelectronics business and the impact of US$200mn in pension-related pre-tax charges for IBM Spain. Total revenue from continuing operations was US$19.6bn, down 12%.
• Lenovo Group delivered strong year-over-year performance in Q1 2015, but experienced sequential decline due to seasonality and significant currency impact. Revenue was US$11.3bn, up 21% year over year, but would have been 28% with constant exchange rates. On a sequential basis, revenue dipped by 19.6% against US$14.1bn in Q4 2014. Lenovo reported quarterly net income of US$100mn, after adjusting for US$94mn non-cash M&A related accounting charges. Lenovo’s M&A investments and organic growth in smartphones, tablets, servers and other services contributed 37% to revenues in the quarter compared to 17% the year before. Lenovo had exceptional performance in PCs this year, with 60 million shipments in FY 2014-15 compared to 55 million shipments in FY 2013-14.
PwCTechnology Sector Scorecard
47
Market analysis (continued)Systems and PC Hardware
• HP posted revenue of US$25.5bn in Q1 2015, a 6.8% year-over-year decline against US$27.3bn in Q1 2014 and a 5.2% sequential decline against US$26.8bn in Q4 2014. The year-over-year revenue decline was noted across all reporting segments, most notably in Enterprise Services (-16%) and Software (-8%). Personal Systems, which includes notebooks, desktops, workstations and other computing devices, saw revenue dip by 5% even though shipments were up by 2.5%. Desktop revenue was down 17%, while shipments were down 14%. Although notebook revenue was down 5%, shipments were up 19%, reaffirming the shift of the market from desktops to notebooks, hybrids and tablets. HP’s net income for the quarter was US$1bn after adjusting for a US$269mn separation cost in relation to its split into two entities, HP Enterprise and HP Inc.
PwCTechnology Sector Scorecard
48
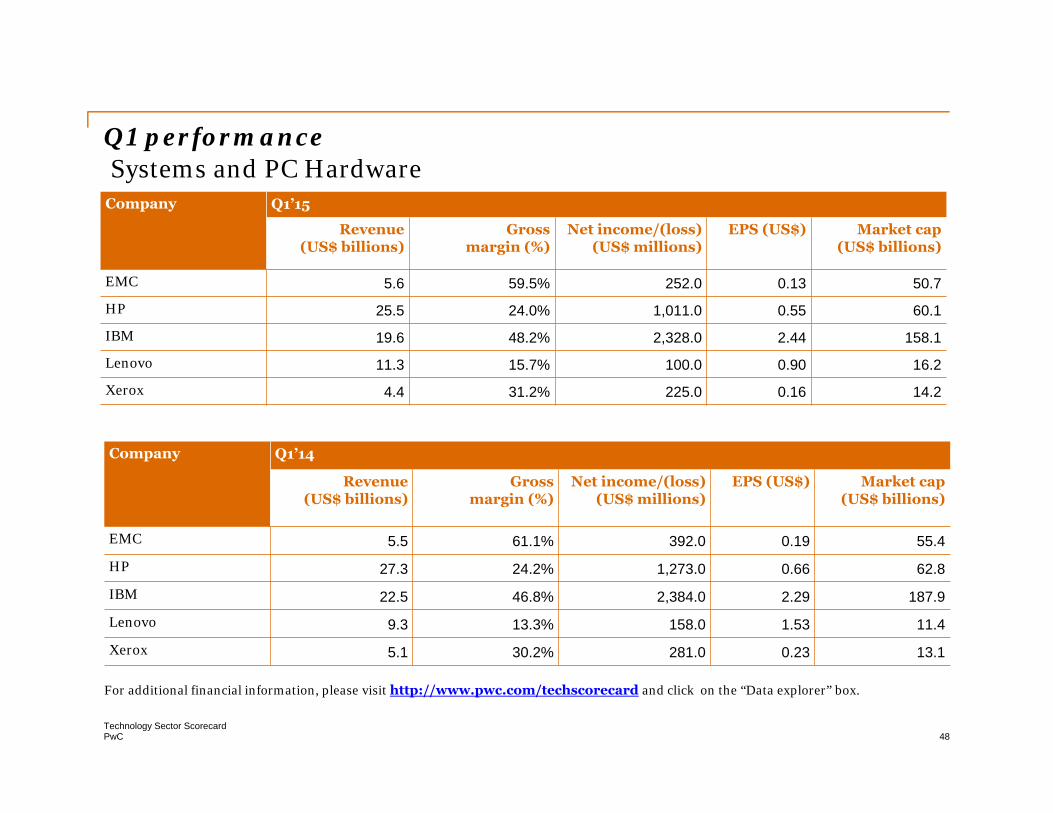
Q1 performance Systems and PC Hardware
Company Q1’15
Revenue(US$ billions)
Grossmargin (%)
Net income/(loss) (US$ millions)
EPS (US$) Market cap (US$ billions)
EMC 5.6 59.5% 252.0 0.13 50.7
HP 25.5 24.0% 1,011.0 0.55 60.1
IBM 19.6 48.2% 2,328.0 2.44 158.1
Lenovo 11.3 15.7% 100.0 0.90 16.2
Xerox 4.4 31.2% 225.0 0.16 14.2
For additional financial information, please visit http://www.pwc.com/techscorecard and click on the “Data explorer” box.
Company Q1’14
Revenue(US$ billions)
Grossmargin (%)
Net income/(loss) (US$ millions)
EPS (US$) Market cap (US$ billions)
EMC 5.5 61.1% 392.0 0.19 55.4
HP 27.3 24.2% 1,273.0 0.66 62.8
IBM 22.5 46.8% 2,384.0 2.29 187.9
Lenovo 9.3 13.3% 158.0 1.53 11.4
Xerox 5.1 30.2% 281.0 0.23 13.1

PwCTechnology Sector Scorecard
49
Methodology
We analyzed a selection of the largest technology companies included in the S&P 500 index as well as a selection of large international technology companies that regularly report financial results.
In order to present the information by calendar year or calendar quarter, the financial information for companies with non-calendar years or quarters was included in the nearest calendar year or quarter.
We analyzed technology companies that operate predominantly within the following sectors:
• Communications
• Consumer Electronics
• EMS/Distributors
• Internet
• Semiconductors
• Software
• Software Services
• Systems and PC Hardware

PwCTechnology Sector Scorecard
50
Technology industry leadersRaman ChitkaraGlobal Technology LeaderPhone: +1 408 817 3746Email: [email protected]
Rod Dring – Australia Werner Ballhaus – Germany Yury Pukha – RussiaPhone: +61 2 8266 7865Email: [email protected]
Phone: +49 211 981 5848Email: [email protected]
Phone: +7 495 223 5177Email: [email protected]
Estela Vieira – Brazil Sandeep Ladda – India Greg Unsworth – SingaporePhone: +55 1 3674 3802Email: [email protected]
Phone: 91 22 6689 1444Email: [email protected]
Phone: +65 6236 3738Email: [email protected]
Christopher Dulny– Canada Masahiro Ozaki– Japan Philip Shepherd ― UAEPhone: +416 869 2355Email: [email protected]
Phone: +81 3 5326 9090Email: [email protected]
Phone: +97 1 43043501Email: [email protected]
Jianbin Gao – China & Hong Kong Hoonsoo Yoon – Korea Jass Sarai – UKPhone: +86 21 2323 3362Email: [email protected]
Phone: +82 2 709 0201Email: [email protected]
Phone: +44 0 1895 52 2206Email: [email protected]
Pierre Marty – France Ilja Linnemeijer – The Netherlands Pierre-Alain Sur – USPhone: +33 1 5657 5815Email: [email protected]
Phone: +31 88 792 4956Email: [email protected]
Phone: +1 646 471 6973Email: [email protected]

We exercised reasonable professional care and diligence in the collection, processing and reporting of this information. However, the data used is from third-party sources and PricewaterhouseCoopers has not independently verified, validated or audited the data. PricewaterhouseCoopers makes no representations or warranties with respect to the accuracy of the information, nor whether it is suitable for the purposes to which it is put by users.
PricewaterhouseCoopers shall not be liable to any user of this report or to any other person or entity for any inaccuracy of this information or any errors or omissions in its content, regardless of the cause of such inaccuracy, error or omission.
Furthermore, in no event shall PricewaterhouseCoopers be liable for consequential, incidental or punitive damages to any person or entity for any matter relating to this information.
© 2015 PricewaterhouseCoopers LLP. All rights reserved. In this document, “PwC” refers to PricewaterhouseCoopers LLP, which is a member firm of PricewaterhouseCoopers International Limited, each member firm of which is a separate legal entity.
pwc.com/techscorecard