technology performance report - home | … of painesville, ohio ashlawn energy, llc page 1 vanadium...
TRANSCRIPT

City of Painesville, Ohio
Ashlawn Energy, LLC
Page 1
Vanadium Redox Battery Demonstration Program 20-Feb-2015 Technology Performance Report Energy Storage Demonstration
Technology Performance Report
Painesville Vanadium Redox Flow Battery Project American Recovery and
Reinvestment Act (ARRA)
Contract ID: DE-OE0000233
Project Type: Smart Grid Demonstration Project (SGDP)
Report Date: February 20, 2015
Recipient: City of Painesville, Ohio
Principal Investigator: Jeff McHugh

City of Painesville, Ohio
Ashlawn Energy, LLC
Page 2
Vanadium Redox Battery Demonstration Program 20-Feb-2015 Technology Performance Report Energy Storage Demonstration
Acknowledgements. This work was funded in part by the U.S. Department of Energy’s National Energy Technology Laboratory (U.S. DOE-NETL) under the American Recovery and Reinvestment Act (ARRA) under award number DE-OE0000233.
Disclaimer. This report was prepared as an account of work sponsored by an agency of the United States Government. Neither the United States Government nor any agency thereof, nor any of their employees, makes any warranty, express or implied, or assumes any legal liability or responsibility for the accuracy, completeness, or usefulness of any information, apparatus, product, or process disclosed, or represents that its use would not infringe privately owned rights. Reference herein to any specific commercial product, process, or service by trade name, trademark, manufacturer, or otherwise does not necessarily constitute or imply its endorsement, recommendation, or favoring by the United States Government or any agency thereof. The views and opinions of authors expressed herein do not necessarily state or reflect those of the United States Government or any agency thereof.

City of Painesville, Ohio
Ashlawn Energy, LLC
Page 3
Vanadium Redox Battery Demonstration Program 20-Feb-2015 Technology Performance Report Energy Storage Demonstration
List of Abbreviations A Ampere
AC Alternating Current
ARRA American Recovery and Reinvestment Act
AMP American Municipal Power
BESS Battery Energy Storage System
BMS Battery Monitoring System
CISO Chief Information Security Officer
CTC Concurrent Technologies Corporation
DC Direct Current
DOE U.S. Department of Energy
EPA Environmental Protection Agency
F Fahrenheit
FR Frequency Regulation
HVAC Heating, Ventilation, and Air Conditioning
I&CS Interoperability and Cyber Security Plan
IEEE Institute of Electrical and Electronics Engineers
IP Intellectual Property
ISO Independent System Operator
kV Kilovolt
kVa Kilovolt amperes
kW Kilowatt
m Meter
MAGNET Manufacturing Advocacy and Growth Network
min Minute
mm Millimeter
msec Milliseconds
MVA Megavolt Ampere
MW Megawatt
MWh Megawatt hour
MW*h Megawatt hour of Regulation
NEPA National Environmental Protection Act
NETL National Energy Technology Laboratory
OAQDA Ohio Air Quality Development Authority
PCS Power Conversion System
PEM Proton Exchange Membrane
PJM PJM Interconnection, LLC
PMEP Painesville Municipal Electric Power
PMP Project Management Plan
PNNL Pacific Northwest National Laboratory
psi Pounds per Square Inch
pSoC Partial State of Charge
RegA Traditional Regulation Signal
RMCP Regulation Market Clearing Price
RMCCP Regulation Market Capability Clearing Price
RMPCP Regulation Market Performance Clearing Price
RTO Regional Transmission Organization
SCADA Supervisory Control and Data Acquisition
sec Second
SGDP Smart Grid Demonstration Program
SoC State of Charge
SOPO Statement of Project Objectives
TPR Technology Performance Report
UPS Uninterruptible Power Source
USPTO U.S. Patent and Trademark Office
V Volt
VAR Volt-ampere Reactive (reactive power)
VRFB Vanadium Redox Flow Battery

City of Painesville, Ohio
Ashlawn Energy, LLC
Page 4
Vanadium Redox Battery Demonstration Program 20-Feb-2015 Technology Performance Report Energy Storage Demonstration
Table of Contents
PREFACE 6
1 OVERVIEW OF THE ENERGY STORAGE PROJECT 7
1.1 Overall Project and Sub-Project Objectives 7 1.1.1 Background Technology 7
1.2 List of Recipients and Sub-recipients 9
1.3 System Design 9
1.4 Applicable Energy Storage Applications and Smart Grid Functions 11
1.5 Grid or Non-Grid Connected Impacts and Benefits Expected 11
1.6 Project Milestones 11 1.6.1 Future Project Milestones 13
1.7 Interactions with Project Stakeholders 14 1.7.1 Collaboration with DOE 14 1.7.2 Collaboration with PJM 14 1.7.3 Interactions with Northeast Ohio Non-profit Organizations 14
2 DESCRIPTION OF ENERGY STORAGE TECHNOLOGIES AND SYSTEMS 15
2.1 Location of the storage system 15
2.2 Configurations of Systems and System Parameters 16
2.3 Data Measurements 16
2.4 System Performance Parameters 18 2.4.1 Projected Performance Parameters 19 2.4.2 Data Acquisition Systems 19
3. DESCRIPTION OF THE ANALYSIS METHODOLOGIES 25
3.1 Analysis Objectives 25 3.1.1 Data Measurements 25
3.2 Methodologies for Determining Technical Performance 26 3.2.1 System Performance Parameters 26 3.2.2 Power Systems 36 3.2.3 Electrolyte 36 3.2.4 Economic 37
3.3 Methodologies for Determining Grid Impacts and Benefits 38

City of Painesville, Ohio
Ashlawn Energy, LLC
Page 5
Vanadium Redox Battery Demonstration Program 20-Feb-2015 Technology Performance Report Energy Storage Demonstration
4 TECHNOLOGY PERFORMANCE RESULTS 38
4.1 Stack and Component Prototype Testing 41
4.2 MAGNET Project and Engineering Assistance 51
4.3 Project Approach Changes 55
4.4 Battery Building 55
4.5 Reporting 56
4.6 Intellectual Property 57
5 GRID IMPACTS AND BENEFITS 59
6 MAJOR FINDINGS AND CONCLUSIONS 60
7 FUTURE PLANS 61

City of Painesville, Ohio
Ashlawn Energy, LLC
Page 6
Vanadium Redox Battery Demonstration Program 20-Feb-2015 Technology Performance Report Energy Storage Demonstration
Preface
The City of Painesville and Ashlawn Energy, LLC, undertook to build a one-megawatt, eight-hour, Vanadium Redox Flow Storage Battery under Department of Energy (DOE) Cooperative Agreement DE-OE0000233 for installation at the Painesville Municipal Power Plant in Painesville, Ohio. The financial February 1, 2010 assistance award initially provided $8,767,258.00 in funding, with $3,743,570.00 federal share, and $5,023,688.00 in recipient cost share. On November 15, 2010, the agreement was amended to reflect $9,462,623.00 in total funding, increasing federal share to $4,243,570.00 and recipient cost share to $5,219,053.00. As of this writing, total federal share expended is $4,193,609.41. Total non-federal cost share contribution is $4,578,728.99.
It was anticipated that the Painesville battery project would receive project matching funds from the state of Ohio under the Ohio Air Quality Development Authority Advanced Energy (OAQDA) forgivable loan program. After a change in Administration, Ohio’s state priorities changed resulting in the state’s withdrawing funding for all OAQDA Advanced Energy projects, including the matching funding needed for this project in Painesville, OH.
A technology license was obtained from the inventor of the vanadium redox flow battery (VRFB), Dr. Maria Skyllas-Kazacos (University of New South Wales, Australia). The City of Painesville contracted with Ashlawn Energy, LLC to manage the development and fabrication of the battery as well as to prepare and provide all reporting to DOE. Ashlawn developed its supplier base, which included InnoVentures LLC, Concurrent Technologies Corporation (CTC), and others to build components and conduct prototype testing.
The City of Painesville contracted for and had built a new 4,900 square foot Butler building to house the battery at the site of its Municipal Power Plant at a cost of $432,828 using city funds as contribution included as part of project cost share. A number of prototype VRFB stacks were built and tested at CTC working up to a full sized 10,000 watt stack. Five patents were applied for improvements to the VRFB made by Ashlawn Energy engineers, and are currently pending at the USPTO. A drawing package, schedule, vendor selection, and economic business model was completed.

City of Painesville, Ohio
Ashlawn Energy, LLC
Page 7
Vanadium Redox Battery Demonstration Program 20-Feb-2015 Technology Performance Report Energy Storage Demonstration
1 Overview of the Energy Storage Project
1.1 Overall Project and Sub-Project Objectives
As stated in the Statement of Project Objectives (SOPO), the overarching objective of the Painesville Municipal Power Plant Vanadium Redox demonstration project was to advance Smart Grid technology by introducing vanadium redox battery storage capacity at the 32 mega-watt (MW) coal fired power plant in Painesville, OH. The initial objective of this demonstration project was to provide metrics and operating experience to enable the power generating facility to obtain the same daily output requirement in a more efficient manner and with a lower carbon footprint by utilizing the stored power from a vanadium redox battery. It was envisioned that the project would provide metrics to evaluate how to more efficiently level the peak requirements and manage power purchases by strategically incorporating vanadium redox batteries throughout the power network.
As described in the above Preface Section, the political change of Administration in the State of Ohio and subsequent reprioritizing of state funding zeroed out the anticipated matching state funding program, so the project was re-scoped to allow for commercial funding. As a prerequisite to attracting commercial investment, it was necessary to rescope the project’s goals in order to achieve the highest economic return. It was determined that the revenues stream providing the highest economic return was frequency regulation.
Ashlawn Energy, LLC will manufacture, install and finance the battery. Ashlawn Energy, LLC is a manufacturer and systems integrator of the vanadium redox battery technology under the trade name VanCharg™ in the United States.
The components for the battery will be produced in the United States and stacks will be assembled in the Painesville area. The battery system will be installed in the Painesville Municipal Power (PMEP) facility. As a result and economic outcome of this program, Ashlawn Energy expects to create 40 jobs initially and over 200 jobs created three years after project completion. Ashlawn Energy’s job creation will provide a needed boost to the local economy in Northeast Ohio that has been so heavily stricken by the loss of good manufacturing jobs.
This project has multiple related objectives:
Establish a U.S. manufacturing base to manufacture Vanadium Redox Flow Battery (VRFB) stacks
Demonstrate efficacy/reliability of latest VRFB design
Establish a plan to scale up manufacturing rate of VRFB stacks from prototyping to three megawatts
per year
Develop an economic and commercially viable VRFB system
1.1.1 Background Technology
The Vanadium Redox Flow Battery (VRFB) was developed and patented in 1986 by Maria Skyllas‐Kazacos, a professor at the University of New South Wales in Australia. A VRFB consists of an assembly of bi‐polar cells in which the two electrolytes are separated by a proton exchange membrane (PEM).
The vanadium based electrolyte in the positive half‐cells contains VO2+ and VO2+ ions, the electrolyte in
the negative half‐cells contains V3+ and V2+ ions. The electrolyte solution is acidic but is considered to be environmentally benign. When the vanadium battery is charged, the ions in the positive half‐cell
undergo an oxidation reaction from VO2+ to VO2+ releasing an electron in the process. Simultaneously,

City of Painesville, Ohio
Ashlawn Energy, LLC
Page 8
Vanadium Redox Battery Demonstration Program 20-Feb-2015 Technology Performance Report Energy Storage Demonstration
a reduction reaction takes place at the negative couple where V3+
is converted to V2+
with an absorption of an electron. During discharge, this process is reversed.
Vanadium Redox Flow Battery Operating Experience
There have been several successful projects worldwide that showcased the capabilities of Vanadium Redox Flow Batteries. These projects include:
Location Application Ratings
Kashima Kita Power Station Load Leveling 200kW for 4 hours
Sumitomo Denetsu Co. Load Leveling 100 kW for 8 hours
Institute of Applied Energy Stabilization of wind turbine
output 170 kW for 6 hours
Sanyo Electric Company Power quality and load
leveling 1,500 kW for 1 hour
Dunlop Golf Course Solar PV Storage 30 kW for 8 hours
Kwansei University Peak Shaving 500 kW for 10
hours
CESI – Italy Peak Shaving 42 kW for 2 hours
Tomamae Wind Villa Wind Turbine Output
Stabilization 4 MW for 1.5
hours Figure 1 Large Vanadium Flow Battery Projects Worldwide.
These projects have demonstrated the viability of Vanadium Redox Flow Batteries for large scale applications in peak load shaving and stabilization of wind and solar generation installations. The Ashlawn VanCharg™ battery for this project will demonstrate “state of the art” capabilities in flow batteries.
A summary of Vanadium Redox Flow Battery advantages includes:
Desired round trip plant efficiencies of 80% or better.
Based on modular design of battery stacks and power converter equipment along with the direct relationship between stored electrolyte volume and energy storage upgrading of either battery capacity or energy storage capability is a straightforward endeavor.
Long life time – the cell limiting component is the membrane – cycle lifetimes on average of 10,000 cycles have been observed with a maximum cycle life of 16,000 cycles observed.
Cross contamination of electrolyte is not a concern since same chemical species are on both sides of membrane.
Vanadium is not a toxicity concern.
Vanadium in sulfuric acid does not create long-term harm to the environment as it decomposes into harmless constituents.
Vanadium and most battery components are able to be recycled thus lowering lifetime costs and minimizing environmental issues.

City of Painesville, Ohio
Ashlawn Energy, LLC
Page 9
Vanadium Redox Battery Demonstration Program 20-Feb-2015 Technology Performance Report Energy Storage Demonstration
State of charge of all cells is the same since all cells are fed with the same electrolyte at the same rate in parallel.
Generation of hydrogen during charging is minimal and not a hazard.
Cooling of the battery with electrolyte flow allows thermal management to be very well controlled.
Very quick response on the order of microseconds is possible to allow for very effective control of system voltage and frequency (see Figure 29 in Section 4.1).
Nominal capacity of the battery can be exceeded for periods of time with the only effect being a slight (5% to 10%) loss of efficiency.
1.2 List of Recipients and Sub-recipients
The City of Painesville, Ohio, is the recipient. Ashlawn Energy is the major sub-recipient. The City manages the power plant and its power plant employees, as well as GPD Group, Akron, Ohio. GPD is an architectural and engineering firm that was contracted to install the battery building at the site of the Painesville electric plant, install switchgear, the motor controls center, fiber optics, and other electrical integration.
Through its subcontract with the City, Ashlawn Energy manages and contracts with all other sub-recipients, prepares all required reporting to the DOE. Ashlawn builds all prototypes, arranges for testing, and will build and install the battery system at PMEP. Ashlawn is arranging for financing of the project independent of the City, and at the project’s conclusion, title to the battery system will vest with Ashlawn.
Sub-recipients managed by Ashlawn Energy include:
InnoVentures (now defunct), Willoughby, OH, built stack prototypes.
Concurrent Technologies Corporation (CTC), Johnstown, PA, provides stack testing.
Evraz-Stratcor, Hot Springs, AK, produced vanadium redox electrolyte (vanadyl sulfate).
Riverside Specialty Chemicals, New York, NY, produced vanadium redox electrolyte (vanadyl sulfate).
V-Fuel, New South Wales, Australia, provided a technology license to Ashlawn Energy.
Flanders Electric, Evansville, IN, provided electrical consulting.
GrafTech, Parma, OH, provided graphite products that were utilized in stacks.
SGL Graphite, Valencia, CA, provided graphite products that were utilized in stacks.
DuPont, Wilmington, DE provided membranes for stacks and stack prototypes.
Ion Power, New Castle, DE, provided membranes for stacks and stack prototypes.
Battelle, Pacific Northwest National Labs (PNNL), Richland, WA, provided testing.
1.3 System Design
Final battery output of 1.16 MW, for reasons stated in paragraph 1.1, was optimized for frequency regulation. The system will include two major battery groups, and 128 10-kW battery stacks. The

City of Painesville, Ohio
Ashlawn Energy, LLC
Page 10
Vanadium Redox Battery Demonstration Program 20-Feb-2015 Technology Performance Report Energy Storage Demonstration
following diagram includes system configuration, power inverter, battery management system, Supervisory Control and Data Acquisition System (SCADA), and step-ups to the Painesville plant:
Figure 2 Ashlawn Energy's Battery Conversion and Control System.
Ashlawn Energy VanCharg™ Energy Storage System with Grid Tie Power ConversionSystem
HMI Screen
Power Conversion System

City of Painesville, Ohio
Ashlawn Energy, LLC
Page 11
Vanadium Redox Battery Demonstration Program 20-Feb-2015 Technology Performance Report Energy Storage Demonstration
1.4 Applicable Energy Storage Applications and Smart Grid Functions
METRICS Applicability of
Input Remarks
Electric Energy Time Shift
Yes
The battery system will be optimized to inject Peak Shaving and Frequency Regulation (FR) into the PJM grid from demand response, behind the meter.
Load Following
Yes
The battery system will be capable of follow peak shaving and FR signals from behind the meter.
Voltage Support
Maybe
While the battery will be capable of providing voltage support, it is not clear if this benefit can be demonstrated at the Painesville generation facility where the battery power will be supplied to the PMEP 4,160 VAC internal bus.
Figure 3 Battery Metrics.
1.5 Grid or Non-Grid Connected Impacts and Benefits Expected
Benefit Category
Benefit Sub-category
Benefit Provided
by Project
Economic
Market Revenue Ancillary Service Revenue, Peak Shaving Arbitrage
YES
Energy Efficiency Reduced Electricity Losses YES
Reliability Power Quality Reduced Momentary Outages Reduced Sags and Swells
YES
Environmental
Air Emissions
Reduced Carbon Dioxide Emissions Reduced SOX, NOX, and PM-2.5
Emissions
YES
Figure 4 Battery Benefits.
1.6 Project Milestones
Project dates listed are as of February 18, 2015. Past dates indicate a completed task.

City of Painesville, Ohio
Ashlawn Energy, LLC
Page 12
Vanadium Redox Battery Demonstration Program 20-Feb-2015 Technology Performance Report Energy Storage Demonstration
Phase Task Milestone Description Date
0
0
Contract Award/Phase I Release 2/01/2010
Project Definitization/Phase II Release 11/15/2010
Kick-off Meeting 12/07/2010
I
1 Update Project Management Plan 12/15/2010
2 National Environmental Protection Act (NEPA)
Compliance 11/08/2010
3 Interoperability and Cyber Security Plan 8/16/2010
4 Metrics And Benefits Reporting Plan 1/20/2011
5B Power System Interface and Integration Design
Complete 9/30/2011
5C
Prototype Test Bed Complete 6/7/2011
10 kW Stack Prototype Go/No Go 11/3/2011
II
5D
Power Control System Complete 3/16/2012
Battery Process System 4/26/2012
Commission 1MW battery 11/1/2015
5E Facility Construction and Preparation 4/26/2012
5F Commission 1MW battery (High Molarity) N/A
5G Final Maintenance/Operating Procedures 7/30/2015
III
6
Go/No-Go Decision-Data Collection and System Monitoring 7/31/2015
Initiate Data Collection and Monitoring 8/01/2015
II & III
6
Provide Quarterly Status & Financial Reports (Build Metrics to Begin in 2012)
6/07/2010
thru 1/31/2016
Provide Semi-Annual DOE Reviews (All Aspects of the Project)
1/14/2011 thru
1/31/2016
Provide Annual DOE Reviews (All Aspects of the Project)
7/19/10 thru 1/31/2016
III 6 Submit Final Report 1/31/2016
Figure 5 Battery Milestones.

City of Painesville, Ohio
Ashlawn Energy, LLC
Page 13
Vanadium Redox Battery Demonstration Program 20-Feb-2015 Technology Performance Report Energy Storage Demonstration
1.6.1 Future Project Milestones
Final Maintenance/Operating Procedures 7/30/2015
Data Collection and System Monitoring Procedures
7/31/2015
Initiate Data Collection and Monitoring 8/01/2015
Provide Quarterly Status & Financial Reports (Build Metrics to Begin in 2012)
6/07/2010 thru
1/31/2016
Provide Semi-Annual DOE Reviews (All Aspects of the Project)
1/14/2011 thru
1/31/2016
Provide Annual DOE Reviews (All Aspects of the Project)
7/19/10 thru 1/31/2016
Submit Final Report 1/31/2016
Figure 6 Future Project Milestones.
Steps to Achieve Interoperability and Cyber-Security/Interoperability and Cyber-Security Plan was submitted to DOE August 16, 2010. Industry standards continue to develop. Ashlawn has participated in industry groups as described below:
IEEE 2030.2 (Interoperability of Energy Storage Systems Integrated with the Electric Power Infrastructure) through attending Working Group Meetings.
o Ashlawn has attained voting status; Joined Information & Communication Technology subgroup to develop guidelines for secure control, and monitoring of energy storage systems interconnected with the electrical grid and to act as liaison between IEEE and SGIP.
o Three working groups (Interconnection/testing of electrical storage for the Smart Grid). Participated in the ESS Protocol working group for 2013 on Energy Storage Performance.
o Working Group Meeting co-located with the 2012 Electric Storage Association Meeting in
Washington DC, May 1-2, 2012. Interacted with Sandia and PJM. Ashlawn will represent
emerging storage technologies and their interrelationship with the Smart Grid.
Ashlawn communicates with PJM on an ongoing basis in preparation for the first round of RTO/ISO level testing of battery system by PJM. During the demonstration effort held in early October 2011, a less than 50 msec battery response was demonstrated. Further evaluation with 5 msec band width test equipment will further refine testing results. This information will be used to extend the PJM test plan. Follow on collective collaboration with PJM, AMP and Painesville resulted in a highly efficient protocol for use of the battery in demand response and regulations service.
Continue participation in Cybersecurity for Energy Delivery Systems DOE Peer Reviews.

City of Painesville, Ohio
Ashlawn Energy, LLC
Page 14
Vanadium Redox Battery Demonstration Program 20-Feb-2015 Technology Performance Report Energy Storage Demonstration
1.7 Interactions with Project Stakeholders
1.7.1 Collaboration with DOE
The City of Painesville and Ashlawn Energy interact with the DOE in the following areas: 1) key deliverables (i.e. Project Management Plan, Cyber Security Plan, Metrics and Benefits Reporting Plan, etc.) including plan reviews and timely submittals, and 2) all ongoing DOE and Federal reporting requirements (i.e. Monthly Progress Reports, Quarterly Jobs reporting, Quarterly Federal Financial reporting, invoicing, etc.). Ashlawn collaborates and coordinates with the DOE as requested to support data or analysis that impact Smart Grid investment reports. DOE provides industry with knowledge of current trends in technology and regulations in the energy field.
Annual detailed briefings have been presented to DOE to explain the plans, progress and results of the technical effort. Additional briefings will be presented as directed by the DOE Project Officer. A final briefing will be presented at least 30 days prior to expiration of the Award.
1.7.2 Collaboration with PJM
This project presents an opportunity for Ashlawn Energy to work directly with a Regional Transmission Organization (RTO). Ashlawn Energy has developed a relationship with PJM Interconnection LLC (PJM). PJM has agreed to test Ashlawn Energy’s grid-connected VRFB. Tests will demonstrate the VRFB system’s ability to respond to and follow PJM-issued control signals and its capability of participating in PJM’s frequency regulation market.
This collaboration adds value to the project. PJM will be conducting tests on the battery both at the CTC test bed and at PMEP. These tests will include testing basic battery capacity, response time, and ability to follow regulation and pricing signals. It is expected that lab-scale PJM tests will provide valuable input that will positively impact full-scale deployment in Painesville, Ohio.
Early collaboration with PJM ensures that test plans and data acquisition systems will be consistent with power industry standards and will provide RTO-relevant data when operational. PJM has provided access to its engineers whose early involvement in the design process has helped to drive system requirements and to provide an early reality check to system and performance metrics. PJM also provided early input into the ways that the flow battery could participate in composite electric markets. It is expected that interaction with PJM will properly orient this project and enable the development of a system that is an optimized, active component of the Smart Grid.
1.7.3 Interactions with Northeast Ohio Non-profit Organizations
Ashlawn interacts with Northeast Ohio non-profit stakeholders such as NorTech, who has organized advanced energy and energy storage industry clusters, and has provided additional funding to continue testing of Ashlawn Energy prototypes. Ashlawn Energy participates with NorTech’s Speed-To-Market Accelerator program (STMA) that has funded testing and engineering work performed by MAGNET (Manufacturing Advocacy and Growth NETwork) engineers. The primary desired outcome to NorTech and MAGNET in assisting Ashlawn Energy’s engineering and testing is the high-tech manufacturing jobs Ashlawn will expect to create in northeast Ohio. Through a recent reorganization by the State of Ohio, NorTech was merged into another state-funded non-profit, Team NEO, an economic development organization focused on growing the economy in northeast Ohio.

City of Painesville, Ohio
Ashlawn Energy, LLC
Page 15
Vanadium Redox Battery Demonstration Program 20-Feb-2015 Technology Performance Report Energy Storage Demonstration
2 Description of Energy Storage Technologies and Systems
2.1 Location of the storage system
When complete, the VRFB system will be located at the battery building next to the Painesville Municipal Electric Power plant at 325 Richmond Street, Painesville, OH 44077 (Longitude 41.728881, Latitude 81.251805) (see map and photo below.)
Figure 7 Painesville Municipal Power and Battery Building, 325 Richmond Street, Painesville, OH 44077.
Ashlawn Energy Battery
Building Painesville Municipal Electric Power Plant

City of Painesville, Ohio
Ashlawn Energy, LLC
Page 16
Vanadium Redox Battery Demonstration Program 20-Feb-2015 Technology Performance Report Energy Storage Demonstration
Figure 8 Ashlawn Battery Building, Painesville Municipal Electric Power, 325 Richmond St., Painesville, OH 44077.
2.2 Configurations of Systems and System Parameters
Location Adjacent to Painesville Municipal Power
Plant
Weight, footprint, and dimensions
Footprint including instrument enclosure – 3,905
ft2
and 28 ft high, Four electrolyte tanks each 16,000 gallon capacity, 128 10 kW Stacks.
Transportability N/A
MW nameplate rating 1.16 MW
MWH nameplate capacity (including depth of discharge, operating conditions)
250 kWh (80-20% SOC normal depth of
discharge, 75F 10F)
Energy density 25 Wh per kg System components (e.g., storage module, power conversion system, cooling system, balance of plant)
Battery Stacks, Electrolyte Circulating System, Battery Controller, Tanks, Cooling System, Power Conversion System, Building
Figure 9 Profile of the Field Demonstration System.
2.3 Data Measurements
Detailed below are required storage system measurements and recordings, including balance of plant status and external operating environment data over the course of the demonstration.

City of Painesville, Ohio
Ashlawn Energy, LLC
Page 17
Vanadium Redox Battery Demonstration Program 20-Feb-2015 Technology Performance Report Energy Storage Demonstration
Data Element Description Tracked by Sampling Rate /
Notes
Operational mode
Charging / Discharging / Standby / Off
Battery Charge Controller
See Note
kW input kW going into battery system
Power Converter
See Note
kW output kW going out of battery system
Power Converter
See Note
Voltage 700 – 1100 VDC Power Converter
See Note
VAR 1,111 kVA Power Converter
See Note
Amp 0 to 1200 Amps Power Converter
See Note
kWh 6,000 to 8,000 kWh Battery
Controller See Note
Frequency 59.5 to 60.5 Hertz Power Converter
See Note
Figure 10 Required Storage System Measurements and Recordings.
Data Element Description Tracked by Sampling Rate /
Notes
Power factor 0.9 to 1.0 lagging or leading
Power Converter
See Note
Battery system state of charge
Full Range 100% to 0%, Nominal Range 80% to 20%
Battery Charge Controller
See Note
Response time
Battery Response to charge or discharge demand signals
Battery Charge Controller
See Note
Number of cycles
Number of charge / discharge cycles
Battery Charge Controller
See Note
Harmonics
Existence of waveforms in integer multiples of 60 Hz
Power Converter
See Note
Hourly electricity price Market price of electricity
Market See Note
Figure 11 Performance Measurements and Recordings.

City of Painesville, Ohio
Ashlawn Energy, LLC
Page 18
Vanadium Redox Battery Demonstration Program 20-Feb-2015 Technology Performance Report Energy Storage Demonstration
Note: For sampling rates, the Programmable Logic Control Systems and Data Acquisition System for the Battery Control and Converter Control will provide the data sampling protocols. Each of these systems is capable of sampling times in the millisecond range for data such as response time. Nominal sample rates will be at 10 seconds or longer intervals for steady state operations. The systems have the capability of increasing sampling rates to seconds or considerably less, for dynamic measurement periods. Market data will be collected from various sources.
2.4 System Performance Parameters
Technical, economic, and environment health & safety (EHS) performance characteristics will be measured or calculated over the course of the demonstration.
The primary Environment, Health and Safety issues to be addressed in the design and operation of the PMEP Vanadium Flow Battery are (1) system inventory of up to approximately 32,000 gallons of electrolyte solution consisting of a Vanadium Sulfuric Acid Solution and (2) potential for hydrogen gas generation in the event of battery overcharging.
The Vanadium Electrolyte in the Ashlawn Battery System consists of Vanadium, Sulfuric Acid, and Water. The electrolyte does not contain any other stabilizing chemicals. Vanadium in solution is not a toxic or hazardous chemical. Sulfuric acid is not a Resource Conservation and Recovery Act (RCRA) controlled chemical and in fact is among the most common industrial chemicals in the world. The PMEP design and operations plan includes many features intended to contain the electrolyte and minimize exposure to personnel and the environment, these steps include:
Material selection for plant construction to minimize the use of metal susceptible to corrosion in a sulfuric acid environment.
Use of double walled construction in storage tanks.
Selection of system pumps that minimize potential for seal leakage.
Design of the battery building to include an integrated containment in the foundation that will contain the complete discharge of two electrolyte tanks due to leakage into the building.
Design of system cross connects and overflow tanks to contain electrolyte in the event of pumping misalignments.
Plant operations minimizes the requirements for sampling and maintenance that expose plant personnel to electrolyte.
Operating procedures require use of Personnel Protective Equipment and Outerwear during all evolutions that could expose operators to electrolyte.
The generation of unsafe amounts of hydrogen gas is an unlikely event but due to the potential issues associated with accumulation of hydrogen gas, the following safety design and operational features are part of the PMEP design:
The battery charge and discharge operating profiles will be established to ensure plant operations do not result in any measurable hydrogen generation.
The PMEP Battery Control and Monitoring system will be programmed to alarm and shutdown the system if operating parameters such a voltage and current indicate a condition leading to excess hydrogen generation is being approached.

City of Painesville, Ohio
Ashlawn Energy, LLC
Page 19
Vanadium Redox Battery Demonstration Program 20-Feb-2015 Technology Performance Report Energy Storage Demonstration
The PMEP will contain hydrogen detectors that will automatically employ building ventilation to remove any detected hydrogen in the building. The detectors will also shut down the battery system if hydrogen accumulation at alarm limits is detected.
2.4.1 Projected Performance Parameters
Performance characteristics that will require extrapolating or forecasting based on data collected during the demonstration. Examples include life cycle cost information and long term capacity degradation. The following table contains our forecast for these parameters.
Figure 12 Projected Performance Parameters.
2.4.2 Data Acquisition Systems
There will be two separate data acquisition systems that correspond to bench-level testing at CTC and grid deployment at Painesville Municipal Power. This section will address only the PMEP grid level data acquisition system.
Ashlawn Energy will oversee the design and construction of each data acquisition system (DAS). As the DAS design is finalized, the City of Painesville Team will provide the following information to DOE for review prior to purchase and installation of the equipment:
1. A one-line schematic of DAS which includes meter locations on the grid and all relevant
Projected Performance Parameters Figure 1 Projected Performance Parameters.
• Cycle life (Maximum number of cycles the battery will endure before expended. Based on degradation of performance parameters – kWh available per cycle, grounds, ability to charge, and shunt currents,) Initial design cycle life = 6,000 cycles (Total design cycle life is 18,000 cycles with two (2) stack recores).
• Calendar life (Calendar life derived by knowing maximum number of expected cycles and average cycles per day) based on two stack recores, calendar life is projected to be in excess of 20 years.
• Total life cycle maintenance cost (Based on above plus cost data) is $840,000($42,000 per year for 20 years).
• Total life cycle operating cost (Based on above plus cost data) is $2.95 Million ($147,500 per year for 20 years)
• Capacity degradation (Based on above plus cost data) 2% per year. 18% between stack recores (approximately 9 years)
• Capital cost ($/kWh over lifetime based on above plus cost data) $.182 per kWh
• Stack recore will consist of removing the bolts and taking the stack apart and inspecting elements that are likely to fail over time. The most likely failure is the membrane, which would produce internal stack electrolyte leaks. Graphite felt is also an area of attention as the graphite can flake off the felt material causing clogging of the electrolyte. Graphite plates may corrode, though that is less likely. During the recore, these degraded elements will be replaced with fresh components, and the stack reassembled and bolted.

City of Painesville, Ohio
Ashlawn Energy, LLC
Page 20
Vanadium Redox Battery Demonstration Program 20-Feb-2015 Technology Performance Report Energy Storage Demonstration
hardware necessary to download data to TPO
2. Specifications of DAS components.
2.4.2.1 Painesville Data Acquisition System
Data will be acquired from three groups of systems. Specific details about each data acquisition logging system will be presented as they become available.
Painesville Flow Battery Data Logging System
1. Plant SCADA (Plant): System level information will be extracted from plant SCADA systems log files with the assistance of PMEP personnel. Plant SCADA currently is a Rosemont V with an upgrade to a new SCADA system anticipated within a year. Plant SCADA logs will be responsible for most system level information
2. Power Converter: The power converter system that sits between the AC power plant and the DC battery provides a rich data stream. It is expected that the power converter will provide a significant portion of project-level data corresponding to such things as power, voltage, current, frequency, power factor, et cetera. The data logging functions of the power converter system will be provided by the power converter Programmable Logic Control unit. Specifications on the converter PLC output data stream handling are premature at this stage of development; however, this topic will be addressed in the next 6 months.
3. Battery Control System (Battery): The battery control system will record data elements such as environment, battery operation variables, and battery controller state (charging/discharging)
4. Pricing Interface (Market Interface): A system TBD that will record power pricing information relevant to the system. Ashlawn is evaluating systems currently offered and available from skilled external industry service providers/brokers (see Section 4.9 for further discussion and details.)

City of Painesville, Ohio
Ashlawn Energy, LLC
Page 21
Vanadium Redox Battery Demonstration Program 20-Feb-2015 Technology Performance Report Energy Storage Demonstration
Figure 13 Draft Painesville Flow Battery Data Logging System.
Power Inverter
INPUT RATINGS:
Maximum input voltage 600 V DC
Range of input operating voltage 340 V DC – 575 V DC
Maximum input current (DC) 750 A
Maximum input short circuit current 2850 A
OUTPUT RATINGS:
Output power factor rating >0.99
Operating voltage range (AC) 422-528 V AC
Operating frequency range or single frequency 59.3 – 60.5 Hz
Number of Phases 3
Nominal output voltage (AC) 480 V AC
Nominal out frequency 60.0 Hz
Maximum continuous output current (AC) per line 368 ARMS
Maximum continuous output power (AC) 290 kW
Maximum output fault current (AC) and duration 2.08 kA peak for 6 msec
379 ARMS @ 3 cycles
Maximum output overcurrent protection 390 A
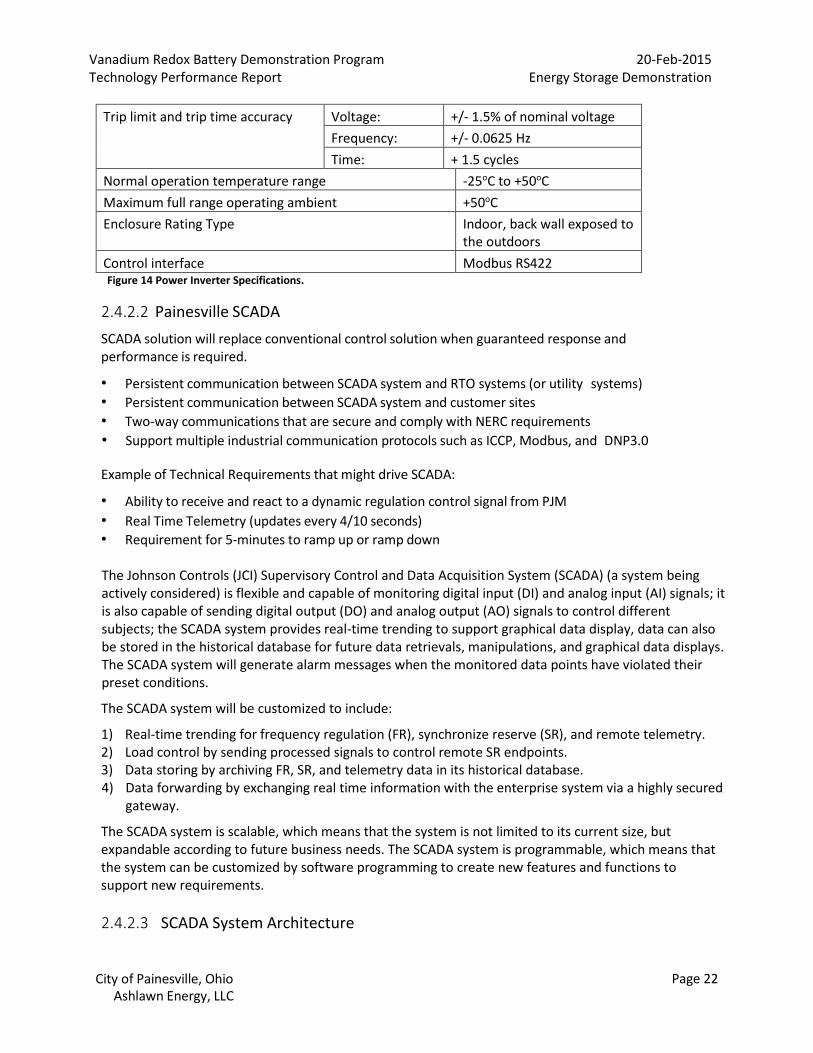
Utility interconnection voltage and frequency trip limits and trip time accuracy.
City of Painesville, Ohio
Ashlawn Energy, LLC
Page 22
Vanadium Redox Battery Demonstration Program 20-Feb-2015 Technology Performance Report Energy Storage Demonstration
Trip limit and trip time accuracy Voltage: +/- 1.5% of nominal voltage
Frequency: +/- 0.0625 Hz
Time: + 1.5 cycles
Normal operation temperature range -25oC to +50oC
Maximum full range operating ambient +50oC
Enclosure Rating Type Indoor, back wall exposed to the outdoors
Control interface Modbus RS422 Figure 14 Power Inverter Specifications.
2.4.2.2 Painesville SCADA
SCADA solution will replace conventional control solution when guaranteed response and performance is required.
• Persistent communication between SCADA system and RTO systems (or utility systems)
• Persistent communication between SCADA system and customer sites
• Two-way communications that are secure and comply with NERC requirements
• Support multiple industrial communication protocols such as ICCP, Modbus, and DNP3.0
Example of Technical Requirements that might drive SCADA:
• Ability to receive and react to a dynamic regulation control signal from PJM
• Real Time Telemetry (updates every 4/10 seconds)
• Requirement for 5-minutes to ramp up or ramp down
The Johnson Controls (JCI) Supervisory Control and Data Acquisition System (SCADA) (a system being actively considered) is flexible and capable of monitoring digital input (DI) and analog input (AI) signals; it is also capable of sending digital output (DO) and analog output (AO) signals to control different subjects; the SCADA system provides real-time trending to support graphical data display, data can also be stored in the historical database for future data retrievals, manipulations, and graphical data displays. The SCADA system will generate alarm messages when the monitored data points have violated their preset conditions.
The SCADA system will be customized to include:
1) Real-time trending for frequency regulation (FR), synchronize reserve (SR), and remote telemetry. 2) Load control by sending processed signals to control remote SR endpoints. 3) Data storing by archiving FR, SR, and telemetry data in its historical database. 4) Data forwarding by exchanging real time information with the enterprise system via a highly secured
gateway.
The SCADA system is scalable, which means that the system is not limited to its current size, but expandable according to future business needs. The SCADA system is programmable, which means that the system can be customized by software programming to create new features and functions to support new requirements.
2.4.2.3 SCADA System Architecture

City of Painesville, Ohio
Ashlawn Energy, LLC
Page 23
Vanadium Redox Battery Demonstration Program 20-Feb-2015 Technology Performance Report Energy Storage Demonstration
The SCADA system configuration diagram is shown below. The SCADA system is built within an isolated private redundant network, which consists of Cisco routers functioning as firewalls to provide network security and Cisco switches to support network connectivity and zoning, to maximize network security. Note that the Johnson Controls system network is physically separated, but virtually connected through VPN and VLAN connections through the internet. Two Windows based main servers running on VMware are physically located in Portland and connected to LAN A and LAN B. Each server consists of a pair of DAC/HIST virtual servers, which installed with identical SCADA applications such as:
1) Front End Processor (FEP) module, 2) Inter-control Center Communications Protocol (ICCP) module, 3) Data Acquisition and Control (DAC) module, 4) Real-time Database (RDB) module, 5) Historical Database (HDB) module and other system management modules.
These two servers constitute redundancy to prevent system malfunction in case of server failure. Two terminal servers connected to a serial communications switches for A/B switching are tied to the Portland network to support remote end-points serial communications. A corporate user server (CORP1) is connected to LAN H, which is the DMZ (Demilitarized Zone - the segment that supports the external advertised services), behind the firewall. The CORP1 is used for hosting non-critical application modules.
A Performance Database Server (PDS) and its workstation are connected to the redundant network LAN D via Cisco switch. Three operator workstations are tied to another redundant network LAND C by using another Cisco switch. The two Cisco switches are terminated to a Cisco router, which acts as a firewall to protect the system as well as to provide secured VPN communications between offices (Johnson Controls offices are located at Portland, OR, and San Jose, CA).
The PDS is a standalone device which installed with software modules that are identical to the main servers. Engineers can use the PDS for new software development, testing and deployment without interrupting the main system operations. Each workstation has a set of dual-screen monitors to allow users to interact with the SCADA system via the system’s graphical user interface (GUI). A user can bring up different displays to monitor real time data, read trends, pull historical data, reset alarms, send control signals, and do much more.
SCADA solution provides:
Persistent communication between SCADA system and RTO systems (or utility systems)
Persistent communication between SCADA system and customer sites
NERC compliance Secure two way communications
Support multiple industrial communication protocols such as ICCP, Modbus, and DNP3.0
An example of Technical Requirements that might drive SCADA:
Ability to receive and react to a dynamic regulation control signal from PJM
Real Time Telemetry (updates every 4/10 seconds)
Requirement for 5-minutes to ramp up or ramp down

City of Painesville, Ohio
Ashlawn Energy, LLC
Page 24
Vanadium Redox Battery Demonstration Program 20-Feb-2015 Technology Performance Report Energy Storage Demonstration
Figure 15 Battery SCADA Architecture
The grid communicates through the SCADA device every 2 seconds via signals that request an increase or decrease in electrical demand within an established range. The battery responds accordingly to these requests and becomes a resource for the smart grid.
The value to the owner of the battery is:
Compensation from the grid for the regulation service provided.
Potential to use the battery for other purposes (UPS, Power Factor Correction, Black Start etc.)
More stable grid operation ultimately leads to a more reliable grid.
JCI handles all market bidding, settlements and back office iteration with the electric grid.
Participation Parameters
Participants can pick and choose any hours of the day to opt-in or out. The minimum required for registration in the program is +/- 100kW.
Compensation for participation
Compensation in the Frequency Regulation program is a function of how precisely a resource can follow the PJM regulation signal in a given hour, the Frequency Regulation clearing price for a given hour and
Battery SCADA Architecture

City of Painesville, Ohio
Ashlawn Energy, LLC
Page 25
Vanadium Redox Battery Demonstration Program 20-Feb-2015 Technology Performance Report Energy Storage Demonstration
the number of hours a resource is available in a given time period.
3. Description of the Analysis Methodologies
The program management plan approach is supported by sound management practices intended to assure success. The City of Painesville has assembled a highly qualified and capable team to manage and implement all aspects of the program. The battery is being manufactured and installed by Ashlawn Energy. PMEP and its team of system integrators and electrical contractors will validate all interfaces and assure all connections, and operating know how for the battery to interface with the both the power plant and with the power grid.
Ashlawn Energy will monitor and collect data through an integrated SCADA system that will address and collect data for a period of not less than 24 months. Data will be collected and analyzed on an hourly basis, monitored on a daily basis, and provided monthly to a panel of experts for review and evaluation. Through monitoring, the City of Painesville and Ashlawn Energy will ensure that equipment is functioning adequately and collecting the desired data as outlined below. Ashlawn Energy will connect the SCADA system to the power conversion module as well as the batteries, transformers, and transfer equipment in accordance with final system design. At the end of the data collection and system monitoring phase, the City of Painesville will verify all data and prepare final data collection information for submission to DOE.
Baseline data will be extracted from operating data of the battery system. In order to obtain accurate baseline information (PMEP operation without a storage system in place), data from the actual power plant operation during the 2-year period prior to commissioning the storage battery system will be used as the project baseline. Prior to the commencement of the Data Collection and Monitoring period, the PMEP team will compile this baseline data.
3.1 Analysis Objectives
3.1.1 Data Measurements
Detailed below are required storage system measurements and recordings, including balance of plant status and external operating environment data over the course of the demonstration.
Data Element Description Tracked By Sampling Rate /
Notes
Operational mode
Charging / Discharging / Standby / Off
Battery Charge Controller
See Note
kW input kW going into battery system
Power Converter
See Note
kW output kW going out of battery system
Power Converter
See Note
Voltage 700 – 1100 VDC Power Converter
See Note
VAR 1,111 kVA Power Converter
See Note

City of Painesville, Ohio
Ashlawn Energy, LLC
Page 26
Vanadium Redox Battery Demonstration Program 20-Feb-2015 Technology Performance Report Energy Storage Demonstration
Amp 0 to 1200 Amps Power Converter See Note
kWh 6,000 to 8,000 kWh Battery Controller
See Note
Frequency 59.5 to 60.5 Hertz Power Converter
See Note
Power factor 0.9 to 1.0 lagging or leading
Power Converter
See Note
Battery system state of charge
Full Range 100% to 0%, Nominal
Range 80% to 20%
Battery Charge Controller
See Note
Response time
Battery Response to charge or discharge demand signals
Battery Charge Controller
See Note
Number of cycles
Number of charge / discharge cycles
Battery Charge Controller
See Note
Harmonics
Existence of waveforms in integer multiples of 60 Hz
Power Converter
See Note
Hourly electricity price Market price of electricity
Market See Note
Figure 16 Data Measurements.
Note: For sampling rates, the Programmable Logic Control Systems and Data Acquisition System for the Battery Control and Converter Control will provide the data sampling protocols. Each of these systems is capable of sampling times in the millisecond range for data such as response time. Nominal sample rates will be at 10 seconds or longer intervals for steady state operations. The systems have the capability of increasing sampling rates to seconds or considerably less, for dynamic measurement periods. Market data will be collected from various sources.
3.2 Methodologies for Determining Technical Performance
3.2.1 System Performance Parameters
Technical, economic, and environment, health & safety (EHS) performance characteristics will be
measured or calculated over the course of the demonstration.
City of Painesville, Ohio
Ashlawn Energy, LLC
Page 27
Vanadium Redox Battery Demonstration Program 20-Feb-2015 Technology Performance Report Energy Storage Demonstration
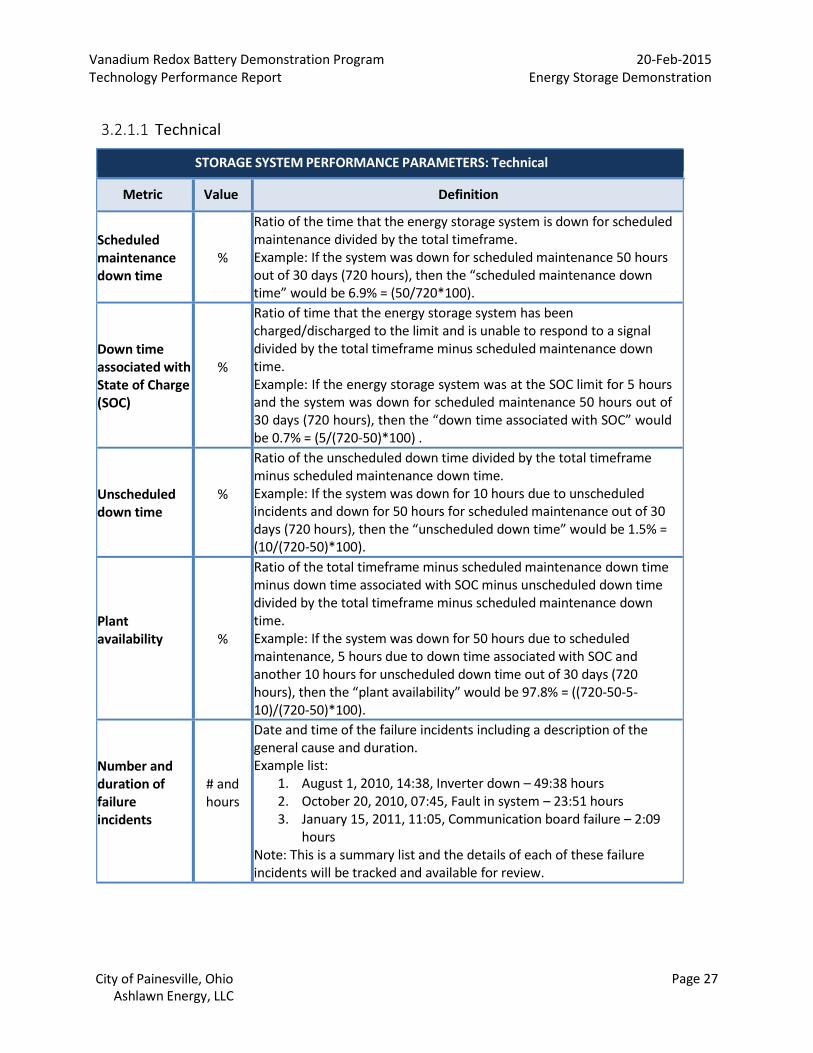
3.2.1.1 Technical
STORAGE SYSTEM PERFORMANCE PARAMETERS: Technical
Metric Value Definition
Scheduled maintenance down time
%
Ratio of the time that the energy storage system is down for scheduled maintenance divided by the total timeframe. Example: If the system was down for scheduled maintenance 50 hours out of 30 days (720 hours), then the “scheduled maintenance down time” would be 6.9% = (50/720*100).
Down time associated with State of Charge (SOC)
%
Ratio of time that the energy storage system has been charged/discharged to the limit and is unable to respond to a signal divided by the total timeframe minus scheduled maintenance down time. Example: If the energy storage system was at the SOC limit for 5 hours and the system was down for scheduled maintenance 50 hours out of 30 days (720 hours), then the “down time associated with SOC” would be 0.7% = (5/(720-50)*100) .
Unscheduled down time
%
Ratio of the unscheduled down time divided by the total timeframe minus scheduled maintenance down time. Example: If the system was down for 10 hours due to unscheduled incidents and down for 50 hours for scheduled maintenance out of 30 days (720 hours), then the “unscheduled down time” would be 1.5% = (10/(720-50)*100).
Plant availability
%
Ratio of the total timeframe minus scheduled maintenance down time minus down time associated with SOC minus unscheduled down time divided by the total timeframe minus scheduled maintenance down time. Example: If the system was down for 50 hours due to scheduled maintenance, 5 hours due to down time associated with SOC and another 10 hours for unscheduled down time out of 30 days (720 hours), then the “plant availability” would be 97.8% = ((720-50-5- 10)/(720-50)*100).
Number and duration of failure incidents
# and hours
Date and time of the failure incidents including a description of the general cause and duration. Example list:
1. August 1, 2010, 14:38, Inverter down – 49:38 hours 2. October 20, 2010, 07:45, Fault in system – 23:51 hours 3. January 15, 2011, 11:05, Communication board failure – 2:09
hours Note: This is a summary list and the details of each of these failure incidents will be tracked and available for review.

City of Painesville, Ohio
Ashlawn Energy, LLC
Page 28
Vanadium Redox Battery Demonstration Program 20-Feb-2015 Technology Performance Report Energy Storage Demonstration
Energy dispatched on day-to-day and lifetime basis
kWh
Energy dispatched on day-to-day basis accumulated for entire project.
Round-trip efficiency (RTE)
%
Ratio of total energy storage system output (discharge) divided by total energy input (charge) as measured at the interconnection point. Example: If the total output was 5,000 kWh, but the total energy input was 6,500 kWh, then the “round-trip efficiency” would be 76.9% = (5,000/6,500*100). Note: supplemental loads and losses (e.g., cooling, heating, pumps, DC/AC and AC/DC conversions, control power, etc.) consumed the 1,500 kWh.
Capacity degradation
%
Ratio of energy capacity at the end of the time period divided by the capacity at the beginning. Example: If the total energy storage system capacity at the end of the project had a capacity of 4,000 kWh and at the start of the project was 5,000 kWh, then the “capacity degradation” would be 20% = ((5,000-4,000)/5,000*100). Note: for battery systems, this measurement is taken on the device DC bus. Otherwise it is at the interconnection point.
Ramp rate (charge/ discharge)
kW/sec Graph and Table
The change in power charged and discharged over time to meet the variations in power requirements. Graphically (with resolution of 100 msec) demonstrate the energy storage system’s sustainable maximum ramp rate (kW/sec). List the number of times that the energy storage system did not meet the requested ramp rate on a daily basis. Example Details: August 29, 2010, 15:34:28, Maximum Discharge 0kW – 1,000kW achieved in 4 seconds.
Figure 17 Performance Parameters: Technical
3.2.1.2 Test Bed/Prototype Flow System
Ashlawn Energy conducts stack tests at Concurrent Technologies Corporation (CTC), located in Johnstown, PA, to assess the performance characteristics of several different battery stack configurations, and the test bed electrolyte circulation system. CTC designed the electrolyte process flow system for the flow battery test bed. The CTC test bed and test plan provide a framework for testing of prototype flow battery stacks and electrolyte process flow system to determine:
What range of electrolyte pressure is required to provide consistent flow rates through the battery stacks
Battery stack ability to handle electrolyte pressures with no or minimal leakage
What effect does electrolyte temperature have on operating flows and pressure drops as a result of viscosity changes
What effect does electrolyte state of charge (SOC) have on operating flows and pressure drops as a result of viscosity changes

City of Painesville, Ohio
Ashlawn Energy, LLC
Page 29
Vanadium Redox Battery Demonstration Program 20-Feb-2015 Technology Performance Report Energy Storage Demonstration
Confirmation that gravity flow will work for electrolyte supply, or alternatively if pumped electrolyte supply will be required
Assuming gravity flow is feasible, what controls methods will be required
Characteristics of charging across a range of rates, temperatures, initial SOC
Characteristics of discharging across a range of rates, temperatures, initial SOC
What range of electrolyte pressures and flows are required for various operating modes of the flow battery
Capabilities of selected methods of measuring electrolyte SOC
Stack open circuit voltages and internal resistance
Electrolyte leakage (shunt) current levels through piping and manifolds
Transient abilities – how quickly changes from charge to discharge (and back) can occur
Energy efficiency of the stacks and electrolyte
Any changes in ability to charge/discharge over multiple cycles
Any shifting in electrolyte levels due to osmosis (or other means) across the membrane
Any effects on electrolyte caused by use of centrifugal pumping
Signs of stratification in electrolytes, and need to change draw point for charge versus discharge.

City of Painesville, Ohio
Ashlawn Energy, LLC
Page 30
Vanadium Redox Battery Demonstration Program 20-Feb-2015 Technology Performance Report Energy Storage Demonstration
3.2.1.2.1 Test Bed Features
Piping designed for gravity flow or conversion to pump-forced flow
Peristaltic pumps are used for electrolyte transport (centrifugal pumps for later testing)
Motorized valves at strategic locations to limit electrolyte escape in case of any failure/emergency condition
Secondary containment under critical components
Hand isolation valves at critical locations to allow easy reconfiguration or component change out with minimal electrolyte escape
Pressure relief and overflow lines to avoid catastrophic electrolyte releases
Manually-operated diaphragm valves for pressure/flow balance; (conversion to electrical operation once requirements are determined)
Ability to easily introduce more electrolyte into the circulating loop (or remove it) – to enable longer or shorter charge/discharge cycles
Nitrogen blanketing over all active electrolyte vessels
Temperature and pressure monitoring both in and out of the stack for each electrolyte
Flow monitoring for each of the two electrolytes through the stack
Liquid level sensors in the elevated electrolyte supply tanks to control liquid level (head pressure) through commands to the electrolyte pumps
DC current supply/loading through CTC’s AeroVironment ABC170 power supply
Stack DC voltage and current monitoring
SOC monitoring for each electrolyte (planned but more investigation is necessary)
Electrolyte temperature control
2.5 KW Cell Stack
Spill Containment – majority of pumps, valves and sensors will be located here.
Control/Data Acquisition Panel
Electrolyte @ 10’
Electrolyte @ 20’
Electrolyte @ 30’
Electrolyte Supply Tanks raised to 7’ to allow gravity flow to sumps
Steel Rack- levels adjustable in 6” increments
Tank Spill Containment (typical)
Figure 18 Test Bed Schematic.

City of Painesville, Ohio
Ashlawn Energy, LLC
Page 31
Vanadium Redox Battery Demonstration Program 20-Feb-2015 Technology Performance Report Energy Storage Demonstration
through a water to electrolyte heat exchanger, plant chilled water supply, water heater, and other required controls.
Pulsation dampeners to be incorporated if pumped flow through the stack is required (future if required)
The system controller utilizes a Rockwell (Allen-Bradley) ControlLogix programmable logic controller (PLC) for overall system control, and a personal computer (PC) running data acquisition and Human-Machine-Interface (HMI) software. The system controller PLC was programmed with Rockwell Software RSLogix 5000. The HMI is programmed with Rockwell’s RSView 32 software. This afforded the project large benefits in control and data acquisition.
3.2.1.2.2 Test Execution
Prior to insertion of the prototype stack into test bed plumbing, test bed operation was checked using water which also determined basic flow and pressure parameters and of the test bed.
Next, gravity flow of electrolytes was tested through the test bed and stack. Initial trials focused on determining the range of electrolyte pressures required to provide consistent flow rates through the battery stacks, including stack inlet and outlet pressures. These observations confirmed the battery stack’s ability to handle electrolyte pressures in order to avoid leakage.
Characteristics of charging across a range of charge rates, flow rates, temperatures, and SOC are conducted. Beyond certain charging limits, hydrogen and oxygen detectors are monitored for gas evolution. Quantities of electrolyte within the circulating flow loop are varied to allow shorter or longer cycle testing. Electrical charging control approaches included variations of constant wattage, constant voltage, or constant current. Characteristics of discharging across a range of discharge rates, electrolyte flow rates, temperatures, and SOC are made.
Test Control Parameters
Discharging current
Electrolyte flow rate (adjusted through head pressure and/or manual diaphragm valves)
Electrolyte SOC (as changing during testing)
Electrolyte temperature (changing during discharge)
3.2.1.3 Electrolyte State of Charge Sensor Testing
Total State of Charge (SOC) monitoring is indicated through voltage measurements of an open-circuited cell. The SOC of the positive and negative electrolytes drift over time with respect to each other. Open-circuited cell and ORP sensors are used for electrolyte SOC monitoring to determine relationships between OCV and electrolyte state of charge, flow rates, and time, as well as to determine correlation/repeatability of these relationships.
3.2.1.4 Battery Internal Resistance Determination
The internal resistance of the battery is an important factor during both charging and discharging. This test indirectly measures effective internal resistance values as a function of electrolyte SOC, charging (at various rates and SOC), discharging (at various rates and SOC), electrolyte flow rates, temperature, etc. Open circuit voltages are measured at a range of operating parameters and SOC. Similarly, voltage and current readings are taken at the same operating parameter points, but with a range of electrical loading on the stack. Current readings are taken as terminal voltage approaches zero. Based upon this data, an estimate of battery internal resistance, and stack short circuit current capability are determined.

City of Painesville, Ohio
Ashlawn Energy, LLC
Page 32
Vanadium Redox Battery Demonstration Program 20-Feb-2015 Technology Performance Report Energy Storage Demonstration
3.2.1.5 Electrolyte Leakage Current Testing
The vanadium redox electrolyte has relatively low electrical resistance. Across a single 40 cell stack (open circuit voltages less than 80 VDC), leakage current through electrolyte in supply piping is within reasonable limits. However, with multiple stacks in series (electrically), the maximum voltage is 1000 VDC. Future testing will help determine effective electrolyte resistances, and identify minimum piping lengths between stacks/manifolds/electrolyte tanks. The need for more exotic electrolyte segmentation may be identified. This test will be performed by connecting two stacks in series electrically, while they are flowing electrolyte from the common supply and return manifolds (parallel plumbing connections). The primary input variable to this test is the effective piping distance from the one stack to the manifold and to the next stack. Current measurements will be taken using a sensitive Hall Effect current transducer around an electrolyte supply pipe.
3.2.1.6 Energy Efficiency Measurements
Round-trip efficiency tests – i.e., what percentage of energy expended to charge a battery can later be recovered – are conducted, limited to DC input to DC output (excluding parasitic heat exchange and pumping energies). Some data on these parasitic loads are measured or estimated. Charge and discharge efficiencies are determined at various charge and discharge rates. Efficiency effects at various SOC are examined.
3.2.1.7 Liquid Migration Trials
Tests are conducted to determine if any shifting in electrolyte levels occur due to osmosis (or other means) across the membrane. This test is performed by continuously circulating electrolytes at various SOC with no pressure difference, various pressure differences with positive electrolyte pressure greater, and various pressure differences with negative electrolyte pressure greater.
3.2.1.8 Centrifugal Pump Testing
Centrifugal peristaltic pumps are used because they are relatively gentle on liquids and do not create significant turbulent flow conditions, and opportunities for problematic electrolyte effects such as solids dropping out of solution. In the future, magnetic-drive pumps will be substituted for the peristaltic electrolyte pumps, and a series of tests will be executed to allow a determination of any negative effects on the electrolyte. These tests will incorporate a range of flow rates designed to simulate the entire realistic system operating range.
3.2.1.9 Long Term/Multiple Cycle Monitoring
There are multiple flow battery operational characteristics and potential issues which may be evident only after multiple charge/discharge cycles. Once stable stack and flow system operation is achieved, data will be monitored for evidence of the following:
Any changes in ability to charge/discharge over multiple cycles
Symptoms of changes in parameters for charging at various electrolyte states of charge
(voltage/current required to charge)
Determine if a shift in state of relative SOC occurs between the two electrolytes over multiple cycles
Signs of problems with stacks

City of Painesville, Ohio
Ashlawn Energy, LLC
Page 33
Vanadium Redox Battery Demonstration Program 20-Feb-2015 Technology Performance Report Energy Storage Demonstration
Monitor for electrolyte reservoir pressure increases potentially indicating gas generation during
charge/discharge (possibly hydrogen generation).
Look for signs of stratification in the electrolyte
o Determine if any stirring/pumping is required
o Determine if there is any need to draw from the top of the tank for charging and the bottom
for discharging (or vice versa)
Rate of electrolyte static discharge within the stack by leaving charged electrolyte in the stack with
no electrical connections
Degradation of each bulk electrolyte’s SOC over time (with no activity).
3.2.1.10 Testbed Upgrades
CTC incorporated improvements to the test facility to enable pumped flow of up to 20 gallons per minute (gpm) in May 2012. The new test bed design enables dual testing of dissimilar stacks and testing of multiple taps (up to 10 individual battery cells). The multiple tap capability was used to confirm efficiency gains from felt bonding as well as the effect of other design changes.
Various algorithms continue to be developed during the month for unattended, round the clock operations. Charge/discharge profiles are also being developed for each the various stack configurations.
Figures 19 and 20 Front and Rear of Testbed Electrolyte Tanks and Sumps.

City of Painesville, Ohio
Ashlawn Energy, LLC
Page 34
Vanadium Redox Battery Demonstration Program 20-Feb-2015 Technology Performance Report Energy Storage Demonstration
Figure 21 Rear of Negative Electrolyte Sump.
Figure 22 Side View of Positive Electrolyte Sump and Pumps.

City of Painesville, Ohio
Ashlawn Energy, LLC
Page 35
Vanadium Redox Battery Demonstration Program 20-Feb-2015 Technology Performance Report Energy Storage Demonstration
Figure 23 Electrical Control Panel and Right Side of Negative Sump.
Figure 24 Peristaltic Pumps on Spill Containment Skids.

City of Painesville, Ohio
Ashlawn Energy, LLC
Page 36
Vanadium Redox Battery Demonstration Program 20-Feb-2015 Technology Performance Report Energy Storage Demonstration
3.2.2 Power Systems
The power inverter and the software controls used to operate the PMEP battery will be obtained from outside vendors. The decision on the inverter manufacturer, Battery Management System (BMS), and Supervisory Control And Data Acquisition (SCADA) system will be employed in the Painesville battery depends on final decisions regarding the PJM power markets the battery will participate in, delivery dates, and of course, pricing. Since these components of the battery system are both critical and expensive, they drive the overall battery design in terms of size and operational parameters. These components are customized for a particular application, but to reduce cost the Painesville Battery the project will employ off-the-shelf inverters and commercially available control system to the greatest extent possible.
Several power inverters were reviewed by Ashlawn Energy to provide AC/DC and voltage conversions. Initially, the American Superconductor PM-3000 was considered, but a final decision has not yet been made. Final decision criteria will be made based on having the best technical solution that meets the operational needs of the battery, pricing, and availability.
SCADA solutions are offered by providers as “software as a service (SaaS)”, essentially hosted software and service solutions, which include intelligent metering, access to a 24-hour market operations center staffed with regional grid operator-certified personnel who perform forward market offers, real-time generation offers, scheduling and monitoring, reserve and regulation offers, and monitoring. The SCADA interconnects at the 4160 VAC bus for the City of Painesville’s Municipal Electric Plant (PMEP). SCADA solutions are under review by Ashlawn Energy, and a final decision has not yet been made.
The Battery Management System (BMS) is currently being evaluated. The final system selected will be required to have:
Two channels for flexibility in testing/simulating multiple devices with a single machine Standard interfaces (Ethernet, CAN and Serial) for remote control An open source communication protocol. PC interface for local control and easy identification of operating state Self-contained cooling system requiring no external cooling system Scalable Regenerative to the grid, reducing energy use and heating Operate Accurately Variable slew rates (defined as the maximum rate of change of output voltage per unit of time,
expressed as volt per second) to measure voltage at varying states of charge
Drive cycle simulation
Battery Emulation
Ashlawn is currently reviewing BMS offerings. An Aerovironment power processing system is currently employed at the CTC test bed. Final selection will be based on the above technical and operational criteria as well as cost and availability considerations.
3.2.3 Electrolyte
The vanadyl sulfate electrolyte used in the Painesville battery must meet certain minimum standards of purity. The electrolyte vendor must be able to deliver the electrolyte on schedule and in sufficient quantities to meet project timelines. Since the electrolyte is generally the single most expensive

City of Painesville, Ohio
Ashlawn Energy, LLC
Page 37
Vanadium Redox Battery Demonstration Program 20-Feb-2015 Technology Performance Report Energy Storage Demonstration
component of the battery system, the electrolyte vendor will be chosen on the basis of price, once minimum standards of purity are met. Electrolyte cost is, in turn, driven by the market cost of vanadium pentoxide that currently sells at an average of $15/kg. The 30% sulfuric acid solution adds a negligible cost, about 40-50¢/gallon. These ingredients are combined in solution in correct ratios at the required valence states, and then packaged in plastic shipping containers prior to shipping. Ashlawn Energy has had to supply our electrolyte supplier (Stratcor) with a battery stack to enable them to convert the vanadium pentoxide mix to the correct vanadium ion solution required by the battery. In the future, Stratcor will instead use a titration method to manufacture the battery electrolyte. Alternate domestic electrolyte suppliers will not require a customer-provided stack for electrolyte production. An unsolicited bid to provide electrolyte was received from a Chinese source of supply in June 2012 and a sample was received in August 2012 for evaluation. Each vendor has capacity to easily supply a number of 1 MW batteries annually.
3.2.4 Economic
STORAGE SYSTEM PERFORMANCE PARAMETERS: Economic
Metric Value Definition
Engineering and design costs
$
The cost associated with engineering and design for the demonstration project implementation.
Capital cost (i.e., equipment capital and installation)
$
Total installed first cost of fielded system, breaking out major categories including equipment (i.e., major equipment components, related support equipment, and initial spare parts) and costs associated with shipping, site preparations, installation, and commissioning.
Capital cost
$/kWh & $/kW
Total installed first cost of fielded system, normalized by energy storage capacity and peak power output.
End of life disposal cost
$
Total cost of dismantling and removing the fielded system, including (if applicable) decontamination long-term waste storage, environmental restoration and related costs.
End of life value of plant and equipment
$
Resale or salvage value of plant and all associated equipment.

City of Painesville, Ohio
Ashlawn Energy, LLC
Page 38
Vanadium Redox Battery Demonstration Program 20-Feb-2015 Technology Performance Report Energy Storage Demonstration
Operating cost (activity based, non-fuel, by application plus monitoring)
$/kW- month
Activity based, average monthly total of all direct and indirect costs incurred in using the system, excluding the cost of purchased electricity and including third-party monitoring if applicable.
Maintenance cost (by cost category)
$/kW- month
Activity based, average monthly cost of maintaining the fielded system.
Figure 25 Storage System Performance Parameters: Economic
3.3 Methodologies for Determining Grid Impacts and Benefits
Specific smart grid benefits supported by Ashlawn’s Energy Storage Project and aligned with the DOE are:
Ancillary Service Revenue The PJM Regulation Market Clearing Price (RMCP) during periods of operation will be used to determine Ancillary Service Revenue.
Optimized Generator Operation The small scale of this demonstration project will not be sufficient enough to influence the PJM RMCP; however, battery operations will be optimized to maximize revenue return.
SCADA recording and reporting will provide how well the battery system:
Receives and reacts to a dynamic regulation control signals from PJM
Provides real time telemetry
Ability to provide for 5-minutes to ramp up or ramp down
Demand Management Revenue Capacity Revenue generated through demand response will be tracked and reported.
Additional Benefits Onsite capability for back-up power, black start, reduction of demand charges. Optimizing output of wind and solar energy projects.
4 Technology Performance Results
As of the writing of this technology performance report, the Painesville Battery build project is approximately half way to completion. All the time-consuming groundwork has been completed and technical expertise has been acquired. The building to house the battery has been built and electrical service to the building has been installed. The drawing package for the battery stacks are 95% complete and provisions have been made to procure all battery stack components, including procurement of molds to mass produce the battery frames. The balance of plant plans are complete including the tentative selection of the vendor for the power inverter. Battery stack prototypes have been tested and characterized at CTC. However, long-term testing of a complete battery stack has

City of Painesville, Ohio
Ashlawn Energy, LLC
Page 39
Vanadium Redox Battery Demonstration Program 20-Feb-2015 Technology Performance Report Energy Storage Demonstration
yet to take place at the CTC test facility.
PJM personnel witnessed a demonstration of a prototype battery stack at CTC and agreed that the battery switching speed was more than sufficient to participate in a number of the more profitable energy ancillary services markets. The “Interoperability and Cyber Security Plan” the “Project Definitization” plan, the “Project Management Plan”, and the “National Environmental Policy Act (NEPA) Requirements” were all completed on schedule. The “Cooperative Agreement Extension” between the City of Painesville and Ashlawn Energy will be obtained upon release of this report. Ten and twenty year financial projections have been performed on the Painesville battery that suggest the project will be profitable in the ancillary markets and should reach break-even in the third operational year. The remainder of the project at Painesville is expected to be completed through private investment. A Letter of Intent has been received from a private investor.
The milestones achieved by the Painesville battery project to date are provided below in a chronological listing. To clarify the events, each prototype used in the testing is assigned a number in this report and its delivery date is recorded here. Detailed descriptions of the testing performed by the various vendors involved on the various prototypes has been provided to DOE in previous monthly progress reports. Highlights of the project activities are listed in chronological order below. Prototype numbering has been added to facilitate understanding of project events in this report and were not used during project execution. Some transcription errors may have been made in the project numbers.
02/01/10 – 01/31/14 Contract start.
08/13/10 – 01/31/14 Mod 1. Removed interim budget ceiling.
08/16/10 Interoperability and Cyber Security Plan completed and submitted.
09/24/10 – 01/31/14 Mod 2. Add obligation: $500,000
11/15/10 Project Definitization/Phase II Release completed
11/15/10 – 01/31/14 Mod 3. Change Intellectual Property Provisions; Change to Statement of Project Objectives (SOPO); changes to Instructions for Preparation of Deliverables; changes to Reporting Requirements Checklist and Instructions; and changes to Budget Pages; add Wage Determinations.
12/01/10 Prototype 1 (4 cell, 2.5 kW frame size, N117 membrane material) built and sent to CTC for pressure testing.
12/07/10 Kick-Off meeting in Painesville City Hall
12/15/10 Updated Project Management Plan completed
12/22/10 – 01/31/14 Mod 4. Changes to National Environmental Policy Act (NEPA) Requirements. Additional NEPA Requirements were added.
12/22/10 – 01/31/14 Mod 5. The additional (NEPA) Requirements were waived.
01/15/11 Prototype 1 Received back from CTC, improved frames, then shipped to PNNL for testing.
01/15/11 Prototype 2 (4 cell, 2.5 kW frame size, N117 membrane material, thin felt/thin plates) fabricated with improved gasket sealing, sent to CTC for pressure testing.
02/28/11 Prototype 3 (4 cell, 2.5 kW frame size, N117 membrane material, thick felt/thick plates) fabricated and sent to CTC for testing

City of Painesville, Ohio
Ashlawn Energy, LLC
Page 40
Vanadium Redox Battery Demonstration Program 20-Feb-2015 Technology Performance Report Energy Storage Demonstration
02/28/11 Prototype 4 (4 cell, 2.5 kW frame size, VANADion-20 membrane material, thin felt/thin plates) fabricated and sent to CTC for testing
03/27/11 Start of MAGNET contract, Manufacturing scale up, product/component subcontractor design, project management
04/15/11 Prototype 5 (40 cell, 10 kW frame size) fabricated and sent to electrolyte producer.
05/31/11 Prototype 5 shipped from electrolyte producer to graphite producer for analysis.
06/07/11 Prototype Test Bed at CTC Completed
07/14/11 National Environmental Protection Act (NEPA) Compliance completed
07/31/11 Prototype 7 (4 cell stack, 10 kW frame size, N212 membrane, thin felt/thick plates) fabricated and sent to CTC for testing
08/30/11 Metrics And Benefits Reporting Plan completed
09/14/11 Prototype 8 (10 cells stack, 10 kW frame, N117 membrane, ¼” copper collectors, aluminum end plates, and having a long flow path.) fabricated by InnoVentures and received by CTC. The cells only achieve a 1.5gpm flow rate on average and the stack has a fair number of leaks.
09/15/11 – 10/05/11 CTC performs polarity switch testing on Prototype 8 resulting in damaged electrolyte.
10/05/11 Prototype 8 is received by InnoVentures (10 cells stack, 10 kW frame, N212 membrane, ⅛” copper collectors, composite end plates, and having a long flow path) for cleaning and rework.
10/13/11 Prototype 8 is received by CTC. CTC reports that Prototype 8 has hydrogen generation problems and some leakage problems but is still functional.
10/14/11 Prototype 8 is used by CTC to successfully demonstrate to PJM representatives that the vanadium redox flow battery can transition from full charge to full discharge within 50 msec (step charge).
11/01/11 ESI and Goulden Electric began construction of Painesville battery building.
02/15/12 Prototype 6 (40 cells, 10 kW frame size) completed fabrication of components for this demonstration/milestone stack. Fabrication and assembly put on hold.
02/29/12 Power System Interface and Integration Design Complete
04/15/12 Prototype 9 (40 cells, 10 kW frame size) InnoVentures completes fabrication of components for this rotated milestone stack. Fabrication and assembly put on hold.
04/17/12 – 05/14/12 Prototype 10 split stack (41 cell stack, 2.5 kW frame, using N121 membrane on top & VANADion membranes on bottom, thin plates) fabricated and delivered to CTC for testing.
05/01/12 Final punch list for the Painesville battery building completed.
06/06/12 Prototype 11 (20 cells, 10 kW frame size) fabricated by InnoVentures and
delivered to CTC for testing.

City of Painesville, Ohio
Ashlawn Energy, LLC
Page 41
Vanadium Redox Battery Demonstration Program 20-Feb-2015 Technology Performance Report Energy Storage Demonstration
09/11/12 – 09/12/12 Prototype 8 (10 cell, 10kW frame size) rebuilt as a bonded stack by InnoVentures and delivered to CTC for testing. Bonded stack appeared to operate well electrically but was found to have significant internal crossover; testing was therefore terminated.
06/04/13 MAGNET cell design optimization began.
04/10/13 - 04/11/13 Prototype 8 is disassembled at CTC and evaluated to determine causes of
internal leakage.
04/14/14 Project technical goals are revised.
04/14/14 MAGNET begins single cell testing of 10 kW flow frames to optimize flow rates
versus shunt current losses. All outstanding issues are listed and
systematically resolved. Results are incorporated in final drawing package.
Figure 26 Highlights of completed performance tasking on the Painesville battery in chronological order.
4.1 Stack and Component Prototype Testing
The technology development effort focused primarily on building a series of prototypes stacks in order to assist in the selection of materials and vendors and to explore a number of design alternatives leading up to a final stack design. The prototyping process began with the design and building of a series of 2,500 watt (2.5 kW) size battery stacks followed by the building of larger 10,000 watt (10 kW) battery stacks. Other, even larger stacks were considered, but the 10 kW stack size was selected as being at the appropriate scale for a stationary grid-scale battery unit that could be conveniently moved about by a small forklift and mounted on conveniently sized steel racks.
Figure 27 Photograph of a 2.5 kW, 10 cell stack.

City of Painesville, Ohio
Ashlawn Energy, LLC
Page 42
Vanadium Redox Battery Demonstration Program 20-Feb-2015 Technology Performance Report Energy Storage Demonstration
At project inception Ashlawn Energy personnel and vendors had years of expertise in building fuel cells. This early in-house expertise enabled us to build industrial-sized 2.5 kW battery stacks at InnoVentures in a short time frame, about nine months after project start. Within three months, four 2.5 kW stacks had been fabricated and sent to CTC for testing. A summary of the prototyping efforts is provided below along with a description of the purpose for which the prototypes were built. Very few technical details were collected on these first four prototypes. They were used to gain familiarity with the technology at scale and to select materials and vendors for later prototypes. The prototypes were often built, tested, and then torn apart and rebuilt or cannibalized for the next prototype. The prototypes were not numbered at the time. The prototype numbering system used here very likely contains some errors, but the numbers help to clarify what was done. With two exceptions the prototypes are numbered chronologically by the date they were first built. Here is the stack prototype history: Prototype 1 (4 cell, 2.5 kW frame size, DuPont N117 membrane material) was built at InnoVentures and sent to CTC for pressure testing in December, 2010. It was later returned to InnoVentures, refitted with improved frames, and sent for testing at PNNL.
Prototype 2 (4 cell, 2.5 kW frame size, N117 membrane material, thin felt/thin plates) was fabricated at InnoVentures with improved gasket sealing and sent to CTC for pressure testing in mid-January, 2011.
Prototype 3 (4 cell, 2.5 kW frame size, N117 membrane material, thick felt/thick plates) was fabricated at InnoVentures and sent to CTC for testing on February 28, 2011.
Prototype 4 (4 cell, 2.5 kW frame size, VANADion-20 Ion Power membrane material, thin felt/thin plates) was fabricated at InnoVentures and sent to CTC for testing on February 28, 2011.
Prototype 5 (40 cell, 10 kW frame size, using branched flow field channels) was fabricated at InnoVentures and sent to Stratcor in April, 2011. This was the first full-size 10 kW stack made by Ashlawn Energy. It was rather crude in design. The flow frames were individually cut from plastic sheets on milling machines making them rather expensive to produce. The flow frames did not have bonded face plates and the stack was put together with thick (more expensive) bi-polar plates. However, the stack was robust, had no significant leaks, and appeared to work well in its use by Stratcor for producing electrolyte. As such, no performance test data was recorded. Stratcor used the 10 kW stack for about a month and then shipped it off to GrafTech in May, 2011.
At the time Ashlawn Energy engineers felt that Prototype 5 needed considerable refinement before it was ready for production. There was a possibility that aspects of the branched flow channel design might be covered by a Prudent Energy patent so Ashlawn engineers devised an alternate design that consisted of an angled pattern of parallel channels (the pattern used in Prototype 8). Changes were also made in the O-ring seals to avoid patent infringement. In later designs the flow frames were reduced in thickness and the flow channels encased by a bonded cover. Experiments were later performed to make use of thinner, less expensive bi-polar plates.
Prototype 6 (40 cells, 10 kW frame size) was initiated in July, 2011 as the final design package, often referred to as the “Milestone Stack” based on the experiences of building Prototype 5. Improvements were added to these set of drawings as they became evident from the ongoing testing. InnoVentures was directed to begin fabrication of the first Milestone stack in early 2012 and the component parts were procured. In February, 2012 the assembly of the first Milestone stack was put on hold as it became evident at that time that some issues remained to be resolved. A copy of the drawing package for the Milestone stack was provided to MAGNET engineers in July February, 2012, to assist Ashlawn in evaluating and initiating quality assurance procedures. In June, 2013, Ashlawn Energy tasked MAGNET

City of Painesville, Ohio
Ashlawn Energy, LLC
Page 43
Vanadium Redox Battery Demonstration Program 20-Feb-2015 Technology Performance Report Energy Storage Demonstration
engineers to maintain and improve the Milestone stack drawings. The InnoVentures package received by the MAGNET engineers had the drawing number “359.” This number came to refer to the Milestone stack drawings and often appears in the reports under this designation.
As of this report, Prototype 6, or the Milestone stack, or the 359 stack, has not been built and is the next major step in the project. This design package has been at the center of the stack engineering effort since April, 2014 to the present. MAGNET engineers used this drawing package to manufacture two flow frames used in their single half-cell test in 2014 (see full description latter in this section). As of this report date, the results of all major trade-off decisions and design enhancements have been added to the drawing package and are ready for production pending funding.
Prototype 7 (4 cell stack, 10 kW frame size, N212 membrane, thin felt/thick plates) was fabricated at InnoVentures and sent to CTC for testing in July 31, 2011. This short stack prototype was used in test of the felt (thin versus thick) and bi-polar plate (thin versus thick) combinations. The thin felt/thick plate combination appeared to function well.
Prototype 8 (10 cells stack, 10 kW frame, N117 membrane, ¼” copper collectors, aluminum end plates, and having angled parallel flow paths.) was fabricated at InnoVentures and received by CTC on September 14, 2011. The cells only achieved a 1.5 gpm (gallons per minute) flow rate on average and the stack was found to have a significant leaking. Prior to sending Prototype 8 back for rework, it was used to perform a polarity switch experiment, as described below. Thereafter, Prototype 8 was rebuilt and reused a number of times as described below.
The polarity switching experiment was conducted to assess its ability effectively manage “water transfer.”
“Water transfer” is a complex process that occurs in a vanadium redox flow battery whereby differences in solute concentrations during the charge/discharge cycle cause a net osmotic pressure difference between the positive and negative electrolyte. This causes a net transfer of water from the negative electrolyte to the positive electrolyte when a cation membrane is used. If this problem is not addressed, water transfer will cause dilution of the positive electrolyte until the battery efficiency drops to unacceptably low levels. Instead of periodically remixing the positive and negative electrolytes together and restarting the battery (the conventional solution to the problem) we attempted to solve the problem by reversing the electrical connections to the battery so that the negative electrolyte ends up with excess water and normal battery operation can thereafter transfer water back to the positive side. Using a polarity switching method would enable the water transfer problem to be addressed only half as often as the conventional remixing method.
Our analysis has determined that there are four methods of rebalancing a VRFB. These methods are:
Method #1: Standard method of rebalancing the battery by mixing together the two electrolytes and then restarting the battery
Method #2: Complete electrical reversal of the battery polarity.
Method #3: Reversal of both the stack output valves and the electrical lines.
Method #4: Reversal of the stack input valves.
These four methods are compared in the following table under the assumption that the battery is discharged before the rebalancing operation begins:

City of Painesville, Ohio
Ashlawn Energy, LLC
Page 44
Vanadium Redox Battery Demonstration Program 20-Feb-2015 Technology Performance Report Energy Storage Demonstration
Operation
Total Energy Required to Rebalance
Battery
(relative energy)
Time Between Rebalancing
(relative energy)
Average Energy Required
(energy/time*100)
Energy Improvement Over Mixing
(percentage)
Charge Electrolyte from 20/80 to 80/20
-76.8 - - -
Method 1: Mechanical Mixing
-135.7 100 -135.70 n/a
Method 2: All Electric Switching
-194.6 200 -97.30 28.3%
Method 3: Hybrid Electric and valves
-176.93 170* -104.08 23.3%
Method 4: All Valve Method
-176.93 170* -104.08 23.3%
* Assuming a 15% accidental mixing of electrolytes during rebalancing.
Figure 28 Effectiveness of various VRFB Rebalancing Methods.
As Figure 28 above shows, Method #2, the complete electrical reversal method (polarity switching), has an advantage over the other methods. Although the electrical reversal method requires more energy to perform the reversal, -194.6 energy units as compared to only 135.7 energy units for the conventional mixing method, the electrical reversal method can last for twice as long between rebalancing, 200 time units versus 100 time units for the conventional method. Because of the ability to delay the rebalancing operation, the electrical reversal method is 28.3% more efficient than the mixing method, and is more efficient than the other two methods. The Ashlawn engineers therefore decided to attempt a polarity switching operation on Prototype 8.
In late September 2011 the polarity switch experiment was performed on Prototype #8 at CTC that resulted in overheating and destruction of the electrolyte. The electrolyte overheated causing vanadium “red cake,” i.e., to precipitate out of solution (the color turns to red). The testing at CTC was terminated on October 5, 2011. Despite this failed experiment, polarity switching is still deemed a viable method of dealing with water transfer. Future experiments need to be performed on a smaller laboratory scale battery with careful regulation of the current flow to limit over heating of the battery. An ideal arrangement would be to monitor battery temperature and use a temperature sensor to control the current flow.
After the polarity switching experiment, Prototype 8 was returned to InnoVentures. Ashlawn refurbished the prototype with N212 membranes, ⅛” copper collectors, and new composite end plates. The refurbished prototype was sent back to CTC for testing where CTC reported that Prototype 8 had some hydrogen generation problems and some leakage problems, but was still functional.

City of Painesville, Ohio
Ashlawn Energy, LLC
Page 45
Vanadium Redox Battery Demonstration Program 20-Feb-2015 Technology Performance Report Energy Storage Demonstration
Figure 29 Performance of Prototype 8 during PJM power switching test on 10/14/2011.
On October 14, 2011 PJM representatives witnessed testing of Prototype 8, which showed a rapid response time, transitioning from full charge to full discharge within 50 msec repeatedly. PJM representatives confirmed that this rapid transition rate indicated that Ashlawn’s VanCharg™ vanadium redox flow battery was a good candidate to participate and compete in the PJM frequency regulation auxiliary service marketplace.
Prototype 8 was rebuilt (10 cell, 10 kW frame) and tested at CTC on May 18, 2012. The prototype had “pin squirt” leaks and was sent back to InnoVentures.
Prototype 8 was again rebuilt at InnoVentures as a bonded stack (10 cell, 10 kW frame) and delivered to CTC for testing on September 12, 2012. The bonded stack appeared to operate well electrically but was found to have some very significant internal electrolyte crossover leakage. Testing was therefore terminated. The following detailed observations revealed design flaws as well as errors in fabrication and assembly.
In the bonded stack the bi-polar graphite plate was bonded to its carrier frame. The two flow frames on either side of the bi-polar graphite plate were then bonded to the carrier plate. The division between bonded units came at the membrane. The membrane was then held in place by the usual O-ring arrangement. By this arrangement three of the five cell interfaces were bonded together thus reducing the opportunity for leakage from between layers.

City of Painesville, Ohio
Ashlawn Energy, LLC
Page 46
Vanadium Redox Battery Demonstration Program 20-Feb-2015 Technology Performance Report Energy Storage Demonstration
Figure 30 Large 10 kW stack (Prototype 8) being installed at CTC for testing.
On April 10 to 11, 2013, Prototype 8 (10 cell, ten kW frame size) bonded stack, residing at CTC, was disassembled and evaluated to determine the causes of its internal leakage observed earlier on September 12, 2012. Deflection tests were performed under various pressures (0, 15, 30 psi) on both the lower and upper end plates to map bolt torque distortion. The stack was thereafter decontaminated and a red dye was gravity fed into the upper right discharge port of the positive cells to determine where crossover of the electrolyte occurred. The dye was then drained out and the bonded stack was carefully dismantled, prying apart the layers where necessary.
Prior to disassembly only a few leaks were visible on the left and right sides of the stack. However when the stack was rotated on its side for disassembly, several minor leaks were observed at the bottom of the stack (approximately 3 times as much leakage as the total of both sides combined). Further, a slight bowing of the stack was observable. The stack was then disassembled in reverse order of assembly (lower end plate subassembly removed first). Photographs were taken during the disassembly to record the findings.

City of Painesville, Ohio
Ashlawn Energy, LLC
Page 47
Vanadium Redox Battery Demonstration Program 20-Feb-2015 Technology Performance Report Energy Storage Demonstration
When the end plate was removed, electrolyte was observed around all of the bolts and crystallized around the threads. The electrolyte had not made its way substantially to the copper and graphite collectors but had leaked around the bottom part of the end plate. The membrane was determined to be the primary location of pooled electrolyte. Most of the bypass was on the active PEM membrane face (not the non-conductive plastic backing side). The excess electrolyte pooled below the active area and slowly seeped into the bolt holes as seen in Figure 31 above.
The next whole‐cell subassembly more definitively revealed that significant amounts of electrolyte had bypassed underneath the PEM side of the membrane and pooled in the area below the flow fields between the plates where it slowly seeped into the bolt holes. The same leak characteristics were observed in the lower half-cells. Similar observations were made on most of the other cell assemblies. Sealing on the sides of the membranes were good.
Inspection revealed de-bonding of the bipolar plates in the upper right corner in a number of cells when observing the positive side of the flow cell subassembly. Three of the O-rings were displaced. Leaks around the O-rings between subassemblies 6 and 7 were also observed. Cumulatively, the bolts on the bottom of the stack, and to a lesser extent on the top of the stack were exposed to electrolyte that was trapped between the individual subassemblies. A small amount of electrolyte made its way to the upper copper collector. Small amounts of residual Pelseal® was found in the engraving grooves. A number of flow channels were blocked by excessive adhesive.
After considering all of the findings and observations, the following conclusions were made:
Figure 31 Prototype 8 Top Cell Disassembly Showing Pooling of Electrolyte

City of Painesville, Ohio
Ashlawn Energy, LLC
Page 48
Vanadium Redox Battery Demonstration Program 20-Feb-2015 Technology Performance Report Energy Storage Demonstration
Distance from the bolts to the membrane gasket area resulted in inadequate compressive force over the required sealing points.
Residual pocket height in some cases reduced compressive sealing points around the membranes.
PelSeal® sealant residual in the sealing grooves around the membranes contributed to seal failure in some of the flow‐cell subassemblies.
Leakage under the membranes in all but one case was on the PEM side of the membrane.
Membrane sealing along the sides of the stack was for the most part good.
De‐bonding failures in 3 of the 9 full flow‐cells at the bi‐polar plate on the positive side of the flow cell resulted in excess crossover of electrolyte from the positive to the negative tank. A method to ensure adequate contact/bonding of bi‐polar plates to flow cell is required.
A number of flow channels on both the inlet and the outlet manifold were blocked on the positive side. A method to prevent excess adhesive during bonding is required.
Electrolyte leakage under the membrane at the top and bottom of all flow pooled between the subassemblies and made its way to the bolt holes causing corrosion around the stainless steel bolts.
Electrolyte leakage around the O-rings on the upper endplate subassembly coupled with leakage from the upper and lower membranes made its way to contaminate the copper and graphite collector plates.
Retaining tips on the O-ring grooves contributed to inadequate sealing in some (not all) places.
Endplate distortion (deflection) was as high as 0.048” and 0.059” at the center point of the front and back endplates respectively, at 30 PSIG.
With the exception of the de‐bonded areas on 3 of the full flow‐cell subassemblies, all of the bi‐polar plates were intact upon disassembly.
The manifold openings (5/8”) are too small to support adequate electrolyte flows required at full power (target 28 GPM per side at 10 PSI).
Taper in flow channels creates additional hydraulic drag, contributing to higher pressure drop within the stack. A new design is required.
Molding criteria will prevent incorporation of 135 discharge triangles within the flow cells (30 estimated to be the maximum practical number).
A method/design of relocating compression points directly over the sealing points is required.
A method/design of retaining O-rings; or a replacement for O-rings (flat gasket, applied sealant, etc.) is required.
An optimum shape as well as length to area ratio for the flow channel configuration is required.
If possible an equalization manifold needs to be installed below or above the flow field discharge triangles.
The PEM side of the membrane was facing the negative electrolyte side.
On the positive side, this last test of Prototype 8 (milestone stack “359”) revealed no major overall stack design issues. There were no defects to current collectors, carrier plates, bi-polar plates, membranes, and felt.
Prototype 9 (40 cells, 10 kW frame size) was initiated early in 2012 as an alternative “rotated stack” design. InnoVentures was tasked to collect together the components and assemble this prototype, but in April 2012 the effort was put on hold until the approach could be validated. A description of this approach follows:
A flow battery stack is assembled by placing its various component layers of bi-polar plates, flow

City of Painesville, Ohio
Ashlawn Energy, LLC
Page 49
Vanadium Redox Battery Demonstration Program 20-Feb-2015 Technology Performance Report Energy Storage Demonstration
frames, felt, and membranes one on top the other on a flat surface. The stack of components is arranged between two endplates and the whole stack is bolted together. The battery stack is then rotated 90o and set down on one of its sides so that the various component layers are positioned perpendicular to the ground. Electrolyte is then input through an opening near the bottom of the stack and allowed to flow upward through the stack cell cavities. It is then directed to exit from openings near the top of the stack. In this arrangement any air or gas trapped in the battery stack rises upward with the electrolyte and is pushed out of the top exit ports and is thereby eliminated from the battery stack.
A rotated stack is one that is mounted with its various layers parallel to the ground such as shown in fuel cell patent 6,040,075. After the stack is built it is not rotated onto one of its sides. In this arrangement several stacks (usually three stacks) are positioned side-by-side. Electrolyte is pumped through the stacks in series. In the conventional parallel stack arrangement electrolyte must be passed through the battery (approximately) three times before it can become fully charged or discharged. In a series stack arrangement the electrolyte can be fully charged or discharged in one pass through the battery. This allows the series stack arrangement to charge or discharge the electrolyte in one-third the time and with somewhat less pumping action. However, the series arrangement requires three times more stacks and correspondingly more battery floor space. The rotated stacks used in this series arrangement rely on fluid flow to push any trapped gases out of the battery stack. In some series arrangements the electrolyte is sucked out of the stacks using a vacuum pump action that also removes any trapped gases.
Prototype 10 (41 cell stack, 2.5 kW frame, using N212 DuPont membrane on top & Ion Power VANADion-20 membranes on bottom, thin plates) was a “split stack” design having a spacer in the middle of the stack so that two types of membranes could be tested under exactly the same conditions. The split stack was fabricated at InnoVentures and delivered to CTC on April 17, 2012. Testing on this stack continued until May 14, 2012. The data from this testing concluded that both membranes were found to produce acceptable performance. This finding allowed the engineers to use other criteria, such as price and utility, in choosing a vendor for the membrane.
The DuPont N212 membrane used in this test was a thin 2 mil membrane that is received having peel-off backing material. (Other DuPont membranes had been tested previously.) The DuPont membrane is bi-polar in that either side can face the positive electrolyte. Because of its thinness the DuPont membrane was found to be difficult to mount on the battery stacks. Once it had become wet with electrolyte it no longer maintained its dimensions and became highly wrinkled so that it could not be remounted or used again. Once mounted in the stack, the membrane would expand and contract its shape.
The Ion Power VANADion-20 membrane used in this test was 7 mils in thickness of which 6 mils was a built-in backing that remained in place after mounting. The built-in backing material caused the Ion Power membrane to have an active side which had to be mounted facing the positive electrolyte. It was therefore critical to mount the membrane in the proper direction. Mounting in the improper direction was made at least once during fabrication of the prototypes - see last bullet point for Prototype 8. Because of its greater thickness, the Ion Power membrane was much easier to work with during battery assembly and retained its dimensionality without wrinkling.
The Ion Power membrane is less expensive than the DuPont membrane but requires a longer lead time for large orders. For reasons of cost and utility the Ion Power membrane was chosen as the membrane of choice for the final stack design.
Prototype 11 (20 cells, 10 kW frame size, Ion Power membrane) was fabricated by InnoVentures and delivered to CTC for testing on June 6, 2012. Prototype 11 was used to test the performance of the

City of Painesville, Ohio
Ashlawn Energy, LLC
Page 50
Vanadium Redox Battery Demonstration Program 20-Feb-2015 Technology Performance Report Energy Storage Demonstration
Riverside electrolyte and compared against the remediated Stratcor electrolyte between June 11 and July 11, 2012. Remediation of the Stratcor electrolyte was required because it had oxidized from exposure to air.
After dilution, set-aside, charge, and set-aside substitution, were completed the following data was collected on the Stratcor remediated electrolyte composition (excerpt from the full data set):
Location Molarity V2+ V3+ V4+ V5+ Valence SOC
Density
(g/mL)
Viscosity
(cSt)
Left Tank 1.45 0 0 0.83 0.62 4.43 43% 1.321 NA
Right Tank
1.49 0.87 0.61 0 0 2.41 59% 1.309 NA
Figure 32 StratCor Electrolyte Analyses, July 9, 2012 at 16:25.
The molarity of the remediated Stratcor sample averaged roughly 1.47 moles (slightly below the desired 1.5 to 1.6 range), the sulfur molarity averaged 3.5 moles (somewhat below the 4 molar goal), and the valent average was 3.42 (a bit below the 3.5 desired center point). The remediation of the Stratcor electrolyte was successful; but did not achieve the precise desired values, however the methods worked in general.
Using the same stack, Prototype 11, filled with Riverside electrolyte ended with the following electrolyte composition (excerpt from the full data set):
Location Molarity V2+ V3+ V4+ V5+ Valence SOC
Density
(g/mL)
Viscosity
(cSt)
Left Tank
1.54 0 0 0.57 0.97 4.63 63% 1.345 NA
Right Tank
1.59 0.8 0.78 0 0 2.49 51% 1.354 NA
Figure 333 Riverside Electrolyte Analyses, June 25, 2012.
The molarity of the Riverside electrolyte averaged 1.57, which is within the desired range. Based upon the full data set it appeared that the Riverside electrolyte was capable of storing somewhat more energy per gallon (11.5kWh/200 gallon = 0.0575 kWh/gallon) than the remediated Stratcor electrolyte (6.19kWh/153gallon = 0.0405 kWh/gallon). Round trip DC/DC electrical efficiencies extracted from the data were as follows:

City of Painesville, Ohio
Ashlawn Energy, LLC
Page 51
Vanadium Redox Battery Demonstration Program 20-Feb-2015 Technology Performance Report Energy Storage Demonstration
Riverside Electrolyte
Remediated Stratcor Electrolyte
58.6% 55.3%
59.0% 57.3%
62.2% Figure 34 Round trip efficiency.
Based upon these values it appears that the Riverside electrolyte was producing a DC round trip efficiency roughly 4% higher than the remediated Stratcor electrolyte. However, this energy efficiency difference may be explained by the differences in molarities/valence:
Electrolyte Total Sulfur Molarity Total Vanadium Molarity Average Valent Level
Remediated Stratcor 3.5 1.47 3.42
Riverside 3.79 1.57 3.5 Figure 35 Electrolyte molarity and valent levels.
As a visual observation, there was more bubbling evident in the return negative electrolyte line for the Riverside electrolyte than for the remediated Stratcor. When mixing a small sample of charged positive and negative Stratcor electrolytes, no bubbling was evident, and there was no response noted with a combustible gas detector. In previous testing with Riverside electrolyte both bubbling and combustible gas had been noted. However once again, there is currently no indication of whether this bears any significance. Also, it was noted that this tendency of the Riverside electrolyte had diminished in later charge/discharge cycles.
In conclusion the 20 cell stack performed in a consistent fashion, and the Stratcor electrolyte remediation appears to have been effective. No further conclusions concerning the electrolytes or stack were made at this point.
4.2 MAGNET Project and Engineering Assistance
As described in Section 1.7.3, NorTech introduced Ashlawn Energy to the MAGNET organization. On March 27, 2011, Ashlawn tasked MAGNET to assist Ashlawn Energy in an advisory and planning role for quality assurance and personnel consulting. The milestone stack drawing package (Prototype 6, also known as the “359” drawing package) was provided to MAGNET in August 2011. On June 14, 2012 Ashlawn tasked MAGNET to assist with stack design and testing. MAGNET thereafter continued to work closely with Ashlawn Energy to incorporate design changes into the drawings as they were developed. In mid-April 2014 Ashlawn Energy conducted a design review and expanded MAGNET’s role to include the finalizing of the stack design.
In mid-April 2014, Ashlawn Energy finalized the milestone stack to be a 10 kW stack with 40 cells, having the bolt-holes located within the frame. The flow field design was finalized to employ a branched flow channel design instead of the angled parallel channel design. The branched flow channel drawings were updated to reflect all the changes made to date and these drawings became the new milestone stack drawings. Lessons learned from the failure of the bonded stack (Prototype 8) were incorporated into the revised drawing package where possible. Unresolved issues were collected into a single list, discussed at weekly team meetings, and systematically resolved. Some issues were resolved by a decision while others required small-scale experiments to facilitate final design decisions. Below are listed the major issues and their resolution during that time period.
In order to resolve some of the engineering issues two flow frames having the branched channel design

City of Painesville, Ohio
Ashlawn Energy, LLC
Page 52
Vanadium Redox Battery Demonstration Program 20-Feb-2015 Technology Performance Report Energy Storage Demonstration
were fabricated by ITEN and used to perform a number of electrolyte flow tests within the flow frame cavity. During these tests one of the flow frames was clamped between two sheets of transparent plastic so that the flows could be observed. Various additives were added to the fluid to make it visible during the testing so that “dead spots” in the flow could be observed in the cavity both with and without the presence of the carbon felt. (A dead spot in the flow is a region where the flow is very slow or the flow is trapped in an eddy.) This half-cell apparatus was then used to experimentally verify some of the outstanding stack design issues that were raised by the bonded stack conducted on September 12, 2012 and analyzed on April 10 and 11, 2013 (as described in detail above).
Ashlawn Energy then assigned MAGNET engineers the task of systematically addressing the outstanding engineering issues and resolving them and to enter the solutions into the final stack drawings.
06/14/12 Signed contract with MAGNET
07/02/13 Approved single cell flow channel testing concept.
07/18/13 Gave consideration to use of toe clamps to bind stack together. Previous design had 28 threaded rods, 56 nuts, 112 flat washers, and 224 Belleview washers. New design would have 18 threaded rods, 36 nuts, 72 flat washers, 144 Belleview washers, 16 toe clamps, 4 end supports, and 2 center supports. (This approach was later found to be impractical.)
03/25/14 Because of financial considerations Ashlawn management decided to build the Painesville battery in two stages. The first stage would be to build a 100 kW, 8 hour, battery, consisting of one string having 12, 10 kW battery stacks. The second stage would be to build the remaining nine strings (108 battery stacks) having an 8 hour capacity.
03/25/14 Ashlawn and MAGNET engineers scoped out requirements for proposed 100 kW battery. The proposed 100 kW battery would have the following specifications:
(2) 5000 gallon tanks to contain the required 9,680 gallons of electrolyte.
Target flow rate at 2 gpm per cell at 10 psi.
Use of graphite end plate with multiple bonded copper wires.
Stack size fixed at 40 cells having a 10 kW frame size.
04/04/14 Using the results and recommendations from the bonded stack testing, Ashlawn directed the MAGNET engineers to consider each outstanding issue and test possible solutions on a small scale. The resulting best solutions were systematically added to the stack design and drawings. Several methods of conducting the flow tests were discussed.
04/10/14 MAGNET procured and received two bonded flow frames from ITEN (10 kW frame size) for use in flow testing. The new flow frames make use of an earlier “branched” flow channel configuration as opposed to the angular flow channel deign used in Prototype 8.
04/18/14 Design Review meeting held at CTC with CTC, MAGNET, and Ashlawn Energy engineers present. The following issues were addressed:
Earlier branched flow channel design was agreed to be best starting point.
Internal leakage problems.
Misalignment of layers during assembly or shipping.
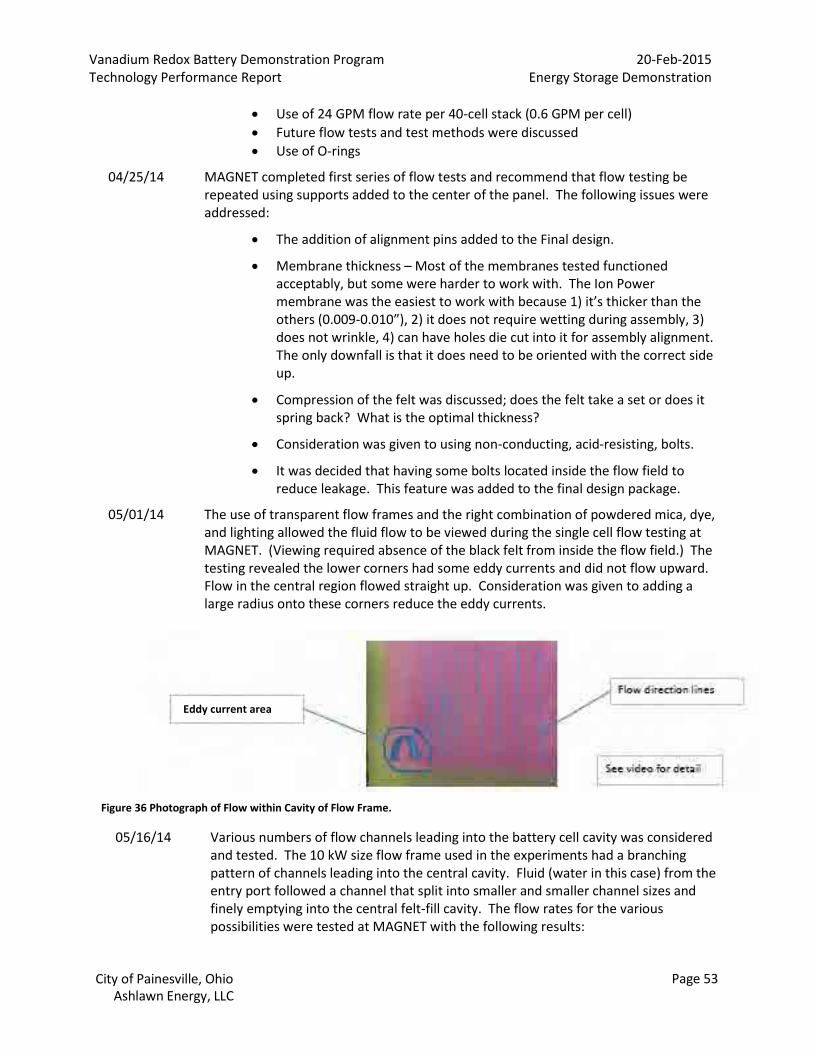
City of Painesville, Ohio
Ashlawn Energy, LLC
Page 53
Vanadium Redox Battery Demonstration Program 20-Feb-2015 Technology Performance Report Energy Storage Demonstration
Use of 24 GPM flow rate per 40-cell stack (0.6 GPM per cell)
Future flow tests and test methods were discussed
Use of O-rings
04/25/14 MAGNET completed first series of flow tests and recommend that flow testing be repeated using supports added to the center of the panel. The following issues were addressed:
The addition of alignment pins added to the Final design.
Membrane thickness – Most of the membranes tested functioned acceptably, but some were harder to work with. The Ion Power membrane was the easiest to work with because 1) it’s thicker than the others (0.009-0.010”), 2) it does not require wetting during assembly, 3) does not wrinkle, 4) can have holes die cut into it for assembly alignment. The only downfall is that it does need to be oriented with the correct side up.
Compression of the felt was discussed; does the felt take a set or does it spring back? What is the optimal thickness?
Consideration was given to using non-conducting, acid-resisting, bolts.
It was decided that having some bolts located inside the flow field to reduce leakage. This feature was added to the final design package.
05/01/14 The use of transparent flow frames and the right combination of powdered mica, dye, and lighting allowed the fluid flow to be viewed during the single cell flow testing at MAGNET. (Viewing required absence of the black felt from inside the flow field.) The testing revealed the lower corners had some eddy currents and did not flow upward. Flow in the central region flowed straight up. Consideration was given to adding a large radius onto these corners reduce the eddy currents.
Figure 36 Photograph of Flow within Cavity of Flow Frame.
05/16/14 Various numbers of flow channels leading into the battery cell cavity was considered and tested. The 10 kW size flow frame used in the experiments had a branching pattern of channels leading into the central cavity. Fluid (water in this case) from the entry port followed a channel that split into smaller and smaller channel sizes and finely emptying into the central felt-fill cavity. The flow rates for the various possibilities were tested at MAGNET with the following results:
Eddy current area

City of Painesville, Ohio
Ashlawn Energy, LLC
Page 54
Vanadium Redox Battery Demonstration Program 20-Feb-2015 Technology Performance Report Energy Storage Demonstration
Figure 37 Flow Rates as a Function of Number of Flow Channels.

City of Painesville, Ohio
Ashlawn Energy, LLC
Page 55
Vanadium Redox Battery Demonstration Program 20-Feb-2015 Technology Performance Report Energy Storage Demonstration
As indicated in the above experimental data there was little difference in flow rates due to the presence or absence of the felt. Antifreeze was used in some of the runs because it has a viscosity more nearly equal to that of the electrolyte. Clay was used to prevent fluid bypassing the flow field in some places. Unfortunately the clay caused blockages of some of the flow channels, which in turn caused distorted results in some of the data. The experiments unexpectedly show inconclusive results. It was therefore concluded that the number of flow channels had little impact on battery performance.
In the runs using water, Run 6 using 64 channels; and runs 9, 10 and 11; exhibit similar flow rates of 1.58 gpm for 64 channels; and 1.54, 1.48, and 1.46 gpm. The runs for 16 channels had flow rates of 0.91, 1.01, 1.08, and 1.12; which are one third less than the previous runs. Some evidence points to the problem of using the clay seals and the possibility of bypass leakage being present. Even taking into account the observed problems, the lack of difference in flow rates between 64 channels and 32 channels tends to lead to the conclusion that the number of flow channels had little influence on the fluid flow rates through the half cell.
The manufacturing of a larger number of small channels would require greater precision that the manufacture of a smaller number of larger channels. Also it would be easier to have smaller channels clog up with debris or deposits during battery operation. It was therefore the consensus of the engineers to use at most 16 flow channels entering and exiting the flow frame cavity.
Drawings for mold inserts to produce the flow frames are underway and will be modified to incorporate improvements in the final stack design that were identified during the bonded stack test. Delivery of the mold with inserts is expected to complete five weeks after supplier’s receipt of mold insert drawings.
4.3 Project Approach Changes
A baseline change was submitted via an updated Project Management Plan (PMP) in October 2011 and was approved for implementation in November 2011. The revised baseline changed the battery build to a single 1MW battery instead of two, 500 kW battery groups. Parallel testing and sequenced incorporation of improvements into various battery sub-banks was changed to sequential prototype improvement testing with optimum improvements installed into the entire 1 MW battery configuration. The incorporation of PNNL’s state-of-the-art mixed acid, high-molarity electrolyte was considered.
In mid-2012 the use of mixed acid was deemed too risky for inclusion in the first Painesville battery. The use of mixed acid would be delayed until the next battery build.
In mid-March 2014 the mixed-acid approach was dropped from critical path until proven in prototype demonstrations in the future, beyond the schedule and scope of this project. The use of 10 kW stacks was fixed as the standard stack size. The standard module size was set at 100 kW. The number of 10 kW stacks was tentatively set at 12 stacks per module, but this number may change depending on stack efficiency. If the battery efficiency is low, more stacks per module may be required.
As of this date, the nameplate size of the final battery at Painesville is 1.16 MW, based on employing four 290 kW inverters. Alternate battery sizes may be considered depending of financing, earning potential, end use considerations, and the building size at Painesville.
4.4 Battery Building
The General Contractor for the construction of the building to house the VRFB battery on the PMEP

City of Painesville, Ohio
Ashlawn Energy, LLC
Page 56
Vanadium Redox Battery Demonstration Program 20-Feb-2015 Technology Performance Report Energy Storage Demonstration
plant site was GPD Design, Akron, OH. Building contracts were let to ESI and Goulden Electric in October 2011. Work started on the foundation in November 2011. The motor control center was installed in April 2012. Final punch list for the building was completed in May 2012. A standard kWh demand meter was installed at the battery building.
Figure 38 Painesville Battery Building during Construction.
Figure 39 Completed Battery Building in Painesville, Ohio.
4.5 Reporting
The Interoperability and Cyber Security (I&CS) Assessment Report was submitted and approved on August 16, 2010.
The Project Management Plan (PMP) was submitted and approved on December 15, 2010.
The Metrics and Benefits Reporting Plan was submitted and approved on August 8, 2011.
Interim Technology Performance Report (TPR) will be submitted on in February, 2015.
Monthly Management Reports were provided.
Build Metrics Reports were provided quarterly.
Conference reports provided, as required.
A Notice of Disclosure of Intellectual Property was developed and submitted to DOE on August 19, 2013.

City of Painesville, Ohio
Ashlawn Energy, LLC
Page 57
Vanadium Redox Battery Demonstration Program 20-Feb-2015 Technology Performance Report Energy Storage Demonstration
4.6 Intellectual Property
Ashlawn Energy and its sub-contractors have acquired considerable intellectual property and expertise in the field of redox flow batteries and in the all-vanadium flow battery in particular. The four year development effort produced a considerable body of both technical and business “know-how” that establishes Ashlawn Energy on a firm foundation going forward into production.
As a subset of Ashlawn Energy’s intellectual property, “know-how” consists of confidentially held information in the form of unpatented inventions, designs, drawings, procedures and methods, together with accumulated skills and experience in the hands of professional personnel used in the manufacture, installation of a product that provides a competitive advantage over competitors in the field. Company know-how is privately maintained expert knowledge on the operation, maintenance, use/application of VRFB battery systems. Case law affords the same legal protections of know-how as that afforded to trade secrets. Know-how, in short, is private intellectual property. Trade secret law varies from country to country, unlike the case for patents, trademarks and copyright where there are formal 'conventions' through which subscribing countries grant the same protection to the 'property' as the others; examples of which are the Paris Convention for the Protection of Industrial Property and the World Intellectual Property Organization (WIPO), under United Nations, a supportive organization designed "to encourage creative activity, [and] to promote the protection of intellectual property throughout the world". A trade secret is generally recognized as information that is: a) information, b) secret, c) there is intent to keep it secret, d) it has industrial, financial or trade application, e) it has economic value.
The eleven VRFB prototypes developed under this DOE project led to the design of a full 10,000 watt pre-production battery stack and the accumulation of manufacturing know-how. These efforts have result in the acquisition of hard transferable intellectual property assets that can be valued and utilized in business dealings including:
Manufacturing Capability - Trade secrets and know-how are contained in laboratory notebooks, documented procedures, jigs, molds, templets, and other specialized tooling. Know-how includes: battery operational limits, the best manufacturing processes to use, the best materials, most efficient electrolyte formulations, best membranes, buy/make tradeoffs, pump speeds, control parameters, the best stack sealing methods, and the optimum solutions to the manufacturing and design issues.
VRFB Drawing Packages (Ashlawn Energy)
VRFB Prototype Performance Data (InnoVentures & Ashlawn Energy)
VRFB Prototype Performance Testing Reports (CTC Corp.)
Five Patent Applications (Ashlawn Energy)
In the early development of the Painesville project more than a man-year was devoted to studies of the competition’s patents, and of the existing scientific papers on flow batteries. Extensive patent searches were made and a complete “freedom to operate” study was undertaken to ensure that Ashlawn Energy did not infringe existing patents. The patent research also served to indicate openings in the prior art, where expansions in the technology could take place without infringing others. This effort established the following company asset:

City of Painesville, Ohio
Ashlawn Energy, LLC
Page 58
Vanadium Redox Battery Demonstration Program 20-Feb-2015 Technology Performance Report Energy Storage Demonstration
Freedom to Operate Analysis - This asset occupies two organized file drawers of patents and scientific papers and related computer files. All existing redox flow battery patents of competitors are listed in a large color-coded spreadsheet and classified in 17 categories. The resulting proprietary “Freedom to Operate” study serves to direct engineering efforts into non-infringing product designs.
A considerable body of patentable new technology has been amassed as a result of the Painesville development, fabrication, and testing of Vanadium Redox Flow Battery prototypes. This new technology is well documented and organized, and covers everything from engineering improvements to out-of-the-box new concepts and approaches. The Freedom to Operate analysis is used as a guide to select which new technologies to pursue and patent. The goal is to broadly claim and patent new flow battery engineering solutions that will become essential as flow batteries grow in size and utility. Ashlawn Energy’s propriety intellectual property (IP) now includes:
Five provisional patent applications
Seventy-five invention disclosures
Fifteen proposed experiments
In addition to the filed patents and technical trade secrets, Ashlawn’s business efforts have yielded business trade secrets vis-à-vis valuable business agreements and strategic relationships that pave the way for rapid future growth. Ashlawn Energy’s business/legal agreements and relationships that expand and protect Ashlawn Energy’s IP holdings, include:
V-fuel, Ltd. License Agreement - Early in the Painesville Project Ashlawn Energy formed an association with Marie Skyllas-Kazacos, inventor of the Vanadium Redox Flow Battery, and her company, V-Fuel, Ltd. This association resulted in a License agreement with Ashlawn Energy for her advanced electrolyte formulations and for flow battery know-how. This license is still in force.
DOE Cooperative Agreement Number DE-OE0000233 - This DOE award issued to the City Of Painesville and definitized on May 4, 2010 to develop a VRFB in Painesville, Ohio.
Power Interconnect Agreements - These agreements will allow Ashlawn batteries to be connected to the grid at customer locations in Painesville, Ohio; locations in California; and New York and therefore contribute economic value.
Consultant/Employee Patent Assignment Agreement - These signed agreements provide Ashlawn Energy with complete ownership over all patents and intellectual property developed by Ashlawn Employees and consultants.
Cyber Security - Ashlawn Energy’s digital IP is currently protected by firewalls and a system of back-up redundancy established. Proprietary printed materials are maintained in a secure locked safe at all times. And a written Cyber Security Plan and documents have been drawn up, are in current use, and will be modified, as required.
Other assets contributing to the procurement and maintenance of Ashlawn Energy’s IP include vendor working relationships, customer lists, Good Will, and personal relationships.
Notice of Disclosure of intellectual property developed under Award No. DE-OE0000233 by Ashlawn Energy and its sub-contractors was submitted to DOE in August 29, 2013. This filing with DOE completed the requirements to allow Ashlawn Energy to retain intellectual property rights to all technologies documented in the listing. A number of inventions included in the DOE list were

City of Painesville, Ohio
Ashlawn Energy, LLC
Page 59
Vanadium Redox Battery Demonstration Program 20-Feb-2015 Technology Performance Report Energy Storage Demonstration
consolidated into two patent applications (the first two patent applications listed below). The remaining three inventions and related patent applications were not developed under this award or used in any of this project development efforts.
Patent Application “Gravity Feed Flow Battery System And Method” Filed with the United States Patent Office (USPTO) on January 4, 2014.
Patent Application “Polarity Switching Flow Battery System and Method” filed with the USPTO on January 4, 2014.
Patent Application “Pressure Feed Flow Battery System and Method” filed with the USPTO on January 31, 2014.
Patent Application “Apparatus and Method Controlling Sequencings for Multiple Electrolyte Storage Tanks in a Reduction-Oxidation Flow Battery” filed with the USPTO on April 30, 2014.
Patent Application “Storage Tanks Using Super Ellipse Geometries” filed with the USPTO on June 26, 2014.
5 Grid Impacts and Benefits
This project’s ancillary services will provide important grid stability through increased reliability and power quality by reducing momentary outages and electricity sags and swells.
Since the start of this project, PJM has created a new class of regulation service, Dynamic Regulation. Federal Energy Regulatory Commission (FERC) Order 755, enacted in 2011, resulted in increased revenues for “fast” responding sources like Ashlawn Energy’s VanCharg™ vanadium redox flow battery system. The July 13, 2013 issuance of FERC Order 784 provides an opportunity for fast-responding batteries, flow batteries and flywheels against slower gas- or coal-fired plants in the ancillary services market. FERC Order 784 helped to open ancillary services markets for storage project developers and expands FERC Order 755’s “pay-for-performance” requirements to ensure that speed and accuracy, two attributes where storage excels, is considered when utilities purchase regulation service for transmission.
The dynamic regulation signal (RegD) is used for regulating fast resources that have no inherent physical characteristics that limit ramp rate. The RegD signal is derived from the same algorithms as the RegA; however, the main difference is in the time constants where the RegD’s time constants allow for faster cycling. The financial return for RegD is higher than for traditional regulating resources with physical characteristics that limit ramp rate (RegA).
The RegD payment structure includes a Regulation Market Capability Clearing Price (RMCCP) component and a Regulation Market Performance Clearing Price (RMPCP) component. Dynamic Regulation provides a more accurate resource which delivers additional benefits to the grid.
Current projections for the average payment is $53 per MWh. The average payment per MWh for a 1.16 MW provides an expected annual revenue of approximately $460,000 assuming a 90% availability and 96% performance score.
As operation of the battery may avoid the need to increase the output of the PMEP coal plant, the
project has the capability of reducing PMEP’s air emissions, including reduced CO2, SOX, NOX, and
PM-2.5 Emissions.

City of Painesville, Ohio
Ashlawn Energy, LLC
Page 60
Vanadium Redox Battery Demonstration Program 20-Feb-2015 Technology Performance Report Energy Storage Demonstration
6 Major Findings and Conclusions
During the prototyping phase of the project, a number of prototypes were built in order to select among various design alternatives, and to determine the best materials and vendors. The prototypes are numbered from one to eleven in this report but the actual number is greater because of rebuilds and the scavenging of old prototypes to make new prototypes. There were also a number of in-house single-cell tests done to pre-test various components. The full extent of the prototyping required was not anticipated during the initial scoping of the project. As a result, the project progressed more slowly than anticipated.
During the prototyping phase of the project a number of major design alternatives were investigated (the first two of these alternatives resulted in patent applications being filed on them):
Gravity feed versus peristaltic pumping
Use of polarity switching to alleviate water migration
The consideration of stack sizes between 2.5, 10, 15, 20, and 30 kW
The use and consideration of a rotated stack (see discussion in Section 4.1).
The consideration of PNNL’s mixed-acid electrolyte
While not incorporated into the final design, these alternative design considerations may yet prove useful in future product improvement efforts.
Mixed Acid Electrolyte: Ashlawn considered incorporating “mixed acid” electrolyte developed at PNNL (electrolyte adds hydrochloric acid to the sulfuric acid formulation) in Ashlawn’s battery system in Painesville with a view to improving overall system performance. PNNL claims laboratory tests show this experimental electrolyte mixture could hold 70 percent more vanadium ions, making the battery's electricity capacity 70 percent higher. If true, smaller tanks could potentially be used to generate the same amount of power as larger tanks filled with standard electrolyte. The current battery system operates between 40 and 90 degrees Fahrenheit. PNNL claims mixed acid electrolyte would allow the battery to operate in both warmer and colder temperatures, between 23 and 122 degrees Fahrenheit (-5 to 50 Celsius), greatly reducing the need for costly cooling systems.
Ashlawn considered pilot testing mixed acid electrolyte, and may potentially consider its incorporation in future battery systems, however, this electrolyte requires significant testing prior to commercialization. For now, the Painesville battery will be installed using standard electrolyte in order to avoid adding excessive technical, cost and schedule risk to the project.
In addition to selecting between various engineering alternatives, the prototyping effort was also critical to selecting and qualifying vendors. A summary of the major engineering trade-off studies conducted on the prototypes follows:
The selection of a electrolyte vendor (2 vendors tested)
The selection of membrane (2 vendors considered, 3 membranes tested)
The selection of flow frame materials, vendors, and methods (1 vendors, 3 methods)
The determination of current collectors (graphite versus copper)
The flow channel design (multiple)
The end plate design (multiple)
The selection of graphite felt (2 vendors, 2 thicknesses)
The selection of bi-polar plates (3 vendors, 3 thicknesses considered)

City of Painesville, Ohio
Ashlawn Energy, LLC
Page 61
Vanadium Redox Battery Demonstration Program 20-Feb-2015 Technology Performance Report Energy Storage Demonstration
As stated above, extensive prototyping provided an excellent opportunity to work closely with various vendors involved in supplying critical components to the project. Although all vendors claim to have excellent capabilities, good service, and capable products, the prototyping process often proved otherwise. The lessons of what vendors to use and why has served to form the basis of long-term strategic alliances between Ashlawn Energy and the vendors. All vendors have made investments in producing components that meet Ashlawn’s system needs and their respective companies have made the financial and management commitments needed to assure Ashlawn’s and each vendor’s future mutual success.
Prototyping largely centered on the design and construction of the battery stacks. The electronics, inverters, and grid interconnect hardware and software will all be purchased from third-party vendors selected on the basis of straightforward cost, schedule, and technical performance criteria. Plans have been drawn up for the balance of plant, so execution is expected to be straightforward. The Painesville project will employ local electrical and plumbing contractors to install plumbing and electrical components and support hardware for stacks, pumps and other ancillary equipment. In the future, Ashlawn will design and assemble certain of these balance-of-plant plumbing, electrical and other support components in-house in order to pre-position these components at the installation site. Incorporating these components will provide future economies of scale and will reduce site installation time and cost. Electricity trades and grid interconnect functions will continue to be executed and managed by skilled external industry service providers/brokers.
To date, the project has met several major objectives. It has achieved its major objective of establishing a U.S. manufacturing base for vanadium redox flow batteries. (As of this writing, Ashlawn Energy LLC is the only American-owned manufacturer of Vanadium Redox Flow Batteries poised to make a major impact on the future Smart Grid.) The prototypes built and used in these engineering efforts were all of an industrial scale, at 2.5 kW or the full 10 kW size, thus demonstrating that there are no systemic obstacles to a full-scale production battery. The drawings and plans to complete the project are all in place. Ashlawn Energy’s market analysis has shown that the Painesville battery is economically viable even at its present rate of efficiency and with its current high cost structure due to the fact that it has not yet entered full-rate manufacturing production of battery stacks. Ashlawn Energy is looking forward to completing negotiations with investors and moving forward with the manufacturing and installation phase of this project.
This joint green energy project between the City of Painesville, Ashlawn Energy and the Department of Energy provides a real world demonstration of the role energy storage can play in increasing the efficiency and performance of the American power grid. Painesville contributed through its investment in building the battery facility and in the participation of its city employees in assisting Ashlawn Energy in collecting data and monitoring the project.
7 Future Plans
The City of Painesville and Ashlawn Energy each have long-term interests in developing this project as a steppingstone to attracting needed investment capital to develop Ashlawn Energy’s proposed manufacturing operations in Painesville where Ashlawn expects to create high-tech local manufacturing jobs. Following this first project, dramatic improvements in battery manufacturing costs and battery system efficiency are expected. Two other projects, one in Los Angeles, California, and another in New York City, are already in their planning stages. The initial manufacturing goal is to establish production at the rate of several megawatt-scale batteries per year.
Expansion of Ashlawn Energy’s manufacturing plant thereafter will depend on many economic variables

City of Painesville, Ohio
Ashlawn Energy, LLC
Page 62
Vanadium Redox Battery Demonstration Program 20-Feb-2015 Technology Performance Report Energy Storage Demonstration
beyond the company’s control, but projections indicate that as the battery system becomes more efficient, and manufacturing cost continue to drop, installations of Ashlawn’s VanCharg™ battery systems will increase. Ashlawn Energy believes that when a production rate of three megawatts per year is reached, our battery systems will be competitive for installation at virtually every major new industrial and utility power project in the country. In fact, market conditions seem to be pointing in that direction. In many cases, energy storage is being written into project specifications and even mandated in some government sponsored projects. Markets include not only grid auxiliary services, but also supporting wind, solar, and other green energy projects. As our manufacturing costs continue to decline over time, we believe grid-scale battery systems will have economic and environmental advantages over back-up diesel generators in many applications thus opening up additional markets.
There is every indication that large commercial flow battery energy storage systems will become a major industry in the coming decade. The City of Painesville and Ashlawn Energy hope one day to be recognized as pioneers and subsequently as industry leaders of this emerging market.