technology assessment activities in the industrial
TRANSCRIPT
.——
APPENDIX C-EXHIBIT 1
ENVIRONMENTAL IMPACTS OF COCA-COLA BEVERAGE
(By Arsen Darnay and Gary Nuss)
PREFACE
The report examines and compares the total environmental impact associ-ated with the manufacture, filling, and disposal of various beverage containers.Total environmental effects were evaluated and compared for eight differentbeverage container material systems. The study concept was conceived by HarryTeasley of Coca-Cola USA and articulated and executed by Midwest ResearchInstitute.
Volume I is a summary of the study results. It describes in brief the researchmethodology and the study assumptions. Volume I contains comparisons of theeight container systems in each of the major environmental categories and in-cludes the study team’s speculations and judgments on the research findings.
Volume II is a detailed presentation of the rationale and calculations in-volved in arriving at estimates and measurements of the effects of each con-tainer system on the environment. Volume 11 contains individual chapters oneach material system. These chapters include details on rationale, calculations,and data sources.
Principal researchers for MRI were Mr. Arsen Darnay and Mr. Gary Nuss.Additional contributions and research support and assistance were provided byDr. Edward Lawless, Mr. Paul McNergney, Mr. Donald Heiman, Dr. EugeneVandegrift, Mr. William Park, Mr. James Cross, and Miss Linda Crosswhite.
The authors wish also to acknowledge the aid and assistance of the beveragecontainer manufacturers who provided data and perspective for the researcheffort--Chattanooga Glass Company, Owens-Illinois, Alcoa, Reynolds Aluminum,Monsanto Company, B. F. Goodrich Company, American Can Company, andContinental Can Company.
Approved for: Midwest Research Institute.JOHN MCKELVEY,
Vice President,Economics and Management Science.
INTRODUCTIONIn the spring of 1970, Coca-Cola USA asked Midwest Research Institute to
study the total environmental impacts caused by the production, use, and dis-card of beverage containers used by the company.
This assignment was the result of a staff study conducted by Coca-Cola USAheaded by Mr. Harry E. Teasley, Jr., Product Manager, Packaging. The staffstudy was an exploration of the ways in which Coca-Cola’s containers affectedthe environment. One conclusion of this study was that the interactions be-tween the company’s container systems and the environment represented acomplicated set of material and energy transfers. The handling of beveragepackages as components of solid waste was only one of many such transfers andpossibly the least important one.
The Coca-Cola study team also concluded that information sufficient to in-ventory all major materials and energy transfers necessary to produce, fill,deliver, and dispose of beverage containers was not readily available but couldprobably be obtained.
Finally, the team concluded that an effort to create this body of informationwould be useful and enlightening and would create a better understanding ofthe total environmental impacts caused by beverage production and consumption.
Midwest Research Institute was asked to meet two objectives in its environ-mental study of beverage packaging and distribution:
1. To establish the total environmental impacts created by the use of each ofseveral selected container systems available to Coca-Cola USA; and
(299)77-495 0- 77 - 19

— .—
300
2. To compare the impacts of various types of containers under the assump-tion that each container type is used exclusively for Coca-Cola packaging.
The report presents MRI’s conclusions. The study is a “first” in environmentalresearch. In it, we attempt to give a “total” environmental profile of severalproducts, showing all major material and energy transfers that can reasonablybe identified. To the best of our knowledge, such profiles have not yet been de-veloped for any other group of products, although the concept presented here andthe method followed will, we believe, be widely used in the future to introduceenvironmental considerations as a new element in commercial and industrialplanning.
RATIONALE AND APPROACH
The why's of environmental analysisPollution control in the conventional sense--the treatment of industrial efflu-
ents before discharge-is already a major new cost item in industrial practice.The national drive toward environmental cleanup, however, is now beginning toexpand into novel directions. For one thing, the so-called “third pollution,” solidwaste generation, has been discovered, and proposed solutions to the waste prob-lem include the recovery of wastes for industrial use, the reduction of wastegeneration at the source, and the raising of (revenues for waste disposal by im-position of disposal taxes on manufactured goods. For another, the fundamentalconnection between consumption and pollution is now common knowledge, andthe curbing of consumption is viewed—rightly-as a simple way to arrest en-vironmental deterioration.
These “new directions,“ if followed, mean a restriction of corporate freedomto act and higher operating as well as administrative costs. Industry, as a whole,appears willing to accept a reasonable limitation of its sphere of activity forenvironmental reasons-with emphasis on reasonable. But industry representa-tives are understandably anxious that in the sound and fury of our rush to cleanup air, water, and land, reason will be the first casualty; and when the dustsettles, industry will find itself fettered-while the environmental problems willstill be with us.
At this point in time, the “good life” provided by industrial civilization con-flicts with the ideal of a clean environment at many points. Pollution arisesfrom fossil and nuclear fuels whose conversion in machines and use in produc-tion, transportation, communications, lighting, and heating is the foundation ofthe good life. Dispassionately considered, the environmental issue is an invita-tion to find a new balance between two “goods’’—the good life and the good earth.A clean environment under medieval working conditions would be unacceptableto most. On the other hand, the good life is disappointing if it must be lived ona blighted globe.
A reasonable approach to the environmental issue must balance the various,and often conflicting, values we wish to increase. An indispensable prerequisitefor such an approach is knowledge-knowledge of the environmental impactscreated by our activities and the values we must give up in order to minimizethose impacts.
Industry’s best insurance against hasty legislation and intolerable strictureson its activities is to create understanding of its role in delivering values to thepublic—as well as the environmental insults that accompany such delivery. Todo this is a tall order: it requires a high degree of objectivity and institutionalmaturity. Self-analysis, if honest, always runs the risk of finding fault. Butultimately, it is to industry’s benefit to participate in the environmental debatein an objective manner. Only such participation can guarantee that a reasonablebalance between our various needs can be established.
This study is an exercise in self-analysis. It is an answer to the question posedby one company : “What is our contribution to environmental pollution ?“Study approach
This study concerns itself with the use of containers in Coca-Cola productdistribution. Beverage production is one of the cleanest industrial operations.Few pollutants and little waste reach the environment from the filling plant. Butbeverage production requires large quantities of containers whose manufacturegenerates pollution, and the containers are ultimately disposed of as solid wasteafter a single or multiple use.
Coca-Cola USA wanted to know not only the environmental impacts causedin the beverage packaging and distribution phase of its operations but also thenature and magnitude of impacts caused on its behalf by others. Two specific
301
aspects of Coca-Cola operations—the raising and harvesting of products thatbecome beverage components and the production of syrup-were excluded fromthe analysis.
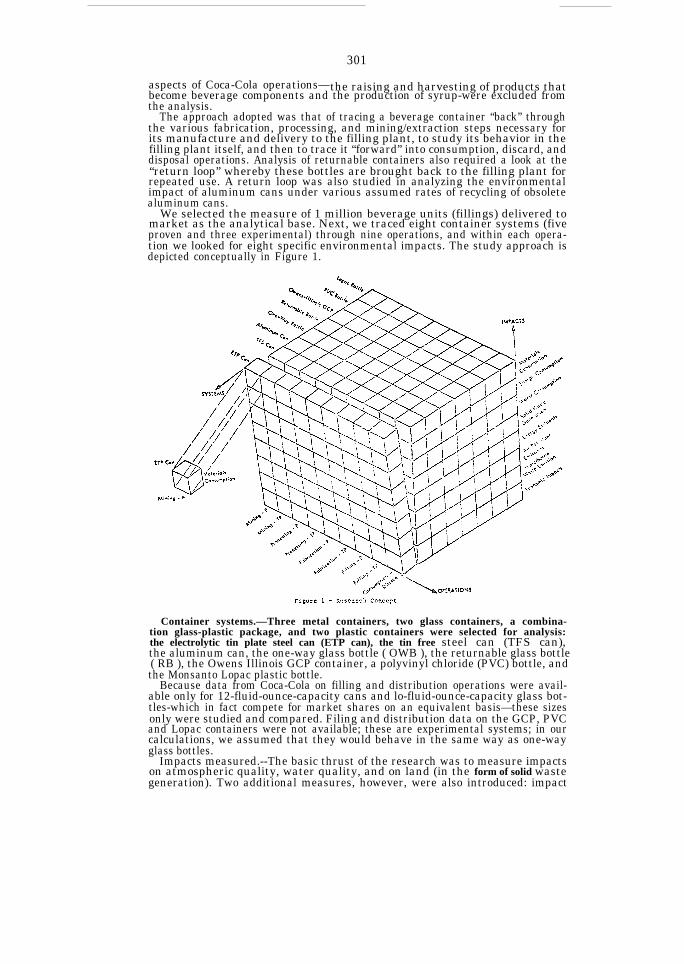
The approach adopted was that of tracing a beverage container “back” throughthe various fabrication, processing, and mining/extraction steps necessary forits manufacture and delivery to the filling plant, to study its behavior in thefilling plant itself, and then to trace it “forward” into consumption, discard, anddisposal operations. Analysis of returnable containers also required a look at the“return loop” whereby these bottles are brought back to the filling plant forrepeated use. A return loop was also studied in analyzing the environmentalimpact of aluminum cans under various assumed rates of recycling of obsoletealuminum cans.
We selected the measure of 1 million beverage units (fillings) delivered tomarket as the analytical base. Next, we traced eight container systems (fiveproven and three experimental) through nine operations, and within each opera-tion we looked for eight specific environmental impacts. The study approach isdepicted conceptually in Figure 1.
Container systems.—Three metal containers, two glass containers, a combina-tion glass-plastic package, and two plastic containers were selected for analysis:the electrolytic tin plate steel can (ETP can), the tin free steel can (TFS can),the aluminum can, the one-way glass bottle ( OWB ), the returnable glass bottle( RB ), the Owens Illinois GCP container, a polyvinyl chloride (PVC) bottle, andthe Monsanto Lopac plastic bottle.
Because data from Coca-Cola on filling and distribution operations were avail-able only for 12-fluid-ounce-capacity cans and lo-fluid-ounce-capacity glass bot-tles-which in fact compete for market shares on an equivalent basis—these sizesonly were studied and compared. Filing and distribution data on the GCP, PVCand Lopac containers were not available; these are experimental systems; in ourcalculations, we assumed that they would behave in the same way as one-wayglass bottles.
Impacts measured.--The basic thrust of the research was to measure impactson atmospheric quality, water quality, and on land (in the form of solid wastegeneration). Two additional measures, however, were also introduced: impact

—
302
on natural resources, measured in terms of materials and energy consumed, andimpacts on foreign trade, measured in terms of import levels required for a givencontainer system.
Following our research and analysis, we found that data could be presented,more or less accurately, in the following eight impact areas:
1. Materials consumption, including all materials needed for making the prod-uct but excluding water and fuels.
2. Energy consumption, broken down by type of fuel and by point of use (i.e.,mining, processing, fabrication, filling, and in transportation associated withthese activities, and with disposal). Energy consumption is uniformly shown inmillion British thermal units (Btu).
8. Water use, by point of use, given in 1,000 gallons.4. Solid waste generation, including mining wastes; processing, fabrication,
and filling wastes; and discarded containers as waste.5. Energy effluents, including airborne particulate matter, nitrogen oxides, hy-
drocarbons, sulfur oxides, carbon monoxide, aldehydes, and other organics, andlead.
6. Air pollutants emitted in processing and fabrication, excluding pollutantsgenerated by combustion of fuels.
7. Waterborne wastes generated, excluding such wastes as are generated inmining operations, which are included with mine tailings.
S. Economic impacts that result from waste management and the purchase ofmaterials from foreign countries.
Operations analyzed.—The initial study design called for the analysis of sevenspecific operations which together represent the total beverage container pro-duction-use-disposal system: mining/extraction, processing, fabrication, filling,retail distribution, consumption, disposal, and transportation steps betweenoperations.
In the metal and plastic container sectors, processing is a multistage opera-tion which could be broken down into a number of processing steps. In the glasssector, processing and fabrication are combined into a single operation. In spiteof these differences, we retained the original operation breakdowns for mining,processing, fabrication, and filling. But we found it more practical in dealingwith environmental impacts to combine all operations after filling into a single“consumption-disposal” category. Finally, we treated transportation betweenoperations as a special operational step throughout. Thus, in this report, impactsare measured in the following operations: Mining-Process, Mining-Transport,Processing-P, Processing-T, Fabrication-P, Fabrication-T, Filling-P, Filling-T,and Consumption/Discard-T.
The study results are quantitative, Impacts caused by the delivery to marketof 1 million fillings in various containers are shown in measurements appropri-ate to the impact. We were not asked and made no attempt to establish what dam-ages or hazards are caused by various pollutants emitted; we only recorded thequantities produced in such a manner that the container systems can be com-pared to each other.Methodology
The methodology used is discussed in detail in the Appendices where detaileddata are presented. Discussion of methodology in general terms is impracticalbecause of the multiplicity of actions that have to be explained—which is bestaccomplished with direct reference to the data used. However, some commentson procedure can be generalized.
Analysis began with a determination of the physical components of eachcontainer and closure, by weight, and the gross quantity of each required asinput into the container manufacturing plant for a given unit of container out-put. This information was provided by container manufacturers.
Next, the number of containers required to deliver 1 million fillings of beveragewas determined from data provided by Coca-Cola.
These two sets of data were then combined to establish the total processedmaterials required as inputs to the container fabrication operation.
Analysis of the materials processing operations resulted in information onthe types and quantities of raw materials needed at each processing stageper unit of output, and processing input requirements represented quantities ofraw materials that had to be mined or extracted in mining operations.
Consumption of energy per unit of output in the various operations was deter-mined either from census data or from industrial sources. Data were obtained
by type of fuel or energy consumed; these data were expressed uniformly inmillion Btu using published conversion factors. Energy consumption data peroperation output unit were multiplied by the number of units needed for1 million fillings to yield total energy requirements.
Water consumption data were obtained in the same way as energy data.By using national transportation statistical sources (Interstate Commerce
Commission data for rail and truck movements and U.S. Corps of Engineersdata for barge traffic), the average distance that various commodities are movedby transportation mode and the percentage of tonnage moved representedby each mode were established. Data on movement of containers to fillingplants, from filling plants to retail outlets, and the movement of empty con-tainers to disposal sites were determined from company sources and fromother published reports.
Next, total ton-miles of movement by transportation mode and total fuel con-sumption, by type of fuel, per ton mile were established from national statistics,so that average energy consumption values in transportation could be used.
Data on transportation energy consumption between various operations werecalculated by multiplying tons of materials required for 1 million fillings byaverage distance moved by mode and by average energy consumption per ton-mile. In addition to commodity and product movements, of courses, the weightof packing also had to be taken into consideration to obtain realistic values.
Using federally sponsored research reports on air pollution generation, energyeffluent factors were established by unit of fuel combusted in various stationaryand mobile conversion/combustion units. These factors, multiplied by energyconsumption in the various operations and transportation steps, resulted inthe measures of energy effluent generation.
Assembly of data on (1) mining, processing, fabrication, and filling wasteproduction; (2) waterborne waste generation; and (3) airborne waste genera-tion (other than energy effluents) depended on a large number of data sources,some of them corporate, some federal research reports, some statistical sourcessuch as the Bureau of Mines annual reports. In some cases, waste generationwas estimated based on analysis of materials balances in the processes involved.
Where a container and its closure consisted of more than one material, separatestudies of each material had to be undertaken and combined to yield a totalfor the container system.Study Limitations
To establish the total environmental profile of products is a new departurein product analysis. Such studies, until the present, would have served no validcommercial purpose. Not surprisingly, therefore, few if any companies have thereporting systems that can deliver information to make environmental judg-ments about their products.
This state of affairs required MRI to seek information from many differentsources, published at different times, using different bases. Many informationelements needed were not available in published form and had to be gatheredby personal visits to companies. Much of the effort was devoted to the assemblyof necessary data and information and to the reconciliation of conflicting infor-mation and information referring to different time periods. Some of our datacame from industry surveys, some from conservation with two or three com-panies. Some corporations, because of the nature of their industry, could notreveal information on their operations, and we were forced to estimate impactsby analogy with other industries or by selecting an impact level from a widerange of reported impacts.
For these reasons, the data presented here should be viewed as good approxi-mations of the truth but subject to revision as better information becomesavailable.
Information on the experimental container systems is understandably moresketchy than on the established packages. Among established packages, data onaluminum containers were taken almost entirely from published sources sinceindustry representatives could not reveal operating data; such data are con-
sidered proprietary.Study Assumptions
Research of the type conducted here, where problems of data accuracy, absenceof information, and other analytical difficulties have to be dealt with, must nec-essarily make use of assumptions to allow completion of the work. We consider
304
the assumptions used extremely important in qualifying the findings and sowish to make them explicit at the outset.
Geographical scope.—Since the environment by definition includes all of innerand to some extent outer space, this study could not have been completed unlessgeographical boundaries had been set for impact measurement. Thus, we assumedthat only those environmental impacts would be measured which occur withinthe boundaries of the Continental United States. Thus, for instance, miningwastes generated and energy consumed in mining iron ore or bauxite in a foreigncountry for import to the U.S. are not reflected in impact measurements.
Operations measured.-In addition to a geographical boundary, we also setan operational boundary, assuming that only those impacts are measured whichoccur in direct connection with an operation involved in the production, use, anddisposal of containers. Thus, energy consumption, pollution and waste genera-tion, and water use are measured for mining iron ore, fluxing limestone, andcoking coal necessary for pig iron production. But the same impacts are notmeasured for the mining of coal burned to generate electricity which is, in turn,used in mining and processing of raw materials and the fabrication and fillingof cans. Impacts related to the production and delivery of fuels are consideredindirect impacts and are not reflected in the analysis.
Materials exclusions.--Our work would have been unmanageable if we hadbeen required to trace the impacts of all materials necessary for the production.delivery. and use of beverage containers. Materials used in small quantities suchas tin in ETP cans; chromium in TFS cans; feldspar and other minor materialsin glass manufacturing: plastic gaskets in closures: inks, lacquers. and sealentsin can production : and packing materials of all kinds were simply added to thetotal weight that had to be handled: they were not traced back to their origins.
Transportation assumptions.—Several assumptions were made concerningtransportation, as follows:
1. Rail.—Whi1e electrical power is reportedly used to power some rail move-ments, we made the simplifying assumption that all rail movements were dieselpowered.
2. Truck.—We assumed that all truck transport, except that used in fillingand disposal, would be provided by both diesel and gasoline powered vehicles inproportions as experienced nationally for both inter- and intracity movements.
3. Filling transport.—Data provided by Coca-Cola were assumed to be repre-sentative for each type of container. It was assumed that cans are transported towarehouses by diesel truck and from warehouses to retail establishments by gaso-line truck. We assumed that experimental containers on which data in fillingtransport were unavailable, would move in the same way as the traditional con-tainer they most resembled--this Lopac and PVC like the one-way bottle, theGCP like the cans.
4. Retail to point of consumption.--We did not attempt to measure transporta-tion requirements from point-of-purchase to point-of-consumption nor, whereapplicable, the transportation required for returning empty, returnable con-tainers to retail outlets by consumers.
5. Disposal movement.—Based on surveys conducted by Combustion Engi-neering Company, we assumed that all solid wastes moved 6.5 miles and that thismovement was by gasoline powered truck.
Electrical energy.—As a simplifying step, we assumed that all electrical energyused in any part of the beverage system comes from coal, oil, natural gas, andhydroelectric facilities in proportions as experienced nationally. Also, in measur-ing electrical energy consumption, we used as ameasure 10,600 Btu per kilowatt-hour 1—the fuel energy required to generate this unit of energy on a nationalbasis—rather than the theoretical equivalent value of a kilowatt-hour, 3,413 Btu.
Since aluminum production consumes proportionately more hydroelectric proverthan all consumers of electricity, our assumption may seem to overstate, slightly.the quantities of fuel consumed in aluminum production and the quantities ofpollutants emitted as a consequence of fuel combustion for electrical generation.This point is discussed further below.
Size equivalency.--Since data from Coca-Cola on filling and transport opera-tions were given to us for 12-ounce cans and 10-ounce bottles and. furthermore,because these two types of containers compete on an equivalent basis in themarketplace, we assumed that they are equivalent for purposes of environmentalcomparison, in spite of the fact that on a unit-by-unit basis more liquid is deliv-ered in cans than bottles in this case. The data presented. of course, can be used
1 Derivation of this value is presented in Appendix A, volume II, of this report.

305
to express equivalency between quantities of liquid delivered, in which casefewer-cans are used and the environmental impacts of the can systems would beproportionately lower—approximately ten-twelfths or 17.7 percent.
Trippage.--Based on Coca-Cola’s experience at the time of initiation of thiswork, we assumed that returnable bottles make an average of 15 trips beforeeither breaking or being rejected as no longer serviceable. Consequently, onereturnable container is equivalent to 15 nonreturnable containers in the impactanalysis.
Plastic containers.—In the cases of beverage containers made of conventionalmaterials--steel, glass, aluminum-processing steps and material requirementsare defined largely by the particular material used. This situation does not existwith plastic containers. A particular plastic material may be derived from severaldifferent raw materials and by several different processes.
Ethylene is a starting material for both the GCP polyethylene cup and thePVC bottle. In the U.S. most ethylene is derived from liquid hydro-carbons--ethane or propane-extracted from natural gas; moreover, most plants to bebuilt in the future will probably also be based on ethane-propane given currentconditions.’ Since the study team obtained direct manufacturer’s data and ex-perience on ethylene produced from propane feedstock, our analysis of ethyleneproduction is based on propane as a feedstock.
Lopac is a proprietary polymer developed by Monsanto Company; and due toits newness and the company’s proprietary interests, data on specific Lopac proc-esses and requirements were not made available to MRI. Our analysis, therefore,is based on analogous processes and materials.
Monsanto recommended that Lopac monomer production be based on acryloni-t rile production and that Lopac polymer production be based on PVC polymeriza-tion processes. These suggestions were incorporated into our analysis.
Acrylonitrile is produced from a propylene feedstock, and propylene may bederived either as a by-product of gasoline manufacturing operations or fromethylene production from propane feedstock. Although most propylene is ob-tained from gasoline operations, our study assumes the propylene required is aby-product of ethylene produced from propane. This assumption places Lopac onthe same basis for material requirements and mining-extraction impacts as theother plastic or plastic-containing systems.
To obtain the propane feedstock for conversion to plastic raw materials re-quires two processing steps which are classed as mining-extraction operationsfor this analysis. The first step is recovery of natural gas from the gas field ; thesecond step is extraction of propane from the natural gas at a natural gas plant.In the latter operation various airborne effluents are generated and emitted fromthe process; although these effluents are the same types as the effluents fromenergy consumption, they are classified as mining wastes since they are processwastes occurring in the mining-extraction operation.
One drawback to the use of PVC—in any type of packaging--is the formationof hydrogen chloride (HCI) when PVC is incinerated. Because of this particu-larly noxious effluent and the difficulties it creates in incinerators, the studyteam concluded HCI should be included in the energy effluents total for PVC.Since roughly 14 percent of the nation’s solid waste is incinerated, 14 percent ofthe waste PVC going to disposal was considered to be incinerated. This ratiowas used to estimate total HCI emissions from the incineration of PVC wastesgenerated by the manufacture and use of 1.01 million containers. These effluentswere included as “energy effluents” in disposal operations rather than as “processwastes" because it was felt that the HCI emissions should carry a weight of 0.4instead of 0.1.
‘Z Of the two materials, propane hm had an economic advantage over ethane becauw ofI)y-pr(,(ll]ct credits. In addition, propnne is more easily transported than ethane, although anethane fee[istocii gives a greater yteid of ethyime.
—
APPENDIX C—EXHIBIT 2
AUTOMOBILE POWER SYSTEMS EVALUATION STUDY
STATEMENT OF OBJECTIVES
As part of its continuing efforts to assure that the best possible automotivepower systems are made available on an appropriate time schedule, Ford MotorCompany is awarding a study grant to support independent research studies andtechnical appraisals of potentially promising alternatives to the internal com-bustion engine.
The overall objective of these evacuations is to provide independent, objectiveguidelines for achieving and maintaining optimum vehicle characteristics withrespect to national needs and desires for clean air, conservation of non-renewablenatural resources, improved safety and general betterment of mobility andquality of life within an affordable economic framework.
A concomitant general objective of the evaluations is the proper timing ofactions relating to power system changes—the research and development lead-times for various propulsion alternatives, time-phasing of logistical support andinfrastructure development, feasible rate schedules for large-scale conversion toalternative systems, etc. In other words, the overriding questions relate not towhat can be done, but to what should be done and when in order to gain signifi-cant advantages over today’s internal combustion engine and its logical andlikely evolutionary derivatives. It is expected then that comparisons of all alter-natives will be made against a moving baseline of timely improvements and ex-tensions of present engine technology. For all comparisons, the time-frame ofgreatest interest is the decade 1980-1990, but study attention must extend wellbeyond this period to comprehend such things as resource availabilities in-cluding potential for different fuels; full-conversion evaluations and economicimplications.
Specific objectives with respect to each admissible alternative course of actionwould include the following:
A. An engineering appraisal, including identification of operational charac-teristics and parameters, of major unresolved technical considerations, includ-ing time and cost estimates for their probable resolution.
B. A determination of the earliest feasible and practicable large-scale con-version of vehicles to the system, with an estimate of the most reasonable con-version rate.
C. An assessment of the probable total aggregate economics, natural resource,environmental and societal impacts Of the conversion, including production,logistic and energy support requirements. Here, explicit attention should bedirected to forecasting and bounding future motor vehicle use, taking into ac-count changed land use policies, new life styles and the probable increased avail-ability of public transportation.
D. An overall comparative evaluation in relation to forecasted internal com-bustion engine technology, including the engine improvement information thathas been provided to the National Academy of Sciences.
E. Explicit development of manufacturing costs for major system components,treating them parametrically where costing uncertainties so dictate. Here, ex-tensive use of sensitivity testing would be indicated to define cost targets criticalto decision choices.
F. Categorization of research and development requirements into tasks thatlogically call for either government funding or industry funding, depending onthe size of commitment time for payback, recipient of the benefits, probabilityof success, etc.
During the course of this effort, Ford will make available information onpresent internal combustion engine technology to the extent that such informa-tion would not be prejudicial to any patent or proprietary interest. Ford willalso make available alternate engine information such as that already providedto the Environmental Protection Agency and the National Academy of Sciences.
(306)

307
Our parallel efforts to forecast technology and socioeconomic and environmentalfactors will not be made available in order to avoid introducing an appearanceof bias or lack of objectivity in the study.
Finally, it is our desire that the results of the study be made available to thepublic in published form without prior editing or approval by Ford MotorCompany. The product is the sole responsibility of Cal Tech JPL.

—
APPENDIX
1975 GENERAL MOTORS REPORT
C-EXHIBIT 3
ON PROGRAMS OF PUBLIC INTEREST
[To obtain a copy of the full report, write to: General Motors Corp.,Detroit, Mich. 48202.]

APPENDIX C-EXHIBIT 4
TECHNOLOGY ASSESSMENT IN BELL CANADA 1
(By Lawrence H. Day, Assistant Director—Business Planning, Bell Canada)
INTRODUCTIONThe information in this report outlines the process and activities associated
with technology assessment (TA) in Bell Canada. This material is presentedto the Technology Assessment Board of the U.S. Congress in the belief thatthe sharing of these experiences will contribute to the continuing dialogue onthe value of TA. The following views should be considered as the author’s opinionof how TA is conducted in Bell Canada, and not considered as a formal state-ment of corporate policy.
The report begins with a brief introduction to Bell Canada. The function ofthe author’s organization in Bell Canada, the Business Planning Group, iselaborated in some detail since this is the Group that has conducted or spon-sored the major TA activities in Bell Canada. The document continues with areview of some of these activities, with special emphasis placed upon our workin the substitution of telecommunications for travel, and its resultant impacts.The next section deals with a current review of the social impacts of a newelectronic polling service that the corporation is currently considering. The lastpart of the paper will review some of the lessons we have learned in the past fouryears, and the author’s opinions of where TA will fit in the future in both BellCanada and the corporate environment in general.
BELL CANADA AND THE PLANNING GROUP
BELL CANADA
Bell Canada is Canada’s largest provider of telecommunications services. Itoperates as a corporate entity in the Provinces of Ontario and Quebec. Other keyorganizations in Canadian telecommunications are described below. Bell Canadaoperates in association with the Trans-Canada Telephone System (TCTS) forthe provision of nationwide telecommunications services. The TCTS is com-posed of eight organizations (Bell Canada, three Bell owned or controlled, threeowned by Provincial governments, and one a subsidiary of a U.S. corporation,General Telephone). The TCTS competes nationwide with CN-CP Telecommuni-cations in the voice, data, and visual telecommunications businesses. Otherorganizations include TeleGlobe Canada, the Federal Government owned car-rier for overseas telecommunications, and Telesat Canada which is a jointpublic-private corporation for the provision of satellite telecommunicationswithin Canada.
Bell Canada is Canadian owned and controlled and is not associated with theAmerican Telephone and Telegraph Corporation. Bell Canada owns its ownmanufacturing organization. Northern Telecom. Northern Telcom. is not acaptive supplier in the traditional sense, Bell owns 62 percent of the shares butonly buys slightly more than 50 percent of Northern’s output. The rest is soldto other Canadian and foreign firms. including over $100 million in sales in theU . S . B e l l C a n a d a a n d N o r t h e r n j o i n t l y o w n B e l l - N o r t h e r n R e s e a r c h w h i c h i s
Canada’s largest industrial research organization. Another key subsidiary isTele Direct which handles Directory (Yellow Pages) sales and publication inCanada. Consolidated operating and sales revenues for Bell Canada in 1975 wereapproximately $3 billion.
1 Milch Of the materl ~1 In this document has been ?XIblisherl in prev~ovs Business Planningreports and n~ners. The publications list in Appendix 3 is provided to keep referencesto internal documents to a minimum.
(309)

310
THE BUSINESS PLANNING GROUP (BPG)
BACKGROUND
Forecasting has been an established function at Bell Canada and the telecom-munications industry for many decades. In the past however, forecasting hasbeen oriented toward identifying both customer demand patterns and tech-nological change. The BPG was created in the mid-1960s to conduct new forms ofresearch and planning, not to duplicate or consolidate any existing planning orforecasting function in Bell. Within the context of a rapidly changing environ-ment, it is the BPG’s objective to position itself through research, informationcollection, and analyses to be capable at all times of advising decision-makers onpossible future business opportunities, threats, and their impacts on the cor-porate environment. The opportunities and impacts that concern the BusinessPlanners are those that might arise through technological, economic, social, ormarket developments in the intermediate (5 to 15 years) and longer term future.
The Group’s mission and approach to its research may be delineated furtherthrough a brief examination of some of the project areas and techniques used toconduct these various analyses. One area of research is a multifaceted examina-tion of the potential of future trade-offs between travel and communications.This research examines the technological, economic, behavioral, energy, environ-mental, and government policy issues associated with the substitution question.Another project reviews a similar range of issues associated with potential socialimpacts of “wired city” services. Both of the above two areas will be examinedin more detail in the review of Bell Canada TA activities. Other areas of con-cern involve evaluation and testing of various approaches to computer con-ferencing and future ‘{paperless offices” (described briefly below). All of theseprojects, and others not discussed here, have involved the use of a variety oftechniques and support capabilities that are important in the BPG’s research.Several are described below.
TECHNIQUES AND RESEARCH AREAS
TREND EXTRAPOLATION
Perhaps the most basic form of futures research in many business planningefforts involve the use bath of regression analysis and judgmental trend pro-jections. Sample areas explored include expected changes in the Canadian grossnational product (GNP) to the year 2000, corporate revenue and expense com-ponents, Canadian energy trends, and computer market trends. One project in-volved using the concepts of “S” curve forecasting for products and services inthe early and rapid stage of growth. This overall concept utilized the idea ofdiffusion growth of services or products throughout an industry from an initialpace-setter.
THE DELPHI APPROACH
Six major Delphi studies have been conducted by the BPG. Over 215 panelistsexplored the future of education, medicine, business information systems, andfuture communications systems in the home. The main thrust of these studies wasto identify emerging trends and changes that would have an impact on needs forvisual and computer communications. The studies were market-oriented andforecasted the adoption of various services at defined threshold levels. Marketadoption and not technological breakthroughs was the prime criterion used. Eachof the forecasts was presented in a social framework developed by the Delphipanelists. Various structural and social changes expected in the relevant profes-sions considered were also forecasted.
SPRITE (SEQUENTIAL POLLING AND REVIEW OF INTERACTING TEAMS OF EXPERTS)
This is a new methodology developed by the BPG that modifies the Delphi proc-ess as originally defined by the RAND Corporation. SPRITE utilizes the conceptof controlled debate and feedback to uncover impacts resulting from the uses oftechnology. Here consensus is not a goal as it is in Delphi studies. The panelistsoffer assessments that are presented from the point of view of an interest group.These views are not summarized in overall study averages but remain independ-ent for counter analysis by other interest groups. Hence, SPRITE is a valuabletool for TA studies. The methodology was applied to two studies of future com-munications into the home. The services examined included Shopping from the

311
Home, Checkless Banking, Programmed Education, Home Security Services, andten forms of information retrieval service that could be used in the home.
SURVEY RESEARCH
The BPG has used survey research in a number of its projects. For example, alarge scale survey of business travelers was conducted to provide behavioraldata for a project on the potential of long term trade-offs between travel andcommunications services.
CROSS IMPACT ANALYSES
The technique of cross impact analysis has proved to be a valuable aid inexplicitly stating assumptions of the interrelationships and interdependencies inthe development of new forecasts. The technique is used to represent relationshipsof variables in a complex environment, and present the summary in a meaning-ful fashion. Recent experience enables us to identify four major attributes of thetechnique: (1) an educational process takes place in the garnering of data sincepeople must think over complicated relationships in a structured manner; (2) acommunication process takes place since answers are usually obtained by havingseveral panelists in the same room vote and discuss their answers; (3) a sum-marization process takes place after the data has been gathered since many peo-ple’s opinions on various topics are mirrored back to them on one matrix, thusenabling the drawing of conclusions using this one matrix as a reference; and(4) a computer-based sensitivity analysis can be run on the data to simulate the
influence of sudden changes in policy. This can lead to counter-intuitive resultsthat provide new perspectives for decision-makers.
Of course, the ultimate limitation of cross impact, and indeed any Delphi-likeprocess, is the accuracy or inaccuracy of the raw data. However, benefits thatshould be expected are the possibilities for education, communication, and sum-marization of complex policy environments often found in interdisciplinary re-search. The BPG has studied the cross impact technique extensively, and haspublished several critical documents on its potential for futures planning. Thegroup has also applied the technique in several of its major TAs. Cross impactanalysis has also been used by the group to analyze several corporate policyissues. This involved the use of a specially prepared computer analysis package.The BPG has also assisted several Canadian government departments and cor-porations in the use of cross impact analysis.
The above paragraphs describe several techniques used for technological fore-casting and assessment. The BPG also uses powerful computer support tools aswell. The “Paperless Office” trial is an important example.
THE “PAPERLESS OFFICE” TRIAL
NLS (the On-Line System) is a concept conceived over ten years ago at theStanford Research Institute (SRI). In 1973, the BPG became the first corporateorganization to agree to subscribe to the NLS experimental system. The BPGnow participates as a real-world user and has undertaken an extensive assess-ment of the system from the user and social point of view.
The NLS is a highly refined information retrieval, text editing, electronic mail,and teleconferencing system designed to aid the “knowledge worker” by facili-tating the rapid organization and preparation of text-based information. Thesystem’s ideal, as originally conceived, is to “augment the human intellect”. Thesystem provides a means through which information can be more readily gen-erated, processed, and retrieved. Ideas are exchanged in an ongoing mode, with ashared data base of journals, reports, and projects that are available to allNLS participants.
Members of the BPG, both the professional and support staff’, have directaccess to NLS through terminals located in the BPG offices. Portable terminalsare also available to facilitate working from remote locations, that is, workingfrom the home or from distant cities. In addition to using NLS for daily officefunctions (report writing, memo storage, message sending, etc.), the BPGis using NLS to build its internal computerized data base, which supplementsthe shared NLS data base of a broader scope.
THE STAFFAn examination of the formal training of the various Business Planners shows
that Group members have a wide variety of educational backgrounds. This in-

——. .— —.
312
eludes advanced degrees in business administration, electrical engineering,marketing, political science, public administration, arts, computer sciences, lin-guistics, and economics. Regardless of the educational backgrounds of the indi-vidual planners, they are all encouraged to be generalists. Hence the approachto problems is from the point of view of a generalist rather than a subject spe-cialist. In addition, specialized skills in various technical, behavioral, and legalareas are obtained on a consulting “as required” basis rather than through per-manent hiring. Past experience has shown that these specialists tend to becomecut off from their parent disciplines if they become full-time planners. This isoften to the disadvantage of both the Group and the individual. One slightlyunusual aspect of BPG staffing is the fact that many group members have degreesin business administration. This is not common for technological forecastingand assessment or futurist groups but it has resulted in a healthy generalistatmosphere in the Group.
T E C H N O L O G Y A SSESSMENT IN BELL CANADA
INTRODUCTION
The TA work at Bell Canada was initiated by the BPG in 1972. At the time,this was regarded” as a logical extension of the technological forecasting activi-ties underway in the Group. This extension was undertaken at the initiative ofthe Group management rather than under specific direction from senior manage-ment. This was not unusual since the vast majority of Group projects have beeninitiated internally rather than assigned to the BPG. The broad mandate of theorganization has encouraged this approach to technological forecasting andassessment.
The definition of TA that has been used is one of the accepted ones in the TAprofession. Our shorthand definition is that TA is the advance identification ofthe secondary impacts that often arise from the uses of technology. Our moreformal definition has been the one presented by Vary Coates:
“Technology assessment is the systematic identification, analysis, and evalua-tion of the real and potential impacts of technology on social. economic, environ-mental, and political systems and processes. It is concerned particularly withthe second and third order impacts of technological developments; and with theunplanned or unintended consequences, whether beneficial or detrimental, whichmay result from the introduction of new technologies or from changes in theutilization of existing technologies. Technology assessment seeks to identifysocietal options and clarify the tradeoffs which must be made; this approach isdesigned to provide an objective and neutral input to public decisionmaking andpolicy formulation with regard to science and technology.” 2
BPG has undertaken TA activities in four areas. The actual work ranges fromprojects that follow a rigorous TA methodology to those that are involved withexploring fundamental interactions between telecommunications and other sec-tors of society. These activities are:
(a) The study: A Technology Assessment of Computer-Assisted-Instruc-tion Use in Colleges;
(b) Exploring the societal impacts of proposed wired city services;(c) Exploring future trade-offs between travel and communications serv-
ices;(d) Sponsoring research into the impact of new telecommunications serv-
ices on native Copulations of the Canadian North ;The first three of the above studies were conducted using internal professionals
with outside support where required. The final study was contracted with QueensUniversity of Kingston, Ontario and was monitored by a BPG professional. Thisreport will concentrate on the first and third studies. The Computer Aided In-struction (CAI) study will be referenced since it was the first TA conducted bythe Group and used the most widely known methodology, the MITRE approach.The Group has been interested in trying out a variety of methodologies in its TAactivities since it is clear that there is no approach that enjoys widescale ap-proval as the “right way” amongst the professionals associated with the field.The CAI study is summarized below. The work in travel-communications sub-stitution takes up the bulk of this descriptive section on BPG-TA activities.
z Vary R. C’oates, Technolog . and Public Policy : The Process of Technology Assessmentin the Federd Government. S/ummar Report, Program of Policv Studies in Science andTechnology, ‘The George Wushtngton ~niwerslty, Washington, D.C!., July 1972, p 1.

.
313
TA OF COMPUTER-ASSISTED INSTRUCTION
This study represents the most formal and extensive TA conducted by thegroup to date. This study had two prime objectives:
To illustrate a methodology that will be of use in future TAs.To assess potential societal impacts of CAI in post-secondary institutions.
The primary objective was undertaken to determine what methodologies wereavailable to conduct structured TAs. The group had been involved in extensivetechnological forecasting activities in the educational field for several years, andthrough these efforts and the acquisition of data from many outside researchorganizations had developed a large educational data base. It was obvious thatmore than this action was required to conduct a TA, and that a methodologywas needed to organize a TA project. The initial phase of the CAI project wasconcerned with a Search for a TA process. The approach outlined by Mitre Corp.in their research for the Office of Science and Technology (Executive Office ofthe President ) was selected as one that would serve our needs.’
CAI was selected as a subject of study for a number of reasons. Bell Canadahad financed research and trials of systems in the educational technology field.The Business Planning group had also conducted two extensive Delphi studiesexploring the future of educational technology. Part of this research was con-ducted with McGill University in Montreal as part of a graduate thesis re-search program, and this choice of subjects matched their interests as well.Finally, the field is one that has been the center of many controversies andgrand promises in the last decade. This study was designed to bring all of theseissues into a common perspective. The steps followed in the CAI study areoutlined below. Since the Mitre methodology was used here. it is useful to listthe seven basic steps followed in this process:
1. Define the assessment task;2. Describe the relevant technologies;3. Develop the state of society assumptions;4. Identify the impact areas;5. Carry out a preliminary impact analysis;6. Identify possible action options;7. Carry out a complete impact analysis.
The MITRE approach is shown in figure 1. Thisforms used in the various steps of the TA, whichBPG. The approach used in each of the seven steps inexamined.1. Define the assessment task
figure also illustrates thewere also adopted by thethe CAI study will now be
Definition of the scope of the study was an important first step. Initially theresearcher had the entire field of educational technology as his scope of interest.Areas such as computerized library systems, information retrieval television,audio-visual terminal development, and chemical learning were excluded fromthe scope of the study in order to make the analysis manageable. The scope wasrestricted further to the use of CA I in post-secondary institutions rather thanattempt to cover its us? across the various school levels, industry, and researchinstitutions. Four groups that would be affected more than any others in societyby the introduction of CAI were selected for the action and impact analysis;students; professors; colleges; and industry. The study was a future-oriented,technology initiated one. The impacts discussed were social, economic, or in-stitutional in nature.
~ }Iartin %’. .lones. A Technolo~ .Assewmexrt 3fethodology : S o m e Basic propositions,Vol~lnle 1, The Mitre Corporation, Washington, 1). C., June 1971.

—-— — —
-...
314
L

315
2. Describe the relevant technologiesThis section relied on input from two sources. Firstly, the two Delphi studies
on the future of educational technology conducted by the BPG were used toprovide common definitions and a forecast data base. Secondly, the report pro-duced for the U.S. Congress by the Committee on Public Engineering Policy thatexplored the societal impacts of CAI was used for some scenario inputs andsome general technical limitations statements.4
The Bell Delphi studies were used to provide inputs on the cost-benefit ratiosthat would be required for CAI adoption at the various school levels, for de-scriptions of future related technologies, for forecasts of future hardware andsoftware, and for the various potential applications of CAI.3. State of Society Assumptions
The state of society assumptions were developed from the Bell Delphi database as well. The areas explored were future trends in Canadian value systems,the business and economic environment, the institutional environment, and therelevant social factors.4. Major impact categories
The categories selected for further evaluation were the business (economic),institutional, and social impacts of the widespread introduction of CAL Theresearcher concluded that the impact of CAI on future values would be diffi-cult to determine at this time.
“In the case of CAI, though value assumptions set the stage for widespreaduse, it is difficult to foresee any changes in values resulting from this single tech-nological development, at the present time.” 5
5. Preliminary impact analysisThe process used was as follows:“The primary impact is traced from its source to its ultimate effect on a
certain social group. The primary impact in turn, becomes the source of thesecondary impact. Because the second-order effect will occur only if the first-order event has taken place, probabilities of secondary consequences are alwayslower than the likelihood of corresponding primary effects.
The impacts presented are quoted substantially from a pilot TA commis-sioned by the Committee on Public Engineering Policy. Forecast dates of the BellCanada Delphi’s are incorporated and impact characteristics are quantified.” 6
The following sixteen impacts were selected for examination in this analysis:—increased costs;—improved construction;—physical plant modification;-closer ties between schools;-restructuring of curriculum;--extended day, week, and year;—standardization and centralization;-coping with poorly prepared students;—impersonal education;—individualized instruction ;—aid for minority-group students;—student-instructor relationship;—modification of instructor’s role;—new copyright protection;—industry-controlled education;—development of industries and products.
6. Identify possible action optionsPhases 6 and 7 of the MITRE methodology were completed during the second
part of the CAI study. The researcher shifted his focus from secondary re-search to that of original data collection. His objective was to obtain anindependent, Canadian evaluation of the possible impacts of the options forvarious actions. The study design used group judgmental data from a numberof Canadian experts on the various aspects of CAI system design and use, This
A Study of Technology Assessment Report of the Committee on Public EngineeringPolicy, Nakional Academy of Engineering, Government Printing O~ce, W-ashin@on, DC.,1969.
G Philip Feldman, A Technology Assessment of (_’omputer-Assisted-Instruction, BusinessPlanning Group, Bell oanada, Montreal, Quebec, August 1972, p. 1S.
0 Ibid., p. 21.
77-495 0- 77 -20

316
was a specialized survey rather than a Delphi study since there was only oneround of the questionnaire and no interaction between the respondents duringthe study. However, the survey was not a normal one in the statistical ormarket research sense since the respondents were not selected from a randomsample. They were selected from earlier panelists on the business planningDelphi study on educational technology, and from a list of members of aneducational technology committee of the National Research Council of Canada.The final group of respondents represented a cross-section of individuals fromthe teaching profession, university administration, educational research orga-nizations, government departments, and industry. Each potential respondentwas given a copy of the report outlining the preliminary analysis (steps 1 to5) and each had received copies of the Delphi material. Hence, the respondentswere working from a common data base and were well-aware of the use oftheir inputs.
The initial concept was to complete a sixty-ceil cross-impact analysis. How-ever, this was too great a task through which to put any volunteer respondent.The researcher decided to choose the most important action options and im-pacts, and to work out a modified impact matrix. The probability of the selectedimpacts and actions occurring in the next ten years was evaluated first by thepanel.7. Final impact analysis
This was obtained from the replies of the CAI-TA panel assembled by theresearcher. As noted above a reduced matrix was constructed. This is shownwith the final estimates of the societal impact of the CAI in figure 2.
The final reduced matrix was analysed by the researcher who developed thefollowing conclusions:
“Though (figure 2) does not examine every conceivable action and impactrelated to CAI the data clearly indicates that few unfavorable societal conse-quences will result from widespread use of CAI in colleges. In fact, it appearsthat almost all parties will benefit from the proliferation of CAI systems. Stu-dents, whether they are at the top or bottom of their classes, will benefit becauseof increasing individualized instruction. Professors will benefit because theywill be liberated from the mundane chores of reinforcing knowledge. Finally,industry will benefit because of new education related business opportunities. Inorder to maximize the favorable effects mentioned above, we will now recommendthat certain action options be undertaken. Since the ultimate purpose of a TA isto delineate actions whose execution will influence projected events in a sociallyresponsible manner, the following recommendations constitute the most im-portant segment of this TA:
Governments should legislate new types of copyright protection.Development of a common author language should be encouraged.Colleges should examine the feasibility of introducing professional incen-
tives for programmed materials.There should be greater co-operation between colleges and industry includ-
ing the institution of CAI programmer consultant services.Professors should use CAI as a supplement rather than a substitute.” 7
~ Ibid., p. 03.

—. .
317
—
?mI0n
?R0aABILtT
:$:
5
.7
s
J
.7
. .
5
.7
.1
.
1
5
‘J
3
-.
s
3. .
5
s
.7—
o
0
— -
0.-. .
0- - -
- - -
● I—..
. 1
. - .
0
. 1
.1
● 1
0
● 1—
0
0
0
*Z
0. .
● I
0
0—

318
TECHNOLOGY ASSESSMENT OF TRAVEL-COMMUNICATIONS SUBSTITUTION
INTRODUCTION
This area is one that has captured much of the attention of the BPG in thepast five years. A variety of projects have addressed issues associated with thepotential of future communications services to substitute, supplement, or inter-act in some way with the transportation sector. In total, these activities add Upto a multi-faceted TA of the various social, political, environmental, energy, be-havioral, and corporate impacts of the interaction of travel and communications.The Group has never collected all of these studies into one big report and calledit a TA. However, we feel that both the spirit, techniques, and scope of the re-search justify its inclusion in a review of our TA activities, The work in thisarea has been concentrated in a number of projects. The key areas are outlinedbelow:
.4 continuing assessment of the technologies that are the driving forces in thetelecommunications fields. These will not be discussed here but are summarizedbriefly in Appendix 2.
A detailed behavioral evaluation of the individual traveller’s perception oftravel and communications and his or her attitude towards the substitution ofcertain types of travel with telecommunications alternatives.
An examination of the energy implications of travel-communicationssubstitution.
A review of the policy implications of substitution across a wide spectrum ofactivities.
Participation with SRI’s recent National Science Foundation (NSF) spon-sored TA of Travel—Communications Substitution.
The BPG has never attempted to replicate or “Canadianize” related researchin other relevant countries and fields. The approach has been to build on andexpand from the base of available research. Hence, in the narrative that follows,references will be made to the work of others were it is important to the under-standing of our TA activities in the substitution field. It should also be notedthat the discussion below should only be considered a superficial introductionto a research area that is becoming one of the most popular in the telecommu-nications impacts field.
The focus on substitution is significant since it emphasizes one of the impactsthat will develop from the uses of communications systems in both current andprojected forms of social interaction. This is a shift from earlier researchthat examined various communications systems such as audio or visual tele-conferencing and postulated that one of the uses of a particular system mightbe some impact on travel activities. The substitution research is not tied toany single communications system, present or projected, but is focused on thepotential impacts that will develop from the uses of a wide range of com-munications systems. Research starting from the direction of impacts ratherthan particular technologies is almost certain to have more widespread appli-cability across various societal sectors, and in some cases, between societiesthemselves. The material in this paper is designed to illustrate some of thetypes of impacts that future travel—communications substitution may havein the next decade.
The potential of future communications-based systems to stimulate someform of substitution for “travel is a frequent subject of discussions of the futureenvironment. Most forecasts seem to lie at each end of a spectrum of possibleanalyses. At one end there are broad generalized scenarios optimistically pos-tulating many forms of substitution of local and intercity travel through theuse of a host of computer-communications services. The links between todayand the future are not usually detailed and we are left with considerableuncertainty as to how this future communications-based society evolved. Theeconomic, social, and political benefits or potential negative impacts of thissubstitution process are also not examined in any detail. At the other extremethere are very specific studies of how specific technologies may augment thesubstitution process for individuals working at certain institutions with definedtravel patterns. Between these two poles there is a considerable knowledge andresearch gap, Several projects underway at Bell Canada and in other institu-tions are designed to help till this knowledge gap. While many of the activitiesdescribed here are Canadian or American, the author recognizes that parallelactivities are also underway in Europe and Japan.

——
319
The question of substitution may be regarded as generic in the case of amacro-analysis. However, our futures research and that of others has indicatedthat the subject should be examined on two levels of substitution: inter-urbanand intra-urban. inter-urban substitution refers to the process of replacingcertain types of intercity travel with communications and computer-basedservices. This travel is usually that of businessmen, government, officials, oreducators for defined occupational purposes. Intra-urban substitution refers tothe process of replacing a wide variety of activities within an urban area witha large number of electronic services. These forecasts usually include replacingdaily commuting to work with “electronic offices” in the home or in neighbor-hood work centers. Electronic education, security, banking, shopping, voting,and consumer information retrieval services are also envisioned within theurban area in order to reduce the need to travel for many routine nativities.Much of the research and speculation in this area is found in the “wired city” orinteractive broadband systems literature.
The term, substitution, is used here as a shorthand expression that refers tovery complex, mostly unknown (to date), relationships between the transporta-tion and communications sectors of our society. This relationship is not new, ofcourse, as these two sectors have been intertwined in a maze of relationships sincethe development of postal, telegraph, and telephone services. Research on theimpacts of these old communications services upon personal travel has been ex-tremely limited to date. The simultaneous rapid growth in the use of moderncommunications and transportations systems during the last few decades inNorth America has masked the development of interrelationships between thesetwo sectors. Studies have indicated that those who travel a great deal also usecommunications systems frequently. Thus, existing communications and trans-portation systems appear to be mutually reinforcing. However, many argue thatthe rapid proliferation of new communications technologies when combined withthe current crises, congestion, and negative side-effects of many transportationssystems, will lead to a new era of substitution.
The phrase substitution processes should not be interpreted too narrowly interms of face-to-face personal contacts. While certain existing face-to-face con-tacts may be replaced in the future with new technologies, new forms of com-munications systems may create the ability to undertake activities that are im-possible today with face-to-face contacts or existing technologies. Thus, substi-tution processes may, in fact, serve latent needs that have not been served up tonow.
SUBSTITUTION : W ILL IT HAPPEN?
An adequate analysis of the intercity substitution question must examine thefundamental reasons why people travel. There are obvious stated occupationalreasons for many travel activities, However, there are a host of unstated socialand personal factors at work when travel decisions are being made. An under-standing of the travel-communications substitution issue requires research intothese behavioral factors that would also underlie any future decisions on substi-tution. The other key variable involved in determining whether or not substitu-tion will occur in the future is the financial cost-benefit trade-offs that must bedetermined between the costs of travel and the proposed communications substi-tute. This section of the paper considers both these variables on an inter-urbanand intra-urban basis.
INTER-URBAN SUBSTITUTION
BEHAVIORAL ANALYSIS
The BPG has undertaken an analysis of these issues. This survey research wasconcerned with business travel in Canada between the cities of Montreal, Toronto,Ottawa, and Quebec City. Business travelers between these cities utilizing air,rail, auto, or bus modes of transportation were given a questionnaire to obtain thetypes of information shown below:
(a) Basic trip statistics;(b) Purpose(s) of meeting(s) ;(c) Information carried to or acquired at meetings;(d) Reasons for not substituting existing communications media for this
trip;(e) Indirect personal activities associated with the business trip;(f) An assessment of the most satisfactory and unsatisfactory aspects of
the current trip;

——— —. ——.—— — ———.—
320
(g) The Potential of various future communications capabilities to replacethe type of trip the traveller is on currently; and
(h) Organizational, personal, and statistical data on the individualrespondents.
The questionnaire was given to 30,000 business travelers during October 1978.Approximately 9000 usable replies were received, These permitted detailed sub-analysis of the substitution question by mode of transportation, particular inter-city corridor, organizational characteristics of the traveller’s employer, execu-tive level, ethnic group, and potential substitute capabilities. The response tothe survey was a much higher level of returns than expected. This in itself mayindicate that interest in the substitution question is becoming widespread amongtravelers.
The data from the survey was shared with the participating common carriersand government agencies. This information will also be traded with individualsand groups who are working on similar or related issues in outside futures re-search groups. The survey tested a series of hypotheses that were grouped intofive categories: the communications situation; trip characteristics; idiosyn-cratic variables; role of the traveller: and telecommunications capabilities of thealternatives. The hypotheses were developed after an extensive search of theliterature and research into communications behavior patterns. In many cases,the hypothesis were developed by other researchers after smaller surveys ofsub-groups of travelers or through laboratory experiments with various testgroups, The questionnaire was designed with the assistance of a consultingbehavioral scientist in order to assure that the responses would help the BPGobtain useful data on the various hypotheses.
TEE HYPOTHESES WERE:
COMMUNICATIONS SITUATION
(u) There are situational and behavioral variables associated with the par-ticular form of communication that is to take place which predispose individualsto meet fact-to-face by traveling rather than to communicate over or throughan artificial medium.
(b) As the complexity of the communication task increases, the greater Isthe perceived felt need for travel. Such predispositions occur at a significant levelin bargaining, conflict resolution, and authority relation situations.
(c) Personal familiarity is negatively related to the propensity to substitutein situations that require (or are perceived by the actors to require) buildingor maintaining friendly relations, persuasion, assessments of others’ reactions.or security.
(d) Routinized interaction activities have a lower trip threshold and a greaterpropensity for substitution than more complex non-routine interactions.
(e) The propensity to substitute varies according to the purpose of the trip.(f) The propensity to substitute telecommunications for travel increases after
a certain threshold of trip making is reached: the threshold varies dependingupon the purpose of the interaction.
TRAVEL
(a) Trips that involve the personal transportation of materials, or for havingmaterial or equipment serviced or handled are negatively associated with thepropensity to substitute.
(b) There is a positive relationship between the duration or number of activi-ties engaged in on the business trip and the propensity to substitute.
(c) There is a negative relationship between the number of non-business activi-ties associated with the business trip and the propensity to substitute,
IDIOSYNCRATIC
(a) There is a negative relationship between how business travelers feel abouttheir general travel activities and the propensity to substitute.
BOLE
(a) There is a negative relationship between an individual’s position in thebusiness hierarchy and the propensity to substitute.

321
Telecommunications CAPABILITIES
(a) There is a positive relationship between the traveller’s perception of theutility of telecommunication alternatives to business travel, and the propensityto substitute.
An overview analysis of the survey results indicate several interesting findings.Presentation of these comments should be prefaced with the reminder that thesequestionnaires were distributed before the Arab-Israeli war and its subsequentimpact on energy supplies, travel convenience, and public consciousness regard-ing the negative societal implications of transportation systems. The overall re-sults of the sample indicated that 20% of the business travelers would have sub-stituted the existing trip they were on, if appropriate communications substituteshad been available. This finding is not offered at this time as an indicator of theoverall average potential for substitution but it appears to be a representativelook at the short trip, commuter travel often experienced on the travel corridorsstudied.
Factors that do not appear to influence the substitution decision include:The travel corridor;The mode of travel;Whether going out on a trip or returning from one;The number of associates with whom the businessman is traveling; andThe number of positive aspects perceived in the current trip.
The factors that do influence the substitution decision significantly include:Those having shorter trips want to substitute more;Those having fewer activities per trip want to substitute more;Those who perceive more negative aspects of travel want to substitute
more; andThose engaging in more non-business activities per trip want to substitute
less.While the survey results revealed the above trends or tendencies, the correla-
tions were generally much weaker than would have been expected, considering thefact that the original hypotheses were based mainly on earlier research. Thestrongest correlation was found with the telecommunications variables. Thoserespondents who perceived electronic alternatives favorably were more inclinedto want to substitute future travel than those who felt that electronic telecom-munications was too impersonal. The survey results also indicated that individ-uals from different types of organizations do differ in their propensity to sub-stitute. Representatives from educational institutions were the most likely tosubstitute while representatives of non-technical manufacturing, finance, andinsurance-related industries were the least likely to substitute. However, all ofthese results were representatives of tendencies rather than clearly defined pro-files of non-substituters versus substitutes.
An overview of some of the results of the Bell survey took these factors intoaccount when it concluded: “While 20 percent of the travelers surveyed indi-cated that they would substitute their current trip, the present study offers littlesupport for hypotheses concerning replacement of travel by telecommunications.For the most part, the directions of the relationships postulated stand up butthe weakness of the correlation coefficients indicate that the variables are oflittle consequence in distinguishing explanatory differences between those whowould and those who would not replace their present trip. The lack of explana-tory results suggests that the decision to substitute may be an idiosyncratic onewhich the variables included in this study did not tap.” 8
Thus, we have determined that there is a significant proportion of the businesstraveling public that would like to substitute certain travel activities with tele-communications but we have not identified a homogeneous model of the “typical”substitute.
COST-BENEFIT ANALYSIS
This form of behavioral research helps determine if people are willing to sub-stitute in a “free-decision” environment. Often this is not a relevant factor ingovernmental, business, and educational institutions. Telecommunications sys-tems that meet cost-benefit criteria definitely are most easily acceptable to
s James H. Kollen and John Garwood, “The Replacement of Travel By Telecommunica-tions”. 18th International Congress of Applied Psychology, Montreal, Quebec, July 30, 1974,pp. 26-7.

— —. .
322
managers. Various studies have shown that audio and augmented audio telecon-ferencing systems usually turn out to be cheaper than travel for defined trip pat-terns. The reverse is almost always true for video based systems. All of thesecalculations involve an assumption of the cost of the time of the traveller (ie.it costs “x” dollars per hour for an employee whether he is traveling or in theoffice; hence, travel time saved equals dollars saved). The problem with theseforms of calculations is that the institution has to spend more money in tele-communications systems in order to optimize the existing expenditures in salarycharges. Illogical or not, many managers would rather have employees under-utilized rather than spend more money to optimize a “sunk” cost, namely salary.If this attitude can be overcome then many non-video teleconferencing systemscan result in net savings for the using organization.
One operational instance of detailed cost-benefit analysis is the experience ofNational Aeronautics and Space Administration (NASA) during the Apollo pro-gram. A series of teleconference networks were created, ranging from audioteleconferencing through to high speed facsimile (50 kilobits per second). Thesenetworks were used to replace certain types of travel during the course of the pro-gram. A series of analyses using various assumption patterns, indicated that theuse of the networks saved from $1.4 to $4.1 million per year. An examination oftravel costs before and after the introduction of the teleconferencing systems in-dicated that the average travel cost per professional assigned to the Apollo pro-gram dropped from $860 per year to $650 per year. These latter figures ignore thecosts of time spent in travel whereas the earlier calculations assume an allo-cated cost of salary against travel. The study also noted that the use of telecon-ferencing resulted in many informal contacts and faster decisionmaking thancould occur if travel had been the main form of long-haul interaction betweenthe various groups involved? No attempts have yet been made to try and quantifythese types of factors in a cost-benefit analysis. However, it is interesting to notethat a rigorous application of cost-benefit analysis in the major institutionalenvironment can result in considerable substitution of travel through the use oftelecommunications.
INTRA-URBAN SUBSTITUTION
BEHAVIORAL ANALYSIS
The question of intra-urban substitution involves a different group of travel-lers and different behavioral issues. The type of substitution that is often dis-cussed here involves the use of various “wired city” services. The area mostanalogous to the material reviewed above is “telecommuting”. One of mostextensive examination in this field is a recent study at the University of South-ern California (USC).
The USC study examined two types of telecommuting in some detail. Onepart of the research was an examination of the attitudes of the user populationsof interactive television systems used at USC and Stanford University. Thesesystems were designed mainly to serve working adults who are studyingtowards advanced degrees. The alternative to physically attending the coursesis to use the interactive TV system. Briefly, these systems are as follows:
The USC IITV [Interactive Instructional Television System], establishedin 1972, is designed primarily to serve professionals in engineering, aerospace,and information sciences who wish to take graduate level courses. Thesestudents are generally in mid-career and usually are employed fulltime by in-dustries located from 10 to 30 miles from campus. Before installation of theIITV systems, these students commuted to the USC campus either in the eve-ning or on a released-time basis during the day.
The IITV system transmits live lectures to ten regional centers from thestudio at USC. Eight of these centers are located at major companies in theLos Angeles metropolitan area; two sites service clusters of companies. Regularacademic courses are offered, both credit and noncredit, graduate and under-graduate. Since the program started, and average of 40 courses per semesterhave been offered by USC over the IITV network. The system includes talkbackcapability provided by FM radio transmitters at the remote sites. A dailycourier service delivers and picks up homework, exams and other class work.’*
o Samuel W. Fordyce “NASA J9xperience in Y?elecommtmlcatlons as a Subetltute forTransportation’ “, NASA Memo, A rll 1974.
l,~a.k M. Nines, Frederic R. &lson, Paul GraY, Gerbaril Hanneman, TeMcomrnunk.-;\o;i2Transportatlon Tradeoffs, University of Southern California, December 1974, PP.

323
The users of these systems pay the regular course charges plus surcharges forthe right to telecommute. The corporations pay for the costs of the televisionclassrooms. The USC study team felt that these two systems represented realcases of travel-communications substitution and conducted surveys to determinethe users attitudes towards the substitution. The following four conclusionswere drawn from the study.
“(l) Instructional television as a telecommunications substitute for trans-portation, offers the IITV user a substantial savings in time and travel. Thedirector of the IITV system at USC, Dr. Jack Munushian, estimated that in the1974-1975 academic year, the USC IITV system would save 250,000 commutermiles.
(2) One of the major motivations for participation, is a willingness on thepart of the participant to complete or expand his or her educational training;given this motivation, the convenience and ease of the IITV system play amajor part in the decision to participate. A corollary to this conclusion is thatIITV students tend to feel that the availability of the system resulted in theirtaking a more aggressive attitude toward continuing their education.
(3) Users of an IITV system show greater affinity over time, indicating thatfamiliarity with the system can favorably affect attitudes toward the system.
(4) Over 60 percent of the participants perceived IITV as being as effectiveas in-classroom educations (with Standford students showing a slight decreasein this assessment over time; comparison of grades and performance ratingsby the instructors indicated essentially identical academic achievement forparticipants in the two modes (IITV and in-classroom). This response indi-cated that no appreciable (or at least quantifiable) loss in effectiveness wasoccurring as a result of using the IITV system.” 11
is allocated salary-time for institutional travelers or valued personal time forurban commuters. This leads to the conclusion that more than personal atti-tudes and accrued cost-savings to individuals and institutions will be requiredto lead to significant new levels of substitution in the shorter term. The energyissue is one example of an external force that will very likely cause a muchcloser examination of the substitution question than if it was left to free-willand normal market forces,
The USC study went on to examine the telecommuting question in the busi-ness environment. The Western regional office of a major national insurancecompany was examined in detail as a potential candidate for decentralizationthrough the use of remote work centers and telecommunications support sys-tems. This company had a central downtown location in Los Angeles and wasexamining various forms of decentralization, mainly as a result of high laborturnover at the clerical level. The corporate goal was to tap into new labormarkets in the suburbs as well as eliminate the perceived disadvantages oflong commute patterns for employees in those areas. Thus, this was a casewhere clerical rather than management or professional workers were regardedas a target for dispersion through the use of telecommunications. The USCteam felt that this was a good case example as the company was one in the“information industry” where the substitution possibilities are expected toemerge first in the future.
The USC study determined that 15 remote work-centers connected with acomputer and communications network would enable the insurance companyto conduct its business on a dispersed basis. It went on to conduct a detailedcost-benefit analysis for both the company and the employees. The companysaved costs in staff turnover and training, through reduced staff, lower salariesfor clerical employees (a premium had to be paid to attract staff in the centrallocation ), elimination of a free lunch program, and income obtained fromleasing the old headquarters site. Increased costs associated from the pro-posed system were in new building charges in the remote work centers, com-
f’puter and communications costs, administrative and travel charges, and theloss of a special tax benefit given to insurance companies with one central office.The net savings to the company based on two different system configurations
11 Ibid.. pp. 116--7.

324
were $4.1–$4.2 million annually. Thus, there were distinct cost incentives forthe company to adopt the electronic work-center concept.
The cost-benefit calculation for the employees is not so straightforward. Theylose monetary benefits in the form of the free lunches and salary premiums paidfor working downtown. The cost savings for the employee revolve around savedtravel-time and saved travel-costs. The USC calculations showed that any em-ployee commuting more than seven miles per trip would save money. Since theaverage employee trip is 10.7 miles per trip, the average employee will save.However, ignoring problems of the “non-average” employee, one key assumptionis that the employee values his time on a monetary basis. Time saved must beequated to dollars saved or the employee would result in a net dollar loss. Thisis not an area of certainty, especially with clerical employees versus profes-sional employees such as those studied in the IITV survey. Generally, we canassume that an educational task would be required to induce old employees towant to try out this system. New employees in the suburbs would not presentthe same problem, and in fact the insurance company has operated non-electronicsuburban work-centers for some time with a lower salary for clerical staff. Thisis certainly an area that will only be settled through the actual electronic de-centralization of an existing operation.
ENERGY AND ENVIRONMENTAL ISSUES
INTRODUCTION
There are a host of environmental and energy issues related to travel andtransportation systems. These have become increasingly important in public andprivate policy determination in the past decade. One forecast is that these factorsmay lead governments to promote or encourage communicating rather thantraveling in the future. This could he through a wide variety of administrativemechanisms, including ones that may alter the economic cost-benefit ratio infavor of communications alternatives.
The environmental costs associated with transportation systems have becomeidentified in considerable detail in the past decade. Current research is expand-ing information on these issues at a rapid pace. The environmental considera-tions associated with communications systems are virtually unknown, althoughrecent interest has been expressed on the subject. Analysis that has been under-taken to date, leads us to believe that these costs are far lower on a per capitauser basis than those for transportation systems.
Any comprehensive analysis of the environmental costs associated with traveland communications systems must go beyond an examination of operationalcosts of visible structures. The costs of construction of the physical plant re-quired to provide these services should also be included. The environmental costsassociated with maintaining the required infrastructures are required as well.
The phrase, environmental costs, has been used to refer to a wide variety ofissues. The list be;pw is not exclusive, but it gives an indication of the types ofenvironmental costs that are associated with the use of transportation and com-munications systems. These factors will have to be added to the economic andbehavioral ones in order to provide an adequate analysis of the overall questionof inter-urban and intra-urban substitution.
(a) Energy consumption of transportation or communications systems (in-creasingly important with the North American and European energy crisis).
(b) Energy consumption required to construct. operate, and maintain themanufacturing plant, and industry infrastructures for both sectors.
(c) Resource consumption for construction, operation. and maintenance ofthe required infrastructures.
(d) Pollution factors associated with the two industries. e.g. air, water, radia-tion, noise, thermal, and visual pollution.
(e) Damage to ecological systems.
ENERGY IMPACTS OF TRAVEL-COMMUNICATIONS SUBSTITUTION
As noted above, the energy implications of transportation systems are rela-tively well-known, The BPG analysis of the Canadian situation follows. Itshould be noted that a similar picture is found in the United States and muchof the analysis would likely apply there as well.
The basic findings of our research indicate that the transportation sector ofthe economy accounts for 24 percent of the total energy consumed in Canada.

325
The passenger sector accounts for 60 percent of that energy consumption.Over 90 percent of all Canadian passenger-miles are accounted for by motor ve-hicle and air transport. Both of these forms of transportation are very energyinefficient. The importance of examining the business sector of passenger travel,as in the business planning survey, is shown by the fact that 25 percent of allpassenger travel is for business purposes (60 percent of all air travel is forbusiness reasons). The influence of the transportation sector on total nationalenergy consumption levels indicates the possibilities for energy conservationthrough reduction of some forms of travel by communications substitution.
MACRO TRADE-OFFS
The task ahead is to identify the energy impacts of communications systemsuse. Research interest in this area has been growing rapidly. The energy crisishas led to many comments in the general and specialized press on the potentialfor some form of energy conservation through travel-communications substitu-tion. Peter Goldmark, former President of CBS (Columbia Broadcasting Sys-tem) labs, recently stated that if we “eliminated commuting over 10 miles, Ihave calculated that we could save half our current consumption of gasolinewhile generating only negligible amounts of pollution. ” 12 He also goes on to arguethat creating a “new rural society” (use of the technologies described above toreduce business travel and commuting to work) would reduce the need forexpanding large cities and would also reduce the energy required to supporttheir centralized infrastructures-air conditioning, heating, lighting, elevators,etc. Goldmark’s calculations, and those of all of the research in this fieldcurrently, are rough but they indicate the order of magnitude of the potentialsavings.
MICRO TRADE-OFFS
These overview calculations give a perceived perspective of the global implica-tions of large scale travel-communications substitution. Several studies havetried to examine this from the opposite perspective; the impact of substitutionfor specific trips using defined technologies. Similar research has been conductedby the BPG and by the Communications Studies Group (CSG) of UniversityCollege London and the London School of Economics in conjunction with theirwork with the U.K. post office.
The approach is to calculate the energy consumed in particular journeysusing various forms of transportation. This requires estimates of the number ofpeople traveling to a meeting which is a key variable for the transportation-energy consumption calculations. One of the difficulties in this form of estimate isthat the number of people at one location for a teleconference is not a cost orenergy consumption variable. The incremental cost of adding people on to anaudio or video teleconference is virtually zero. Hence more people can attend ateleconference cheaper than in person. On the other hand, the length of a meet-ing without a reasonable period (one day) is a key variable for the energyconsumption of telecommunications alternatives, and a fixed cost item for trans-portation systems. Another key variable in the telecommunications side of theequation is an assumption on the source of electricity for operation of the system,Electricity derived from hydro dams has a much more efficient conversion ratio(85 percent) between primary and secondary energy (the ratio of the raw energyavailable at the source compared to the energy actually obtained for end usage)then say coal-oil (35 percent, ) or nuclear (30 percent) sources. This is particu-larly important in the Canadian situation since some provinces are highly de-pendant on coal-oil and nuclear sources (Ontario) while others have large sup-plies of hydro power (Quebec).
The result of these types of calculators result in trade-off curves for variouscity pairs using defined transportation and telecommunications systems. Fig-ures 3 and 4 illustrate the results of the BPG and CSG work respectively. Thisform of micro-analysis can be built back up to national estimates of macro-savings. The two groups have found in independent studies for Canada andthe U.K., that approximately 2 percent of national energy consumption couldbe saved through the reduction of a moderate amount of business intercitytravel. This does not include infrastructure savings or the reduction of intra-urban transportation. Details of the analyses by both Groups can be found inthe referenced studies,
12 pet~r C. (Mdmark. “A RuraI Approach to Saving Energy : Technology Could HelpEase Llrban Congestion”, New York Times, NOV. 12, 1973, p. 12.

326
w
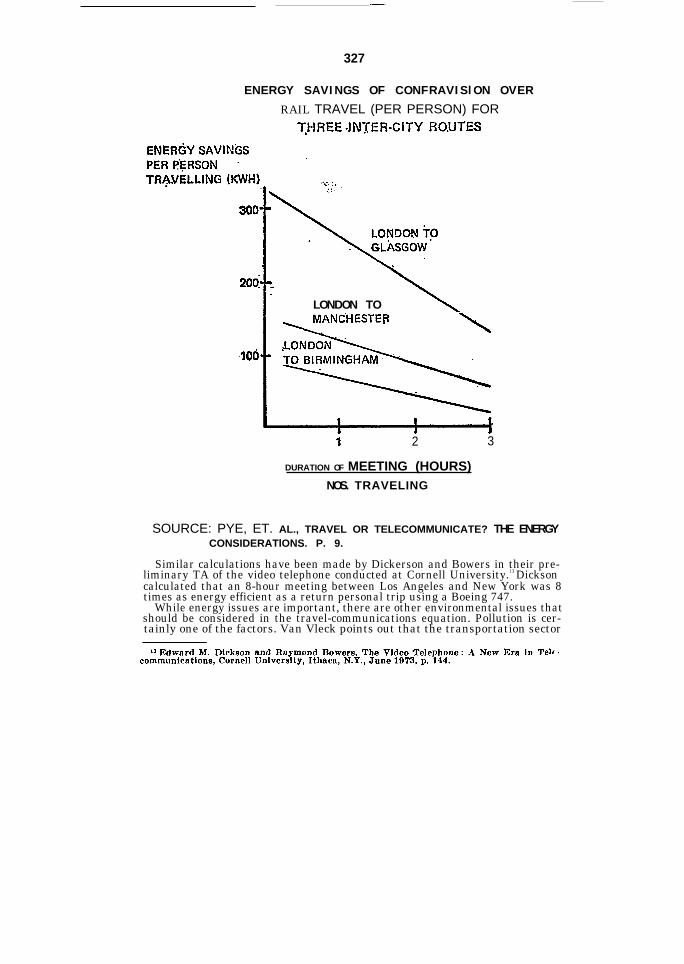
—.— .-
327
E N E R G Y S A V I N G S O F C O N F R A V I S l O N O V E R
RAIL TRAVEL (PER PERSON) FOR
,
LONDON TO
1 2 3
DURATION OF MEETING (HOURS)NOS. TRAVELING
SOURCE: PYE, ET. AL., TRAVEL OR TELECOMMUNICATE? THE ENERGYCONSIDERATlONS. P. 9.
Similar calculations have been made by Dickerson and Bowers in their pre-liminary TA of the video telephone conducted at Cornell University.13 Dicksoncalculated that an 8-hour meeting between Los Angeles and New York was 8times as energy efficient as a return personal trip using a Boeing 747.
While energy issues are important, there are other environmental issues thatshould be considered in the travel-communications equation. Pollution is cer-tainly one of the factors. Van Vleck points out that the transportation sector
328
produces 75 percent of the carbon monoxide. 56 percent of the hydrocarbons,and 52 percent of the nitrogen oxide pollutants. 14These side-effects of travelmust be shared by all in our society, not only those who travel.
The question of resource consumption has also become more widely under-stood as planners and decision makers become more aware that we have afinite stock of ‘non-renewable resources and that the demand is outstripping thereplacement of renewable resources. The transportation sector is an importantconsumer of many of these resource elements. Recycling will have to becomemore prevalent in the transportation industry in order to preserve materialresources. Substitution is another means of conserving resource depletion, Again,we do not yet have material consumption patterns available for telecommuni-cations, but we do have some idea of the facts for the transportation sector. TheU.S. transportation industry consumes 75 percent of the nation’s rubber, 53percent of its lead, 40 percent of its zinc, 29 percent of its steel, and 19 percentof its copper.15 Further research is required to determine the communicationsindustry’s consumption patterns and the elasticity of the material trade-offsbetween the transportation and telecommunications industries.
The energy, pollution, and material elements of the substitution equation arecertainly incomplete at this time. We can obtain an idea of the relative impactof various trade-offs through the preparation of scenarios assuming levels ofsubstitution. This is only one step towards a greater understanding of this issue.However, it is certainly a move away from merely assuming that these trade-offswill favor the communications half of the substitution issue.
S OCIAL AND P OLICY IS S U E S
The material reviewed to date has revealed that the substitution issue hasmany dimensions. This last brief section overviews some of the other questionsand issues that will have to be examined in any comprehensive examination oftravel-communications substitution.
POTENTIAL NEGATIVE IMPACTS
No development is without its negative drawbacks. Those of us examiningthe substitution question may tend to overlook some of these potential problems.Several of these are listed below.
PRIVACY
The adoption of substitution as a significant conscious choice in many sectorsof society will bring us face-to-face with many of the privacy and security issuesthat have been troubling many observers for the past decade. Dependence oncomputer and communications services for so much of our social interaction iscertain to bring about periodic lapses in personal and institutional privacy.These issues have been discussed extensively elsewhere and this paper will go nofurther than to indicate that they certainly have relevance to the substitutionissue.
LOSS OF INTERPERSONAL INTERACTIONMany social scientists and thoughtful observers have pointed out that work
activities have a very high level of social interaction content, People need tointeract with people on a purely social level and work settings create the abilityfor this to happen. Reduction of intercity travel may cut back the range of inter-personal experiences that individuals have access to during their travel. Reduc-tion of commuting patterns through the use of remote work-centers or home work-centers would also have a severe impact on interperson interaction. If remotework-centers were common public utilities rather than dedicated to specific in-stitutions (a likely scenario in order to reduce the cost overhead of these in-stitutions ) then the interpersonal bonds that develop may be based upon friend-ships of people who happen to use the same work-centered rather than work forthe same employer. This could have significant impact on job mobility patternsand employee loyalty. These social factors lead this author to forecast thatremote work-centers will only be used two or three days a week with the otherweekdays being used to go into the central business district for meetings andsocial contacts with other people in the institution.
——
329
DISRUPTION OF HOME LIFE
The above forecast is strengthened when the potential disruptions of home lifeare considered. Having the working husband and perhaps working wife, pluschildren, pets, etc., in the same environment continuously would likely bemore of a strain than most people could survive. Working at home occurs nowwith the use of portable terminals, and its popularity will climb rapidly in thenext decade. However, the home life problems will limit this to being a sporadicactivity rather than a regular occurrence. The remote work-center is the morelikely means of reducing the tensions that would follow a permanent shift fromthe office to the home.
SECTOR UNEMPLOYMENT
Gradual substitution is the most likely scenario for the future. However, ifsignificant shifts occur in institutional or individual attitudes, energy availabil-ity, environmental awareness, or the cost-bene!it trade-offs between travel andtelecommunications then we could expect to see rises in the unemployment levelsin the transportation sector. This is not a minor factor. The transportation unionsare some of the strongest in North America and have a long history of righting(successfully ) technological or policy advances that they perceive as having anegative impact on their members. The telecommunications industry is far moreautomated than the transportation industry, and a corresponding growth inemployment in the former field would not likely follow cutbacks or reduce growthin transportation. The transportation industry also has a successful history oflobbying with the political sector of our society and we might expect to see at-tempts to make substitution a political issue if the industry began to see it as asignificant threat to present or future business growth.
DISRUPTION POTENTIAL
Just as significant reliance on telecommunications creates a privacy problem,it also raises potential dangers of massive failure, sabotage, strike shut-downs,and breakdowns due to natural disasters. Systems will have to be designed in afashion similar to the existing telephone network. This means considerableredundancy, distributed intelligence, human back-up and control override capa-bilities, and rapid recovery ability. There must also be the capability to eliminatethe cascading disaster possibility that has caused major problems in the elec-trical industry. The potential dangers here certainly weigh heavily against avery centralized system.
ACCESS RIGHTSThe question of who will be allowed or will be able to afford access to the
technology that can make substitution possible has troubled many observers.The phrase “information rich and information poor” has come to symbolize thisconcern. It can be argued that substitution, especially for local transportation,will only result in the creation of further ghettos. The poor will be even morecut-off from the affluent who will be able to work in electronic isolation. If theurban substitution process was carried to its ultimate conclusion, large citieswould have their economic structures cut out from underneath them. The com-muters would cease to be a source of tax revenue and hence cut out a significantslice of city revenues. On the other hand, many clerical and support jobs mightmove to the electronic work centers where the poor could not afford to commute,thus creating employment dislocations. The support industries of the city(restaurants. shops. service trades, etc. ) would lose significant markets. Thisnegative scenario postulates a drop in the revenue base of the city alongwith a great increase in the need for social support systems as the underprivi-leged see their employment opportunities shrink. The scenario is quite likelyto never occur. As noted above, there are many social and other reasons toexpect employees to want to go to the central offices several days a week. Inaddition, we could expect to see government and business lenders take positiveactions to avoid most of the severe impacts postulated above before eventsgot out of hand. Nevertheless, the question of access to substitution systemsand the social-political impact that would develop from their widespread usemust not be treated lightly as travel-communications research and policies aredeveloped.

-— — —
330There are certainly other potential negative implications of travel-communi-
cations substitution. This short list is merely presented to indicate the rangeof possibilities and the agenda for future substitution research.
POLICY QUESTIONS
The whole topic of substitution also raises a series of policy questions thathave only been alluded to up to this point. Several of these issues are reviewedbelow.
ENERGY POLICIES
Long- and short-term energy supply issues, compounded with the resourceand pollution questions, may lead governments to regard substitution as apartial solution to these problems. If this occurs, governments are going tomove from a passive interest in the potential of substitution in a few telecom-munications oriented agencies and departments, to an active interest at thehighest policy levels. One of the questions that will arise immediately is thequestion of relative subsidies between the industries.
SUBSIDY POLICIES
The transportation sector of the economy has traditionally been directly andindirectly (e.g. government-financed research) subsidized. Ship, rail, auto, andair transport have been heavily subsidized for capital (e.g. land grants), opera-ting costs or losses (e.g. on non-profitable routes where it is socially desirableto maintain service), and in infrastructure investment (e.g. airports, highways,etc. ). On the other hand, the telecommunications field has been less heavilysubsidized and more regulated than the transportation field. This historicaltrend has occurred for a number of reasons:" communications deals intimately with fundamental information free-doms, the right to privacy, etc. Thus the government has restricted itselfto primarily regulatory and policy-making roles in this area. Another possiblereason is that electrical communications has been, for the most part, highlyprofitable to the private sector from the beginning, when it has not been, as intelegraphy in late years, and to some extent in UHF television, the regulatoryagencies have acted strongly to support these media to the extent that regulatoryactions can help.” 16
The question of travel-communications substitution raises the subsidizationissue from a new perspective. If the social benefits of a substitution are stronglypositive, then existing patterns of subsidy may be socially counterproductive.Either the transportation subsidies should be reduced or telecommunicationsalternatives to travel should be subsidized in some fashion. This whole questionis a likely target for a massive study in itself. The issues are much more com-plex than mentioned here. However, the subsidy issue will have to be examinedin both government and private industry before the substitution puzzle can becompleted. These studies will probably lead to further questions on the processof regulation itself.
REGULATION
The question of regulation of the transportation and telecommunications indus-tries flows from some of the above considerations. A substitution policy cannotbe formed within a single government regulatory body. Telecommunications andtransportation are regulated in Canada and the U.S. by many different agenciesor branches of large regulatory agencies. A substitution policy cuts across themandate of these various groups and frictions can be expected if substitution be-comes an important policy issue. Of course, it may not become an important issuefor the traditional transportation and telecommunications regulatory bodiessince it may be regarded as lying in a no-man’s land between them. However, alikely scenario would be for a new organization, such as an energy or an envi-ronmental agency to provide the substitution focus that would then bring aboutinterest from all of the parties. It seems likely that we could not expect to seerapid solutions to some of the regulatory issues until this institutional processsorts itself out.
l@ Ibid., p. 9.

331
INTERIM APPROACHES TO
The term, interim, is used to indicate that government actions are still possible,and probably required during the regulatory shakedown period postulated above.Policies can be refined much easier when there are more hard data and informa-tion available that demonstrate the existence of viable technological, economic,and socially acceptable patterns of travel-communications substitutions. Thesedata will only emerge through a continuation of the type of research referred toabove, only in much greater depth than to date. Research into all of the aspectsof substitution discussed in this paper is certainly needed. Government agenciesfrom both the transportation and telecommunications sectors, as well as in thirdparty agencies (e.g. energy) should conduct and sponsor research and experi-mentation into substitution. The results of this research will certainly indicatewhether or not the policy issues are important enough to risk the bureaucraticupheaval that some of the above policy shifts would generate.
CONTINUING RESEARCH
The material reviewed in the foregoing section on social and policy questionsraised a number of important unanswered questions. In the introductory sectionit was noted that the substitution issue has been a subject of considerable inter-est for the BPG for the past 5 years. This interest continues and current activi-ties are centered on some of the issues explored above.
The joint study with the Stanford Research Institute (SRI), the BusinessPlanning Group (BPG), and the Communications Studies Group (CSG) of Lon-don is designed to answer many of these questions, especially those associatedwith the intra-urban area. This study, which is approximately 80 percent com-plete at this date, is an extensive examination of about 60 areas and their policyimplications associated with intra-urban substitution under a variety of substi-tution scenarios. The BPG has filled in some of the gaps with its research andwill participate in the data sharing with other members of the study team whohave pieces of the puzzle. Thus, involvement with this TA study is a part of theBPG activities associated with a long-term and continuing TA of the substitu-tion issue.
Another activity is a current project that is attempting to evaluate the keyissues associated with working from the home and other remote locations. Thisstudy is assembling all of the relevant data from a number of research areas(the SPRITE study, the SRI/BPG/CSG study, teleconferencing research, andthe BPG evaluation of the paperless office trial in the perspective Of workingfrom home. This study will identify the key positive and negative issues associ-ated with this aspect of substitution and will lead to corporate recommendationsand, perhaps, further research into important unanswered questions.
Finally, the extensive evaluation of the Paperless Office trial referred to abovein several places, is in itself a TA. The evaluation is being conducted with thecooperation of over a dozen U.S. government agencies and business firms andtheir users of NLS. This evaluation will result in the first detailed look at thewidescale experimental use of a multi-organizational computer system that per-mits working at home, electronic mail, joint authorship of documents from re-mote locations, office management tasks, data base construction, and text edit-ing-word processing.
A key part of this evaluation is the data being received from a detailed 28-pagequestionnaire that has been filled out by representatives from all the user groups(with the exception of the U.S. National Security Agency for obvious reasons).While sections of this questionnaire are oriented towards regular systems evalu-ation and human factors issues, significant data is being obtained which would beexpected in a TA activity, Some of the impacts explored in this area are:
On the flexibility of working hours;On the need to adapt to the system rather than vice-versa;On accessibility of work to others;On privacy;On individual’s professional images;On face-to-face communications versus computer-mediated interaction;On work styles;On the use of normal mail systems;On communications patterns with subordinates, peers, and superiors;
77-495 0- 77 - 21

332
On remote and working from the home; andOn managerial styles.
All of these continuing activities are a part of the longer term pattern of anon-going evaluation of the various primary and secondary impacts associatedwith the substitution issue. This process will be referenced in the final sectionof the report in which the impacts of TA for Bell Canada and industry and gov-ernment in general will be discussed.
I M P A C T S O N B E L L C A N A D A
INTRODUCTION : THE GENERAL IMPACT
This report has been oriented to this point to projects, past experiences, andspecific studies. In this section, a more subjective evaluation of the impact ofTA on Bell Canada will be undertaken. This evaluation should be placed in thecontext of our own evaluation of TA and its future.
TA has been an activity that, to date, has been associated with the conduct ofspecific studies that were of interest to various funding organizations. Moststudies have been funded by neutral agencies such as the U.S.-NSF that do nothave decisionmaking roles. Most government and business firms which havefunded or conducted TAs, have not touched upon especially controversial or keyareas of concern to the parties concerned. The studies have also not been di-rected toward helping resolve thorny decision questions of agencies-or firms.Many organizations have regarded their TAs as learning experiences with theprocess of assessment. These experiences have often been oriented towardlearning about the methodologies that can be used to conduct assessments andwhat their various strengths and weaknesses are. TAs have also been directedtoward broad question areas rather than very specific issues. All of the abovestatements are generalizations, of course, but they do serve as a very shorthandhistory of TA to date. As the studies in the previous section indicate, thesecomments also summarize the Bell Canada experience.
The above statement is not intended to minimize the importance or honest ef-fort that has been placed in the studies of Bell Canada and the other organiza-tions. Bell Canada is committed as an organization to understanding the socialimpacts of its decisionmaking process. In February 1975, Bell Canada, in associa-tion with Datacap Ltd. organized a conference on Technology Assessment andThe Limits to Growth. This conference was formally sponsored by the Ministryof State for Science and Technology and the International Society for Tech-nology Assessment. Over 300 individuals from business, government and academiaattended this Ottawa conference titled: Technology and Growth. J. C. Thackray,now President of Bell Canada, stated in his welcoming address to the conferees:
“There may be some of you who wonder why Bell Canada is so deeply in-volved in a conference of this nature. We’re the supplier of the communicationsservices that many of you use every day. Maybe at one time in the past that mayhave meant simply providing equipment. But not any more. For many years, wehave been concerned with the effects that our business can have on the totalenvironment, Not just the immediate and obvious effects, but the long term con-sequences, How do telecommunications affect the evolution of society?
It is our firm belief that technology must be the people’s servant, not theirmaster. In our research, our planning, and our on-going study of environmentalaffairs, our objective is to ensure that our services meet the needs of the publicand that the side-effects of our actions are in the public interest.” 17
This understanding of the importance of TA is a clear indication of the im-pact that the Bell Canada experience with TA has had. To a significant extent,the Bell Canada experience with TA has been an educational one. At the seniormanagement level, a significant measure of understanding the futurity andsocial impact of technology-based decisions has been gained. At the professionallevel, the business planners have gained a healthy understanding of the strengthsand weakness of TA and the methodologies associated with the process.
A significant part of! this understanding is that it is the process itself, not theparticular study that really counts. Important areas cannot be given the effortthey require in a single, normally short timeframe study, that attempts to answerthe important questions associated with the topic. The Bell Canada experiencewith travel communications substitutability, research indicates that a continu-ing research program into expanding areas of concern can identify a broad
17 J. C. ~ackr~y, Introdllction to ‘Conference, Technology and Growth proceedings,Business Planing Group, Bell Canada, June 1976.
——
333
range of impacts in considerable detail. The process of monitoring a field over aperiod of time helps identify the key impact areas. These can be given an in-depth examination rather than cursory treatment, in a study that tries toidentify all possible impacts in a time- and resource-limited environment. Toomany TAs end up becoming catalogs of impacts rather than the definitive docu-ments that their sponsors and assessors would like to see.
The above comments reflect an assumption on the process of decisionmaking inmany business and governmental organizations. Decisionmaking is often anincremental process. This can he, of course, very negative if environmental deci-sions are made that are regarded as minor but have long-term cumulative andharmful impacts. However, if TA processes parallel these incremental decision-making activities, combined with a good monitoring system, there is the poten-tial for a very powerful form of TA. The process of incremental TA in a busi-ness or government mission agency can lead to a more serious understanding ofthe secondary impacts of various decision streams than “single shot” studies thatattempt to do too much and end up accomplishing too little as a result of theirover comprehensiveness, and the normal difficulties of accurate long term fore-casting of any type, especially serially-ofiented forecasting. Thus, one of theimportant lessons learned in Bell Canada. is that an incremental approach toTA may be more important in business-oriented TA activities than large singleeffort studies that are oriented towards the relatively rare, one-time, major,irreversible decision. This is quite different from the type of decisions that aremade in the political environment leading to bills being passed that may havea long-term impact and where the legislature may not revisit the field with newlegislation for some time.
Another lesson learned with our TA and technological forecasting activities isthat experience, even of a limited nature. with the developments in questioncan be of considerable value when compared to large amounts of paper specula-tion, no matter how sophisticated the methodology or how knowledgeable orprestigious the individuals who input to the process. Thus, an incremental TAprocess can include the concept of field trials that generate experience withthe technologies in question. This type of experience is social impact-oriented asopposed to merely gathering market or technical trial data.
This experience and the concept of incremental TA with feedback from trialsand ongoing monitoring activities is being applied in a current case. This is alsoa case of considerable importance to Bell Canada and is not an item of mereacademic concern. The new service-technology is called “incasting” and it is anideal target for the type of treatment described above.
INCASTING : APPLYING THE EXPERIENCE
“Incasting” is a form of instantaneous electronic polling that can be con-ducted using the regular telephone network without any interruption to thenormal flow of telephone traffic. The prime motivation for this development hasbeen the desire of the Canadian Broadcasting industry to have a form of inter-active broadcasting with convenient and rapid feedback from the audience.With “incasting,” home respondents would have a small two-function votingdevice called a Votaphone. There are two types of Votaphones that would beavailable. The first would be universally avaiIable to any home requesting one.The second would be used in homes that are a part of a statistically-controlledrandom sampling of homes that could be used for scientific inferencing andextrapolation. The “incasting” operation has been described as follows:
“During the proposed 10-second period of an interactive broadcast. the homeaudience is able to vote or respond by means of a specifically installed item ofresidential equipment called a Votaphone. The Votaphone itself is an extremelysimple keyboard unit containing only two pushbuttons.
By voting in carefully prescribed sections of the lo-second response period,it is possible to vote in more than a simple binary yes-no format. For example,if the two pushbuttons are labelled + and —, they can he interpreted as mean-ing yes and no respectively in the interval 1 to 5 seconds, but be interpreted as,“Do not know,” and “Do not like the question, “ ‘if depressed in the interval 6to 10 seconds. Human factors studies show that the minimum sub-interval thatshould he considered useful is 2.5 seconds. This permits choice of up to 8 waysof casting the single vote during a 10-second voting period, since the vote canbe either positive or negative in one of four time-slots. ” 18
~s Peter Parkinson, “Inc~sting,” proceedings of the Second Subscriber Loops and &rv-lces Symposium, Imndon, T1.K., Mny 1976 .p. 97,

334
The clients who would use “incasting” would probably be in the broadcastingfield. They would purchase “incasting” time slots and integrate the questionsinto their broadcasts. The answers to the questions from the audiences (theuniversal or statistically inferential ones) would be delivered to the broadcastersin a matter of seconds. The users might fall into a number of categories. Publicaffairs broadcasting would take on a new dimension with instantaneous audi-ence feedback. Advertising could change in the same way. Government, publicinterest groups, politicians et cetera, might use it to gauge public interest onvarious topics. The possibilities become wide indeed once the concept is grasped.
The concept of electronic polling (as opposed to voting in the political sense)has been discussed in the “wired city” and interactive cable television literaturefor some time. However, it has been regarded by many as mainly a theoreticalpossibility in the distant future when new communications infrastructures havedeveloped. The essential difference with “incasting” is that it could be developedtoday, using the existing telecommunications structure, at a relatively low cost,and operate without damaging the existing telephone traffic. A technological andconceptual breakthrough (now patented in Canada and the United States)makes this possible.
Bell Canada is studying the possibility of having an “incasting” trial. TheCanadian broadcasting industry is very keen to participate. Other interestedparties such as the Canadian Radio-Television and Telecommunications Com-mission and Statistics Canada (both Federal Government agencies) are alsovery interested. The internal Bell Canada decision is being pursued along anumber of paths that would be expected in any significant opportunity analysis.However, the social-political issues have been some of the most prominent sincethe project was undertaken.
It is clear that even though this is a polling system and not a voting one, thatits use could have significant social-political impact. The internal debates at thehighest levels of the corporation have often concentrated on these TA issuesrather than the pure business interest or technology ones, These debates havebeen very intense and the TA process is being brought into play. A consultingpolitical scientist has been exposed to the concept and has provided new insightsinto the potential impacts, Further seminars are planned with knowledgeableexperts in relevant fields in order to map out the impact possibilities. Theproject manager for "incasting” has personally conducted the CAI-TA referredto above, and hence is more than casually aware of the TA processes that haveto be brought to bear in a case such as this one. Finally, any decision to conductan “incasting” trial will be matched with one to track the social impact aspectsof the trial.
The "incasting” project is in mid-course and it is difficult to know how it willbe resolved. There is not any corporate commitment to even conduct a trial atthis time. However, as the “incasting” story unfolds, the process of corporateTA will be followed. As noted in the previous section, it is the author’s convic-tion that the use of a TA process as a part of the on-going managerial processof decisionmaking is of far greater importance than single-shot studies. The useof a TA process throughout the “incasting” project will be far more significantthan one study on the social implications of electronic polling.
Bell Canada and the BPG have been seriously committed to TA for the pastfour years. Similarly, the organization has been committed to some of the basicconcepts for a much longer period of time. The experience with TA itself hasbeen an evolutionary one. This experience has been educational at both themethodological-professional level and at the decisionmaking level. Our currentview continues to support professional research activities where new informa-tion is required. However, we have come to recognise that TA is more valuablein the corporate environment when it is a normal part of the continuing decision-making and re-evaluation process than when it is only associated with one-timestudies of particular topics. The material outlined in this document. particularlyas it is related to the work in travel-communications substitution and to “incast-ing” is offered as concrete experience to support this philosophy.
APPENDIX I : TECHNOLOGY ASSESSMENT AND INDUSTRY
INTRODUCTION
TA has been a concern of governmental bodies for some time. The role of theindustrial sector in TA has not been discussed widely beyond the obvious nega-
—
335
tive role of being a target for problem-oriented assessments. This short reviewwill attempt to present a more positive role for the corporate sector.
industry’s involvement in TA can occur as a result of several different types ofpressures. These pressures for involvement can be grouped into three categories:(a) defensive reactions; (b) positive pressures; and (e) corporate social re-sponsibility. Each of these forces will be reviewed in turn.
INDUSTRY AND ASSESSMENT
DEFENSIVE REACTIONSLegal
The introduction and enforcement of environmental protection statutes haveproved that institutions can be made legally responsible for the secondary con-sequences of their actions. One school of thought in technology TA feels thatprior assessment of the potential secondary impacts of major business decisionswill become a legal requirement. Legal issues will also arise if TA becomes partof the adversary regulatory system used in many OECD nations. Hence, somecorporations are starting to conduct TAs in anticipation of more formal require-ments to do so,
Potential Bias. The overwhelming interest in government-oriented TA whencompared to the business contribution has led some people in industry to fear thatall assessment work may have an anti-business bias. If this does not occur thereis still a fear that the assessment activities will be too academic. When the legalquestion reviewed above is taken into account as well, business planners areled to believe that they must provide a contribution to TAs or this potential forbias could become a serious problem in the long term.
R & D Planning. TA is designed to be an anticipatory process A realisticanalysis leads us to conclude that most of the introduction of new technologiesin OECD countries still occur in the private sector. An understanding of thedevelopment and implementation process for technologies into society revealsthat this is a complex process that begins with basic R & D planning. Inclusionof TA inputs to this system should begin at the earliest stages of technologicalresearch. It is unlikely that many businessmen would accept inputs from govern-ment assessments alone. Thus, industry’s role in the R & D process is also creat-ing pressures to conduct extensive assessments.
These initial pressures are negative in the sense that they indicate events areforcing industry to become part of the assessment movement rather than becom-ing contributors in a voluntary way. This is not the case, as there are positiveforces at work that make TA a logical activity for corporations.
POSITIVE PRESSURES
CORPORATE LONG-TERM PLANNING
Many of the techniques that are used for TA are those used in long-term plan-ning in business. Other useful techniques are found in market research and plan-ning, econometric modeling, and statistical analysis. While there is a clear dis-tinction between these forecasting techniques and a complete TA, familiarity inindustry with the use of these methodologies creates fertile ground for TA inbusiness. The main thrust in TA is to extend the vision of business planners tosecondary as well as primary impacts. This is an evolutionary, not revolutionary,step for planners in many of today’s large business concerns.
As noted above, the development of strict environmental control statutes inmany OECD countries has led to the requirement to prepare studies showing thepotential secondary impacts of introducing new technologies into the environ-ment. The involvement of corporations in sponsoring or directly preparing envi-ronmental impact statements has acquainted both corporate planners and busi-ness executives with the concepts and practice of examining secondary impactsin advance of taking actions. It is not difficult to move from examining environ-mental secondary impacts to reviewing the broader range of considerationsinvolved with TAs once the decision maker is familiar with environmentalassessment.
COSTSExperience in trial and actual TAs has indicated that they are often quite
costly. Most of these studies have been conducted by outside groups not partof the decisionmaking agency. Outside assessments by consulting firms, uni-
336
versities, or government agencies appear to spend large portions of their re-sources in acquiring a data-base of information required to gain knowledge ofthe industry and technology that they are assessing. Cooperative research withindustry in conducting assessments can help reduce the costs of assessmentsconsiderably, in some cases this may be an order of magnitude reduction. Thisscale of reduction is possible as industry often has the basic background dataavailable in its files. The costs of reconstructing this data are often monumental,with no assurance that the reconstruction will be accurate. Preparation of as-sessments by industry or joint work with government, university or consultingagencies in a cooperative non-hostile environment may help make TA a morecost effective process.
CORPORATE SOCIAL RESPONSIBILITY
The discussion above has noted that there are negative or self-preservationreasons for corporate involvement in TA, and that there are also positive reasonsfor TA to become a natural evolution of business planning activities. There isan even stronger pressure for involvement than these factors; this is the growthof what has become termed “corporate social responsibility.” While this is oftenregarded as mere rhetoric or good advertising fodder by non-business people,there is in fact a hard-core development here that is quite serious. This is not auniversal factor across business or particular industries but it is a rapidly grow-ing consideration in many corporations. This consideration in business makesTA a central activity of the future in corporations that are truly interested inthe social impact of their decisions.
The author expects that this interest will develop first in industries that arecurrently under some form of government regulation. Regulated industries haveexperience in dealing with governments on a routine basis and are not quite ascaught up in the standard government vs. business rhetoric that occurs elsewhere.The preparation of TAs in regulated industries and their reception by regulatoryand other government agencies will act as a good model for future voluntaryassessment activities in industry. Widespread failure in this arena would prob-ably lead to a reduction of assessment activities on a voluntary, positive basisand result in a return to assessment work for the more negative reasons outlinedabove.
Most indicators show that TA and industry will have a productive relation-ship. However, this does not mean that there will not be problem areas with in-dustrial assessment activities. Several of the most significant potential problemsare reviewed below briefly.
POTENTIAL PROBLEM AREAS
CREDIBILITY
This is the most basic problem and should be faced realistically. Many TAssponsored or conducted by industrial groups will be regarded by many govern-ment and academic groups as tainted by their parentage. This view will be asound one in some cases but will be unfair in many others. Objective, method-ologically sound, well-conducted assessments should not be lost in the intellec-tual and political rhetoric. Industry has a valuable contribution to make in aTA and each individual study should be measured on its own merits.
COST BURDEN
The costs of TA will certainly cause serious questions in industry. The costsof assessment involve more than the direct financial burden of conducting studies.Other costs include the financial and opportunity costs of lending experts toassessment teams outside of the parent organization. Costs also include thepotential danger of the loss of proprietary information given to assessment teamswho then publish their findings widely. All of these cost elements become impor-tant in national or international competitive environments where all of thecompetitors do not decide to conduct assessments.
IMPACT ON INNOVATION
One of the common statements of concern regarding TA is that it will slowdown the rate of innovation in industry and in the economy generally. These con-cerns are genuine, especially in the increasingly competitive international econ-omy. While the concept of growth for its own sake is rapidly becoming regarded

337
as questionable, even in some businesses, it is difficult to convince one company,industry, or nation to voluntarily slow down its own growth unless it is assuredof some form of quid pro quo from its competitors. Organizations like the OECDwill have an important role to play in assuring that these innovation impact con-siderations are resolved satisfactorily on an international scale.
SUMMARY
The inputs from TAs should be also added into the process of constantdecision-making in industry. This can only occur if industry takes an activerole in conducting its own assessments as well as utilizing the work of govern-ment and academic agencies. TA will have achieved its greatest success if assess-ment inputs are routinely used in decisionmaking rather than if they are onlyimposed by regulation on certain types of decisions. The problem areas reviewedabove are important but on the balance business can be expected to play avaluable role in the movement for widespread use of TA recommendations. Theauthor feels that the realities of modern economic life in the OECD nationsdemand that industrial assessment activities become widely accepted and encour-aged. Industry makes many of the most important decisions today on technologyadoption and will continue to do so in the future in Western economies. TAmechanisms that only examine the secondary impacts of these decisions afterthey start to emerge will be a limited success. Regulation as used in traditionalregulatory bodies does not appear to be the best model for the future.
Appendix 2: Technological Imperatives In Telecommunications
Much of the interest in the question of substitutability has resulted from arecognition that new communications and computer technologies offer manycapabilities that may reduce the utility value of personal travel when comparedto these services. Promoters of specific technologies often claim that their inno-vations alone will reduce the need for travel. These claims are optimistic andperhaps unfounded when viewed in isolation. However, the combined capabilitiesof the various emerging technologies will certainly have an impact on the sub-stitution issue. Several of these major thrusts in technology are reviewed below.
TWO-WAY BROADBAND SYSTEMS
Most of the literature in this field has been concerned with an expansion ofthe capabilities offered by co-axial cable currently being used to deliver cableTV signals. These broadband channels can be converted to interactive usethrough the use of additional electronics to provide low-speed (audio grade) orbroadband (video grade) return paths from the receiving location to the centraldistribution point (the “head end”). These return path capabilities can alsobe provided through the use of the regular telephone channel. The significance ofthese systems is that they create the ability to deliver “on demand” selectivevisual information over the broadband channels. These systems have the theo-retical capability over time to add random switching so that each subscriber cancall any other subscriber in a fashion similar to telephone calls today. Thesecalls could be audio, audio-graphic, or audio-visual in nature. It is still question-able whether the providers of cable systems will invest the additional capitalrequired to provide these types of capabilities. The recent difficulties in thecable TV industry have strengthened the view that widespread use of interactivetelevision into the home is further off than many have predicted in the pastfew years.
Two-way broadband systems could provide a certain amount of selective,private delivery of information to subscribers in residential areas leading tosome forms of intra-urban substitution (where most systems are installed andwill be installed for the next decade or so). These possibilities have led to anumber of forecasts on the potential of working from home.
The availability of a host of consumer-oriented capabilities has been fore-casted by those expecting the development of a “wired city” (a misnomer sincemost cities are already wired for power and telephone systems ). These servicesinclude:
Remote shopping;Remote banking;Electronic security services;Electronic education;
—
338
Electronic voting;Consumer information retrieval systems; andRemote medical systems.
As noted above in the introduction, the papers presented by other membersof this panel discuss some of the implications of the use of these types of sys-tems on business-oriented intra-urban travel. The use of these technologiescould also lead to substitution of certain forms of non-business intra-urbantravel. The BPG of Bell Canada has conducted a modified Delphi study of thepotential acceptance of these types of services in the home. The results of thisresearch are described elsewhere. This work is being continued currently witha detailed TA of the positive and negative secondary impacts that may resultfrom the use of “wired city” services. The intra-urban substitution issue is oneof the items that will be reviewed in this project. There are other technologiesthat are generating interest in the substitution thesis. One of these is videoteleconferencing.
VISUAL TELECOMMUNICATIONS TECHNOLOGIES
The use of these systems to augment substitution has been forecasted bymany observers. Interpersonal visual communications can take the form ofrandomly switched calls between individuals using a technology such as theU.S. Bell System’s Picturephone. Interpersonal visual communications can alsotake the form of point-to-point teleconferences between groups of individualsusing systems such as Confravision in the U.K. or Bell Canada’s ConferenceTV system. The Confravision system has recently been extended to Sweden, andother European countries are reported to be planning to join this growing net-work. In the U. S., the Bell System has introduced a three city (Washington,New York, and Chicago) conference television based upon Picturephone tech-nology. The Australian Post Office has also been using a Confravision systemfor several years. One of the prime reasons advanced for using these systemsis to cut back inter-city travel.
The systems discussed above are all directed toward inter-city communica-tion. The question of intra-city video conferencing has also been tested but noton such a wide-scale basis. The Metropolitan Regional Council around the NewYork City area has been using a multiple location video conference network forlocal use during the past year. This system has been used to replace travelwithin the New York City area for meetings between the local politicians andcivil servants, and for remote training sessions. Interactive television systems(audio return paths only) have been used at Stanford University and TheUniversity of Southern California for several years to reduce student travelto classes or provide educational training to employees right at their remotejob locations. Both inter- and intra-city systems offer the ability to interactwith images of speakers at remote locations and to share pictures, diagrams,and graphics.
It should be restated here that significant future substitution would not beexpected to take place through the use of Conference TV or Videophone alone.It is the combined pressure from the overall collection of technology capabilitiesthat is being reviewed here.
COMMUNICATIONS SATELLITES
Communications satellites have grown from experimental vehicles to keycomponents of national and international communications systems in the pastdecade (both for broadcast and interpersonal communications). Canada wasthe first country in the world to use synchronous orbit domestic satellites forbroadcast and interpersonal communications within a nation. While there areabundant east-west communications systems within Canada, the satellite per-mits communications into the far north of Canada where other systems couldonly provide delayed broadcast or periodic telephone service. This technologyis viewed as an important means of linking residents of the North into thecommunications mainstream of Canadian life. In the U.S. domestic satelliteservice has recently been introduced by the Western Union Company. This sys-tem will also provide nation-wide telecommunications service to both end usersand other common carriers.
Communications satellites may be a factor in other substitution questions aswell. These satellites have been projected as means of linking up many urbancable TV or local broadband systems into nationwide networks. They may alsobe used to provide lower cost video channels for interpersonal visual com-

.
339
munications systems such as Videophone or Conference TV. However, in bothof these cases, their impact is secondary since the satellite only provides rawcommunications channels to these other systems, which in turn provide user-ori-ented services that could augment the substitution process. Analysis of theimpact of future broadband communications or visual teleconferencing systemsshould include the impact of any satellite communications as a sub-componentrather than as an entity in itself,
INFORMATION STORAGE AND RETRIEVAL SYSTEMS
will have an impact on the substitution process. The complex merging of com-puter power and communications systems is leading to a whole new order of sig-nificant technologies. The development of “on-line” (i.e. communications-linked)time-sharing systems that provide a host of personalized information storage andretrieval capabilities, text editing, and computational power is creating the pos-sibility of utilizing remote work centers with the required access to computersystems needed to accomplish a task. Developers of very advanced, but user-ori-ented (the “dumb” user from a computer viewpoint) systems see them as creat-ing “augmented knowledge workers” over time. (9) They foresee an evolutionin work styles and capabilities as knowledge or post-industrial workers utilisethe power in these systems. This could have considerable impact on the intra-urban substitution question since these systems can be routinely accessed fromany location that has a telephone.
COMPUTER NETWORKS
The evolution of several advanced forms of computer networks in North Amer-ica will reinforce the tendencies outlined in the above section. Linking throughrelatively inexpensive communications networks permits specialization of com-puter capabilities at various geographic locations. The Advanced Research Proj-ects Agency (ARPA) has financed the development of one such system in theU.S.A. that is now being extended (via satellite) to Europe, Hawaii, and theFar East. This resource-sharing of specialized computer systems will assist infurther augmentation of knowledge workers and impact on the need for bothintra- and inter-urban travel. Several commercial versions of these forms ofcomputer networks are being introduced in the U.S. The Trans-Canada Tele-phone System is also introducing a common user-packet switched-data networkin the next year. Plans for experimental networks have been also announced bymost European telecommunications authorities and by the Japanese telecom-munications organization.
COMPUTER-AUGMENTED CONFERENCING (CAC)
CAC connects a number of individuals with computer terminals to the com-puter in a synchronous or asynchronous mode, permitting them to approximatethe interactions that they might experience if they were engaged in face-to-facecommunication as well as providing new capabilities not currently availablewith face-to-face or electronic communications. The number of participants in acomputer-augmented conference can vary from two to as many as twenty or more.Since the communications process is asynchronous, many conferees can inputtheir comments to the conference at the same time: when they have fin-ished their input, the computer delivers the messages that have arrived duringthe input phase. A text editing facility may also be included in the CAC package.
Computer conferencing provides another means of merging computer and com-munications systems power to help create alternatives to travel. The techniqueis also being used as a research vehicle by the BPG. In the past, audio-telecon-ferences have been sponsored by the group among over twenty” different indi-viduals associated with institutions studying various aspects of the substitutionquestion. This program has been expanded to include interactive computer con-ferences on the same subject.
OTHER TECHNOLOGIES
This analysis of the technological issues that are stimulating interest in thesubstitution area is only a brief overview of the energy possibilities. Each of thetechnologies discussed above can be explored in much greater detail in the variousreferences given. Many other relevant technologies that will have a bearing onthe future process of substitution have not been discussed. These include, intelli-
gent terminals
340, video discs and cassettes, audio cassettes, video data banks, audio
data banks, computer-based education systems, facsimile transmission, graphiccommunications, still-frame TV transmission, artificial intelligence systems, andvoice input to computers. The main purpose of this section of the article wasnot to be all-inclusive, or to review any particular technology in detail, but togive a flavor of the technological revolutions whose combined strength will cer-tainly cause a conscious re-evaluation of many future decisions to travel.
APPENDIX 3 : BUSINESS PLANNING PUBLICATIONS
DELPHI STUDIES
Michael T. Bedford, The Future of Communications Services in the Home,Business Planning Group, Bell Canada, Montreal, Canada, Nov. 1972.
Michael T. Bedford, A Technology Assessment of Future Residence Communi-cations Services, Volume 1 Working Papers, Business Planning Group, BellCanada, Montreal, Canada, January 1976.
Lawrence H, Day (cd.), Delphi: The Bell Canada Experience, Business Plan-ning Group, Bell Canada, Montreal, Canada, Oct. 1972.
Frank J. Doyle and Daniel Z. Goodwill, An Exploration of the Future in Edu-cational Technology, Business Planning Group, Bell Canada, Montreal, Canada,Jan. 1971. (external panel study)
Frank J. Doyle and Daniel Z. Goodwill, An Exploration of the Future inMedical Technology, Business Planning Group, Bell Canada, Montreal, Canada,March 1971.
Daniel Z. Goodwill, An Exploration of the Future in Business InformationProcessing Technology, Business Planning Group, Bell Canada, Montreal, Can-ada, Oct. 1971. (external panel study)
ExPLORATORY STUDIES
Philip Feldman, A Technology Assessment of Computer-Assisted-InstructionUse in Colleges (Revised Edition), Business Planning Group, Bell Canada, Mon-treal, Canada, July 1973.
James H. Kollen/Jacques Vallee, Travel/Communication Relationships, Pro-ceedings of the First International Computer-Based Conference, Business Plan-ning Group, Bell Canada, and Institute of the Future, Montreal, July 1974.
James H. Kollen, Transportation-Communications Substitutability: A Re-search Proposal, Business Planning Group, Bell Canada, Montreal, Canada,April 1972.
James H. Kollen, American Urban Violence, Private paper submitted to theHudson Institute “Corporate Environment Study, 1975-1985”, Montreal, Canada,April 1973.
Michael Katsoulis, Energy Impacts of Passenger Transportation, BusinessPlanning Group, Bell Canada, Montreal, Canada, March 1974.
James H. Kollen/John Garwood, Travel/Communication Tradeoffs: The Po-tential for Substitution Among Business Travelers, Business Planning Group,Bell Canada, Montreal, Canada, April 1975.
James H. Kollen, Travel/Communication Tradeoff Data Base On IntercityBusiness Travelers, Business Planning Group, Bell Canada, Montreal, Canada,June 1875.
BUSINESS PLANNING PAPERS
BPP#1—Lawrence H. Day, “Electronic Mail Services in the InformationAge”, Canadian Postal Users Conference, Ottawa, Canada, October, 1972.
BPP#2—Internal distribution only.BPP#3—Lawrence H. Day, “The Future of Man-Machine Information System
Use by Non-Computer Professionals” Fourth International Symposium on Corn-puter and Information Science (COINS–72), Miami, Florida, December, 1972.(slides only )
BPP#4--Lawrence H. Day, “Design of a Futures Information System”, Sec-ond Annual Computer Communications Conference, San Jose State University,January, 1973.
BPP#5--Lawrence H. Day, “Long Term Planning in Bell Canada”, LongRange Planning, London, England, September, 1973.
BPP#6--Lawrence H. Day, “The Future of Computer and CommunicationsServices”, National Computer Conference and Exposition, New York, N. Y., June,1973.

341
BPP#7—Lawrence H. Day, “Instant Retrieval Television: From Theory toSystem”, First Annual Computer Communications Conference, San Jose, Calif.,January 1972. (abstract only)
BPP#Donald M. Atkinson, “The Societal Side of the Wired City”, FirstAnnual Computer Communications Conference, San Jose, Calif., January 1972.(abstract only )
BPP#9--Internal distribution only.BPP#10-Anthony D. Ryan, Cross Impact Analysis for Bell Canada,.March
1973.BPP#11—Donald M. Atkinson, Three Papers on Telecommunications and
Social Environment with and Impact on Business, April 1973.BPP#12—Michael T. Bedford, A Technology Assessment of Future Com-
munications Services in the Home: A Study Proposal, May 1973.BPP#13—Lawrence H. Day, “The Corporate Role in Technology Assessment:
A Case Example”, First International Congress on Technology Assessment, TheHague, The Netherlands, May, 1973. ( See also journal paper in: TechnologyAssessment ),
BPP#14--Michael T. Bedford, “Technology Assessment and the Future ofEducational Technology”, Thirtieth Annual Science Council Conference, AlbertaTeachers Association, Banff, Alberta, May, 1973.
BPP#15--Philip Feldman, Cross Impact Matrix Applications in Technologyand Policy Assessment, Sept. 1973.
BPP# 16--International distribution only.BBP#17—Lawrence H. Day, “Technology Assessment and the Legal Profes-
sion”, Jurimetrics, American Bar Association, Chicago, Dec. 1973.BPP#18—Lawrence H. Day, “Dimensions of Future Travel/Communications
Substitutability”, Special Rome Conference on Futures Research, Rome, Italy,September, 1973. (see also journal paper in: Futures).
BPP#19--Philip Feldman, Group Judgmental Data in Cross Impact Analysisand Technology Assessment, Nov. 1973.
BPP#20-Philip Felman, Cost-Benefit Analysis and Corporate Social Respon-sibility, April, 1974.
BPP>#21—J. E. Meagher, Learning Theory, A Selected Overview, BusinessPlanning Paper No. 21, February 1974.
BPP#22—J. E. Meagher, Programming in Educational Television, July 1974.BPP#23--Philippe Marquette, Overview of Chart Book Project, Sept. 1974.BPP#24—James H. Kollen/John Garwood, “Travel/Communication Substitu-
tion: Methodological Considerations”, Canadian Psychological Association Con-vention, Institute of Psychology and Telecommunications, University of Windsor,June 1974.
BPP#25—Internal Distribution Only.BPP#26—Philippe Marquette, Electronic Calculators, Sept. 1974.BPP#27—Philippe Marquette, Verification of Forecasts Done in “Computer
Based Services of the Seventies”, Sept. 1974.BPP#28--Kenneth S. Hoyle, Legal-Political Considerations for Effective
Planning, American Society of Mechanical Engineers Conference, Mexico City,October 1974.
BPP#29--James H. Kollen, Replacement of Travel by Telecommunication,October 1974.
BPP#30--International Distribution Only.BPP#31—International Distribution Only.BPP#32—James H. Kollen, New Perspectives On the Travel/Communication
Tradeoff-December 1974.BPP#33--Michael Katsoulis—An Energy Scenario for Canada--1986---Decem-
ber 6, 1974.BPP#34--J. E. Meagher--The Role of Television in Education-February 1975.BPP#35----International Distribution Only.BPP#36--International Distribution Only.BPP#37--International Distribution Only.BPP#38--Michael T. Bedford—Social Changes Through the Year 1986, May
1975.BPP#39-Michael T. Bedford, “The SPRITE Techniques Use in a Tech-
nology Assessment of the Wired City. ” May, 1975.BPP#40--Lawrence H. Day, Future Opportunities in Telecommunications,
World Future Society, Second General Assembly, June, 1975.

.——
342
BPP#41—Lawrence H. Day, Computer Conferencing: An Overview, MEXI-CON 74, Mexico City, Mexico, August, 1974. Also Airlie House 1975 Conferenceon Telecommunications Policy Research, April, 1975.
BPP#42—Philip L Weintraub, Big Business Goes Small, Business Quarterly,Fall Issue, September 1975.
BPP#43—Gwen C. Edwards, Computer Augmentation of Text Processing andCommunication Systems: An Evaluation Plan, September 1975.
BPP#44--Lawrence H. Day, Interdisciplinary Research at the Business Plan-ning Group: Computer Assisted Education as a Case Example, Annual Meetingof the American Association for the Advancement of Science, New York, N. Y.,January 1975.
BPP#45---International Distribution Only.BPP#46--Lawrence H. Day, Telecommunications and Productivity, Engi-
neering Foundation Conference on Productivity Improvement in the ServiceSector Through Information Transaction Technology, Ridge, New Hampshire,August 1974.
BPP#47—James H. Kollen, Assessing Societal Reactions to New Communica-tions Technology: A Chart Book, November 1975.
BPP#48--Phil Feldman, Cross Impact Analysis in Technology and PolicyAssessment, December 1975.
BPP#49--Phil Feldman, Relevance and Cross Impact Matrices in R&D Plan-ning, January 1976.
BPP#50--Michael Katsoulis, Travel/Communications, Substitution—Its Po-tential for Energy Conservation in Canada., February 1976.