technological development and fisheries management
TRANSCRIPT

Technological Development andFisheries Management
OLE RITZAU EIGAARD,1 PAULMARCHAL,2 HENRIK GISLASON,1
and ADRIAAN D. RIJNSDORP3,4
1DTU Aqua, Charlottenlund Castle, Charlottenlund, Denmark2IFREMER, Channel & North Sea Fisheries Research Unit, Boulogne-sur-Mer, France3IMARES Wageningen UR, Ijmuiden, The Netherlands4Aquaculture and Fisheries Group, Wageningen University, Wageningen, The Netherlands
Many marine fish stocks are overexploited and considerable overcapacity exists in fishing fleets worldwide. One of the
reasons for the imbalance between resource availability and fishing capacity is technological development, which
continuously increases the efficiency of the vessels—a mechanism referred to as “technological creep.” We review how the
introduction of new and more efficient electronic equipment, gear design, engines, deck equipment, and catch-handling
procedures influences the capture efficiency (catchability) of commercial fishing vessels. On average, we estimate that
catchability increases by 3.2% per year due to technological developments, an increase often ignored in fisheries
management. The documentation and quantification of technological creep improves the basis for successfully integrating
the effects of technological development (and catchability changes) in fisheries management regulations and policies.
Ways of counteracting the undesired effects of technological creep are discussed as are the potential management benefits
from improved fishing technology. Specific suggestions are given on the selection, application, and tuning of fisheries
management tools that can be used to improve the balance between harvesting capacity and resource availability.
Keywords catchability, fishing mortality, fishing power, fisheries management, fleet capacity, technological development
INTRODUCTION
Compared to agriculture and livestock production on land,
the living resources of the sea are mainly harvested on a hunt-
ing and gathering basis. Marine living resources typically
move around and are difficult to locate and identify, and fish-
ers often harvest a heterogeneous crop consisting of multiple
species and age classes captured across large temporal and
spatial variations in ocean productivity. The pressure exerted
by fishers on fish stocks (fishing mortality) is therefore often
poorly correlated to fishing effort and the resulting catch.
In the past decades, the understanding of the relationship
between fishing effort and fishing mortality (F) has improved,
owing mainly to an increasing number of public-funded
research programs intended to stimulate scientific investiga-
tions of fishing mortality dynamics. This interest for the
“F-science” (Reeves et al., 2008) may have resulted from
several examples of large-scale policies of fishing capacity
and effort reductions having failed to meet their objectives of
reducing fishing mortalities (FAO, 2012). In some cases, most
of the policy objectives relating to reduction in the number of
vessels, in gross tonnage and in fishing effort have been met,
but even so the expected reduction in fishing mortalities did
not materialize (EC, 2008). This can be the result of a num-
ber of factors, including the availability of subsidies for the
modernization and renewal of the remaining fleet (Lindebo,
2005), which boosts the technologically driven increases in
catchability (technical efficiency) of the remaining vessels,
thereby undermining the achieved reductions in nominal
fleet capacity and fishing effort (Pascoe and Coglan, 2000;
Eigaard, 2009).
The effective effort of a fishing fleet is the result of measur-
able and non-measurable capacity inputs and fishing activity
(Figure 1). Fleet capacity is generally expressed in terms of
the number, size (GRT, length), and engine power of vessels
of specific types (trawlers, seiners, and long liners) and the
nominal effort can be expressed as the time spent at sea by allAddress correspondence to Ole Ritzau Eigaard, DTU Aqua, Charlotten-
lund Castle, 2920 Charlottenlund, Denmark. E-mail:[email protected]
Reviews in Fisheries Science & Aquaculture, 22(2):156–174, 2014Copyright cO Taylor & Francis Group, LLCISSN: 2330-8249 print / 2330-8257 onlineDOI: 10.1080/23308249.2014.899557
156
vessels of a particular type and engine power using a specific
gear and mesh size (Figure 1). Nominal effort is the measur-
able component of effective effort and can be estimated from
routine catch and effort-monitoring programs (FAO, 2000,
2004). The non-measurable component captures the technical
efficiency (catchability) of the vessels as affected by a variety
of factors, such as differences in the skills of skippers (Hil-
born, 1985), differences in the targeting of specific species
(Quirijns et al., 2008), or differences in auxiliary equipment
(e.g., gear rigging, deck equipment, hull material, and propul-
sion of the vessel; Marchal et al., 2007).
The measurable capacity and activity of the fleet is the basis
for fisheries management, which comprises both long-term
capacity management and short-term management (Figure 1).
Capacity management takes a long-term perspective to match
fleet capacity with productivity of the exploited ecological sys-
tem, and can be undertaken through licensing or by market-
based approaches, such as ITQs, discouraging over-investment
in fleet capacity. Short-term management aims at regulating
fishing mortality by adjusting fishing effort or total allowable
catch (TAC) on an annual basis. Direct control of fishing effort
(short-term input control) is expected to have certain advan-
tages over TAC regulations such as decreased enforcement
costs and reduced discards (Murawski and Finn, 1986; Catch-
pole et al., 2005; Rijnsdorp et al., 2007). However, the success
of effort control as fisheries management strategy is highly
sensitive to technological development, to input substitution,
and to the resulting efficiency changes of commercial fishing
vessels (Rossiter and Stead, 2003; Stefansson and Rosenberg,
2005). In a TAC (output)-controlled system, these effects are
in theory self-adjusting (Charles, 1995; Thomsen, 2005), but
in many cases technological development also challenges
sustainability of this regime type by adding uncertainty to the
stock assessments underlying the setting of TACs (Marchal
et al., 2002). Hence, it is the changes and variations in the
non-measurable inputs that are responsible for many of the
problems fisheries management face. The “non-measurable
input” term captures factors that are not measured on a routine
basis, but require detailed statistical analysis of the available
survey and fisheries monitoring data or detailed monitoring of
the developments in fisheries technology and changes in fish-
ers skills and behavior (Salas and Gaertner, 2004; Eigaard
et al., 2011a; Andersen et al., 2012).
The objective of this paper is to discuss and review (1)
developments in fishing technology that are not routinely mon-
itored; (2) the economic, sociological, and regulatory drivers
of these developments; (3) the change in catchability in vari-
ous fisheries, and (4) the implications of technological change
for the management of fisheries. We deliberately focus on the
physical variables that increase the ability of individual vessels
to inflict higher fishing mortalities, rather than the input varia-
bles used in econometric techniques where production func-
tions are used to relate fleet landings to various measurable
inputs, including fixed inputs, such as technology, variable
inputs, such as fishing days, and to stock size (Hutton et al.,
2008). We first describe the introduction of new technology in
vessels and fleets, and then analyze its effects on catchability
and fishing mortality.
The implications for management focus on (i) how long-
term input control (buy-back schemes and other capacity con-
trol measures) is challenged by efficiency changes from both
temporal (changes at vessel level) and structural (changes in
fleet profile) technological development, (ii) how short-term
input control (in terms of effort restrictions) can be
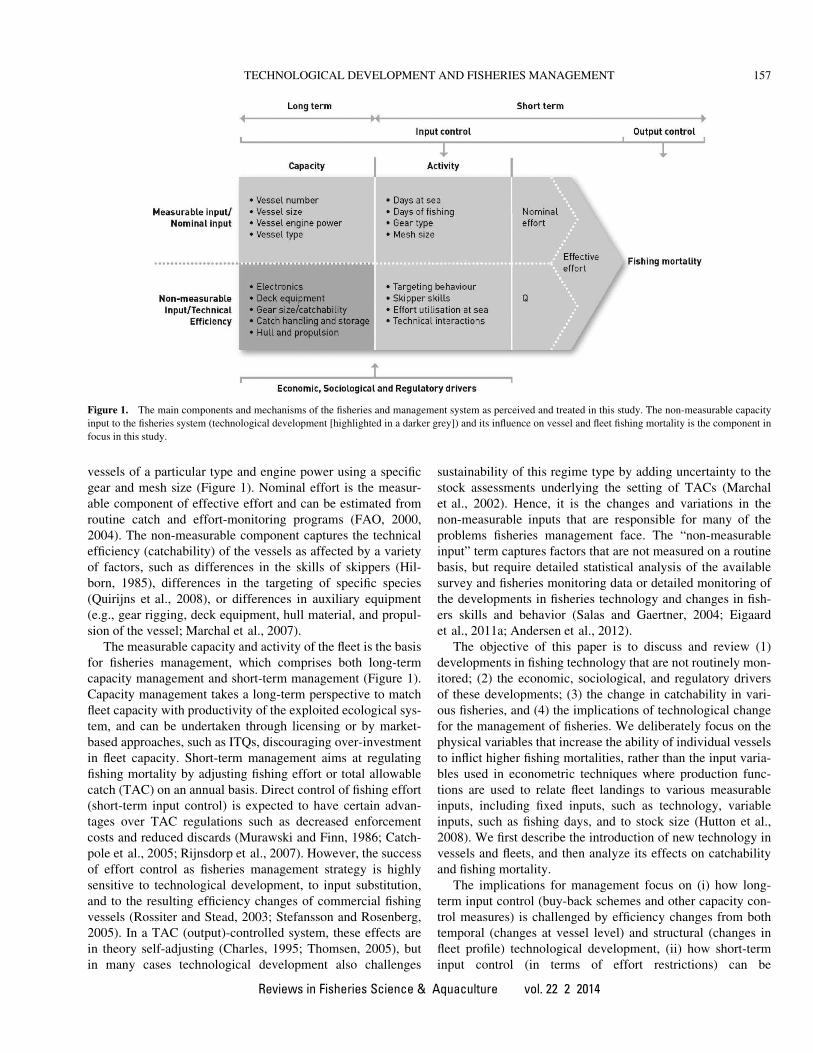
Figure 1. The main components and mechanisms of the fisheries and management system as perceived and treated in this study. The non-measurable capacity
input to the fisheries system (technological development [highlighted in a darker grey]) and its influence on vessel and fleet fishing mortality is the component in
focus in this study.
TECHNOLOGICAL DEVELOPMENT AND FISHERIES MANAGEMENT 157
Reviews in Fisheries Science & Aquaculture vol. 22 2 2014
undermined by technologically induced efficiency increases,
and (iii) how technological development can complicate out-
put control by adding uncertainty to standard stock assess-
ment. Following this framework, we explore how the main
instruments of current fisheries management could best be
applied and supplemented to mitigate the conservation short-
comings resulting from technological development in com-
mercial fisheries.
THE NATURE OF TECHNOLOGICAL DEVELOPMENTIN COMMERCIAL FISHERIES
Commercial fishers constantly introduce technology to
remain economically competitive and to enhance the perfor-
mance of their equipment in order to increase the value of their
catch, decrease costs, aid navigation, and improve safety at sea
(Valdemarsen, 2001; Tietze et al., 2005). Technological
development in commercial fisheries is a complex process
with many patterns and drivers of introduction and with het-
erogeneous and occasionally contradictory effects on catch-
ability and fishing mortality. Even though it is broadly
accepted that there is technological development (often
referred to as technological creep) and that this development
complicates sustainable management of commercial fisheries
(e.g., Cunningham and Whitmarsh, 1980; Eigaard et al.,
2011a; Standal, 2005;), relatively little is known about the pro-
cess. Consequently, incorporating the effects of changes in
technological development in fisheries management is far
from straightforward.
TECHNOLOGY DEVELOPMENT AND UPTAKE INFISHERIES
In the scientific fisheries literature, technological develop-
ments are often divided into sudden and gradual incremental
change (e.g., Rahikainen and Kuikka, 2002; Marchal et al.,
2007). Thus, technological development includes both distinct
investments in new technology on board individual vessels
(e.g., the purchase of sonar, gear sensors, or new navigation
systems), as well as gradual improvements to the existing ves-
sel technology or gear (e.g., netting materials, trawl panels
designs, hook and long line designs, or deck equipment and its
arrangement). Examples of radical technological change in
fisheries are the introduction of purse seining in the late 1960s
in the herring (Clupea harengus, Clupeidae) fisheries (Whit-
marsh et al., 1995) and the introduction of beam trawls and
tickler chains in the Dutch flatfish fishery in the early 1960s
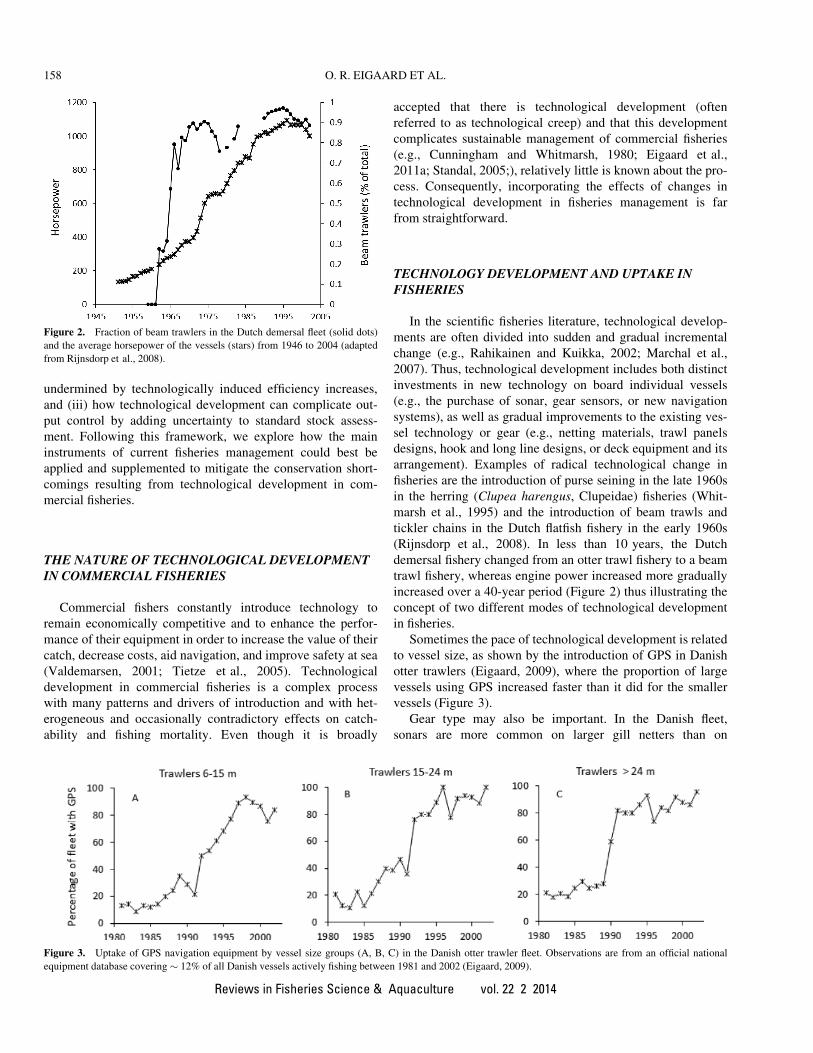
(Rijnsdorp et al., 2008). In less than 10 years, the Dutch
demersal fishery changed from an otter trawl fishery to a beam
trawl fishery, whereas engine power increased more gradually
increased over a 40-year period (Figure 2) thus illustrating the
concept of two different modes of technological development
in fisheries.
Sometimes the pace of technological development is related
to vessel size, as shown by the introduction of GPS in Danish
otter trawlers (Eigaard, 2009), where the proportion of large
vessels using GPS increased faster than it did for the smaller
vessels (Figure 3).
Gear type may also be important. In the Danish fleet,
sonars are more common on larger gill netters than on
Figure 2. Fraction of beam trawlers in the Dutch demersal fleet (solid dots)
and the average horsepower of the vessels (stars) from 1946 to 2004 (adapted
from Rijnsdorp et al., 2008).
Figure 3. Uptake of GPS navigation equipment by vessel size groups (A, B, C) in the Danish otter trawler fleet. Observations are from an official national
equipment database covering � 12% of all Danish vessels actively fishing between 1981 and 2002 (Eigaard, 2009).
158 O. R. EIGAARD ET AL.
Reviews in Fisheries Science & Aquaculture vol. 22 2 2014
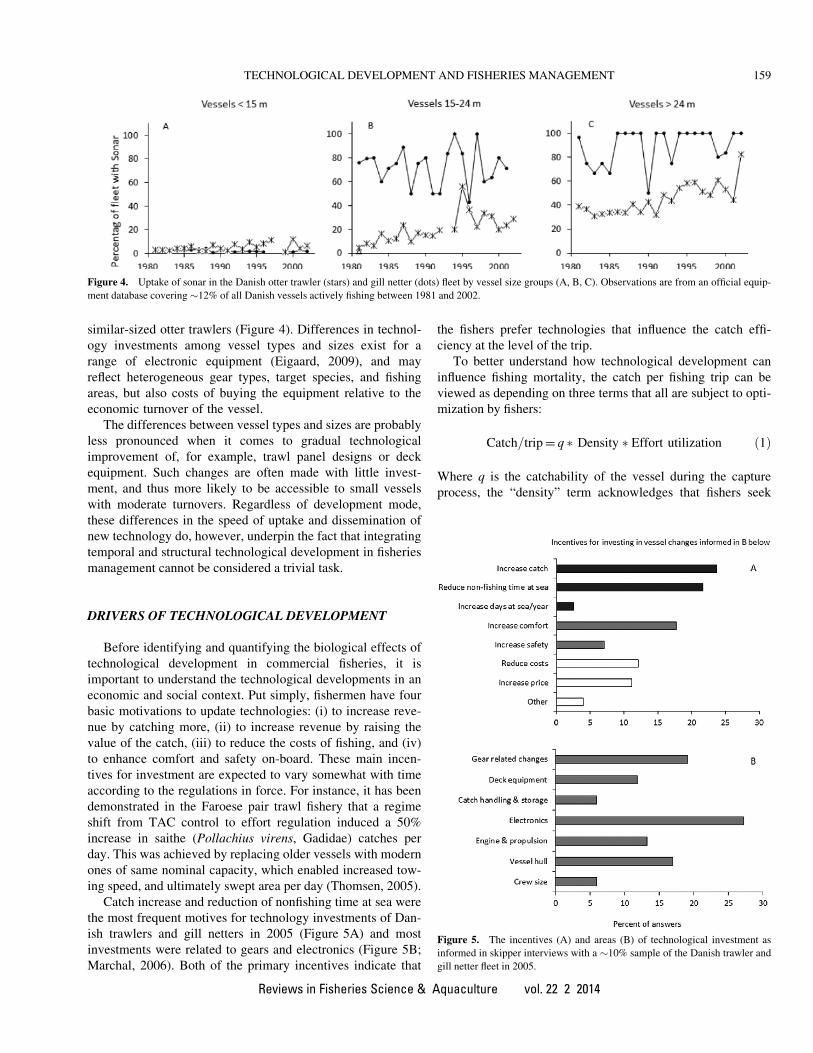
similar-sized otter trawlers (Figure 4). Differences in technol-
ogy investments among vessel types and sizes exist for a
range of electronic equipment (Eigaard, 2009), and may
reflect heterogeneous gear types, target species, and fishing
areas, but also costs of buying the equipment relative to the
economic turnover of the vessel.
The differences between vessel types and sizes are probably
less pronounced when it comes to gradual technological
improvement of, for example, trawl panel designs or deck
equipment. Such changes are often made with little invest-
ment, and thus more likely to be accessible to small vessels
with moderate turnovers. Regardless of development mode,
these differences in the speed of uptake and dissemination of
new technology do, however, underpin the fact that integrating
temporal and structural technological development in fisheries
management cannot be considered a trivial task.
DRIVERS OF TECHNOLOGICAL DEVELOPMENT
Before identifying and quantifying the biological effects of
technological development in commercial fisheries, it is
important to understand the technological developments in an
economic and social context. Put simply, fishermen have four
basic motivations to update technologies: (i) to increase reve-
nue by catching more, (ii) to increase revenue by raising the
value of the catch, (iii) to reduce the costs of fishing, and (iv)
to enhance comfort and safety on-board. These main incen-
tives for investment are expected to vary somewhat with time
according to the regulations in force. For instance, it has been
demonstrated in the Faroese pair trawl fishery that a regime
shift from TAC control to effort regulation induced a 50%
increase in saithe (Pollachius virens, Gadidae) catches per
day. This was achieved by replacing older vessels with modern
ones of same nominal capacity, which enabled increased tow-
ing speed, and ultimately swept area per day (Thomsen, 2005).
Catch increase and reduction of nonfishing time at sea were
the most frequent motives for technology investments of Dan-
ish trawlers and gill netters in 2005 (Figure 5A) and most
investments were related to gears and electronics (Figure 5B;
Marchal, 2006). Both of the primary incentives indicate that
the fishers prefer technologies that influence the catch effi-
ciency at the level of the trip.
To better understand how technological development can
influence fishing mortality, the catch per fishing trip can be
viewed as depending on three terms that all are subject to opti-
mization by fishers:
Catch=tripD q � Density � Effort utilization ð1Þ
Where q is the catchability of the vessel during the capture
process, the “density” term acknowledges that fishers seek
Figure 4. Uptake of sonar in the Danish otter trawler (stars) and gill netter (dots) fleet by vessel size groups (A, B, C). Observations are from an official equip-
ment database covering �12% of all Danish vessels actively fishing between 1981 and 2002.
Figure 5. The incentives (A) and areas (B) of technological investment as
informed in skipper interviews with a �10% sample of the Danish trawler and
gill netter fleet in 2005.
TECHNOLOGICAL DEVELOPMENT AND FISHERIES MANAGEMENT 159
Reviews in Fisheries Science & Aquaculture vol. 22 2 2014

particular grounds with high abundance of fish using various
types of electronic equipment, and the “effort utilization” term
designates the proportion of the trip that is actually used for
the searching and capture processes.
The catchability, q, is typically influenced by technological
improvements of the gear deployed, although other factors
(e.g., skipper skills) can also be important. The introduction of
twin trawling is an example of a gear-related change in catch-
ability that happened in many demersal fisheries during the
last approx. 25 years (Rihan, 2005; Marchal et al., 2007).
Twin trawling affects catch through direct changes in q
because it increases the total wing end spread of the gear
(Sainsbury, 1996). Similarly, the increase in engine power in
the Dutch beam trawl fleet (Figure 2) allowed an increase in
fishing speed, gear width, and the application of tickler chains
to chase the flatfish out of the sea bed (Rijnsdorp et al., 2008).
Other gear-related technological developments with influence
on catchability took place in pelagic trawl designs (Rahikainen
and Kuikka, 2002) and in the use of thinner and stronger syn-
thetic materials for trawl netting which reduced the drag of the
trawl, allowing reduced fuel consumption, faster towing speed,
and larger trawl size (Eigaard et al., 2011b). Gill net efficiency
has also improved substantially through the introduction of
synthetic fibers used for thinner, stronger, and more transpar-
ent filaments (Valdemarsen, 2001).
The “density” term is influenced by electronic develop-
ments or devices to aggregate fish. Electronics allow faster
and more precise location of productive fishing grounds, facili-
tates the finding of fish aggregations, and provides improved
possibilities for avoiding undersea obstacles such as wrecks or
isolated reefs that might otherwise damage towed gear. The
most obvious technological developments are echo-sounders
and sonars which are used for detection of fish shoals and sea
bed type and morphology, and GPS and plotters that are used
for positioning. As an example GPS and plotters had resulted
in a 12% increase in vessel fishing power three years after their
introduction in the Australian tiger prawn fishery (Robins
et al., 1998). However, another study (Mah�evas et al., 2011)
did not find any significant effect on catchability from the
introduction of GPS in four demersal North Sea fisheries, thus
illustrating the necessity to interpret each technology in a fish-
ery specific context. Part of the explanation is probably that in
the North Sea, the GPS can be considered a replacement of an
existing “Decca navigator” system, whereas in most Austra-
lian coasts there was no such system before the GPS introduc-
tion. Another area where electronics have affected efficiency
via the “density” term is the increased precision in maneuver-
ing and fine-scale navigation. This makes it possible for ves-
sels to fish in previously “nonfishable” areas, for example,
stone reefs and areas close to rocks and wrecks, and will allow
fishers to stay put and return to high-density locations, which
may increase the catch rate by as much as 20% (Rijnsdorp
et al., 2011). The relatively rapid uptake of sonars by large
Danish gillnetters (Figure 4), who use sonar for positioning
their nets close to wrecks, is an example of this (Eigaard,
2009). New designs in trawl ground gears such as bobbins and
rock hoppers have also contributed to increase the number
accessible fishing grounds. In theory, such expansions of the
fishable area (or proportion of population exploited) should
only result in a temporary increase in catch until the density of
the previously unfished area is reduced to the level characteris-
tic for the entire fishable area. However, habitats such as
wrecks have been shown to continuously attract fish such as
cod (Wilhelmsson et al., 2006; Arena et al., 2007) and it
seems therefore reasonable to assume that improved fine scale
navigation has created a permanent availability increase. Arti-
ficial light to attract fish and improve catch efficiency has been
used since prehistoric times (Galili and Rosen, 2008). At pres-
ent, it is used for instance in fisheries for pelagic schooling
fish and in squid jigging (van Oostenbrugge et al., 2002; Max-
well et al., 2004). Another important method to attract fish is
the use of fish aggregation devices (FADs). Since the 1960s,
floating objects have been increasingly used to increase the
catch efficiency of purse seine fisheries by aggregating tuna
species (Dagorn et al., 2014).
The “effort utilization” term is typically influenced by devel-
opment of deck equipment such as drums and winches. In many
fleets, the automation of catch sorting trays and introduction of
powered conveyor belts for efficient sorting has resulted in
faster on board preprocessing of the catch. In addition,
increased durability of gears and improved electronic equip-
ment have reduced nonfishing time at sea and increased vessel
efficiency substantially over time (Thomsen, 2005; Rijnsdorp
et al., 2008). Verbal information fromDanish fishermen indicate
a doubling of actual fishing time over nonfishing time in
25 years in the Danish seine fishery, owing mainly to the
development of hydraulics and seine rope winches (Figure 6).
Although the primary incentives for technological develop-
ment on board fishing vessels are related to catch increases,
supposedly fishing mortality, neutral motives of increasing
comfort and safety are relatively widespread drivers of techno-
logical development on board Danish demersal trawlers and
gill netters (Figure 5A). Even technological investments
which can be expected to result in reduced fishing mortality,
such as decreasing variable costs through reductions in crew
size, downscaling gear size, or lowering towing speed to
reduce fuel costs, are not infrequent (Figure 5A).
Figure 6. Illustration of how technological development on board Danish
seiners has led to a substantial change in the effort utilization at sea and conse-
quently in catch efficiency, from 1975 to 2003.
160 O. R. EIGAARD ET AL.
Reviews in Fisheries Science & Aquaculture vol. 22 2 2014

Table
1Suggestedim
proved
descriptors
ofeffectiveeffortforseven
mainvesseltypes
based
onthedefinitionofeffortas
afunctionofcapacityandactivity(Figure
1)andtheconceptoftechnological
influence
oncatchabilitythrougheither
q,density,oreffortutilization
Characteristics
Optimaldescriptors
Availabledescriptors
Suggesteddescriptors
Fisheries
type
Detection
Characteristics
oftarget
species
Main
catchability
factor
Effort
measure
Capacity
measure
Activity
measure
Mainshort-
comings
logbookProxy
forcapacity
logbookProxy
foractivity
Additional
proxy
short-
comings
New
logbook
variables
Suggested
effort
descriptor
Dem
ersal
seiners
“blind
fishing”
Nonschooling
herding
Gearsize
m2fished
Seinerope
length
Haulnumber
q(e.g.,ground
gear,seine
design)
Kilowatt,boat
size
(Loa,
GRT)
Hoursof
fishing
Trendsin
effort
utilization
(i)Seinerope
length
(ii)
number
of
hauls
Loa�
rope-
length
�
haul
number
Pelagic/
purse
seiners
Searching
Schooling
Sonar
range,
Spotter
planes,
FADs
m2searched
Sonar
range
Distance
searched
q(e.g.,seine
design)
Kilowatt,boat
size
(Loa,
GRT)
Hoursof
fishing
None
(i)Sonar
range
(ii)loading
capacity
Sonar
range�
loading
capacity�
distance
searched
Dem
ersal
traw
lers
“blind
fishing”
Nonschooling
Herding
andnon-
herding
Gearsize
(i)m
2fished
(ii)m
2
fished
(iii)
m3fished
�
(i)doorspread
(ii)ground
gearlength
(iii)traw
l
mouth
area
Distance
traw
led
q(e.g.,ground
gear,traw
l
design)
Kilowatt,boat
size
(Loa,
GRT)
Hoursof
fishing
Trendsin
effort
utilization
(i)Door
spread/
ground
gearlength/
traw
l
mouth
area
(ii)
traw
ling
speed(iii)
traw
ling
time
Loa�
Door
spread/
ground
gearlength/
traw
l
mouth
area
�
traw
led
distance
Pelagic
traw
lers
Searching
schooling
Sonar
range
m2searched
Sonar
range
Distance
searched
q(e.g.,traw
l
design)
Kilowatt,boat
size
(Loa,
GRT)
Hoursof
fishing
None
(i)Sonar
range
(ii)loading
capacity
Sonar
range�
loading
capacity�
distance
searched
Beam traw
lers
“blind
fishing”
Nonschooling
Gearsize
m2fished
Totalbeam
width
Distance
traw
led
q(e.g.,
ticklers,
schafers)
Kilowatt,boat
size
(Loa,
GRT)
Hoursof
fishing
Trendsin
effort
utilization
(i)Trawling
speed(ii)
Trawling
time
Loa�
Beam
width
�
traw
led
distance
Gillnetters
“blind
fishing”
Active
swim
ming
Gearsize
m1fished
Length
ofnets
set
Number
of
sets
q(e.g.,net-
ting
material,
diameter)
Kilowatt,boat
size
(Loa,
GRT)
Hoursof
fishing
Trendsin
effort
utilization
(i)Metersof
netset(ii)
setsper
trip
Loa�
Length
ofnets�
number
of
sets
Long liners
“blind
fishing”
Predatory
Gearsize
Hooksfished
Number
of
hooksset
Number
of
sets
q(e.g.,hook
design,bait
used)
Kilowatt,boat
size
(Loa,
GRT)
Hoursof
fishing
Trendsin
effort
utilization
(i)Hooksper
set(ii)sets
per
trip
Loa�Number
ofhooks�
number
ofsets
� Insomedem
ersaltraw
lfisheries,traw
lheightisan
importantcomponentofgearefficiency,e.g.,Sandeelfisheryandnorthernshrimpfishery.
Loa:Length
overall.GRT:Gross
registertonnes.
Reviews in Fisheries Science & Aquaculture vol. 22 2 2014
In short, the processes driving technological development and
the resulting influence on fishing mortality are of a very com-
plex nature. Therefore, the integration of technological creep
in management regimes requires more insight into the causal-
ity of individual technologies in relation to different vessel
types, target species, and conservation aspects.
Commercial fishers use a variety of fishing techniques,
which are adapted to the characteristics of the species they tar-
get. Table 1 gives an overview of the main types of fisheries
and the main factors affecting catchability. The characteristics
of the target species determine to a large extent the technologi-
cal characteristics affecting catchability. Hence, for the fisher-
ies targeting pelagic schooling fish, the detection of the fish
schools with fish finders is more critical than the actual catch-
ing process. For demersal species which have a less heteroge-
neous distribution, and which cannot always be detected using
fish finders, catchability is mainly determined by the area
swept. The response of the fish will also influence catchability.
Fish may swim away from the fishing lines allowing them to
be herded and concentrated in the mouth of the trawl. The
catchability of demersal species that can be herded will be
more related to the door spread of the bottom trawl, while
the catchability of species that cannot be herded will be more
related to the wing spread (Somerton, 2004; Eigaard et al.,
2011b). The catchability for flatfish, digging into the sea bed
to escape disturbance, will be affected by sea bed contact of
the gear, and in particular by the use of tickler chains that dig
into the sea bed (Creutzberg et al., 1987). The catchability for
fish who escape by swimming upwards in the water column
will be more affected by the length and position of the head-
line, while species with a downward response will be affected
by the length and sea bed contact of the ground rope (Main
and Sangster, 1982).
Put simply, Table 1 is intended as a first step to move the
most important components from non-measurable inputs into
the measurable inputs to the fisheries system (Figure 1) in order
to improve the relationship between fishing effort and F. The
table entries should be treated as starting points for a discussion
of the variables and vessel/fishery groupings that should be
included in monitoring of fishing effort in order to achieve
more valid descriptors of effective capacity, activity, and effort.
TEMPORAL PATTERNS OF CATCHABILITY CHANGEFROM TECHNOLOGICAL DEVELOPMENT
Technological development may either result in an immedi-
ate and marked change in catchability or in smaller stepwise
improvements of q, density, or effort utilization, which in
combination can cause a noticeable increase in vessel harvest-
ing capacity with time. Often catchability changes are pre-
sented as estimates of annual changes in overall fleet
efficiency relative to reference points such as stock indices,
reference fleets (vessels that have changed little over time;
Banks et al., 2002; Damalas et al., 2014), or production
frontiers (vessels that have been the most efficient over time;
Pascoe et al., 2003; Guttormsen and Roll, 2011).
The overall effects of technologically driven catchability
change in commercial fisheries are widely recognized
(Standal, 2005; Branch et al., 2006a). Also the European Com-
mission (EC) acknowledges that harvesting capacity increases
with time (EC, 2008) and that disregarding technological creep
will most likely result in excess fishing capacity and an
increased mismatch between nominal and effective capacity.
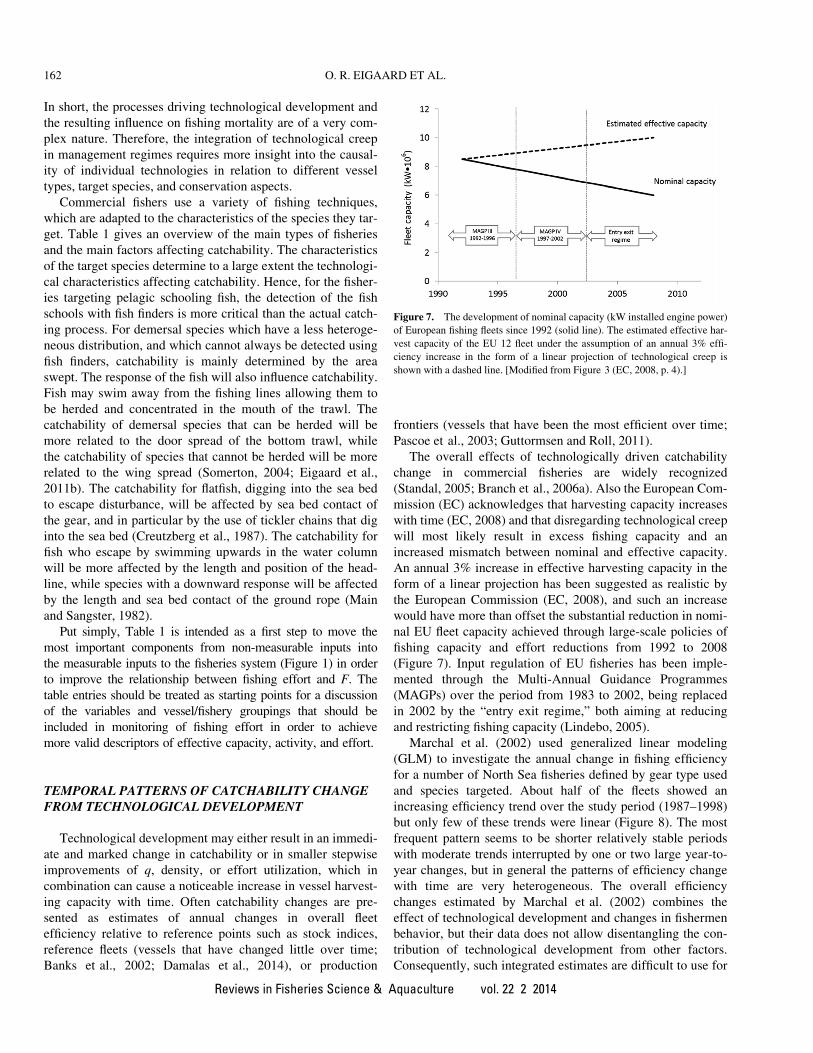
An annual 3% increase in effective harvesting capacity in the
form of a linear projection has been suggested as realistic by
the European Commission (EC, 2008), and such an increase
would have more than offset the substantial reduction in nomi-
nal EU fleet capacity achieved through large-scale policies of
fishing capacity and effort reductions from 1992 to 2008
(Figure 7). Input regulation of EU fisheries has been imple-
mented through the Multi-Annual Guidance Programmes
(MAGPs) over the period from 1983 to 2002, being replaced
in 2002 by the “entry exit regime,” both aiming at reducing
and restricting fishing capacity (Lindebo, 2005).
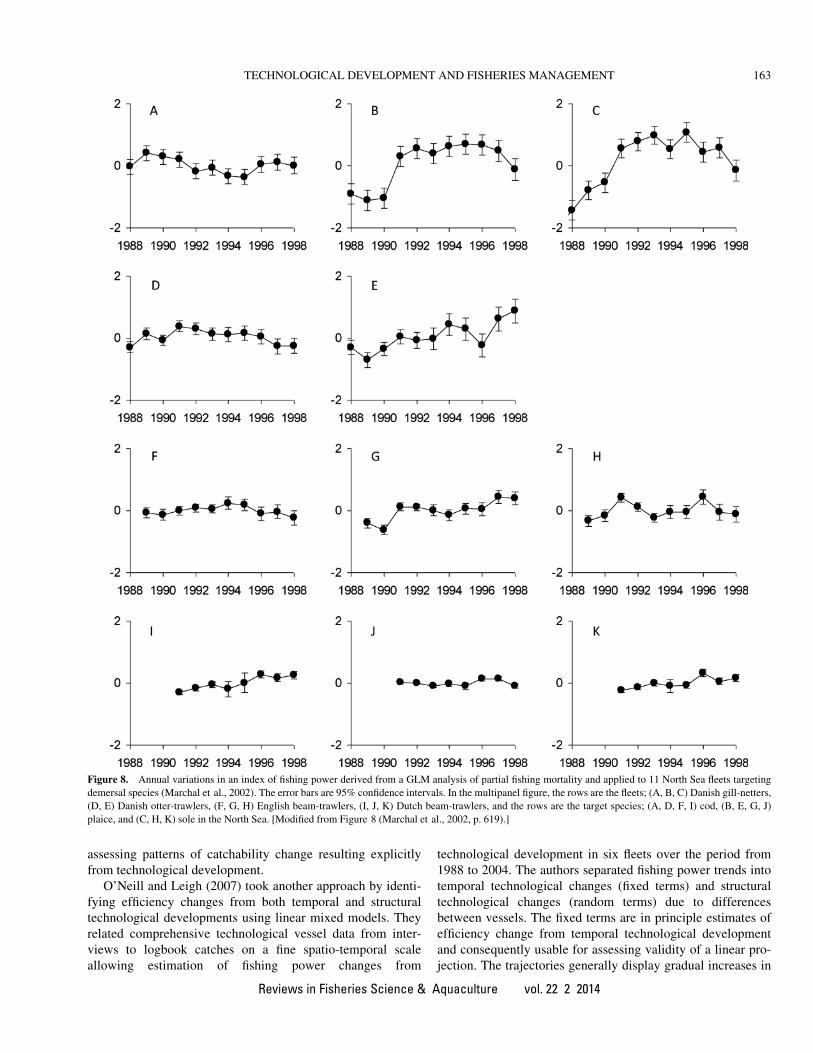
Marchal et al. (2002) used generalized linear modeling
(GLM) to investigate the annual change in fishing efficiency
for a number of North Sea fisheries defined by gear type used
and species targeted. About half of the fleets showed an
increasing efficiency trend over the study period (1987–1998)
but only few of these trends were linear (Figure 8). The most
frequent pattern seems to be shorter relatively stable periods
with moderate trends interrupted by one or two large year-to-
year changes, but in general the patterns of efficiency change
with time are very heterogeneous. The overall efficiency
changes estimated by Marchal et al. (2002) combines the
effect of technological development and changes in fishermen
behavior, but their data does not allow disentangling the con-
tribution of technological development from other factors.
Consequently, such integrated estimates are difficult to use for
Figure 7. The development of nominal capacity (kW installed engine power)
of European fishing fleets since 1992 (solid line). The estimated effective har-
vest capacity of the EU 12 fleet under the assumption of an annual 3% effi-
ciency increase in the form of a linear projection of technological creep is
shown with a dashed line. [Modified from Figure 3 (EC, 2008, p. 4).]
162 O. R. EIGAARD ET AL.
Reviews in Fisheries Science & Aquaculture vol. 22 2 2014
assessing patterns of catchability change resulting explicitly
from technological development.
O’Neill and Leigh (2007) took another approach by identi-
fying efficiency changes from both temporal and structural
technological developments using linear mixed models. They
related comprehensive technological vessel data from inter-
views to logbook catches on a fine spatio-temporal scale
allowing estimation of fishing power changes from
technological development in six fleets over the period from
1988 to 2004. The authors separated fishing power trends into
temporal technological changes (fixed terms) and structural
technological changes (random terms) due to differences
between vessels. The fixed terms are in principle estimates of
efficiency change from temporal technological development
and consequently usable for assessing validity of a linear pro-
jection. The trajectories generally display gradual increases in
Figure 8. Annual variations in an index of fishing power derived from a GLM analysis of partial fishing mortality and applied to 11 North Sea fleets targeting
demersal species (Marchal et al., 2002). The error bars are 95% confidence intervals. In the multipanel figure, the rows are the fleets; (A, B, C) Danish gill-netters,
(D, E) Danish otter-trawlers, (F, G, H) English beam-trawlers, (I, J, K) Dutch beam-trawlers, and the rows are the target species; (A, D, F, I) cod, (B, E, G, J)
plaice, and (C, H, K) sole in the North Sea. [Modified from Figure 8 (Marchal et al., 2002, p. 619).]
TECHNOLOGICAL DEVELOPMENT AND FISHERIES MANAGEMENT 163
Reviews in Fisheries Science & Aquaculture vol. 22 2 2014
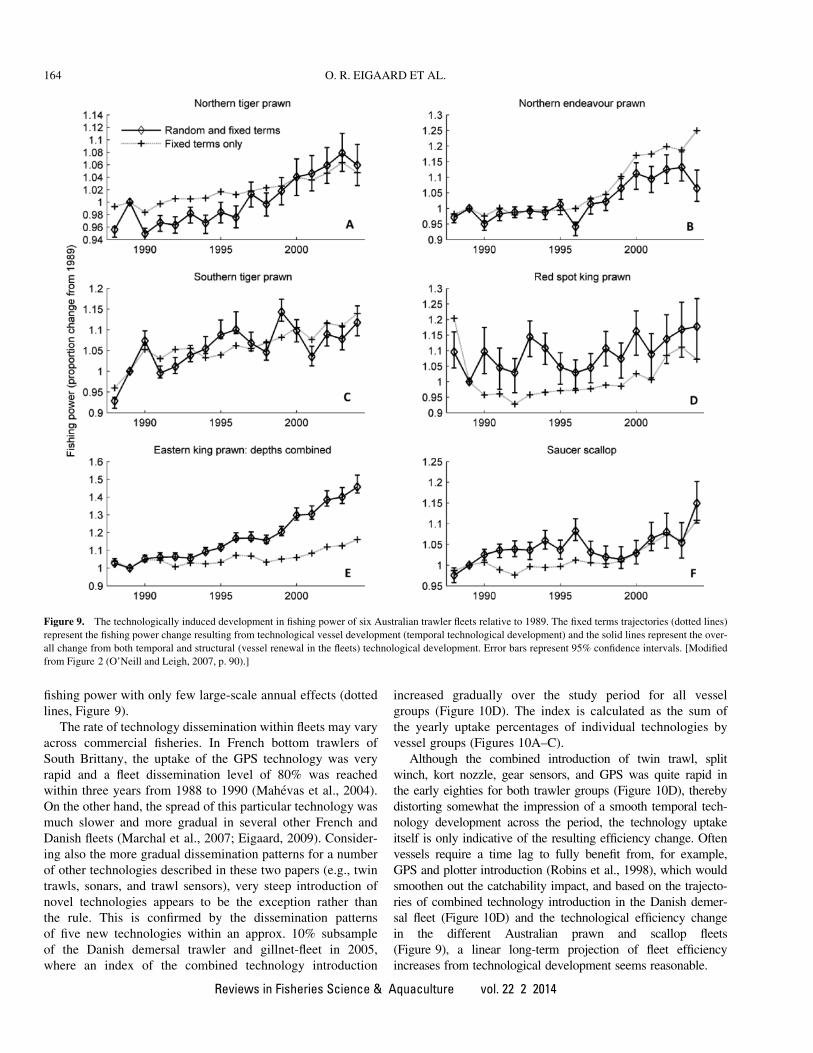
fishing power with only few large-scale annual effects (dotted
lines, Figure 9).
The rate of technology dissemination within fleets may vary
across commercial fisheries. In French bottom trawlers of
South Brittany, the uptake of the GPS technology was very
rapid and a fleet dissemination level of 80% was reached
within three years from 1988 to 1990 (Mah�evas et al., 2004).On the other hand, the spread of this particular technology was
much slower and more gradual in several other French and
Danish fleets (Marchal et al., 2007; Eigaard, 2009). Consider-
ing also the more gradual dissemination patterns for a number
of other technologies described in these two papers (e.g., twin
trawls, sonars, and trawl sensors), very steep introduction of
novel technologies appears to be the exception rather than
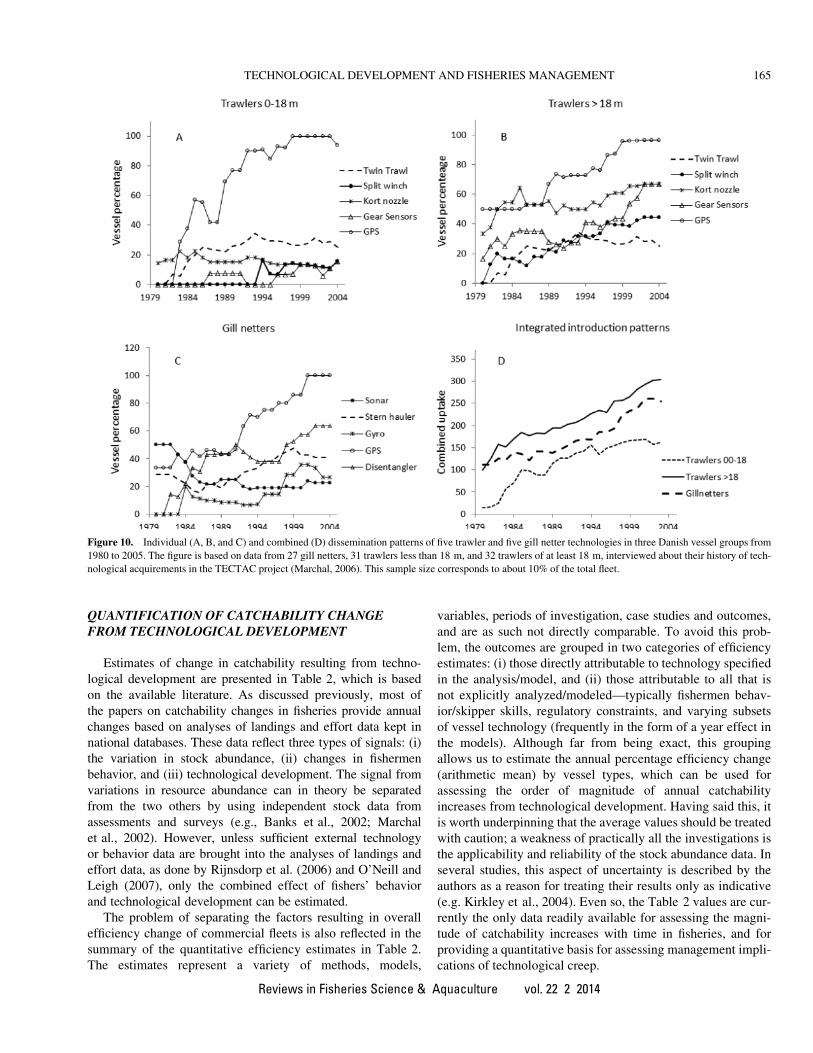
the rule. This is confirmed by the dissemination patterns
of five new technologies within an approx. 10% subsample
of the Danish demersal trawler and gillnet-fleet in 2005,
where an index of the combined technology introduction
increased gradually over the study period for all vessel
groups (Figure 10D). The index is calculated as the sum of
the yearly uptake percentages of individual technologies by
vessel groups (Figures 10A–C).
Although the combined introduction of twin trawl, split
winch, kort nozzle, gear sensors, and GPS was quite rapid in
the early eighties for both trawler groups (Figure 10D), thereby
distorting somewhat the impression of a smooth temporal tech-
nology development across the period, the technology uptake
itself is only indicative of the resulting efficiency change. Often
vessels require a time lag to fully benefit from, for example,
GPS and plotter introduction (Robins et al., 1998), which would
smoothen out the catchability impact, and based on the trajecto-
ries of combined technology introduction in the Danish demer-
sal fleet (Figure 10D) and the technological efficiency change
in the different Australian prawn and scallop fleets
(Figure 9), a linear long-term projection of fleet efficiency
increases from technological development seems reasonable.
Figure 9. The technologically induced development in fishing power of six Australian trawler fleets relative to 1989. The fixed terms trajectories (dotted lines)
represent the fishing power change resulting from technological vessel development (temporal technological development) and the solid lines represent the over-
all change from both temporal and structural (vessel renewal in the fleets) technological development. Error bars represent 95% confidence intervals. [Modified
from Figure 2 (O’Neill and Leigh, 2007, p. 90).]
164 O. R. EIGAARD ET AL.
Reviews in Fisheries Science & Aquaculture vol. 22 2 2014
QUANTIFICATION OF CATCHABILITY CHANGEFROM TECHNOLOGICAL DEVELOPMENT
Estimates of change in catchability resulting from techno-
logical development are presented in Table 2, which is based
on the available literature. As discussed previously, most of
the papers on catchability changes in fisheries provide annual
changes based on analyses of landings and effort data kept in
national databases. These data reflect three types of signals: (i)
the variation in stock abundance, (ii) changes in fishermen
behavior, and (iii) technological development. The signal from
variations in resource abundance can in theory be separated
from the two others by using independent stock data from
assessments and surveys (e.g., Banks et al., 2002; Marchal
et al., 2002). However, unless sufficient external technology
or behavior data are brought into the analyses of landings and
effort data, as done by Rijnsdorp et al. (2006) and O’Neill and
Leigh (2007), only the combined effect of fishers’ behavior
and technological development can be estimated.
The problem of separating the factors resulting in overall
efficiency change of commercial fleets is also reflected in the
summary of the quantitative efficiency estimates in Table 2.
The estimates represent a variety of methods, models,
variables, periods of investigation, case studies and outcomes,
and are as such not directly comparable. To avoid this prob-
lem, the outcomes are grouped in two categories of efficiency
estimates: (i) those directly attributable to technology specified
in the analysis/model, and (ii) those attributable to all that is
not explicitly analyzed/modeled—typically fishermen behav-
ior/skipper skills, regulatory constraints, and varying subsets
of vessel technology (frequently in the form of a year effect in
the models). Although far from being exact, this grouping
allows us to estimate the annual percentage efficiency change
(arithmetic mean) by vessel types, which can be used for
assessing the order of magnitude of annual catchability
increases from technological development. Having said this, it
is worth underpinning that the average values should be treated
with caution; a weakness of practically all the investigations is
the applicability and reliability of the stock abundance data. In
several studies, this aspect of uncertainty is described by the
authors as a reason for treating their results only as indicative
(e.g. Kirkley et al., 2004). Even so, the Table 2 values are cur-
rently the only data readily available for assessing the magni-
tude of catchability increases with time in fisheries, and for
providing a quantitative basis for assessing management impli-
cations of technological creep.
Figure 10. Individual (A, B, and C) and combined (D) dissemination patterns of five trawler and five gill netter technologies in three Danish vessel groups from
1980 to 2005. The figure is based on data from 27 gill netters, 31 trawlers less than 18 m, and 32 trawlers of at least 18 m, interviewed about their history of tech-
nological acquirements in the TECTAC project (Marchal, 2006). This sample size corresponds to about 10% of the total fleet.
TECHNOLOGICAL DEVELOPMENT AND FISHERIES MANAGEMENT 165
Reviews in Fisheries Science & Aquaculture vol. 22 2 2014

Table 2 Summary of whole-fishery estimates of annual efficiency changes in commercial fisheries. Some of the entries by vessel type are aggregate estimates of
two or three separate estimates by species. The estimates represent a variety of methods, models, and outcomes, and are as such not directly comparable, but a
crude grouping in technology related estimates and overall estimates (technology, behavioral and regulation related) is made to allow the extraction of average
values (arithmetic mean)
Vessel type Reference Outcome Methodology Case study Time period
Tech-related
change (%)
Overall
change (%)
Otter trawlers Banks et al., 2002 Technical efficiency Econometric DK-Baltic cod 1987–1999 1.8 0
Otter trawlers Braccini et al., 2012 Fishing power GLMM AU-Queensland
eastern prawn
1988–2004 0.7 2.3
Otter trawlers Kirkley et al., 2004 Technical efficiency Econometric F-S�ete Mediterranean
trawlers
1985–1999 1 ¡3.0
Otter trawlers Marchal et al., 2002 Fishing Power GLM DK-Baltic Sea cod 1987–1999 2.0
Otter trawlers Marchal et al., 2002 Fishing power GLM DK-North Sea
demersal 0–300
HP
1987–1998 0
Otter trawlers Marchal et al., 2002 Fishing power GLM DK-North Sea
demersal> 300
HP
1987–1998 8.0
Otter trawlers Marchal et al., 2002 Fishing power GLM NO- North Sea
demersal 0–1,000
HP
1980–1998 6.8
Otter trawlers Marchal et al., 2002 Fishing power GLM NO-North Sea
demersal 1,000–
2,000 HP
1980–1998 6.8
Otter trawlers Marchal et al., 2002 Fishing power GLM NO-North Sea
demersal 2,000–
3,000 HP
1980–1998 2.0
Otter trawlers O’Neill and Leigh,
2007
Fishing power GLMM AU-Queensland
northern prawn
1988–2004 0.3 0.4
Otter trawlers O’Neill and Leigh,
2007
Fishing power GLMM AU-Queensland
endeavor prawn
1988–2004 1.7 0.4
Otter trawlers O’Neill and Leigh,
2007
Fishing power GLMM AU-Queensland
southern prawn
1988–2004 0.9 0.7
Otter trawlers O’Neill and Leigh,
2007
Fishing power GLMM AU-Queensland red
spot prawn
1988–2004 0.5 1.1
Otter trawlers O’Neill and Leigh,
2007
Fishing power GLMM AU-Queensland
eastern prawn
1988–2004 1 2.9
Otter trawlers O’Neill and Leigh,
2007
Fishing power GLMM AU-Queensland -
Saucer scallop
1988–2004 0.7 1.0
Otter trawlers Bjørndal et al., 2003 Technical efficiency Econometric UK-North Sea 1990–2000 2.6
Otter trawlers Pascoe et al., 2003 Technical efficiency Econometric UK-Channel 1993–1998 4.8
Otter trawlers Hutton et al., 2003 Technical efficiency Econometric UK-North Sea cod,
haddock, saithe
1990–2000 0.5
Otter trawlers Hutton et al., 2003 Technical efficiency Econometric UK-North Sea
Nephrops
1990–2000 6.2
Average 1.0 2.4
Beam trawlers Banks et al., 2002 Technical efficiency Econometric NL-North Sea 1983–1998 0.8
Beam trawlers Marchal et al., 2002 Fishing power GLM UK-North Sea 1989–1998 ¡2.1
Beam trawlers Marchal et al., 2002 Fishing power GLM NL-North Sea 0–300
HP
1991–1998 3.0
Beam trawlers Marchal et al., 2002 Fishing power GLM NL-North Sea > 300
HP
1991–1998 4.7
Beam trawlers Rijnsdorp et al., 2006 Partial F GLM NL-North Sea 1990–2003 2.0 2.2
Beam trawlers Bjørndal et al., 2003 Technical efficiency Econometric UK-North Sea 1990–2000 ¡1.0
Beam trawlers Pascoe et al., 2003 Technical efficiency Econometric UK-Channel 1993–1998 0
Beam trawlers Hutton et al., 2003 Technical efficiency Econometric UK-North Sea 1990–2000 0
Average 2.0 1.0
Gill netters Marchal et al., 2001 Fishing Power GLM DK-Baltic cod 1987–1999 6.0
Gill netters Marchal et al., 2002 Fishing power GLM DK-North Sea 1987–1998 9.5
Gill netters Marchal et al., 2002 Fishing power GLM UK-North Sea 1989–1998 ¡4.4
(Continued on next page)
166 O. R. EIGAARD ET AL.
Reviews in Fisheries Science & Aquaculture vol. 22 2 2014
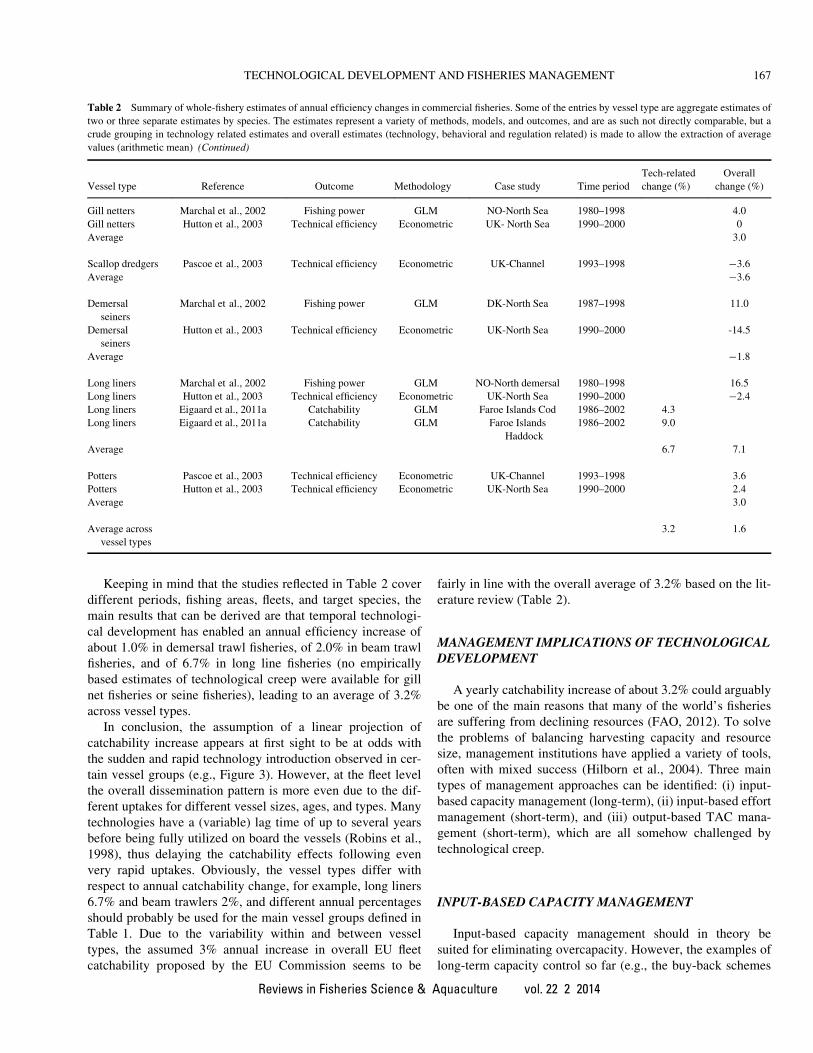
Keeping in mind that the studies reflected in Table 2 cover
different periods, fishing areas, fleets, and target species, the
main results that can be derived are that temporal technologi-
cal development has enabled an annual efficiency increase of
about 1.0% in demersal trawl fisheries, of 2.0% in beam trawl
fisheries, and of 6.7% in long line fisheries (no empirically
based estimates of technological creep were available for gill
net fisheries or seine fisheries), leading to an average of 3.2%
across vessel types.
In conclusion, the assumption of a linear projection of
catchability increase appears at first sight to be at odds with
the sudden and rapid technology introduction observed in cer-
tain vessel groups (e.g., Figure 3). However, at the fleet level
the overall dissemination pattern is more even due to the dif-
ferent uptakes for different vessel sizes, ages, and types. Many
technologies have a (variable) lag time of up to several years
before being fully utilized on board the vessels (Robins et al.,
1998), thus delaying the catchability effects following even
very rapid uptakes. Obviously, the vessel types differ with
respect to annual catchability change, for example, long liners
6.7% and beam trawlers 2%, and different annual percentages
should probably be used for the main vessel groups defined in
Table 1. Due to the variability within and between vessel
types, the assumed 3% annual increase in overall EU fleet
catchability proposed by the EU Commission seems to be
fairly in line with the overall average of 3.2% based on the lit-
erature review (Table 2).
MANAGEMENT IMPLICATIONS OF TECHNOLOGICALDEVELOPMENT
A yearly catchability increase of about 3.2% could arguably
be one of the main reasons that many of the world’s fisheries
are suffering from declining resources (FAO, 2012). To solve
the problems of balancing harvesting capacity and resource
size, management institutions have applied a variety of tools,
often with mixed success (Hilborn et al., 2004). Three main
types of management approaches can be identified: (i) input-
based capacity management (long-term), (ii) input-based effort
management (short-term), and (iii) output-based TAC mana-
gement (short-term), which are all somehow challenged by
technological creep.
INPUT-BASED CAPACITY MANAGEMENT
Input-based capacity management should in theory be
suited for eliminating overcapacity. However, the examples of
long-term capacity control so far (e.g., the buy-back schemes
Table 2 Summary of whole-fishery estimates of annual efficiency changes in commercial fisheries. Some of the entries by vessel type are aggregate estimates of
two or three separate estimates by species. The estimates represent a variety of methods, models, and outcomes, and are as such not directly comparable, but a
crude grouping in technology related estimates and overall estimates (technology, behavioral and regulation related) is made to allow the extraction of average
values (arithmetic mean) (Continued)
Vessel type Reference Outcome Methodology Case study Time period
Tech-related
change (%)
Overall
change (%)
Gill netters Marchal et al., 2002 Fishing power GLM NO-North Sea 1980–1998 4.0
Gill netters Hutton et al., 2003 Technical efficiency Econometric UK- North Sea 1990–2000 0
Average 3.0
Scallop dredgers Pascoe et al., 2003 Technical efficiency Econometric UK-Channel 1993–1998 ¡3.6
Average ¡3.6
Demersal
seiners
Marchal et al., 2002 Fishing power GLM DK-North Sea 1987–1998 11.0
Demersal
seiners
Hutton et al., 2003 Technical efficiency Econometric UK-North Sea 1990–2000 -14.5
Average ¡1.8
Long liners Marchal et al., 2002 Fishing power GLM NO-North demersal 1980–1998 16.5
Long liners Hutton et al., 2003 Technical efficiency Econometric UK-North Sea 1990–2000 ¡2.4
Long liners Eigaard et al., 2011a Catchability GLM Faroe Islands Cod 1986–2002 4.3
Long liners Eigaard et al., 2011a Catchability GLM Faroe Islands
Haddock
1986–2002 9.0
Average 6.7 7.1
Potters Pascoe et al., 2003 Technical efficiency Econometric UK-Channel 1993–1998 3.6
Potters Hutton et al., 2003 Technical efficiency Econometric UK-North Sea 1990–2000 2.4
Average 3.0
Average across
vessel types
3.2 1.6
TECHNOLOGICAL DEVELOPMENT AND FISHERIES MANAGEMENT 167
Reviews in Fisheries Science & Aquaculture vol. 22 2 2014

and the MAGPs of the CFP) have suffered from the same
inability to deal with catchability increases as short-term input
control, and have furthermore been vulnerable to efficiency
increases from changes in fleet composition (Lindebo, 2005).
Although structural technological development can take place
without being instigated by management initiatives, the rate at
which development takes place is increased by buy-back
schemes, where older, smaller vessels often become replaced
with newer, larger vessels within a fixed or reduced nominal
capacity limit (e.g., total fleet tonnage or total fleet kilowatt).
In addition, nominal capacity reduction in fleet level may thus
be undermined by the increased fishing power of the newer
and larger vessels in the restructured fleet (Hilborn, 1985; Pas-
coe and Coglan 2000; Pascoe et al., 2001a). Consequently,
some projection of efficiency increases with time is needed to
account for the effects of technological creep on long-term
capacity control as also pointed out by the European Union
Commission (EC, 2008). Technological development can
result in effective capacity becoming more and more
decoupled from nominal capacity, and this is particularly so
when long-term capacity targets are accompanied by fleet
modernization programs. Eigaard (2009) demonstrated that
the level of technological equipment on board Danish trawlers
and gillnetters increases with vessel length and with decreas-
ing vessel age as well as with time. He also separated the two
main technological mechanisms driving the decoupling
between effective and nominal capacity: (1) structural techno-
logical development in fleet level (small, old vessels being
replaced with newer, larger, and better equipped ones) and, (2)
improvement of individual vessel and gear technology over
time. Both mechanisms are documented to increase fleet effi-
ciency in other studies (Pascoe et al., 2001a; Rijnsdorp et al.,
2006), and need to be explicitly addressed when launching
modernization programs and setting long-term capacity
targets.
INPUT-BASED EFFORT MANAGEMENT
The main advantages of short-term input-based effort man-
agement (e.g., a yearly effort restriction of days at sea) are
argued to be easy enforcement and monitoring, improved reg-
ulation legitimacy and compliance among fishermen, and lim-
ited incentives to discard, high-grade or misreport (Murawski
and Finn, 1986; Rossiter and Stead, 2003; Shepherd, 2003).
Consequently, the catch and effort data feeding into scientific
stock assessments would be more reliable, dumping and waste
of caught fish would be reduced, and intended fishing mortal-
ity would in principle better match realized fishing mortality
(Daan, 1997; Rijnsdorp et al., 2007). However, the main short-
coming of short-term input control of effort is that it relies
heavily on the ability to predict catchability changes, an ability
vulnerable to technological development and efficiency
changes (Stefansson and Rosenberg, 2005; J�akupsstovu et al.,
2007). Temporal technological development has in the past
offset reductions in allocated fishing days or capacity (Rossiter
and Stead, 2003; Catchpole et al., 2005), and projecting effi-
ciency increases and predicting the patterns of catchability
change are by no means trivial tasks. The inherent uncertainty
of mixed fisheries makes it even more difficult to match
intended and realized fishing mortality accurately (Rijnsdorp
et al., 2006; Ulrich et al., 2012), and this compromises the
achievement of management objectives. Another problematic
aspect of input control in mixed fisheries without catch limita-
tions is the ability of fishermen to target any fish species,
including high-value species with low stock levels (Rossiter
and Stead 2003; Eigaard et al., 2011a). Consequently, short-
term input control, particularly in mixed fisheries, requires
substantial additional regulation, including output control, as
well as the identification and quantification of appropriate
nominal effort descriptors and efficiency projections.
OUTPUT-BASED TAC MANAGEMENT
Output control may provide better agreement between
intended and realized fishing mortality than input control. This
requires, however, that the biomass estimates and projections
from which TACs are calculated are correct, and that TACs
are efficiently enforced. As a result, the main weaknesses of
output control are imprecise estimates of stock size owing to,
for example, misspecification of biological parameters, poor
coverage of surveys, and to over-quota catches due to discard-
ing or misreporting (Catchpole et al., 2005; Branch et al.,
2006a). If commercial catch per unit effort (CPUE) data are
used in the assessments, the setting of appropriate TACs can
also be seriously biased by catchability changes owing to (i)
technological development (Marchal et al., 2003; Eigaard and
Munch-Petersen, 2011), (ii) fishermen behavior such as
improved skipper skills, targeting behavior, and technical
interactions (Marchal et al., 2006; Poos and Rijnsdorp, 2007;
Fulton et al., 2011), and (iii) biological factors such as changes
in spatial distribution and availability of target species due to
environmental conditions (Horwood and Millner, 1998; Rose
and Kulka, 1999). As such, the undesired effects of technologi-
cal development are limited in output-controlled fisheries and
mainly restricted to inaccuracy within any stock assessment
model using commercial CPUE time series to tune. When this
is the case, assessment procedures should be scrutinized for
bias from fishing power trends on a regular basis and the time
series should be standardized accordingly (Braccini et al.,
2012).
DISCUSSION
Capacity Descriptors and Projections
The current measures of nominal capacity deployed in com-
mercial fisheries worldwide do not sufficiently well reflect the
168 O. R. EIGAARD ET AL.
Reviews in Fisheries Science & Aquaculture vol. 22 2 2014

actual harvesting capacity (effective capacity) of the fleets
(FAO, 2004; EC, 2008). Clearly, better descriptors are needed
to capture efficiency increases from structural change. Pascoe
et al. (2001b) included vessel size and engine power in a nom-
inal capacity expression, and evaluated its reliability by com-
paring it to a comprehensive fishing-capacity expression
generated by data envelopment analysis. The evaluation dem-
onstrated that the expression reasonably well approximated
the effective capacity of mobile gears, but not of static gears.
Another capacity expression (a capacity factor), used by
Standal (2007) to assess the success of the Norwegian unit
quota system, included a gear factor (single or double trawl)
along with an engine-power factor and three vessel-size factors
and revealed a substantial mismatch between nominal and
effective capacity in the Norwegian trawl fishery. Using inte-
grated capacity expressions, when planning, implementing,
and evaluating structural measures, would take into account
some of the unintended increases in harvesting capacity that
often accompanies directed capacity plans. According to the
model results in Eigaard (2009), the inclusion of vessel size
and vessel age in an integrated nominal capacity expression
would most likely account for fishing power increases result-
ing from technological development of fish-finding and navi-
gation-equipment. The importance of gear factors (e.g., single/
twin trawl and ground gear type) in describing catchability is
confirmed by the findings of Marchal et al. (2007) and of Reid
et al. (2011).
Based on the above-referred experiences vessel length, ves-
sel hp, and vessel age, in combination with some gear factors,
could in principle help refining the definition of capacity met-
rics for a number of fisheries. However, the practical applica-
tion of such an approach is compromised by three important
shortcomings.
First, appropriate gear factors may vary from one species to
another as summarized in Table 1 and also demonstrated in a
number of studies (e.g. O’Neill et al., 2003; Marchal et al.,
2007; Eigaard et al., 2011a,b).
Second, horsepower, tonnage, and vessel length are not
very good descriptors of effective capacity in fisheries with
static gears (Pascoe et al., 2001b; Marchal et al., 2002). There-
fore, a single capacity expression covering all commercial ves-
sel groups participating in the fishery is difficult to imagine
and a tradeoff is inevitable between the level of accuracy and
the need for an operational metric that can be easily monitored
and regulated. Different tradeoffs and suggestions for opera-
tional integrated capacity expressions for main vessel groups
are explored further, based on the descriptors in Table 1, and
summarized below in the section on technological challenges
to effort management.
Third, even if improved integrated fleet capacity descriptors
and projections could successfully be identified and imple-
mented, they would only mitigate the effect of structural techno-
logical developments (changes in fleet profiles). The temporal
(within vessel) technological development, and thus the future
efficiency changes from, for example, increased gear
catchability or improved fish finding and navigation equipment,
cannot be sufficiently captured no matter what the complexity
and accuracy of the capacity expressions of the present.
Effort Descriptors and Projections
The fishing effort term can be considered a combination of
fishing capacity and activity. This is consistent with Figure 1,
and reflects that most of the mismatch between nominal and
effective capacity discussed above has direct relevance for effort
management. This also implies that including more refined
capacity descriptors and projections of efficiency increase could
somehow alleviate the undesirable effects of technological creep
and might improve the performance of direct effort manage-
ment. Similar to fishing capacity, any mismatch between nomi-
nal and effective fishing activity would adversely alter the
performance of effort management. In the terminology estab-
lished in the opening sections, effective fishing activity trans-
lates to effort utilization at sea, which is strongly influenced by
technological development and can have substantial effect
on catch efficiency of seiners, trawlers, and beam trawlers
(Figure 6; Thomsen, 2005; Rijnsdorp et al., 2008).
The suggestions for improved effective effort descriptors
and additional logbook variables (Table 1) were established
with the objective of more accurately reflecting the main moti-
vation of fisheries to increase catches through optimizing q,
density, and effort utilization based on current technology.
However, no effort descriptor can capture the influence of tem-
poral technological development on the catchability of the
gears deployed in the future. Therefore, it seems realistic to
project increases in gear catchability over future time peri-
ods—at least for the five nonpelagic vessel types, where the
catch process is more important than the search process.
According to the results in Table 2, the magnitude of such a
projection of gear catchability increases would need to be
identified by each vessel/gear type and implies a research need
for developing methods for efficiency projections for input-
based management. The suggestions for accurate effort
descriptors (second last column, Table 1) have been made
under the assumption of full compliance from fishermen and
absence of technical data handling problems. This is a simplifi-
cation and if, for instance, the activity descriptors on a fine
scale (e.g., number of seine hauls per trip per area) are consid-
ered to be difficult to quantify, another option could be to
incorporate expected increases from improved effort utiliza-
tion with time in catchability projections. Such an approach
would enable using a more operational activity descriptor, for
example, days at sea, but it would also reduce the ability of
nominal effort descriptors to accurately reflect effective
effort—and it would require an intensive effort to quantify
valid-integrated projections by vessel group.
In this discussion, the increasing amount of VMS (Vessel
Monitoring System) data being generated and explored (Hint-
zen et al., 2012; Bastardie et al., 2013) should also be brought
TECHNOLOGICAL DEVELOPMENT AND FISHERIES MANAGEMENT 169
Reviews in Fisheries Science & Aquaculture vol. 22 2 2014
forward and these data point in the direction of effort descrip-
tors on a finer spatial and temporal scale. With the vessel
groupings and effective capacity and activity summary of
Table 1, the basis for identifying valid effort descriptors for
aggregate vessel groups is certainly improved. The sugges-
tions for effort descriptors, however, represent a tradeoff
between the accuracy in reflecting adverse biological effects
of very heterogeneous fisheries and the need for the effort
descriptors to be operational in terms of applicability and rou-
tine monitoring. Therefore, it remains to be seen whether such
aggregate descriptors are sufficiently robust to the species spe-
cific effects of many technologies (O’Neill et al., 2003;
Eigaard et al., 2011a,b) and of the skippers’ effect (Branch
and Hilborn, 2008; Quirijns et al., 2008). The more com-
plex and detailed the effort descriptors, the more difficult
it is for managers to monitor and enforce them. This is a
key issue and a potential problem of any effort regulation
system (Martell and Walters, 2002; Shepherd, 2003;
Rijnsdorp et al., 2007). Thus, the consequences of inaccu-
rate effort descriptors and quotas have recently been dem-
onstrated to result in an overfishing of Faroese cod and
haddock (Melanogrammus aeglefinus, Gadidae) stocks
(J�akupsstovu et al., 2007).
Accounting for Technological Creep in Stock Assessment
When time series of commercial CPUE data are
employed for stock assessment, either directly as an indica-
tor of fishable biomass or indirectly for tuning age-based
stock assessment models, technological development can
potentially bias assessment results and thus the scientific
basis for setting TACs in output controlled management
regimes (Maunder et al., 2006). If CPUE corrections for
technological creep are assessed to be necessary, different
approaches can be taken, depending among other on data
availability and the number of additional factors other than
abundance that need to be adjusted for (Maunder and Punt,
2004). Changes in fleet profiles, management regulations,
skipper skills, and in the availability of the species are
additional factors that can influence trends in catch rates
(Bishop et al., 2008).
In situations where only bias from technological creep
needs to be removed from commercially based abundance
indices, a simple bottom-up approach can be taken, where the
essential step is to obtain detailed information of technology
change of the time series. In some cases, technological infor-
mation can be obtained from logbooks or other official statis-
tics, but most often this step will require industry consultation
(Eigaard et al., 2011a; Braccini et al. 2012). Eigaard and
Munch-Petersen (2011) used net maker interviews to identify
substantial gear size increases of a CPUE time series used for
northern shrimp (Pandalus Borealis) stock assessment in the
North Sea. A significant engine power � trawl size relation-
ship was established from the interview data and
subsequently used in a GLM-standardization of the commer-
cial effort data, which resulted in a substantially altered per-
ception of stock size and trends. Comparable results on the
importance of scrutinizing commercial catch and effort have
been demonstrated for a number of prawn and scallop fisher-
ies in Australia (O’Neill et al., 2003; O’Neill and Leigh,
2007).
A similar approach can be used even if technological
creep is only one of more factors to correct for, but the tradi-
tional CPUE standardization tools such as GLMs, mixed
models, and generalized additive models (Maunder and Punt,
2004), can only correct for informed factors. As for technol-
ogy change, data for other factors is not always readily avail-
able. Therefore, relevant information (of, e.g., shifts in
management regimes or environmental conditions) from addi-
tional (non-logbook) sources is often required before correc-
tions can be made.
An alternative approach is to use methods that allow catch-
ability to vary over time within an assessment model such as
random walks, state space models, or other techniques that
model catchability as a function of time (Wilberg et al., 2010;
Thorson, 2011). These techniques do not ascribe causation or
separate the factors responsible for changes in catchability,
which is of course an advantage in relation to data require-
ments, but a weakness in relation to transparency and interpre-
tation of results. In this review, where technological
development itself is the subject of investigation, these meth-
ods are not dealt with in detail, but only mentioned briefly as
potential ways of correcting for technological creep in stock
assessments.
In assessments where technological creep is assessed to
be substantial and not feasible to correct for using one of
the above approaches—and fishery-independent data do
exist (e.g., research survey data or mark recapture data)—
another option is to rely entirely on the scientific data
(Thorson, 2011).
CONCLUSION
Whatever the management system in force, technological
development and catchability increases will occur. But even
though the development of technology is inevitable and
almost indifferent to the regulation type (Whitmarsh, 1990;
Eigaard et al., 2011a), the sensitivity of the different man-
agement strategies to the undesired effects of technological
development is far from identical. Focusing on the chal-
lenges caused by technological creep in relation to overca-
pacity, discarding, misreporting, and stock assessment, our
review suggests that management challenges from techno-
logical development seem more difficult to resolve for
input-oriented fisheries policies than for output-based ones.
Considering the heterogeneity of biological effects, the task
of achieving agreement between intended (effort restric-
tions) and realized fishing mortality appears particularly
170 O. R. EIGAARD ET AL.
Reviews in Fisheries Science & Aquaculture vol. 22 2 2014
difficult. The heterogeneity of the technological challenges
is not only restricted to the development of different tech-
nologies in different fisheries, or different use of the same
technologies in different fisheries (e.g., the use of sonar tech-
nology for fish finding in pelagics as well as for small scale
navigation in wreck fishing with gillnets), but also to species-
specific effects of the same technology development in the
same fishery. For instance, the combined development of
skewed hooks and swivel line in the Faroese long-line fishery
resulted in a 51% increase in haddock catchability but only
half that (26%) in cod catchability (Eigaard et al., 2011a).
Bearing this complexity in mind, and adding to it the need
to also identify and predict catchability changes from factors
such as targeting behavior, skipper skills, technical interac-
tions, compliance, contraction of the stocks, and environmen-
tal conditions, the pendulum of this review swings towards
favoring output control—and coping somehow with discards
and misreporting—rather than attempting to manage fishing
mortality levels through expected matching levels of fishing
effort. In this consideration, the need for proper enforcement
is acknowledged (Branch and Hilborn, 2008) and also recent
successful experiments with fully documented fisheries poten-
tially enabling transition from landing quotas to actual catch
quotas have played a part (Kindt-Larsen et al., 2011). Quota
transferability, in combination with discard bans and over
quota landing taxes may also improve catch-quota balancing
in mixed fisheries, and thereby provide appropriate incentives
to discourage over quota discards (Branch et al., 2006b;
Marchal et al., 2009; Poos et al., 2010).
If, however, the benefits of reduced discards, misreporting
and enforcement costs of short-term input control are assessed
more important than the relative insensitiveness of TAC man-
agement to the effects of technological creep (and the other
factors influencing catchability), it is crucial to equip such a
system with tools to counteract catchability increases from
technological development. Consequently, accurate and opera-
tional nominal descriptors of effective capacity and effort are
prerequisites of long- and short-term input control systems
and need to be supplemented with realistic long- and short-
term projections of efficiency increases from technological
development.
In addition to the management challenges discussed above,
aspects of technological development have also brought about
a number of positive contributions to commercial fisheries.
Thus, according to Gislason (2006), gear developments are
key requirements of moving toward an Ecosystem Approach
to Fisheries Management (EAFM). Various gears are increas-
ingly being modified to improve selectivity, minimize their
side effects on benthic habitats and fauna, and reduce
unwanted by-catch. Sorting grids, turtle exclusion devices
(TEDs), and escape windows have proven capable of reducing
by-catches and discards of trawlers, and are already mandatory
in a number of fisheries for fish and crustaceans (Valdemarsen
and Suuronen, 2003; Madsen et al., 2010; Eigaard et al.,
2012). Acoustic pingers, high-density filaments, and colored
netting can help reducing the entanglement of marine mam-
mals and sea birds in gill nets (Bull, 2007; Larsen et al., 2007;
Carlstr€om et al., 2009) and a series of changes in gear design
and operating practices has substantially reduced dolphin by-
catches in tuna seine fisheries (Hall, 1998). Also, the general
improvement of technology and vessel fishing power could
potentially be an environmental asset. This could be the case
in fisheries managed by TAC in combination with a well-mon-
itored ban on discard practices (Batsleer et al., 2013).
Increased efficiency would then reduce operating costs, as the
same allowed quantity of fish would be caught with less
effort (e.g., in fewer fishing days, less area swept, or using
less fuel), resulting in less environmental impact (Thom-
sen, 2005). In relation to meeting long-term sustainability
goals, the utility of the technological development in com-
mercial fisheries is, however, strongly dependent on the
regulations in force, and management should take care to
provide the right incentive base (Graham et al., 2007).
These latter conservation potentials of technological devel-
opment are numerous and deserve a thorough presentation,
but are only treated in a more rudimentary manner in this
review, where focus is on the task of accounting for the
above-described side effects of technological development
in modern fisheries management in order to better meet
sustainability objectives.
ACKNOWLEDGMENTS
Many thanks to Holger Hovgaard for having pointed out the
need to specifically address the role of technological develop-
ment in fisheries management and for having inspired us to
write this paper. The thorough and constructive criticism from
the anonymous reviewers is also greatly appreciated.
FUNDING
This work was partly funded by the EU-DG Fisheries through
the FP7 projects MYFISH (Maximising yield of fisheries
while balancing ecosystem, economic and social concerns)
and SOCIOEC (Socio economic effects of management
measures of the future CFP) and partly by the EU-Interreg
IVA–152207 project: “B€arekraftig rekefiske i Skagerrak”.
This support is gratefully acknowledged.
REFERENCES
Andersen, B. S., Ulrich, C., Eigaard, O. R., and Christensen, A. S.
Short-term choice behaviour in a mixed fishery: investigating
m�etier selection in the Danish gillnet fishery. ICES J. Mar. Sci.,
69: 131–143 (2012).
Arena, P., L. Jordan, R. Spieler, G. Relini, J. Ryland, and H. J.
Dumont. Fish assemblages on sunken vessels and natural reefs in
southeast Florida, USA, pp. 157–171. In: Biodiversity in Enclosed
TECHNOLOGICAL DEVELOPMENT AND FISHERIES MANAGEMENT 171
Reviews in Fisheries Science & Aquaculture vol. 22 2 2014
Seas and Artificial Marine Habitats, Vol. 193. Developments in
Hydrobiology (Dumont, H. J., Ed.). London: Springer (2007).
Banks, R., S. Cunningham, W. P. Davidse, E. Lindebo, A. Reed, E.
Sourisseau, and J. W. de Wilde. The impact of technological
progress on fishing effort. LEI Report, PR.02.01. Available from
http://applicaties.wageningenur.nl/wever.internet/applications/
leirapporten/defaultuk.aspx?id=284 [accessed 29 November 2013]
(2002).
Bastardie, F., J. R. Nielsen, B. S. Andersen, and O. R. Eigaard. Inte-
grating individual trip planning in energy efficiency – Building
decision tree models for Danish fisheries. Fish. Res., 143: 119–130
(2013).
Batsleer, J., J. J. Poos, P. Marchal, Y. Vermard, and A. D. Rijnsdorp.
Mixed fisheries management: protecting the weakest link. Mar.
Ecol. Prog. Ser., 479: 177–190 (2013).
Bishop, J., W. N. Venables, C. M. Dichmont, and D. J. Sterling. Stan-
dardizing cathc rates: is logbook information by itself enough?
ICES J. Mar. Sci., 65: 255–266 (2008).
Bjørndal, T., P. Koundouri, and S. Pascoe. Multi-Output Distance
Function for the North Sea Beam Trawl Fishery, pp. 125–146. In:
Multi-Output Measures of Technical Efficiency in EU Fisheries
(Pascoe, S., D. Tingley, and S. Mardle, Eds.), UK: CEMARE, Uni-
versity of Portsmouth. CEMARE Report 62 (2003).
Braccini, J. M., M. F. O’Neill, A. B. Campell, G. M. Leigh, and A. J.
Courtney. Fishing power and standardized catch rates: implications
of missing vessel-characteristic data from the Australian eastern
king prawn (Melicertus plebejus) fishery. Can. J. Fish. Aquat. Sci.,
69: 797–809 (2012).
Branch, T. A., R. Hilborn, and A. C. Haynie, et al. Fleet dynamics
and fishermen behaviour: lessons for fisheries managers. Can. J.
Fish. Aquat. Sci., 63: 1647–1668 (2006a).
Branch, T. A., and R. Hilborn. Matching catches to quotas in a multi-
species trawl fishery: targeting and avoidance behaviour under
individual transferable quotas. Can. J. Fish. Aquat. Sci., 65: 1435–
1446 (2008).
Branch, T. A., K. Rutherford, and R. Hilborn. Replacing trip limits
with individual transferable quotas: implications for discarding.
Mar. Policy, 30: 281–292 (2006b).
Bull, L. S. Reducing seabird bycatch in longline, trawl and gillnet
fisheries. Fish and Fisheries, 8: 31–56 (2007).
Catchpole, T. L., C. L. J. Frid, and T. S. Gray. Discards in North Sea
fisheries: causes, consequences and solutions. Mar. Policy, 29:
421–430 (2005).
Charles, A. T. Fishery science: the study of fishery systems. Aquat.
Living Resour., 8: 233–239 (1995).
Creutzberg, F., G. C. A. Duineveld, and G. J. Van Noort. The effect of
different number of tickler chains on beam trawl catches. ICES J.
Mar. Sci., 43: 159–168 (1987).
Cunningham, S., and D. Whitmarsh. Fishing effort and fisheries pol-
icy.Mar. Policy, 4: 309–316 (1980).
Daan, N. TAC management in North Sea flatfish fisheries. J. Sea Res.,
37: 321–341 (1997).
Dagorn, L., K. N. Holland, V. Restrepo, and G. Moreno. Is it good or
bad to fish with FADs? What are the real impacts of the use of
drifting FADs on pelagic marine ecosystems? Fish and Fisheries,
14: 391–415 (2014).
Damalas, D., C. D. Maravelias, and S. Kavadas. Advances in fishing
power: A study spanning 50 years. Rev. Fish. Sci., 22: 112–121
(2014).
EC. Reflections on further reform of the Common Fisheries Policy.
EC working document. Available from http://www.cfp-reformwat
ch.eu/pdf/reflection_cfp_08_mid.pdf [accessed 29 November 2013 ]
(2008).
Eigaard, O. R. A bottom-up approach to technological development
and its management implications in a commercial fishery. ICES J.
Mar. Sci., 66: 916–927 (2009).
Eigaard, O. R., B. Herrmann, and J. R. Nielsen. Influence of grid ori-
entation and time of day on grid sorting in small-meshed trawl fish-
ery for Norway pout (Trisopterus esmarkii). Aquat. Living Resour.,
25: 15–26 (2012).
Eigaard, O. R., and S. Munch-Petersen. Influence of fleet renewal and
trawl development on landings per unit effort of the Danish north-
ern shrimp (Pandalus borealis) fishery. ICES J. Mar. Sci., 68: 26–
31 (2011).
Eigaard, O. R., D. Rihan, N. Graham, A. Sala, and K. Zachariassen.
Improving fishing capacity descriptors: modelling engine power
and gear-size relations of five European trawl fleets. Fish. Res.,
110: 39–46 (2011b).
Eigaard, O. R., B. Thomsen, H. Hovgaard, A. Nielsen, and A. D.
Rijnsdorp. Fishing power increases from technological develop-
ment in the Faroe Islands longline fishery. Can. J. Fish. Aquat.
Sci., 68: 1970–1982 (2011a).
FAO. Report of the Technical consultation on the measurement
of fishing capacity. FAO Fisheries report No. 615, 51 pp
(2000).
FAO. Measuring and appraising capacity in fisheries: framework,
analytical tools and data aggregation. FAO Fisheries Circular No.
994, 39 pp (2004).
FAO. The State of World Fisheries and Aquaculture (SOFIA). FAO
Fisheries and Aquaculture Department, Rome. Available from
http://www.fao.org/docrep/016/i2727e/i2727e00.htm [accessed 29
November 2013] (2012).
Fulton, E., A. D. M. Smith, D. C. Smitf, and I. van Putten. Human
behaviour: the key source of uncertainty in fisheries management.
Fish Fish., 12: 2–17 (2011).
Galili, E., and B. Rosen. Fishing gear from a 7th-century shipwreck
off Dor, Israel. Int. J. Naut. Archaeol., 37: 67–76 (2008).
Gislason, H. The requirements of an Ecosystem Approach to
Fisheries Management, pp. 307–328. In: The knowledge base for
Fisheries management (Motos, L., and D. C. Wilson, Eds.). Devel-
opments in Aquaculture and Fisheries Science. Amsterdam:
Elsevier (2006).
Graham, N., R. S. T. Ferro, W. A. Karp, and P. MacMullen. Fishing
practice, gear design, and the ecosystem approach—three
case studies demonstrating the effect of management strategy on
gear selectivity and discards. ICES J. Mar. Sci., 64: 744–750
(2007).
Guttormsen, A. G., and K. H. Roll. Technical efficiency in a heteroge-
neous fishery: the case of Norwegian Groundfish Fisheries. Mar.
Resour. Econ., 26: 293–307 (2011).
Hall, M. A. An ecological view on the tuna-dolphin problem. Impacts
and trade-offs. Rev. Fish Biol. Fisher, 8: 1–34 (1998).
Hilborn, R. Fleet dynamics and individual variation: why some peo-
ple catch more fish than others. Can. J. Fish. Aquat. Sci., 42: 2–13
(1985).
Hilborn, R., J. M. (Lobo) Oresanz, and A. M. Parma. Institutions,
incentives and the future of fisheries. Philos. T. R. Soc. Lon. B,
360: 47–57 (2004).
172 O. R. EIGAARD ET AL.
Reviews in Fisheries Science & Aquaculture vol. 22 2 2014

Hintzen, N. T., F. Bastardie, D. J. B. Beare, G. Piet, C. Ulrich, N.
Deporte, J. Egekvist, and H. Degel. VMStools: open-source soft-
ware for the processing, analysis and visualization of fisheries log-
book and VMS data. Fish. Res., 115: 31–43 (2012).
Horwood, J. W., and R. S. Millner. Cold induced abnormal catches of
sole. J. Mar. Biol. Assoc. UK, 78: 81–84 (1998).
Hutton, T., S. Mardle, and A. N. Tidd. The decline of the English and
Welsh fishing fleet?, pp. 26–48. In: Advances in fisheries science:
50 years on from Beverton and Holt (Payne, A., J. Cotter, and T.
Potter, Eds.). Oxford: Blackwell Publishing (2008).
Hutton, T., S. Pascoe, B. Rackham, and C. O’Brien. A comparison of
technical efficiency estimates for seven English fleets in the North
Sea from stochastic production frontier (SPF) and Data Envelop-
ment Analysis (DEA), pp. 56–70. In: Single output measures of
technical efficiency in EU fisheries (Pascoe, S., and S. Mardle,
Eds.). UK: CEMARE, University of Portsmouth. CEMARE Report
61 (2003).
J�akupsstovu, S. H. I., L. R. Cruz, J.-J. Maguire, and J. Reinert. Effort
regulation of the demersal fisheries at the Faroe Islands: a 10-year
appraisal. ICES J. Mar. Sci., 64: 730–737 (2007).
Kindt-Larsen, L., E. Kirkegaard, and J. Dalskov. Fully documented
fishery: a tool to support a catch quota management system. ICES
J. Mar. Sci., 68: 1606–1610 (2011).
Kirkley, J., P. C. J. Morrison, S. Cunningham, and J. Cantzano.
Embodied and disembodied technical change in fisheries: an analy-
sis of the S�ete trawl fishery, 1985–1999. Environ. Resour. Econ.,
29: 191–217 (2004).
Larsen, F., O. R. Eigaard, and J. Tougaard. Reduction of harbour
porpoise by catch by high density gill nets. Fish. Res., 85: 270–278
(2007).
Lindebo, E. Role of subsidies in EU fleet capacity management. Mar.
Resour. Econ., 20: 445–466 (2005).
Madsen, N., R. Frandsen, R. Holst, and L. A. Krag. Development of
new concepts for escape windows to minimise cod catches in Nor-
way lobster fisheries. Fish. Res., 103: 25–29 (2010).
Mah�evas, S., Y. Sandon, and A. Biseau. Quantification of annual var-
iations in fishing power due to vessel characteristics: an application
to bottom-trawlers of South Brittany targeting anglerfish (Lophius
budgegassa, Lophius piscatorius). ICES J. Mar. Sci., 61: 71–83
(2004).
Mah�evas, S., Y. Vermard, N. Goascoz, et al. An investigation of
human versus technological variation in catchability for a selection
of European fleets. ICES J. Mar. Sci., 68: 2252–2263 (2011).
Main, J., and G. I. Sangster. A study of a multi-level bottom trawl for
species separation using direct observation techniques. Scottish
Fisheries Research Report, No 26, 17 pp. (1982).
Marchal, P. (Ed.): Technological developments and tactical adapta-
tions of important EU fleets (TECTAC No. QLK5-2001-01291).
Final project report (2006).
Marchal, P., B. S. Andersen, D. Bromley, et al. Improving the definition of
fishing effort for important European fleets by accounting for the skipper
effect. Can. J. Fish. Aquat. Sci., 63: 510–533 (2006).
Marchal, P., B. Andersen, B. Caillart, O. R. Eigaard, O. Guyader, H.
Hovgaard, A. Iriondo, F. L. Fur, J. Sacchi, and M. Santurt�un.Impact of technological creep on fishing effort and fishing mortal-
ity, for a selection of European fleets. ICES J. Mar. Sci., 64:
192–209 (2007).
Marchal, P., P. Lallemand, K. Stokes, and O. Th�ebaud. A comparative
review of the fisheries resource management systems in New
Zealand and in the European Union. Aquat. Living Resour., 22:
463–481 (2009).
Marchal, P., C. Ulrich, K. Korsbrekke, M. Pastoors, B. Rackham, and
H. Hovga�rd. Variations in catchability and fish stock assessments.
Sci. Mar., 67 (Suppl. 1): 63–73 (2003).
Marchal, P., C. Ulrich, K. Korsbrekke, M. Pastoors, and B Rack-
ham. A comparison of three indices of fishing power on some
demersal fisheries of the North Sea. ICES J. Mar. Sci., 59: 604
–623 (2002).
Martell, S. J. D., and C.J. Walters. Implementing harvest rate objec-
tives by directly monitoring exploitation rates and estimating
changes in catchability. B. Mar. Sci., 70: 695–713 (2002).
Maunder, M. N., J. R. Sibert, A. Fonteneau, J. Hampton, P. Kleiber,
and S. J. Harley. Interpreting catch per unit effort data to assess the
status of individual stocks and communities. ICES J. Mar. Sci., 63:
1373–1385 (2006).
Maunder, M. N., and A. E. Punt. Standardizing catch and effort data:
a review of recent approaches. Fish. Res., 70: 141–159 (2004).
Maxwell, M. R., A. Henry, C. D. Elvidge, et al. Fishery dynamics of
the California market squid (Loligo opalescens) as measured by
satellite remote sensing. Fish. B., 102: 661–670 (2004).
Murawski, S. A., and J. T. Finn. Optimal effort allocation among
competing mixed-species fisheries, subject to fishing mortality
constraints. Can. J. Fish. Aquat. Sci., 43: 90–100 (1986).
O’Neill, M. F., A. J. Courtney, C. T. Turnbull, N. M. et al. Comparison
of relative fishing power between different sectors of the Queensland
trawl fishery, Australia. Fish. Res., 65: 309–321 (2003).
O’Neill, M. F., and G. M. Leigh. Fishing power increases continue in
Queensland’s east coast trawl fishery, Australia. Fish. Res., 85:
84–92 (2007).
Pascoe, S., J. L. Andersen, and J. W. de Wilde. The impact of man-
agement regulation on the technical efficiency of vessels in the
Dutch beam trawl fishery. Eur. Rev. Agric. Econ., 28: 187–206
(2001a).
Pascoe, S., and L. Coglan. Implications of differences in technical
efficiency of fishing boats for capacity measurement and reduction.
Mar. Policy, 24: 301–307 (2000).
Pascoe, S., L. Coglan, and S. Mardle. Physical versus harvest-
based measures of capacity: the case of the United Kingdom ves-
sel capacity unit system. ICES J. Mar. Sci., 58: 1243–1252
(2001b).
Pascoe, S., D. Tingley, and B. Cattermoul. Estimating the effi-
ciency of UK English Channel vessels using DEA and Stochas-
tic Production Frontiers, pp. 22–55. In: Single Output Measures
of Technical Efficiency in EU Fisheries (Pascoe, S., and S. Mar-
dle, Eds.). UK: CEMARE, University of Portsmouth, CEMARE
Report 61 (2003).
Poos, J. J., J. A. Bogaards, F. J. Quirijns, D. M. Gillis, and A. D.
Rijnsdorp. Individual quotas, fishing effort allocation, and over-
quota discarding in mixed fisheries. ICES J. Mar. Sci., 67: 323–
333 (2010).
Poos, J. J., and A. D. Rijnsdorp. An “experiment” on effort alloca-
tion of fishing vessels: the role of interference competition and
area specialization. Can. J. Fish. Aquat. Sci., 64: 304–313
(2007).
Quirijns, F. J., J. J. Poos, and A. D. Rijnsdorp. Standardizing com-
mercial CPUE data in monitoring stock dynamics: Accounting
for targeting behaviour in mixed fisheries. Fish. Res., 89: 1–8
(2008).
Reviews in Fisheries Science & Aquaculture vol. 22 2 2014
TECHNOLOGICAL DEVELOPMENT AND FISHERIES MANAGEMENT 173
Rahikainen, M., and S. Kuikka. Fleet dynamics of herring trawlers-
change in gear size and implications for interpretation of catch per
unit effort. Can. J. Fish. Aquat. Sci., 59: 531–541 (2002).
Reeves, S., P. Marchal, S. Mardle, et al. From fish to fisheries: the
changing of focus of management advice, pp. 135–144. In: Advan-
ces in Fisheries Science, 50 years on from Beverton and Holt
(Payne, A., J. Cotter, and T. Potter, Eds.). Oxford: Blackwell Pub-
lishing Ltd. (2008).
Reid, D. G., N. Graham, D. J. Rihan, et al. Do big boats tow big nets?
ICES J. Mar. Sci., 68: 1663–1669 (2011).
Rihan, D. Comparison of twin-rig and single-rig trawling in terms of
relative fishing efficiency, pp. 43–51. In: FAO Fisheries Technical
Paper, Vol. 482. Economic Performance and Fishing Efficiency of
Marine Capture Fisheries (Mitchell, R., Ed.). (2005).
Rijnsdorp, A. D., Daan, N., and Dekker, W. Partial fishing mortality
per fishing trip: a useful indicator of effective fishing effort in
mixed demersal fisheries. ICES J. Mar. Sci., 63: 556–566 (2006).
Rijnsdorp, A. D., N. Daan, W. Dekker, J. J Poos, and W. L. T. Van
Densen. Sustainable use of flatfish resources: addressing the credi-
bility crisis in mixed fisheries management. J. Sea Res., 57: 114–
125 (2007).
Rijnsdorp, A. D., J. J. Poos, R. HilleRisLambers, J.-W. De Wilde, and
W. M. Den Heijer. The arms race between fishers. J. Sea Res., 60:
126–138 (2008).
Rijnsdorp, A. D., J. J. Poos, and F. J. Quirijns. Spatial dimension and
exploitation dynamics of local fishing grounds by fishers targeting
several flatfish species. Can. J. Fish. Aquat. Sci., 68: 1064–1076
(2011).
Robins, C. M., Y. Wang, and D. Die. The impact of global posi-
tioning systems and plotters on fishing power in the northern
prawn fishery, Australia. Can. J. Fish. Aquat. Sci., 55: 1645–16
51(1998).
Rose, G. A., and D. W. Kulka. Hyperaggregation of fish and fisheries:
how catch-per-unit-effort increased as the northern cod (Gadus
morhua) declined. Can. J. Fish. Aquat. Sci., 56 (Suppl. 1): 118–
127 (1999).
Rossiter, T., and S. Stead. Days at sea: from the fishers’ mouth. Mar.
Policy, 27: 281–288 (2003).
Sainsbury, J. C. Commercial fishing methods, an introduction to ves-
sels and gears. Oxford: Fishing News Books, Blackwell Science
Ltd, 359 pp. (1996).
Salas, S., and D. Gaertner. The behavioural dynamics of fishers: man-
agement Implications. Fish Fish., 5: 153–167 (2004).
Shepherd, J. G. Fishing effort control: could it work under the com-
mon fisheries policy? Fish. Res., 63: 149–153 (2003).
Somerton, D. A. Do Pacific cod (Gadus macrocephalus) and walleye
pollock (Theragra chalcogramma) lack a herding response to the
doors, bridles, and mudclouds of survey trawls? ICES J. Mar. Sci.,
61: 1186–1189 (2004).
Standal, D. Nuts and bolts in fisheries management—a technological
approach to sustainable fisheries? Mar. Policy, 29: 255–263
(2005).
Standal, D. Institutional changes and fleet structure: towards the final
solution?Mar. Policy, 31: 94–100 (2007).
Stefansson, G., and A. A. Rosenberg. Combining control measures for
more effective management of fisheries under uncertainty: quotas,
effort limitation and protected areas. Philos. T. Roy. Soc. B, 360:
133–146 (2005).
Thomsen, B. Efficiency changes in the Faroese pair-trawler fleet, pp.
33–43. In: FAO Fisheries Technical Paper, Vol 482. Economic
Performance and Fishing Efficiency of Marine Capture Fisheries
(Mitchell, R., Ed.). (2005).
Thorson, J. T. Auxiliary and focal assessment models: a proof-of-con-
cept involving time-varying catchability and fishery stock-status
evaluation. ICES J. Mar. Sci., 68: 2264–2276 (2011).
Tietze, U., W. Thiele, R. Lasch, B. Thomsen, and D. Rihan. Eco-
nomic performance and fishing efficiency of marine capture fisher-
ies. FAO Fisheries Technical Paper No. 482, 68 pp. (2005).
Ulrich, C., Wilson, D. C. K., Nielsen, J. R., Bastardie, F., Reeves, S.
A., Andersen, B. S., Eigaard, O. R. Challenges and opportunities
for fleet- and m�etier-based approaches for fisheries management
under the European Common Fishery Policy. Ocean Coast. Man-
age, 70: 38–47 (2012).
Valdemarsen, J. W. Technological trends in capture fisheries. Ocean
Coast. Manage., 44: 635–651 (2001).
Valdemarsen, J. W., and P. Suuronen. Modifying fishing gear to
achieve ecosystem objectives, pp. 321–341. In: Responsible Fish-
eries in the Marine Ecosystem (Sinclair, M., and G. Valdimarsson,
Eds.). Rome: FAO and CABI Publishing (2003).
Van Oostenbrugge, J. A. E., J. J. Poos, W. L. T van Densen, and M.
A. M. Machiels. In search of a better unit of effort in coastal lift
net fishery with lights for small pelagics in Indonesia. Fish. Res.,
59: 43–56 (2002).
Whitmarsh, D. Technological change and marine fisheries develop-
ment.Mar. Policy, 14: 15–22 (1990).
Whitmarsh, D., C. A. Reid, C. Gulvin, and M. R. Dunn. Natural resource
exploitation and the role of new technology: a case-history of the UK
herring industry. Environ. Conserv., 22: 103–110 (1995).
Wilberg, M. J., J. T. Thorson, B. C. Linton, and J. Berkson. Incorpo-
rating time-varying catchability into population dynamic stock
assessment models. Rev. Fish. Sci., 18: 7–24 (2010).
Wilhelmsson, D., T. Malm, and M. C. €Ohman. The influence of off-
shore wind power on demersal fish. ICES J. Mar. Sci., 63: 775–
784 (2006).
Reviews in Fisheries Science & Aquaculture vol. 22 2 2014
174 O. R. EIGAARD ET AL.