techno economic assessment of mi lmicroalgae biomass … cost... · micro‐algae production cost...
TRANSCRIPT

Techno‐economic Assessment of Mi l Bi P d i SMicroalgae Biomass Production Systems:
Current Status & Future Opportunities
Sudhagar ManiAssistant Professor Faculty of EngineeringAssistant Professor, Faculty of Engineering
University of Georgia, Athens Email: [email protected]
Bioenergy Engineering 2009 Conference October 11‐14 Bellevue WA
g g
October 11 14, Bellevue, WA

Outline
Introduction – Microalgae
Microalgae Cultivation Practices
Techno economic modelTechno‐economic model
(1) Photo‐bioreactor system
(2) Raceway pond system
l & di iResults & Future directions
ConclusionConclusion

What are Microalgae?
• Groups of simple living aquatic organisms
• Converts inorganic substances into organic materials
through photo‐syntheses in the presence of CO2 & sun
light energy
• Single cell to multi‐cellular & even complex (seaweeds)g p ( )
• Responsible for 70‐80% production of global O2
• High Areal Productivity (10 – 60 g/m /day )• High Areal Productivity (10 – 60 g/m2/day )

Chemical Composition of Algae Expressed on Dry Matter Basis (%)
Strain Protein Carbohydrates Lipids Nucleic acid
Scenedesmus obliquus 50-56 10-17 12-14 3-6Scenedesmus obliquus 50 56 10 17 12 14 3 6
Scenedesmus quadricauda 47 - 1.9 -
Scenedesmus dimorphus 8-18 21-52 16-40 -
Chl d h i h dii 48 17 21Chlamydomonas rheinhardii 48 17 21 -
Chlorella vulgaris 51-58 12-17 14-22 4-5
Chlorella pyrenoidosa 57 26 2 -
Spirogyra sp. 6-20 33-64 11-21 -
Dunaliella bioculata 49 4 8 -
Dunaliella salina 57 32 6 -
Euglena gracilis 39-61 14-18 14-20 -
Prymnesium parvum 28-45 25-33 22-38 1-2
Tetraselmis maculata 52 15 3 -
Porphyridium cruentum 28-39 40-57 9-14 -
Spirulina platensis 46-63 8-14 4--9 2-5
Spirulina maxima 60-71 13-16 6-7 3-4.5
Synechoccus sp. 63 15 11 5
Anabaena cylindrica 43-56 25-30 4-7 -

Annual Oil Yield/Acre
Algae 5000 ‐ 15000 gallons/acreOil P l 635 ll /Oil Palm 635 gallons/acreCoconut 287 gallons/acreJatropha 207 gallons/acreRapeseed/Canola 127 gallons /acreRapeseed/Canola 127 gallons./acrePeanut 113 gallons/acreSunflower 102 gallons/acreSafflower 83 gallons/acreSafflower 83 gallons/acreSoybean 48 gallons/acreHemp 39 gallons/acreCorn 18 gallons/acreg
*Sources: http://www.unh.edu/p2/biodiesel/article_alge.html, http://oakhavenpc.org/cultivating_algae.htm
If we can produce it “Economically”

Application and Potential
BIODIESEL/EtOHBIOFERTILIZER
MICRO‐ALGAE
CHEMICALS PHARMACEUTICALS WASTEWATER
TREATMENT
ELECTRICITY FEED ADDITIVES & Protein Supplements
CO2 ABATEMENT

Microalgae Cultivation
Raceway PondsRaceway Ponds (Open system)
Photo bioreactorsPhoto‐bioreactors(Closed system)
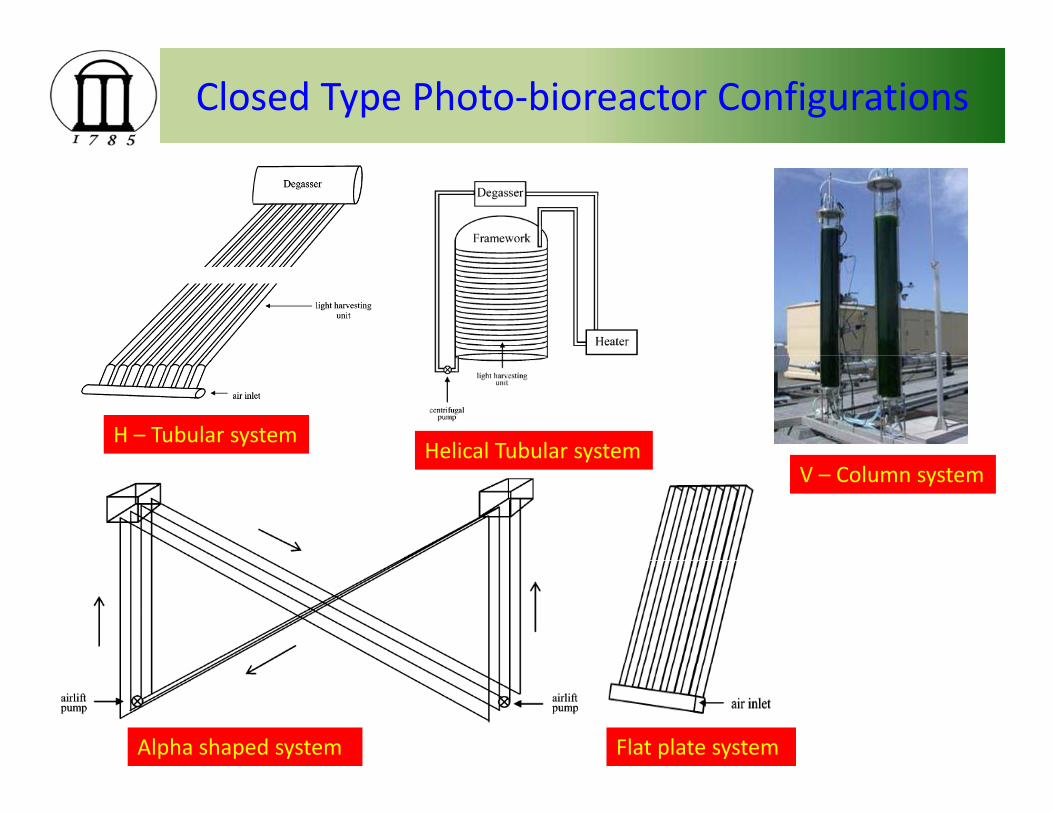
Closed Type Photo‐bioreactor Configurations
H – Tubular systemHelical Tubular systemHelical Tubular system
V – Column system
Alpha shaped system Flat plate system

Open Pond SystemOpen Pond System
Race way Pond – Earthrise Farms Race way Tanks

Open vs. Closed Photo‐bioreactors
Features Open System (Raceway pond)
Closed system (PBR)( y p )
Area‐to‐volume ratio Large (4‐10 times) Small
Growth efficiency Low (0 01‐0 2 g L‐1d‐1) High(0 1‐7 g L‐1 d‐1)Growth efficiency Low (0.01 0.2 g L d ) High(0.1 7 g L d )
Harvesting efficiency Low High
Light util. efficiency Poor‐fair Fair‐excellent
Gas (mass) transfer Poor High( ) g
Water loss Possible Restricted
Capital Investment Small (10‐20 times) High
Sources: Eriksen, 2008; Carvalho et al., 2006; Ugwu et al., 2008
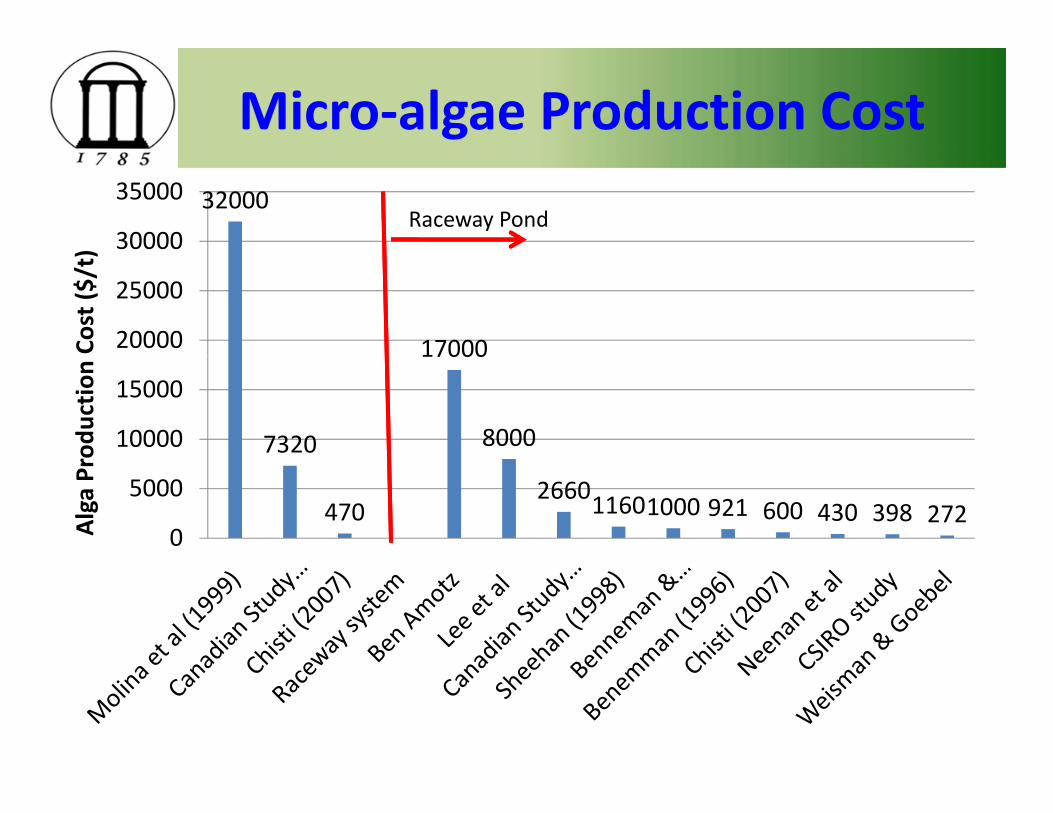
Micro‐algae Production Cost32000
30000
35000
)
Raceway Pond
1700020000
25000
Cost ($
/t)
7320
17000
800010000
15000
oduction
470266011601000 921 600 430 398 272
0
5000
Alga Pr

ObjectivesSystematic techno‐economic evaluation of algae
cultivation & harvesting systemsC d t iti it l i th i d l tConduct sensitivity analysis on the economic model to
improve and progress towards advanced systems
So, what's New?
Annual target based dedicated microalgae productionAnnual‐target based dedicated microalgae production facility – Capital cost vs Operating cost
Individual cost estimation each unit operations
Production cost vs Influencing factorsProduction cost vs Influencing factors

System Boundary – Economic Analysis
GROWTH Primary Harvest
Secondary harvest
Algae 20% solid
RacewayMicro‐strainer
V B l FilCentrifugeRaceway
PondsVacuum Belt Filter
DAFBelt Press Algae
with 20%
Photo‐BioReactors(PBR)
Centrifuge
Belt Press
20% solid content ( )
Basis of Comparison: 1000 dry tons/year for 300 daysBasis of Comparison: 1000 dry tons/year for 300 days operational plant

Methodology
Spreadsheet based model analyzing different options for each stage
Order of magnitude estimation ( 20 to +30 accuracy) fromOrder of magnitude estimation (‐20 to +30 accuracy) ‐ from already published data (Peters, Timmerhaus, West 2003)
Cost of A’s capacity = Cost of B’s capacity * (A’s capacity/B’s capacity)^scale factor
Cost updated to the present value using Chemical Engineering Cost IndexCost Index
Capital cost – Equipment cost, installation, piping, electric lines, land cost, taxes, interests & insurances
Power, Labor, Equipment maintenance & Material requirements accounted for operating cost
d i ( ) d i $Production cost (Cap. + Op. costs) are reported in 2009 US $

Photo‐BioReactor (PBR)
GROWTH No First Harvest Second Harvest
Capital cost comparison for•Controlled & high Growth
•Maximizing photosynthetic
Capital cost comparison forflat plate, bag and tubularsystemefficiency
•Contamination controlOperating cost for tubularsystem only Tubular PB
•Scalability Issues
y y
Productivity assumed to be3 g/L/d (very optimistic)•Higher Maintenance3 g/L/d (very optimistic)
Harvest by centrifuge
Plastic BagFlat panel PB

Photo‐BioReactor (PBR)
Item Value UnitPer PB harvest (Tubular system) 343 cu.mTotal Harvest Flow 1029 cu.m/hrHarvesting Operational Hr 20 hrHarvesting Operational Hr 20 hrMedium Refill Pump 17.15 cu.m/hrPrimary Storage tank depth 3 2 mPrimary Storage tank depth 3.2 mMaximum Volume 1029 cu.mArea of the primary storage tank 321.56 sq.mCentrifuge capacity 45 cu
Assumption: Continuous Steady State harvesting StrategyPBR System: Algae link system
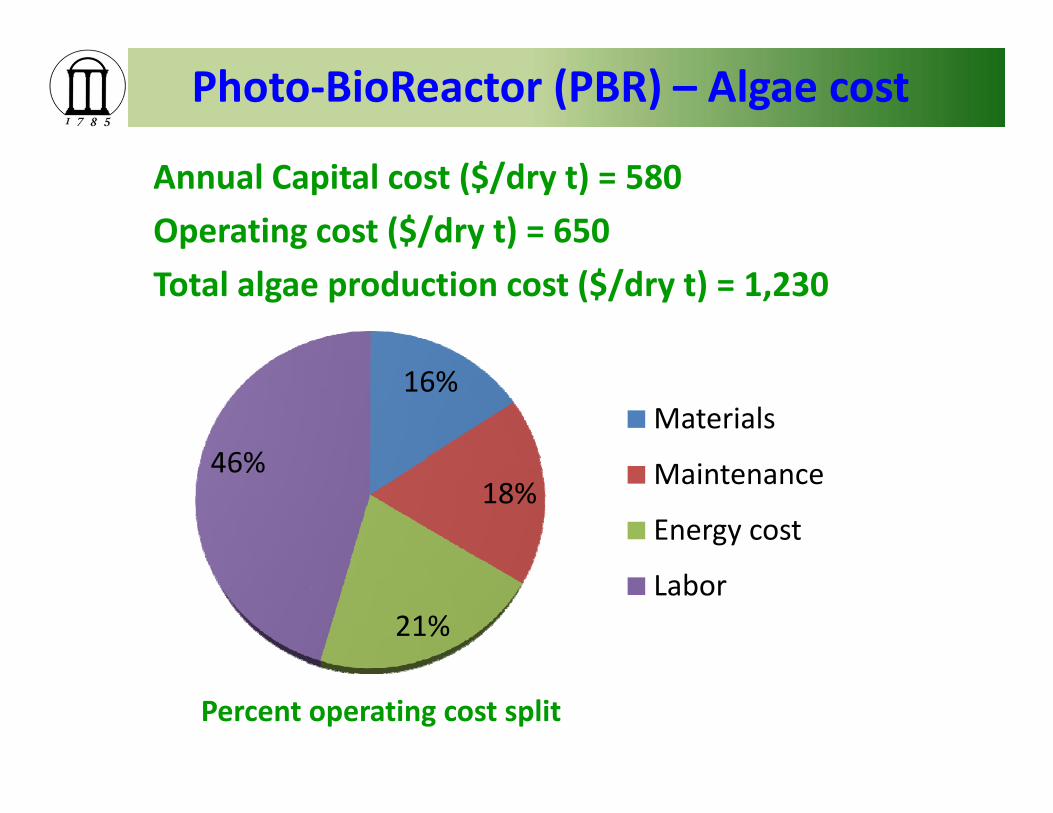
Photo‐BioReactor (PBR) – Algae cost
Annual Capital cost ($/dry t) = 580
Operating cost ($/dry t) = 650
Total algae production cost ($/dry t) = 1,230
16%
46%Materials
18%46% Maintenance
Energy cost
21%Labor
Percent operating cost split

PBR Algae Production cost vs. Productivity
$3 000
$3,500
/t
Total cost ($/t)If nutrients are available freely
$2,500
$3,000
cost, $ capital cost ($/t)
Op. cost ($/t)
$1 500
$2,000
uction
p ($/ )
New total cost ($/t)
$1,000
$1,500
ae Prod
$0
$500Alga
$0
0 2 4 6Algae Productivity, g/l

Raceway Pond
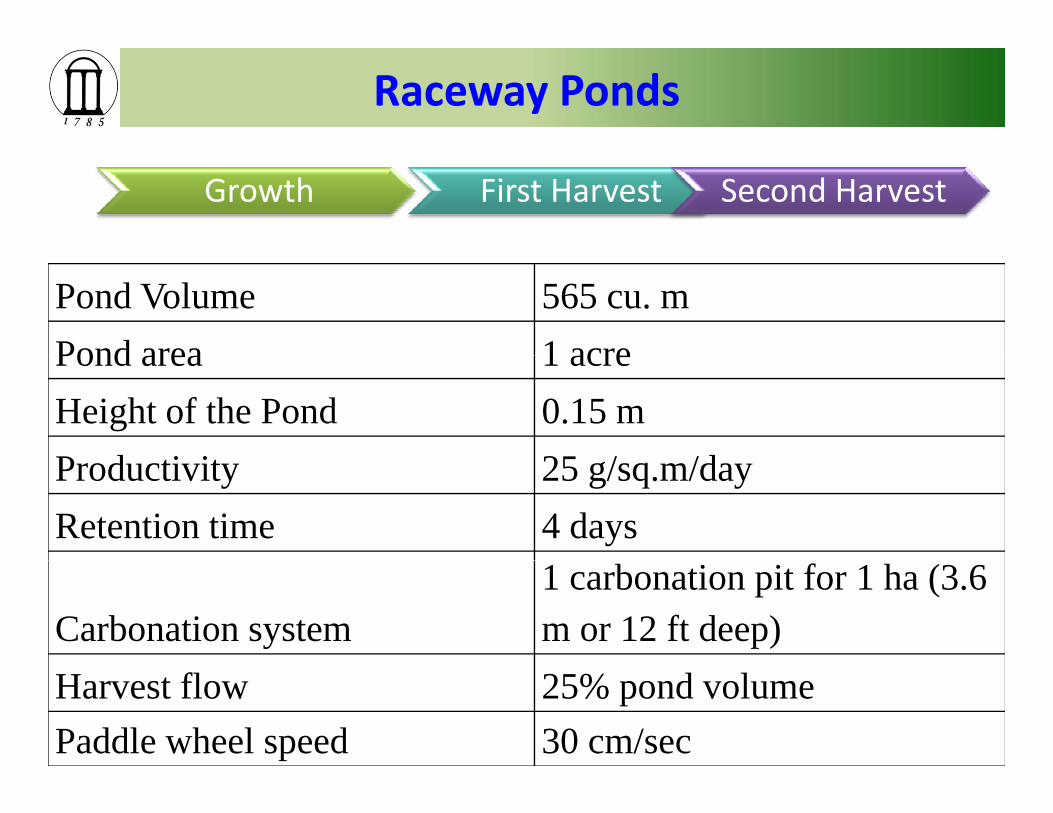
Raceway Ponds
Growth First Harvest Second Harvest
Pond Volume 565 cu. mPond area 1 acrePond area 1 acreHeight of the Pond 0.15 mP d i i 25 / /dProductivity 25 g/sq.m/dayRetention time 4 days
Carbonation system1 carbonation pit for 1 ha (3.6 m or 12 ft deep)
Harvest flow 25% pond volumePaddle wheel speed 30 cm/sec
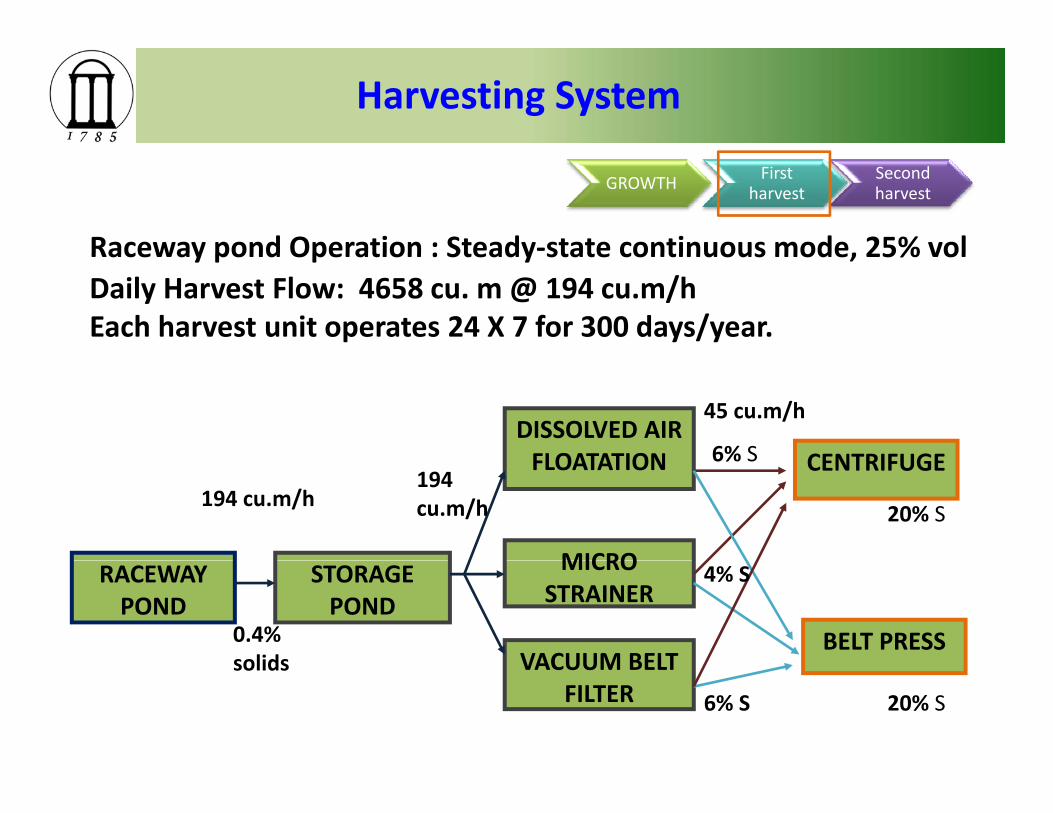
Harvesting System
GROWTH First harvest
Second harvest
Raceway pond Operation : Steady‐state continuous mode, 25% volRaceway pond Operation : Steady state continuous mode, 25% volDaily Harvest Flow: 4658 cu. m @ 194 cu.m/hEach harvest unit operates 24 X 7 for 300 days/year.
DISSOLVED AIR FLOATATION CENTRIFUGE
45 cu.m/h
6% SFLOATATION
MICRO
CENTRIFUGE194 cu.m/h
194 cu.m/h 20% S
6% S
RACEWAY POND
STORAGE POND
MICROSTRAINER
VACUUM BELTBELT PRESS0.4%
solids
4% S
VACUUM BELT FILTER
solids
6% S 20% S

Dissolved Air Floatation (DAF) System

Micro‐Strainer

Belt Press/Filter System

Open Pond Algae Cost Comparisons
operating cost/tonne Annual Capital cost/tonne Total Cost/tonne
1,120 1,221
1,067 1,054 1,210
1,058 1230
$/tonn
e
Pond + microstrainer
Pond + belt filter + Cfg
Pond + DAF + Cfg (3)
Pond + microstrainer
Pond + belt filter + belt
Pond + DAF + belt press(6)
Photo bioreactor +
+ Cfg (1) (2) +belt press (4)
press (5) Centrifuge
Scenarios

Algae Drying Energy
Source: NREL

HDD System
Future Challenges & Opportunities
• Genetic Engineering approach on algae species to improve algaeproductivity and species that can withstand stress conditions• Better understanding on Lipid and carbohydrate biosynthesispathways•Identification and isolation of new algae species that can capable ofIdentification and isolation of new algae species that can capable ofgrow faster and accumulate lipids• Improved photo‐bioreactor designs for large scale applicationsD l f h i id h i• Development of new harvesting systems or even avoid harvesting
• Attached algae growth system show some promises as they cancompletely avoid both primary and secondary harvesting options• Use of low cost nutrient and CO2 sources can reduce algaeproduction cost, but will not solve the entire problem• Combination of PBR & Raceway pond systems are becomingCombination of PBR & Raceway pond systems are becomingattractive for large scale algal production system

Conclusions1. Microalgae biomass can play a significant role in the Renewableg p y g
Energy Portfolio2. Photo‐bioreactors are also attractive to grow algae ($1230/t) under
stress conditions for lipid accumulation and at higher productivitystress conditions for lipid accumulation and at higher productivity(3g/l). However more research is required on designing low cost andefficient photo‐bioreactor systems.
d i f i l i d ($ / ) l k3. Production of microalgae using raceway ponds ($1050/t) looksattractive. However, significant research progress has to be made toadvance this technology to become commercially and economicallygy y yviable
4. Currently, DAF+Belt press or DAF+Centrifuge systems are attractiveeconomically for open pond systemseconomically for open pond systems
5. Newer harvesting technologies are evolving, however they need tosatisfy current economic constraints.
6 I i l d i i h h G i E i i6. Increasing algae productivity through Genetic Engineeringapproaches and improving lipid biosynthesis would further reducethe cost of algae significantly.

Acknowledgement
Research TeamMr. Thiru Viswanathan – Graduate StudentDr S Chinnasamy Research ScientistDr. S. Chinnasamy, Research ScientistDr. KC Das, Associate Professor
Financial Support:Financial Support:Department of Energy (DOE)TIP3 Program – State of Georgia
References
Max S. Peters, Klaus D. Timmerhaus, Ronald. E. West, Plant Design Economics forCh i l E i Fifth Editi M G Hill NY 2003Chemical Engineers‐ Fifth Edition, McGraw‐Hill , NY, 2003.
Perry et al., Chemical Engineering Handbook Fifth Edition, McGraw‐Hill, NY, 2007.
Benneman and Oswald, System and Economic analysis of Microalgae ponds forconversion of carbon dioxide to biomass 1996; PETC Final Report.

THANK YOU