technical t-246 grawerwatgri - infohouseinfohouse.p2ric.org/ref/31/30417.pdf · low interfacial...
TRANSCRIPT
TECHNICAL REPRINT T-246
- GRAWERWATGRI Division of The Graver Company " 2 2 4 4 7 P w
The Application of Granular Resin Coalescer to
Produced Water Deoiling
Robert 0' Connell Manager, Water Technology
Presented at
??IE PACIFIC COAST OIL SHOW AND CONFEJ3ENCE
Bakersfield, California
.
I NTRODUCT I ON
During the last three years, Graver has been conducting laboratory and field studies on the unique TRISEP oil/water separation technology. This technology utilizes a novel coalescing medium which is a syn- thetic ion exchange resin with
portion of the available exchange sites. The oleophilic groups are strongly affixed and are not re- moved over a pH range of 2 to 12. A l s o , the bonds are stable in satu- rated brine solutions.
7 oleophilic groups attached to a
PROCESS DESCRIPTION
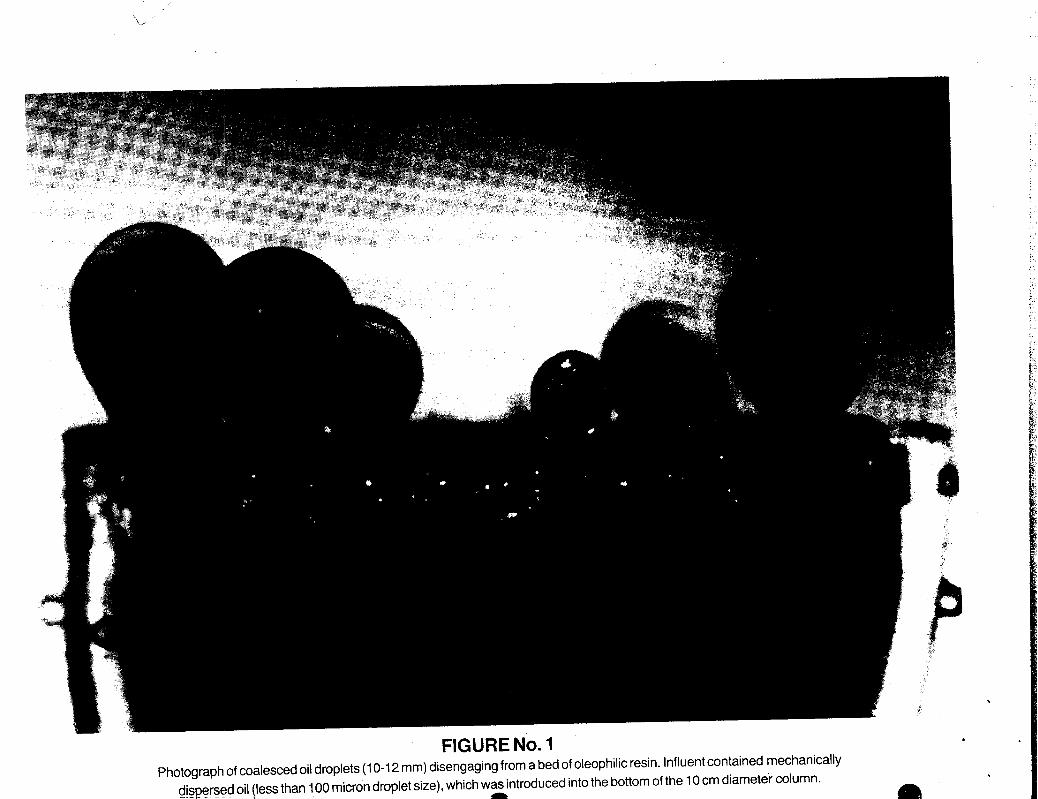
Produced waters are deoiled by be- ing passed through a bed of the oleophilic resin (Figure No. 1). Dispersed oil droplets coalesce onto the resin beads, driven by the low interfacial surface tension be- tween the oil and the resin. The
I efficiency of a coalescer can be 0 described by: (1)
E = 1 - exp ((KD AZ)/V)
Where
E = efficiency of the coalescer
KD = mass transfer coefficient of the dispersed phase
A = average specific inter- facial surface per unit vo 1 ume
Z = depth of packed bed
V = superficial velocity
KD is a s..--4-<..". - E 4-I.- A U I I L L I U I I VI L I I C ifiterfa-
cia1 tension between the dispersed phase (oil) and the coalescing med- ium.
To maximize efficiency, the resin bed presents an abundance of sur- face area to the dispersed oil droplets. Every cubic foot of resin contains more than 1500 ft2 (139 m2) of bead surface area. Obvi- ously, this amount of surface area will greatly enhance the efficiency of the coalescing process.
As the produced water flows down- ward through the resin bed, an oil film forms on the exposed surface of the beads. The oil film will continue to grow on the bead sur- faces until the forces working on the oil film exceed those holding the film. In this case, the shear force of the continuous phase flow- ing through the interstitial spaces of the porous medium must be greater than the combination of the gravitation forces and the attrac- tion of the oil for the resin sur- face. The free oil released from the bead surfaces will combine, forming drops upon exiting the bed t h rough the resin retent ion strainers (Figure No.2). The drops leaving the bed are now at least an order of magnitude greater than those entering (typically 0.5 mm diameter). Once steady state condi- tions are reached (i .e., the entire bed is oil saturated), the mass of oil entering the bed is essentially equal to that exiting. The drop size distribution being the signif- icant variant.
Upon entering the cavity under the bed, the drops are carried by the bulk fluid flow to the separation zone. The flow is directed upward from the cavity through an internal riser pipe. This riser pipe may be fitted with a porous secondary co-
LU u p L 1 1 1 1 L z z ; e urup- let size. The flow velocity in the riser is controlled to avoid drop redispersion and to provide upward momentum to the drops. As the water
alescing r,ateriai L- - - L 2 - 2 - - .7- - - -
.. . .~.. ,
. .
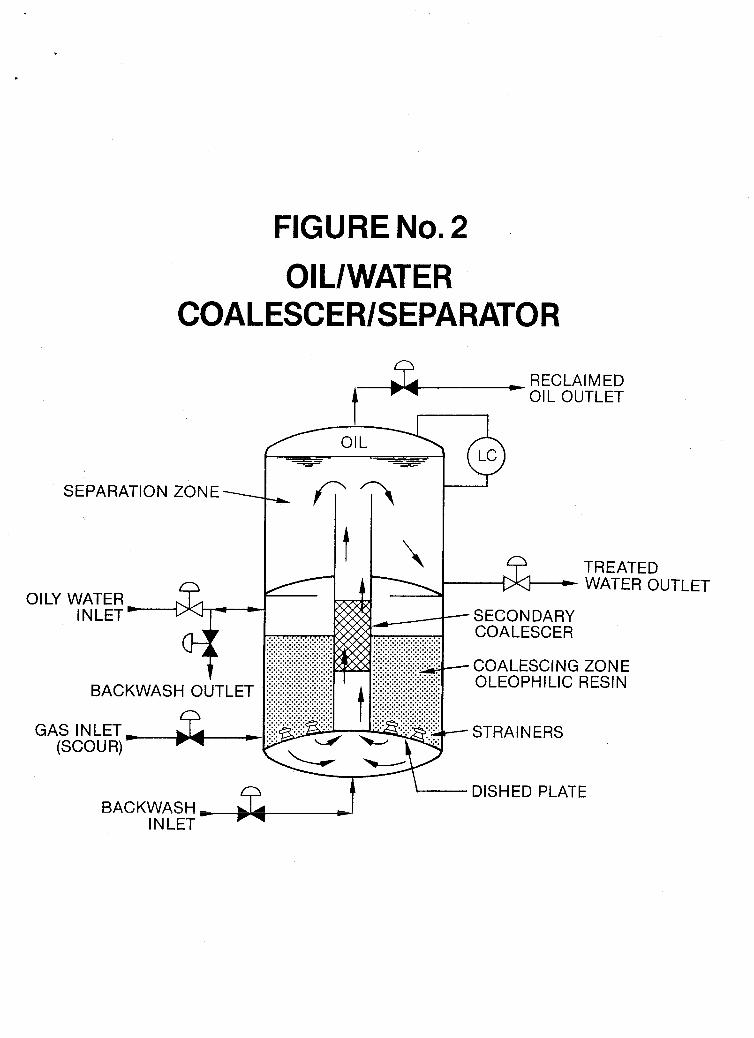
FIGURE No. 2
0 I L/WAT E R COALESCER/SEPARATO R
RECLAIMED OIL OUTLET 1- I
1_ SEPARATION ZONE
OILY WATER
.............. ............... .............. ............... .............. ............... .............. ............... .............. ............... ............... .............. ............... .............. ............... .............. ............... .............. ...............
TREATED WATER OUTLET
-SECONDARY COALESCER
-COALESCING ZONE OLEOPH I LIC RES1 N
-STRAINERS - DISHED PLATE BACKWASH, ‘1 t
INLET
departs from the riser, the flow is redirected downward to the effluent connection.
The oil droplets will separate from the water as the water flow is re- directed. The momentum and bouyancy of the oil drops are sufficient to break them free of the water. The separation rise rate of the oil drops is described by:
VO = 2 d2 (Pw - PO) g 18 LI
Where
Vo = vertical velocity of the oil drop relative to the water
d = drop diameter
Po = density of the oil
Pw = density of the water
g = acceleration due to gravity
= dynamic viscosity of the water
law region, i.e.,
Parameters affecting separation, such as oil gravity, water tempera- ture and dissolved solids content, which affect differential density and viscosity, are independent of
' the process. Therefore, process de- sign parameters are chosen to opti- mize drop size and consequently rise rate. As oil drops collect in the crown of the vessel, forming a layer that is typically greater than 90% oil.
The suspended solids removed from the produced waters during opera- tion must be periodically cleaned from the bed. The cleaning proce- dure is critical, in that it must
be rigorous enough to efficiently remove suspended solids, yet leave the accreted oil layer intact. A water backwash with varying rates, occasionally with gas introduced simultaneously, has proven to achieve the desired constraints. The frequency of cleaning will be a function of the suspended solids ' content of the produced water. The backwash water volumes, encountered during testing, were typically less than 2%. Waste volumes can be re- duced further by diverting the flow to a cone-bottomed storage tank. The solids will settle to the bottom, and the water can be reprocessed through the coalescer/separator unit. In this manner, the only waste product from the process is the concentrated solids' blowdown from the cone-bottomed tank.
PILOT EQUIPMENT
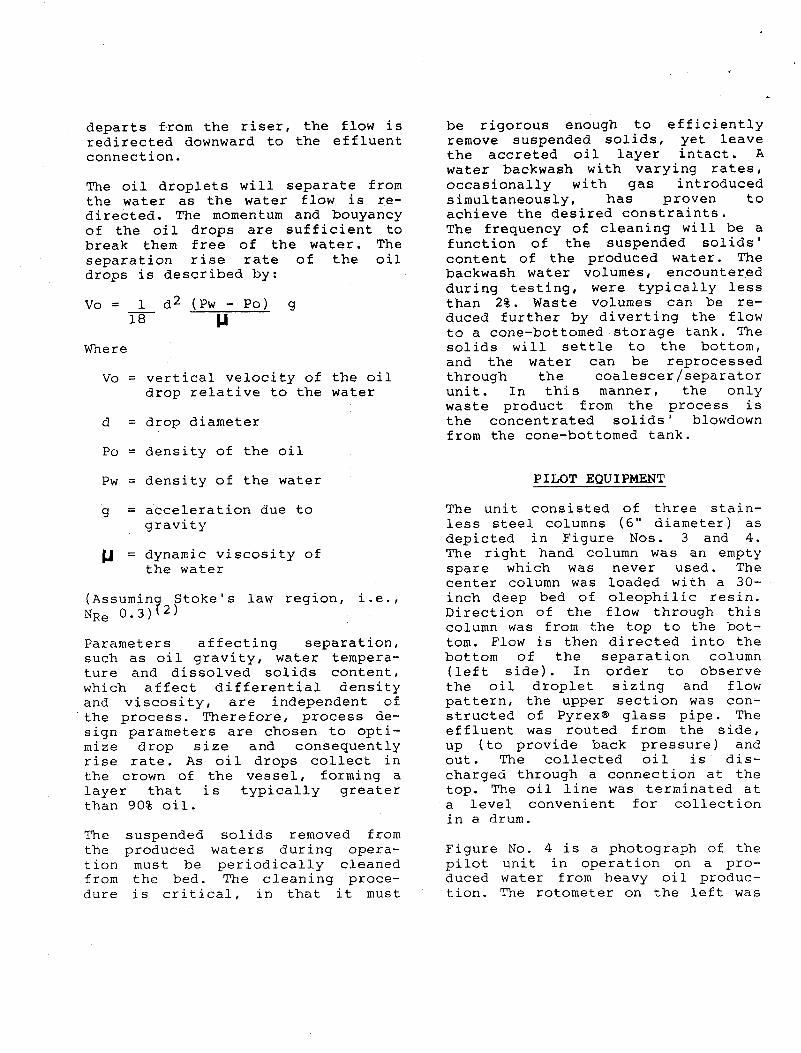
The unit consisted of three stain- less steel columns ( 6 " diameter) as depicted in Figure Nos. 3 and 4. The right hand column was an empty spare which was never used. The center column was loaded with a 30- inch deep bed of oleophilic resin. Direction of the flow through this column was from the top to the bot- tom. Flow is then directed into the bottom of the separation column (left side). In order to observe the oil droplet sizing and flow pattern, the upper section was con- structed of Pyrex@ glass pipe. The effluent was routed from the side, up (to provide back pressure) and out. The collected oil is dis- charged through a connection at the top. The oil line was terminated at a level convenient for collection in a drum.
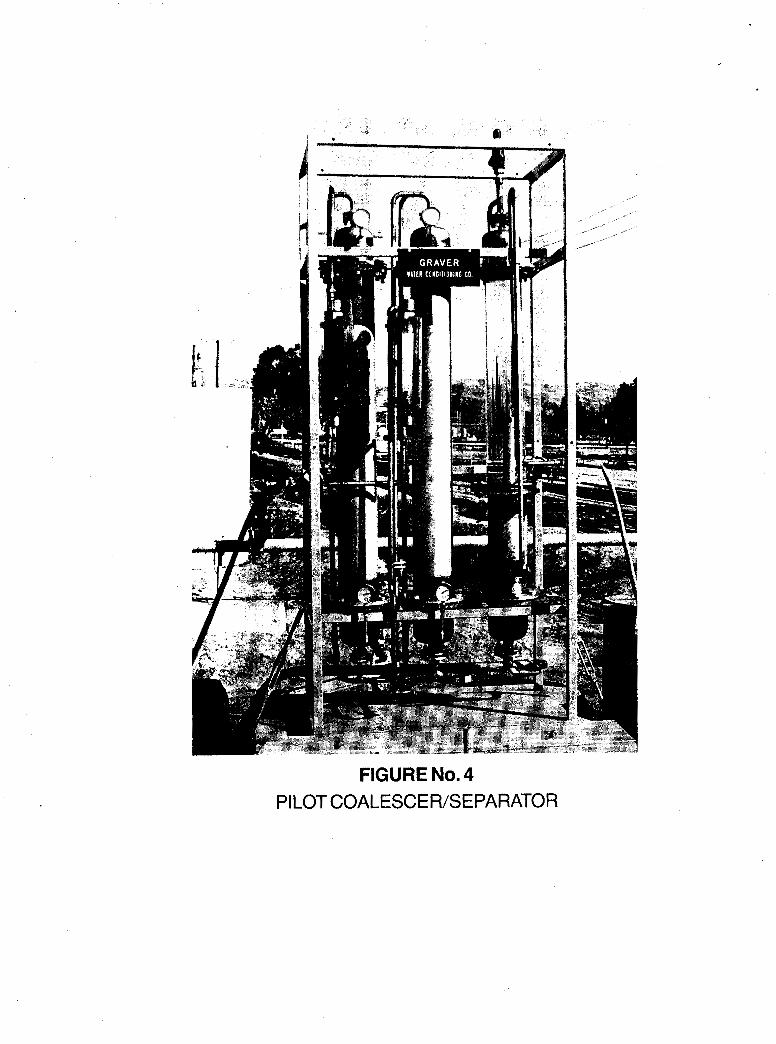
Figure No. 4 is a photograph of the pilot unit in operation on a pro- duced water from heavy oil produc- tion. The rotometer on the left was
11
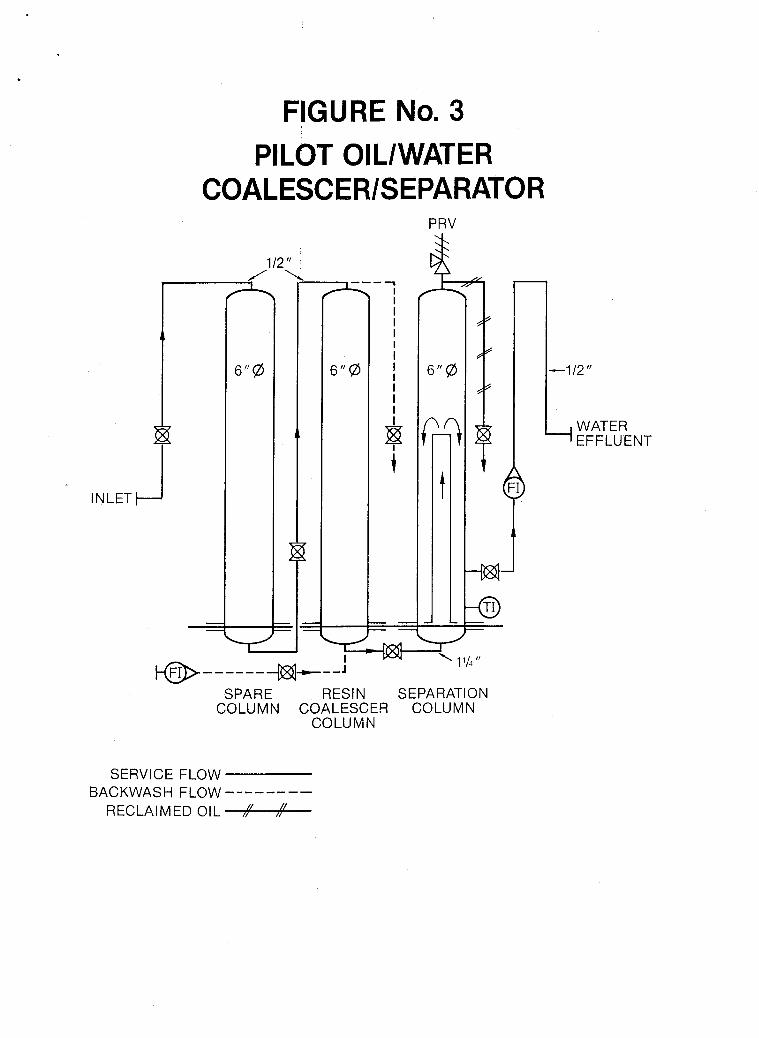
FIGURE No. 3 PILOT OILIWATER
COALESCERISEPARATO R
INLET
112 .----
I
I I I I I I I I I I I I
P$ i
- - - -
PRV
&
@------ *---J
SPARE RESIN SEPARATION COLUMN COALESCE9 COLUMN
COLUMN
-1 12 I’
WATER +EFFLUENT
SERVICE FLOW BACKWASH FLOW --------
RECLAlMED OIL +
. , ,-
.r I-
_<---
FIGURE No. 4 PI LOT COALESCER/SEPARATOR
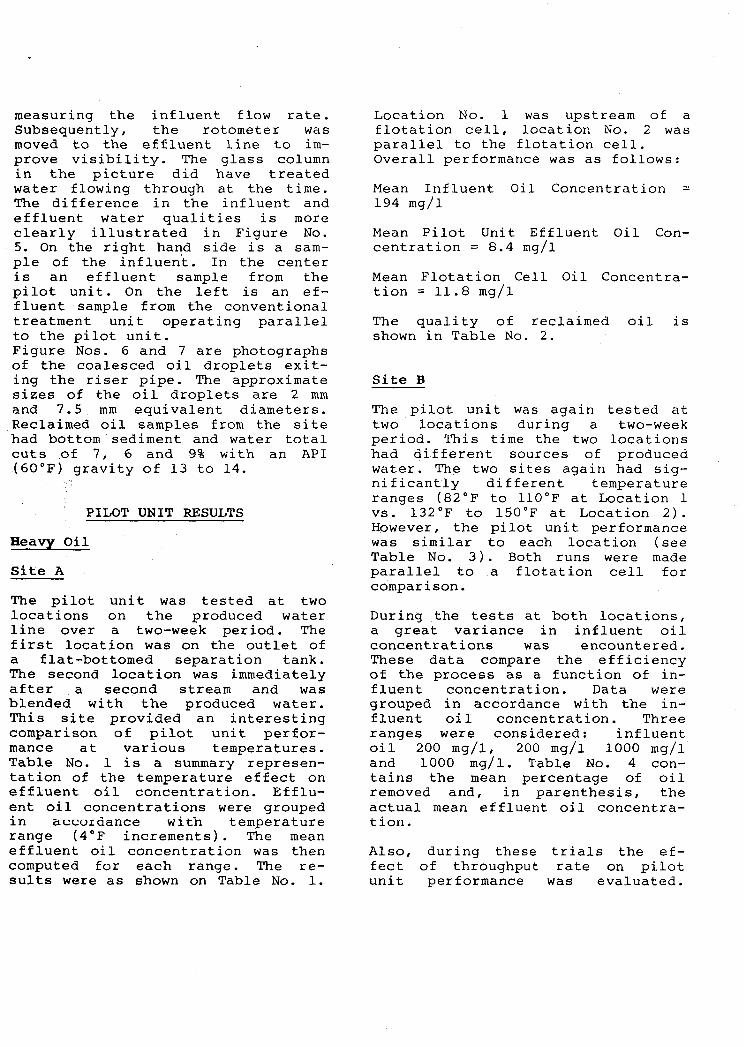
measuring the influent flow rate. Subsequently, the rotometer was moved to the effluent line to im- prove visibility. The glass column in the picture did have treated water flowing through at the time. The difference in the influent and effluent water qualities is more clearly illustrated in Figure No. 5. On the right hand side is a sam- ple of the influent. In the center is an effluent sample from the pilot unit. On the left is an ef- fluent sample from the conventional treatment unit operating parallel to the pilot unit . Figure Nos. 6 and 7 are photographs of the coalesced oil droplets exit- ing the riser pipe. The approximate sizes of the oil droplets are 2 mm and 7.5 mm equivalent diameters. Reclaimed oil samples from the site had bottom sediment and water total cuts of 7, 6 and 9% with an API (60°F) gravity of 13 to 14.
PILOT UNIT RESULTS
Heavy Oil
Site A
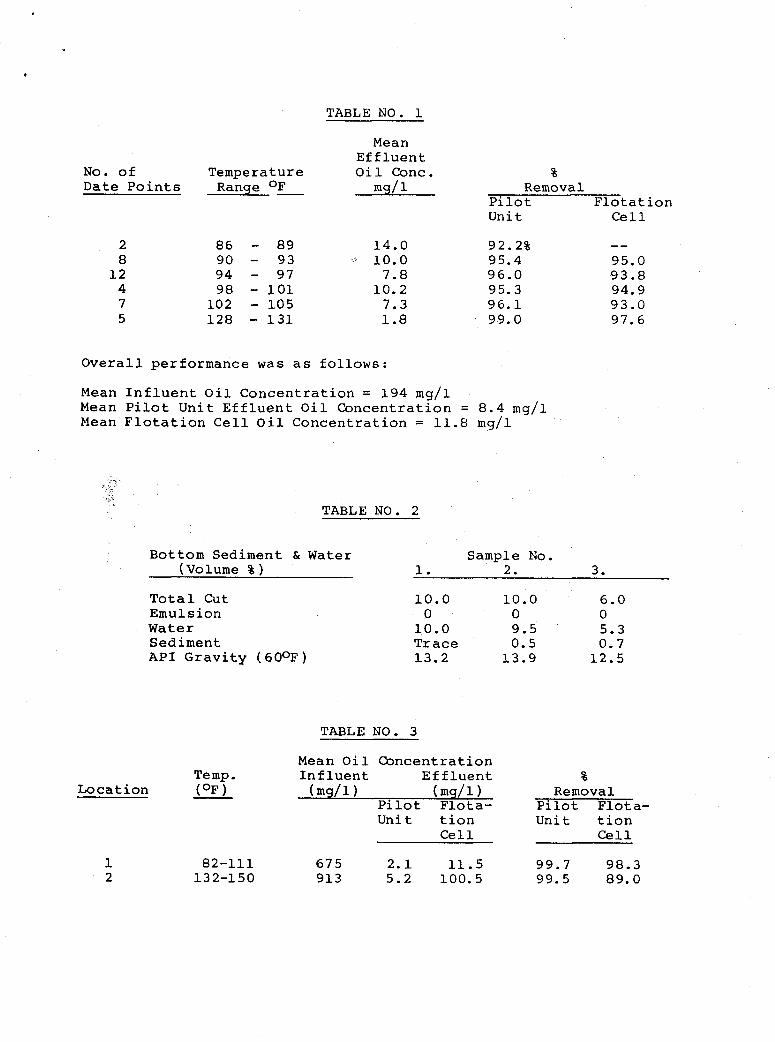
The pilot unit was tested at two locations on the produced water line over a two-week period. The first location was on the outlet of a flat-bottomed separation tank. The second location was immediately after a second stream and was blended with the produced water. This site provided an interesting comparison of pilot unit perfor- mance at various temperatures. Table No. 1 is a summary represen- tation of the temperature effect on effluent oil concentration. Efflu- ent oil concentrations were grouped ln accordance witn temperature range (4°F increments). The mean effluent oil concentration was then computed for each range. The re- sults were as shown on Table No. 1.
Location No. 1 was upstream of a flotation cell, location No. 2 was parallel to the flotation cell. Overall performance was as follows:
Mean Influent Oil Concentration = 194 mg/l
Mean Pilot Unit Effluent Oil Con- centration = 8.4 mg/l
Mean Flotation Cell Oil Concentra- tion = 11.8 mg/l
The quality of reclaimed oil is shown in Table No. 2.
Site B
The pilot unit was again tested at two locations during a two-week period. This time the two locations had different sources of produced water. The two sites again had sig- nificantly different temperature ranges (82°F to 110°F at Location 1 vs. 132°F to 150°F at Location 2). However, the pilot unit performance was similar to each location (see Table No. 3). Both runs were made parallel to a flotation cell for comparison.
During the tests at both locations, a great variance in influent oil concentrations was encountered. These data compare the efficiency of the process as a function of in- fluent concentration. Data were grouped in accordance with the in- fluent oil concentration. Three ranges were considered: influent oil 200 mg/l, 200 mg/l 1000 mg/l and 1000 mg/l. Table No. 4 con- tains the mean percentage of oil removed and, in parenthesis, the actual mean effluent oil concentra- tion.
Also, during these trials the ef- fect of throughput rate on pilot unit performance was evaluated.
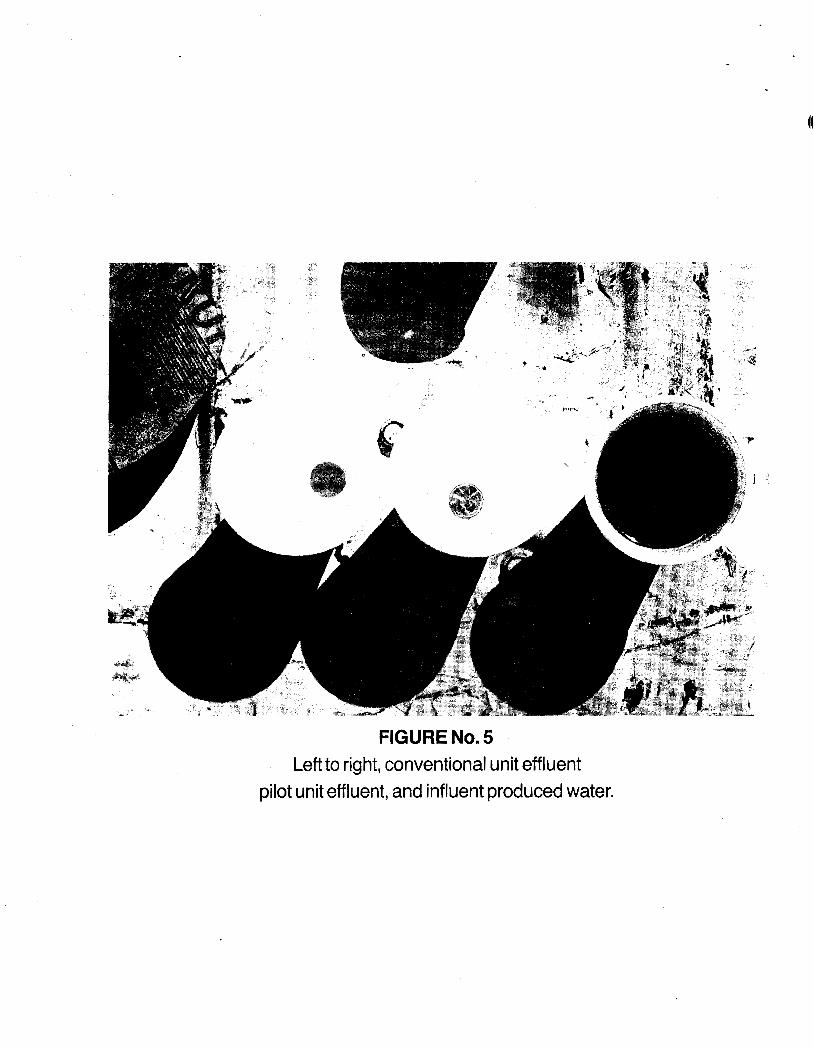
FIGURE No. 5 Left to right, conventional unit effluent
pilot unit effluent, and influent produced water.
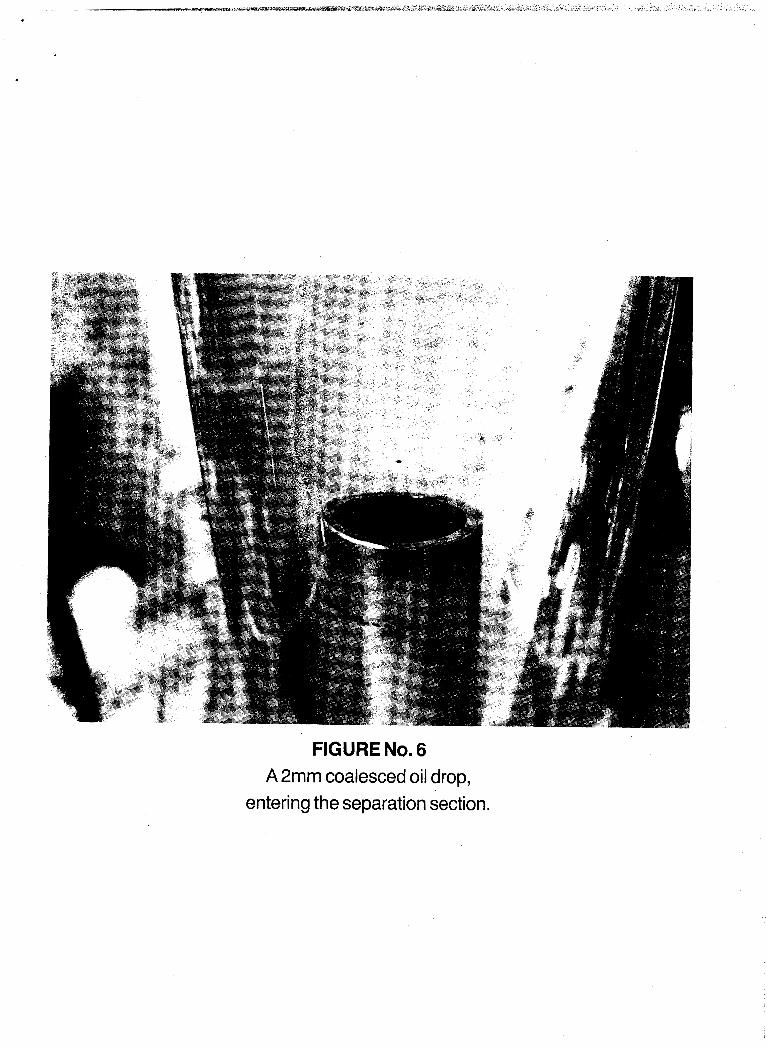
FIGURE No. 6 A 2mm coalesced oil drop,
entering the separation section.
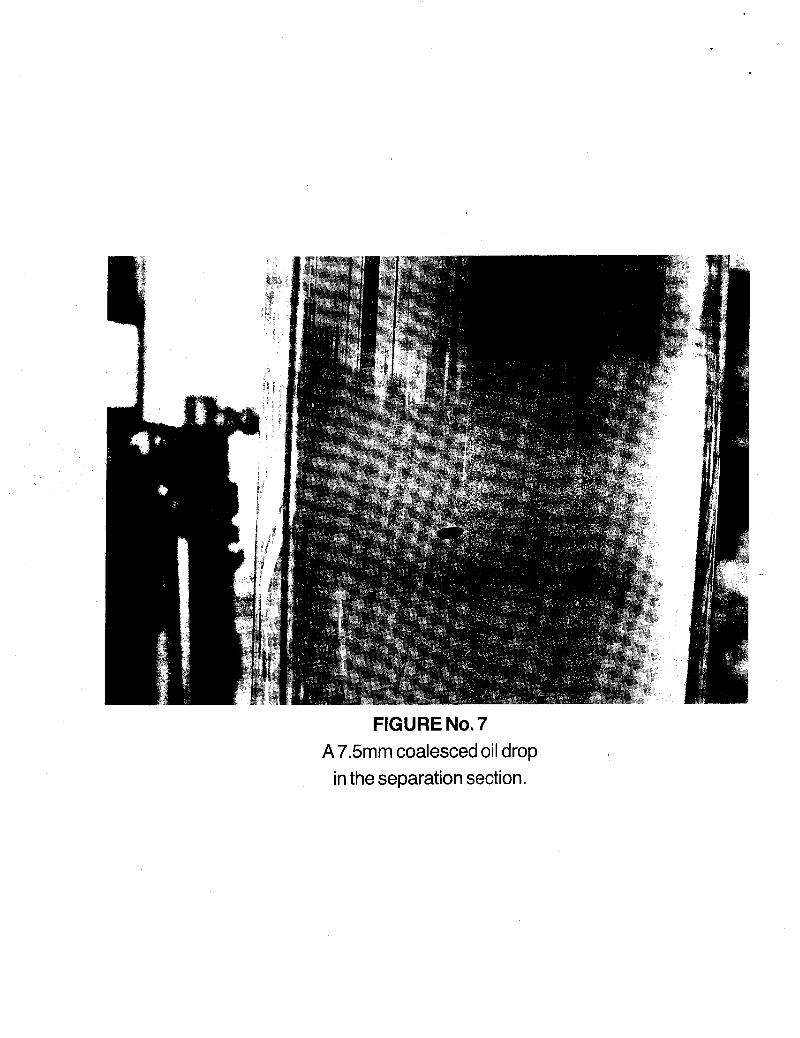
FIGURE No. 7 A 7.5" coalesced oil drop
in the separation section.
(@ TABLE NO. 1
Mean E f f l u e n t
N o . of T e m p e r a t u r e O i l Conc. % D a t e P o i n t s Range OF - mg/ 1 Removal
P i l o t F l o t a t i o n U n i t cell
2 86 - 89 14.0 92.2% -- 8 90 - 93 10.0 95.4 95.0
12 94 - 97 7.8 96.0 93.8 4 98 - 101 10.2 95.3 94.9 7 102 - 105 7.3 96.1 93.0 5 128 - 131 1.8 99.0 97.6
O v e r a l l p e r f o r m a n c e was a s f o l l o w s :
Mean I n f l u e n t O i l C o n c e n t r a t i o n = 194 m g / l Mean P i l o t U n i t E f f l u e n t O i l C o n c e n t r a t i o n = 8.4 mg/l Mean F l o t a t i o n C e l l Oil C o n c e n t r a t i o n = 11.8 m g / l
TABLE NO. 2
B o t t o m Sed imen t & Water Sample N o . (Volume % ) 1. 2. 3.
T o t a l Cut Emuls ion Water S e d i m e n t API G r a v i t y ( 60°F)
10.0 10.0 6.0 0 0 0 10.0 9.5 5.3 T r a c e 0.5 0.7 13.2 13.9 12.5
Temp. (OF 1 - Lo cat i o n
1 2
82-111 132-150
TABLE NO. 3
Mean Oi 1 C o n c e n t r a t i o n I n f l u e n t E f f l u e n t %
( m g / l ) 1 Removal P i l o t F l o t a - P i l o t F l o t a - U n i t t i o n U n i t t i o n
cell cell
67 5 2.1 11.5 99.7 98.3 913 5.2 100.5 99.5 89.0
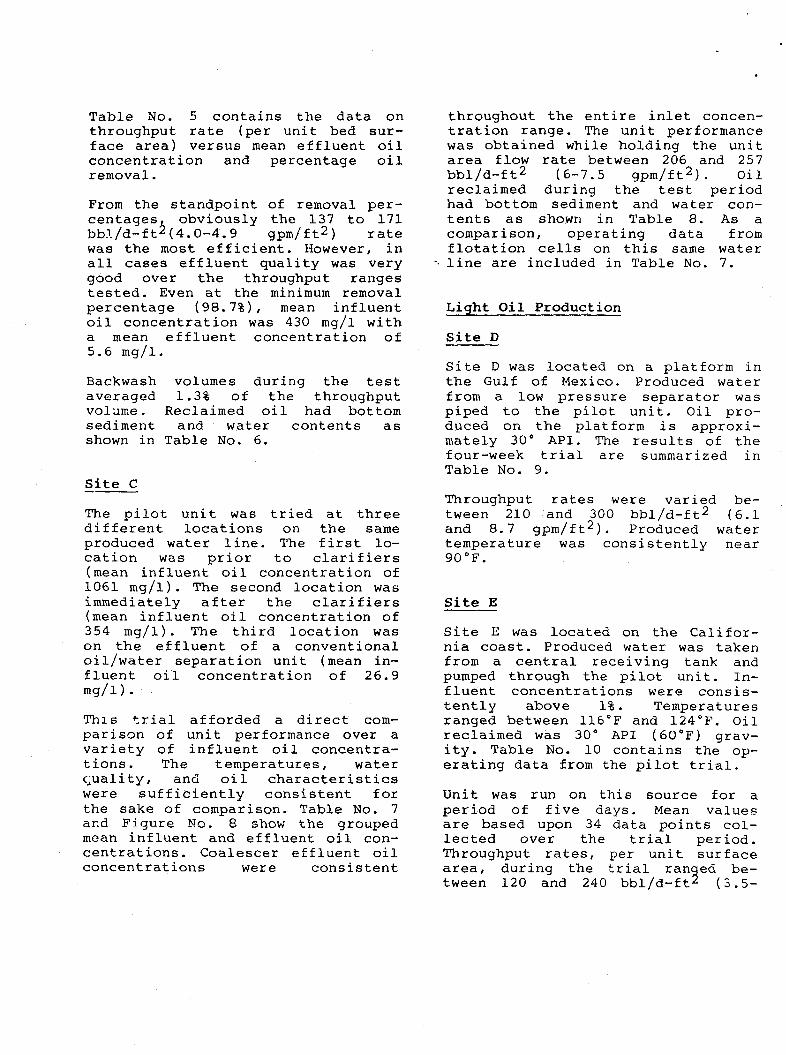
Table No. 5 contains the data on throughput rate (per unit bed sur- face area) versus mean effluent oil concentration and percentage oil removal.
From the standpoint of removal per- centages obviously the 137 to 171
was the most efficient. However, in all cases effluent quality was very good over the throughput ranges tested. Even at the minimum removal percentage (98.781, mean influent oil concentration was 430 mg/l with a mean effluent concentration of 5.6 mg/l.
bb!./d-ft 5 (4.0-4.9 gpm/ft2) rate
Backwash volumes during the test averaged 1.3% of the throughput volane. Reclaimed oil had bottom sediment and water contents as shown in Table No. 6.
Site C
The pilot unit was tried at three different locations on the same produced water line. The first lo- cation was prior to clarifiers (mean influent oil concentration of 1061 mg/l). The second location was immediately after the clarifiers (mean influent oil concentration of 354 mg/l). The third location was on the effluent of a conventional oillwater separation unit (mean in- fluent oil concentration of 26.9 mg/l).
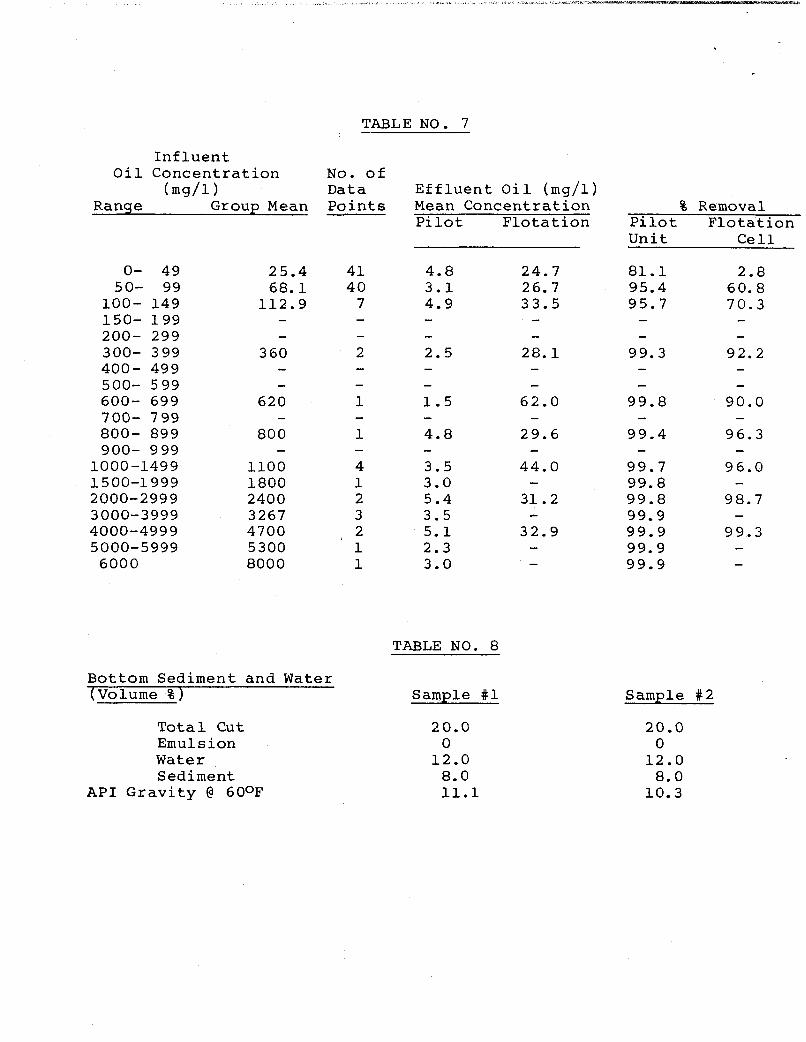
This trial afforded a direct com- parison of unit performance over a variety of influent oil concentra- t ions. The temperatures, water c,uality, and oil characteristics were sufficiently consistent for the sake of comparison. Table No. 7 and Figure No. 8 s h ~ w I,--- L I I ~ yrouped mean influent and effluent oil con- centrations. Coalescer effluent oil concentrations were consistent
throughout the entire inlet concen- tration range. The unit performance was obtained while holding the unit area flow rate between 206 and 257 bbl/d-ft2 (6-7.5 gpm/ft2). Oil reclaimed during the test period had bottom sediment and water con- tents as shown in Table 8. As a comparison, operating data from flotation cells on this same water
*- line are included in Table No. 7.
Light Oil Production
Site D
Site D was located on a platform in the Gulf of Mexico. Produced water from a l o w pressure separator was piped to the pilot unit. Oil pro- duced on the platform is approxi- mately 30" API. The results of the four-week trial are summarized in Table No. 9.
Throughput rates were varied be- tween 210 and 300 bbl/d-ft2 (6.1 and 8.7 gpm/ft2). Produced water temperature was consistently near 90°F.
Site E
Site E was located on the Califor- nia coast. Produced water was taken from a central receiving tank and pumped through the pilot unit. In- fluent concentrations were consis- tently above 1%. Temperatures ranged between 1 1 6 ° F and 124°F. Oil reclaimed was 30" API (60°F) grav- ity. Table No. 10 contains the op- erating data from the pilot trial.
Unit was run on this source for a period of five days. Mean values are based upon 34 data points col- lected over the trial period. Throughput rates, per unit surface area, during the trial ran ed be- tween 120 and 240 bbl/d-ftq (3.5-

TABLE NO. 4
I n f l u e n t O i l C o n c e n t r a t i o n 200
L o c a t i o n 200 mg/l 1000 mg/l 1000 mg/l
1 97.4% ( 1 . 9 mg/l 99.6% ( 3 . 0 m g / l ) -- 2 97.0% ( 3 . 5 mg/ l ) 99 .0% ( 4 . 6 mg/ l ) 99.5% ( 6 . 5 mg/ l )
TABLE NO. 5
Throughput R a t e Mean E f f l u e n t Mean % bbl /d- f t2 (gpm/f t2) O i l C o n c e n t r a t i o n Removal
103-136 (3.0-3.9) 137-170 (4.0-4.9) 171-204 (5 .0-5 .9) 205-238 (6 .0-6 .9)
6 .5 4.6 1 . 7 5.6
98.8 99.5 98.9 98.7
TABLE NO. 6
B o t t o m Sediment a n d Water (Volume % ) Sample #1 Sample # 2
T o t a l Cut Emulsion Water Sed j. m e n t
10.0% 0.0 8.6 1.4
12.0% 0.0
10.6 1 . 4
Influent Oil Concentration
Range Group Mean (mg/l)
0- 49 50- 99
100- 149 150- 199 200- 299 300- 399 400- 499 500- 599 600- 699 700- 799 800- 899 900- 999 1000 -1499 1500-1999 2000-299 9 3000-3999 4000-4999 5000-5999 6000
25.4 68.1 112.9
- -
360 - -
620
800 -
1100 1800 2400 3267 4700 5300 8000
TABLE NO. 7
No. of Data Effluent Oil (mg/l) Points Mean Concentration
Pilot Flotation
41 40 7
4.8 24.7 3.1 26.7 4.9 33.5
- - 2.5 28.1 - - - - 1.5 62.0
4.8 29.6 - -
3.5 44.0 3.0 - 5.4 31.2 3.5 - 5.1 32.9 2.3 - 3.0 -
TABLE NO. 8
Bottom Sediment and Water (Volume % ) Sample #1
T o t a l Cut Emulsion Water Sediment
API Gravity @ 600F
20.0 0 12.0 8.0 11.1
% Removal Pilot Flotation Unit Cell
81.1 2.8 95.4 60.8 95.7 70.3
- - 99.3 92.2 - - - - 99.8 90.0
99.4 96.3
99.7 96.0 99.8 - 99.8 98.7 99.9 - 99.9 99.3 99.9 - 99.9 -
- -
- -
Sample #2
20.0 0 12.0 8.0 10.3
_. - .- - - . Y - 8 ~ 8 ~ w c m UKAPPi PAPER E U G E N E DIETZGEN CO. MdDE IN U. 5. A. SEM I -LOGARITHM I C
3 CYCLES X 1 0 DIVISIONS PER I N C H
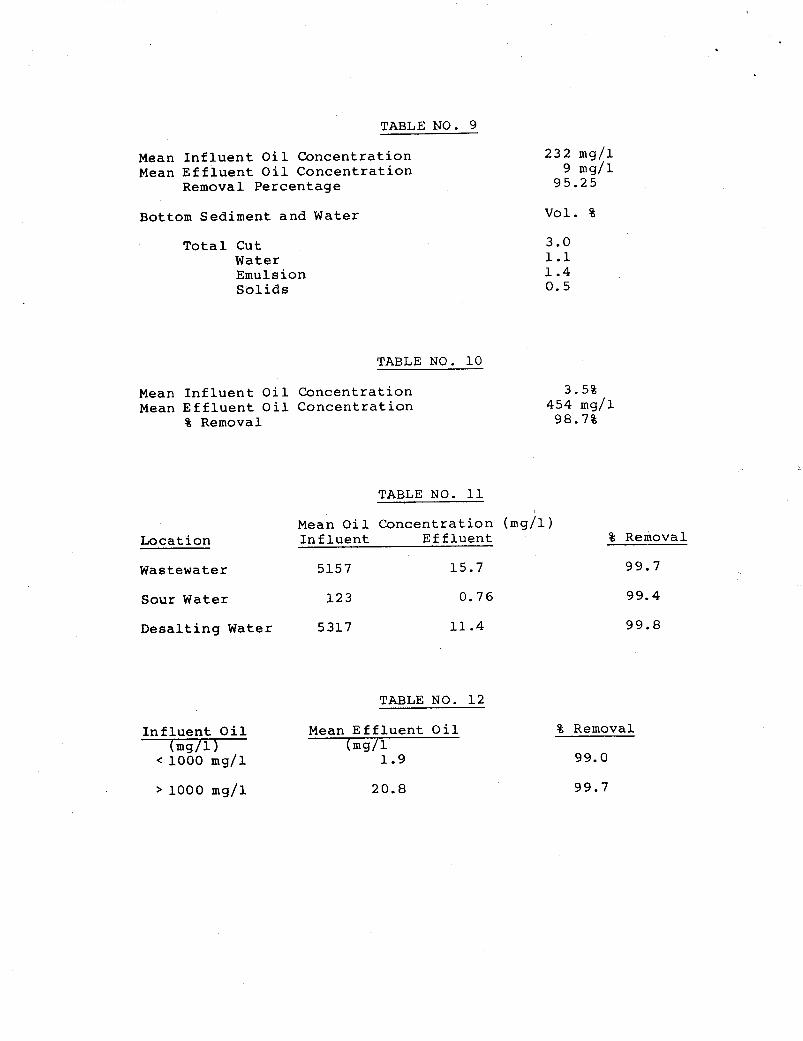
TABLE NO. 9
Mean Influent Oil Concentration Mean Effluent Oil Concentration
Remova 1 Percentage
Bottom Sediment and Water
Total Cut Water Emulsion Solids
TABLE NO. 10
232 mg/l
95.25 9 mg/l
V O l . %
3.0 1.1 1.4 0.5
Mean Influent Oil Concentration Mean Effluent Oil Concentration
8 Removal
3.5% 454 mg/l
98.7%
TABLE NO. 11
Mean Oi 1 Concentrat ion (mg/l) Locat ion Influent Effluent
Wastewater 5157 15.7
Sour Water 123 0.76
Desalting Water 5317 11.4
Influent 0 il
TABLE NO. 1 2
Mean Effluent Oil (ms/l -
1.9
20.8
% Removal -- 99.7
99.4
99.8
% Removal
99.0
99.7
.
((0 7.0 gpm/ft2). Despite the rela- tively high mean effluent oil con- centration, removal percentage was still in line with previous trials.
Refinery Wastewater Treatment
Site F
The pilot unit was tried at three different locations within this re- finery. The first location was gen- eral plant wastewater for a period of five days. The second location was on sour water for a period of four days. The third location was on a crude oil desalting water for a period of three days. The pilot unit results at the three locations are given in Table No. 11.
The data collected for all three locations show an almost equal dis- tribution of data points below (19) and above (17) 1000 mg/l influent oil concentration. These data mir- ror the removal percentages given in Table No. 11. Table No. 12 con- tains this information. The effect of operating rate on performance is given in Table No. 13.
0
Site G
At this location the unit was oper- ated for a period of seven days on the refinery wastewater. This test had an interesting influent oil concentration distribution. Forty percent of the influent oil concen- trations encountered were above 1000 mg/l. Fifty-three percent of the data points were below 100 mg/l. However, the mean effluent oil concentrations were almost identical. (see Table No. 14). This trial run was parallel to a CPI- flotation cell combination, compar- ative operating data are contained in Table 14.
The performance achieved with the influent oil concentration above 1000 mg/l oil was with a higher mean throughput rate. The mean throughput rate for influent oil concentrations above 1000 m /1 was 250 bbl/d-ft2 (7.3 gpm/ft3 ver- sus 223 bbl/d-ft2 (6.5 gpmlft’) for influent oil concentration be- low 100 mg/l. The mean temperatures were identical (133°F) in bot11 cases. It is difficult to say pre- cisely where an operating break point will occur in terms of throughput rate and influent oil concentration. More test work is scheduled for this location.
DISCUSSION OF RESULTS
Befitting the divergency of t.he in- fluent source, this discussion will deal separately with the heavy oil- produced waters, light oil-produced waters and refinery wastewaters,
Heavy Oil Produced Waters
The mean performance of the coal- escer pilot at the three locations tested was typically greater than 95% removal af oil. The only excep- tions were when the tempcratue Kaa low (86°F to 89°F at Site A) or the influent oil concentration was v e r y low ( 50 mg/l grouped mean inflil- ent at Site C). However, even under these conditions the effluent oi: concentrations were excellent:
Site A
Low temperature operation - 180 mg/l mean influent oil 14 mg/l mean effluent oil 92.2% removal
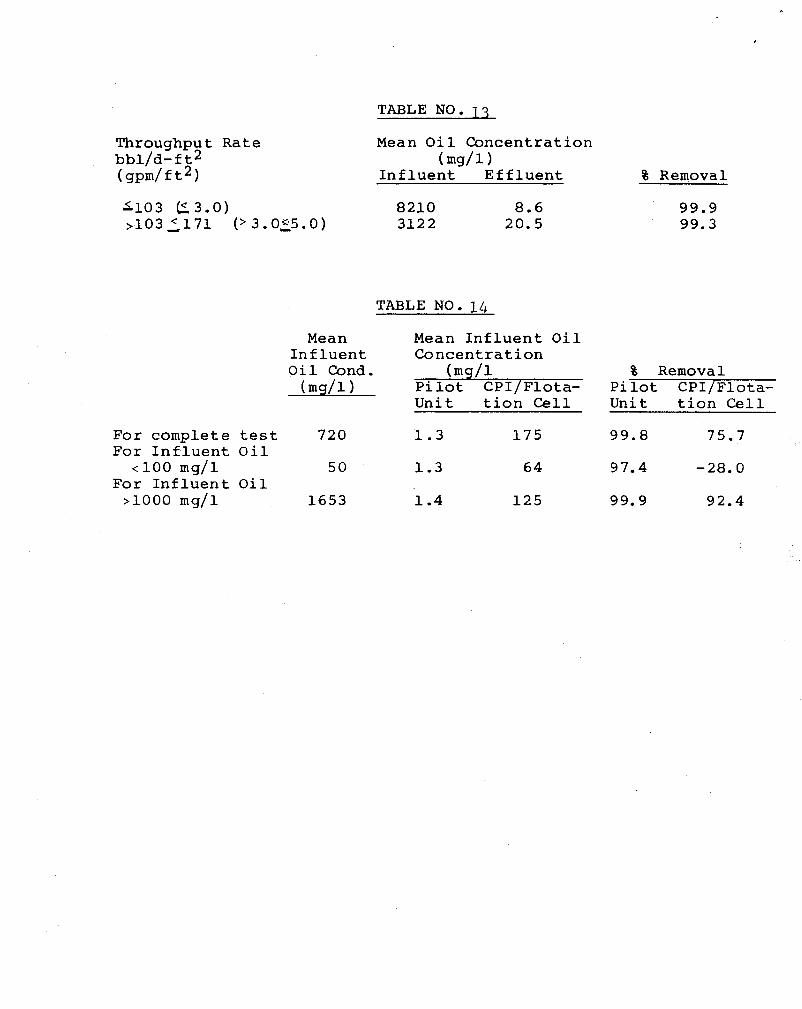
TABLE NO. 1 3
Throughput R a t e
( gpm/f t2 1 bbl /d- f t2
A103 (23.0) > l o 3 2 1 7 1 ( '3 .0z5.0)
Mean O i l C o n c e n t r a t i o n
I n f l u e n t E f f l u e n t % Removal (mg/ l )
8210 8.6 3122 20.5
99.9 99.3
TABLE NO. 14
Mean Mean I n f l u e n t O i l I n f l u e n t C o n c e n t r a t i o n Oil Cond. (mg/ l 8 Removal ( 4 1 1 P i l o t CPI /F lo t a - P i l o t CPI /F lo t a -
U n i t t i o n Cell Uni t t i o n Cell
F o r complete t e s t 720 1 . 3 1 7 5 99 .8 75.7 F o r I n f l u e n t Oil
F o r I n f l u e n t Oil < l o o mg/l 50 1 .3 6 4 97.4 -28.0
>lo00 mg/l 1653 1.4 1 2 5 99.9 92.4
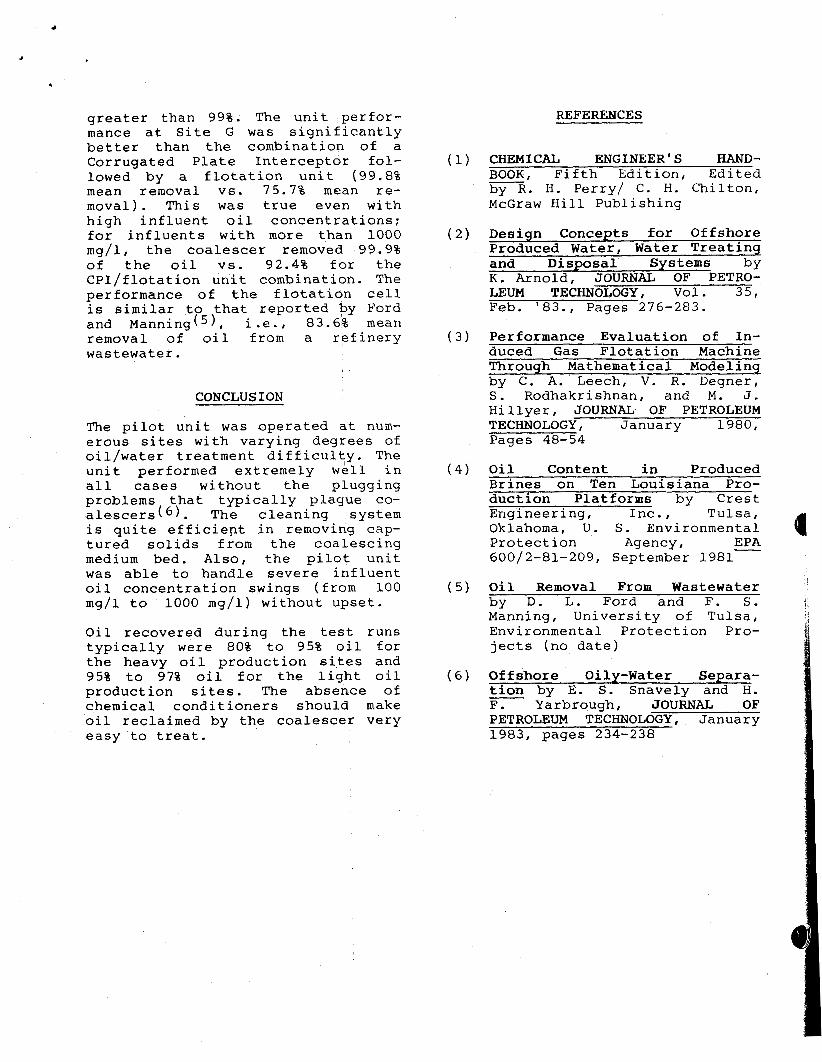
greater than 99%. The unit perfor- mance at Site G was significantly better than the combination of a Corrugated Plate Interceptor fol- lowed by a flotation unit (99.8% mean removal vs. 75.7% mean re- moval). This was true even with high influent oil concentrations: for influents with more than 1000 mg/l , the coalescer removed 99.9% of the oil vs. 92.4% for the CPI/flotation unit combination. The performance of the flotation cell is similar to that reported by Ford and Manning(5), i.e., 83.6% mean removal of oil from a refinery wastewater.
CONCLUSION
The pilot unit was sperated at num- erous sites with varying degrees of oil/water treatment difficulty. The unit performed extremely well in all cases without the plugging problems that typically plague co- alescers ( 6). The cleaning system is quite efficient in removing cap- tured solids from the coalescing medium bed. Also, the pilot unit was able to handle severe influent oil concentration swings (from 100 mg/l to 1000 mg/l) without upset.
Oil recovered during the test runs typically were 80% to 95% oil for the heavy oil production sites and 95% to 97% oil for the light oil production sites. The absence of chemical conditioners should make oil reclaimed by the coalescer very easy to treat.
REFERENCES
ENGINEER'S HAND- CHEMICAL BOOK, Fifth Edition, Edited by R. H. Perry/ C. H. Chilton, McGraw Hill Publishing
Design Concepts for Offshore Produced Water, Water Treating and Disposal Systems by K. Arnold, JOURNAL OF PETRO- LEUM TECHNOLOGY, Vol. 35, Feb. '83., Pages 276-283.
Performance Evaluation of In- duced Gas Flotation Machine Through Mathematical Modeling by C. A. Leech, V. R. Degner, S. Rodhakrishnan, and M. J. Hi llyer , JOURNAL OF PETROLEUM TECHNOLOGY, January 1980, Pages 48-54
Oil Content in Produced Brines on Ten Louisiana Pro- duction Platforms by Crest Engineering, Inc., Tulsa, Oklahoma, U. S. Environmental
EPA 600/2-81-209, September 1981
- Protection Agency,
Oil Removal From Wastewater bv D. L. Ford and F. S. - Manning, University of Tulsa, Environmental Protection Pro- jects (no date)
Offshore Oily-Water Separa- tion by E. S. Snavely and H. F . Yarbrouqh, JOURNAL, OF -
PETROLEUM TECHNOLOGY, January 1983, pages 234-238
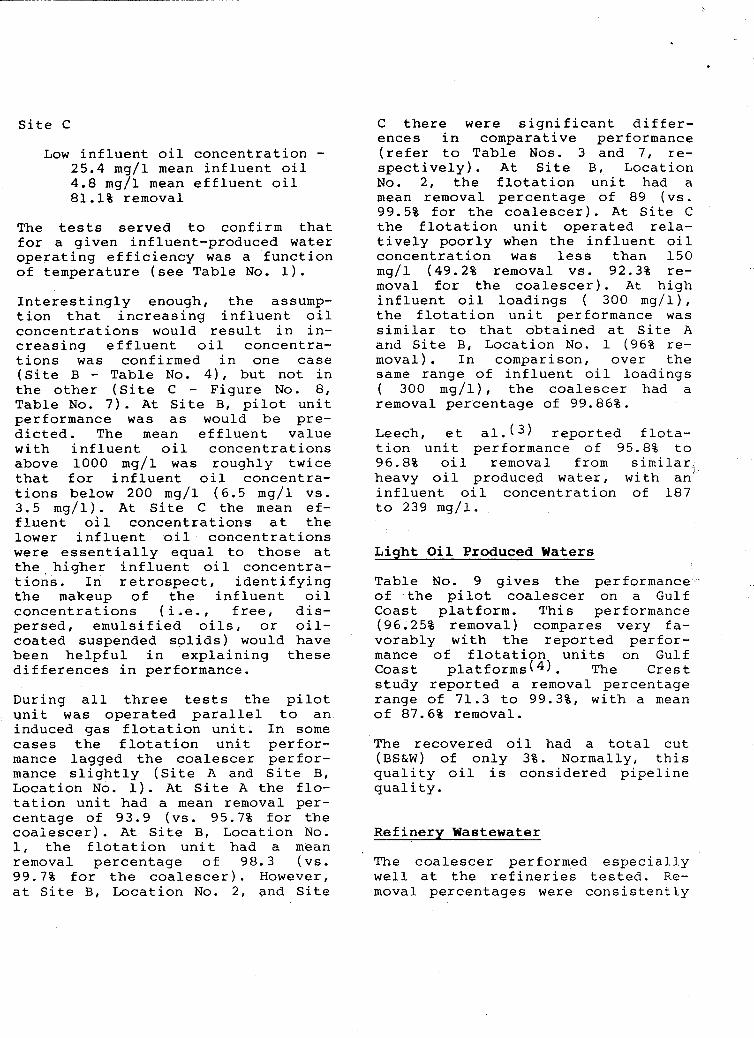
Site C
Low influent oil concentration - 25.4 mg/l mean influent oil 4.8 m g / l mean effluent oil 81.1% removal
The tests served to confirm that for a given influent-produced water operating efficiency was a function of temperature (see Table No. 1).
Interestingly enough, the assump- tion that increasing influent oil concentrations would result in in- creasing effluent oil concentra- tions was confirmed in one case (Site B - Table No. 4), but not in the other (Site C - Figure No. 8, Table No. 7). At Site B, pilot unit Ferformance was as would be pre- dicted. The mean effluent value with influent oil concentrations above 1000 mg/l was roughly twice that for influent oil concentra- tions below 200 mg/l (6.5 mg/l vs. 3.5 mg/l). At Site C the mean ef- fluent oil concentrations at the lower influent oil concentrations were essentially equal to those at the.higher influent oil concentra- tions. In retrospect, identifying the makeup of the influent oil concentrations (i.e., free, dis- persed, emulsified oils, or oil- coated suspended solids) would have been helpful in explaining these differences in performance.
During all three tests the pilot unit was operated parallel to an induced gas flotation unit. In some cases the flotation unit perfor- mance lagged the coalescer perfor- mance slightly (Site A and Site B, Location No. 1). At Site A the flo- tation unit had a mean removal per- centage of 93.9 (vs. 95.7% for the coaiescer). At Site B, Location No. 1, the flotation unit had a mean removal percentage of 98.3 (vs. 99.7% for the coalescer). However, at Site B, Location No. 2, and Site
C there were significant differ- ences in comparative performance (refer to Table Nos. 3 and 7, re- spectively). At Site B , Location No. 2 , the flotation unit had a mean removal percentage of 89 (vs. 99.5% for the coalescer). At Site C the flotation unit operated rela- tively poorly when the influent oil concentration was less than 150 mg/l (49.2% removal vs. 92.3% re- moval for the coalescer). At high influent oil loadings ( 300 mg/l), the flotation unit performance was similar to that obtained at Site A and Site B, Location No. 1 (96% re- moval). In comparison, over the same range of influent oil loadings ( 300 mg/l), the coalescer had a removal percentage of 99.86%.
Leech, et a1.(3) reported flota- tion unit performance of 95.8% to 96.8% oil removal from similar heavy oil produced water, with an influent oil concentration of 187 to 239 mg/l.
Light Oil Produced Waters
Table No. 9 gives the performance of the pilot coalescer on a Gulf Coast platform. This performance (96.25% removal) compares very fa- vorably with the reported perfor- mance of flotation units on Gulf Coast platforms(4). The Crest study reported a removal percentage range of 71.3 to 99.38, with a mean of 87.6% removal.
The recovered oil had a total cut (BS&W) of only 3%. Normally, this quality oil is considered pipeline quality . Refinerv Wastewater
The coalescer performed especially well at the refineries tested. Re- moval percentages were consistently
. . . .. ... - . .
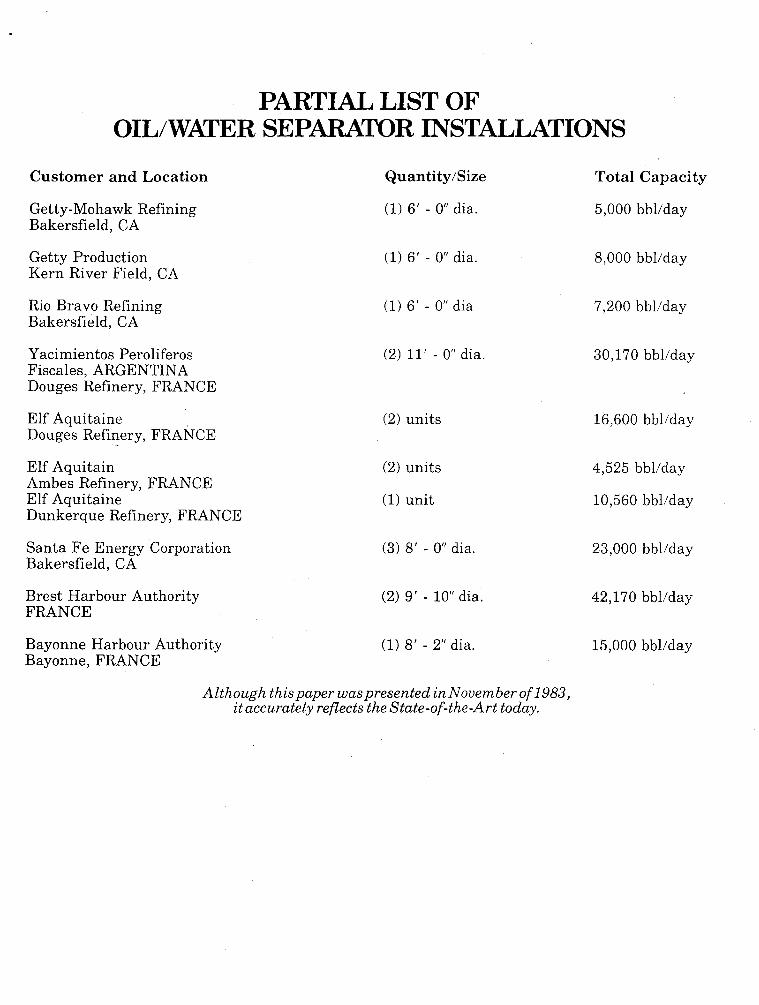
PARTIAL LIST OF OIL/WATER SEPARATOR INSTALLATIONS
Customer and Location Quantity/Size Total Capacity
5,000 bbl/day Getty-Mohawk Refining Bakersfield, CA
(1) 6’ - 0” dia.
Getty Production Kern River Field, CA
(1) 6’ - 0” dia. 8,000 bbl/day
Rio Bravo Refining Bakersfield, CA
(1) 6’ - 0” dia 7,200 bbl/day
Yacimientos Peroliferos Fiscales, ARGENTINA Douges Refinery, FRANCE
(2) 11’ - 0” dia. 30,170 bbl/day
(2) units 16,600 bbl/day Elf Aquitaine Douges Refinery, FRANCE
Elf Aquitain Ambes Refinery, FRANCE Elf Aquitaine Dunkerque Refinery, FRANCE
(2) units
(1) unit
4,525 bbl/day
10,560 bbl/day
Santa Fe Energy Corporation Bakersfield, CA
(3) 8‘ - 0” dia. 23,000 bbl/day
Brest Harbour Authority FRANCE
(2) 9‘ - 10” dia. 42,170 bbl/day
Bayonne Harbour Authority Bayonne, FRANCE
(1) 8’ - 2” dia. 15,000 bbl/day
Although this paper waspresented in November of 1983, it accurately reflects the State-of-the-Art today.
i