technical report standard title page r.cipi.t'l · pdf filetechnical report standard...
TRANSCRIPT

1. Report No. I 2. Go".rnm.nt Ac:e .. sion No. ~
TECHNICAL REPORT STANDARD TITLE PAGe
3. R.cipi."t'l Cotolo, No.
FHWA/TX-837~._5_+_23_6_-_2F_I~ __________ --t _________ , ___ ---1 4. Titl. and Subti,l. 5. ~;:yrt f9~b
Cantilever Retaining Wall Design
7. Authorl s)
Robert F. Bruner, Harry M. Coyle, and Richard E. Bartoskewitz
9. Performing Or,oni lotion Nom. and Add, ...
Texas Transportation Institute The Texas A&M University System College Station, Texas 77840
6. P.,fo,mi". O,geni,ohan Cod.
8. ?,fa,mi". O"."iI.t;o" R.,a" No.
Research Report 236-2F 10. Wo,k U"i' No.
11. Co,,'ract 0' Gran' No.
Study No. 2-5-78-236 t--:-::--::--______ --:---:-:-_____________ --j13. Typo of R.,or' a"d P.,iod Co".rod
12. Sponsoring A,oncy Nomo and Addro ..
Texas State Department of Highways and Public Transportation; Transportation Planning Division
. September 1977 Interlm - May 1983
14. Spo"sor;", A,."ey Codo P. O. Box 5051 Austin, Texas 78763
--~-------.-----------~------------------~ 15. Supplemontary Not.s
Research performed in cooperation with DOT. FHWA. Research Study Title: Determination of Earth Pressures for Use in Cantilever I
Retaining Wall Design. 16. Aba'rac'
Current retaining wall design procedures are summarized with emphasis on the prediction of lateral earth pressures using the Coulomb and Rankine earth pressure theories, and the equivalent fluid pressure method. Results from previous large scale retaining wall tests and field studies are presented. Different design aspects are introduced as background for a recent field performance study ..
Instrumentation for measuring earth pressures on bearing surfaces and movement Of a test wall constructed on a Texas State Department of Hi.ghways and Public Transportation (TSDHPT) project is described. Measured pressures and movements along with results of geotechnical tests tif the foundation and backfill soils are presented in detail.
The test waJl design based on the District 12 TSDHPT design standard is ~utlined and compared with results from the field performance study. A proposed I new design procedure is developed based on modification of current design procedures. Significant modifications were made in the areas of the use of cohesive soil in the backfill, ·the computation of lateral earth pressures, and the computation of stability against overturning.
17. Koy Word.
Cantilever Retaining Wall, Lateral Earth Pressure, Deflection, Rotation, New Design Procedure.
18. Distrlllv'iOll St.,_OIl'
No restrictions .. This document is available to the public through the National Technical Information Service, 5285 Port Royal Road, Springfield, Virginia 22161. f
I 19. Socuri'y Cla .. if. (of this ,.po") 20. S.curity Cloulf. (of 'his , ... ) 21. No. of p.... 22. P,iC.
Unclassified Unclassified 192 I Form DOT F 1700.7 18-691


CANTILEVER RETAINING WALL DESIGN
by
Robert F. Bruner Research Assistant
Harry M. Coyle Research Engineer
and
Richard E. Bartoskewitz Engineering Research Associate
Research Report No. 236-2F
Determination of Earth Pressures for Use in Cantilever Retaining Wall Design Research Study Number 2-5-78-236
Sponsored by State Department of Highways and Public Transportation
in cooperation with the U. S. Department of Transportation
Federal Highway Administration
May 1983
TEXAS TRANSPORTATION INSTITUTE The Texas A&M University System
College Station, Texas
Disclaimer
The contents of this report reflect the views of the authors who are responsible for the facts and accuracy of the data presented herein. The contents do not necessarily reflect the views or policies of the Federal Highway Administration. This report does not constitute a standard, specification or regulation.
There was no invention or discovery conceived or first actually reduced to practice in the course of or under this contract, including any art, method, process, machine, manufacture, design or composition of matter, or any new and useful improvement thereof, or any variety of plant which is or may be patentable under the patent laws of the United States of America or any foreign country.
ii

ABSTRACT
Current retaining wall design procedures are summarized with
emphasis on the prediction of lateral earth pressures using the
Coulomb and Rankine earth pressure theories, and the equivalent
fluid pressure method. Results from previous large scale
retaining wall tests and field studies are presented. Different
design aspects are introduced as background for a recent field
performance study.
Instrumentation for measuring earth pressures on bearing
surfaces and movement of a test wall constructed on a Texas State
Department of Highways and Public Transportation (TSDHPT) project
is described. Measured pressures and movements along with results
of geotechnical tests of the foundation and backfill soils are
presented in detail.
The test wall design based on the District 12 TSDHPT design
standard is outlined and compared with results from the field
performance study. A proposed new design procedure is developed
based on modification of current design procedures. Significant
modifications were made in the areas of the use of cohesive soil
in the backfill, the computation of lateral earth pressures, and
the computation of stability against overturning.
KEY WORDS: Cantilever Retaining Wall, Lateral Earth Pressure,
Deflection, Rotation, New Design Procedure
iii
SUMMARY
The information presented in this report was obtained during the
last three years of a five year study on "Determination of Earth Pres
sures for Use in Cantilever Retaining Wall Design". The objective of
this research was to conduct a field performance study on a full scale
cantilever retaining wall in order to verify or modifyu current design
procedures. This objective has been accomplished and the proposed
modifications in design procedure are based on measured earth pres
sures, measured wall movements, and measured geotechnical properties of
the soils adjacent to the wall.
The measured earth pressures on the heel (back) side of the wall
were greater than those predicted by current design procedures. A
proposed uniform pressure of 2 psi and an earth pressure coefficient of
unity are indicated for use in the proposed design modifications. The
measured earth pressure on the toe (front) was 3.5 times greater than
the pressure measured on the heel (back) at the same depth. Also,
significant earth pressure was measured on the front of the key. These
pressures contribute to the stability of the wall against sliding and
overturning. The measured pressures along the base of the footing were
nearly uniform because of foundation soil resistance which contributes
to stability against overturning. This contribution is included in the
proposed design modifications.
Total horizontal movement measurements indicated that most of the
movement occurred during the construction backfilling process. Verti
cal movement and tilt measurements were relatively small because
iv

of the stiff clay foundation soil. The undrained shear strength is
recommended in the modified design procedure because it is the approp
riate strength parameter during construction.
The proposed modification in design procedure should be verified
by additional field performance studies. These studies should include
walls with different proportions that are founded on and backfilled
with different soil types. This report contains recommendations for
instrumentation on future field studies.
v

IMPLEMENTATION STATEMENT
The proposed modifications in design procedures for cantilever
retaining walls which are presented in this report can be implemented
by the sponsoring agencies. However, the use of the proposed design
modifications should be limited to applications where the soil condi
tions are essentially the same as those surrounding the wall tested in
this study. Use of the design modifications in different soil condi
tions should be verified by additional field performance studies. The
addition of a key on the base of a footing founded on clay soils could
result in the elimination of the need for drilled piers or H-piles
under the footing, thereby reducing the overall cost of a cantilever
retaining wall.
vi
TABLE OF CONTENTS
INTRODUCTION • . . • • •
Problem Statement.
Terminology
. . . . . . . . . . . . . . . .
. . . . . Basic Design Procedures
Objective of the Study ••
. . . . .
CURRENT RETAINING WALL DESIGN PROCEDURES
Wall Proportions •••••
Geotechnical Properties
Gravity Forces • • . • ••
Lateral Earth Pressures
Footing Pressure •
Stability ••••
Structural Design
Drai nage •.
Construction
REVIEW OF PREVIOUS RESEARCH .
Large Scale Retaining Wall Tests
Unstudied Design Aspects of Cantilever
Retaining Walls ••.
Background on Present Research Program •
TEST WALL . . . .
Page
1
. . . . . .
1
3
4
5
5
5
5
6
. . . . 18
18
22
23
23
. . . . . . 25
25
30
• • • • 31
Test Site . . . . . . . . 34
34
Test Wall Description
Instrumentation
Soil Conditions
. . . . . . . . . .
vii
. . . . . .. 34
37
48
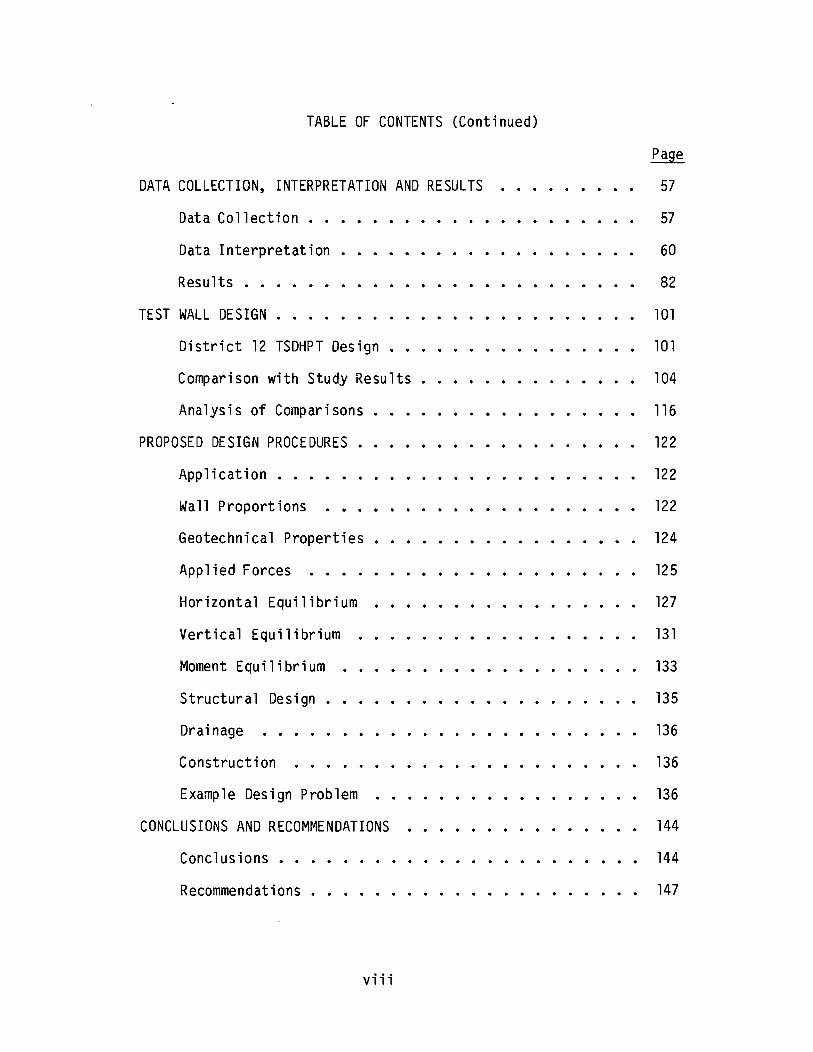
TABLE OF CONTENTS (Continued)
DATA COLLECTION, INTERPRETATION AND RESULTS
Data Collection ..
Data Interpretation •
Results ••
TEST WALL DESIGN .
District 12 TSDHPT Design •
Comparison with Study Results.
Analysis of Comparisons.
PROPOSED DESIGN PROCEDURES •
Application ••••
Wall Proportions
Geotechnical Properties •
Applied Forces •.••
Horizontal Equilibrium
Vertical Equilibrium
Moment Equilibrium
Structural Design •
Drainage
Construction •..•.••
Example Design Problem ••••
CONCLUSIONS AND RECOMMENDATIONS
Conclusions ••
Recommendations
viii
Page
57
57
60
82
101
101
104
116
122
122
122
124
125
127
131
133
135
136
136
136
144
144
147

TABLE OF CONTENTS (Continued)
APPENDIX 1. - REFERENCES •
APPENDIX 11.- NOTATION.
APPENDIX 111.- EARTH PRESSURE DETERMINATION.
ix
Page 149
152
156
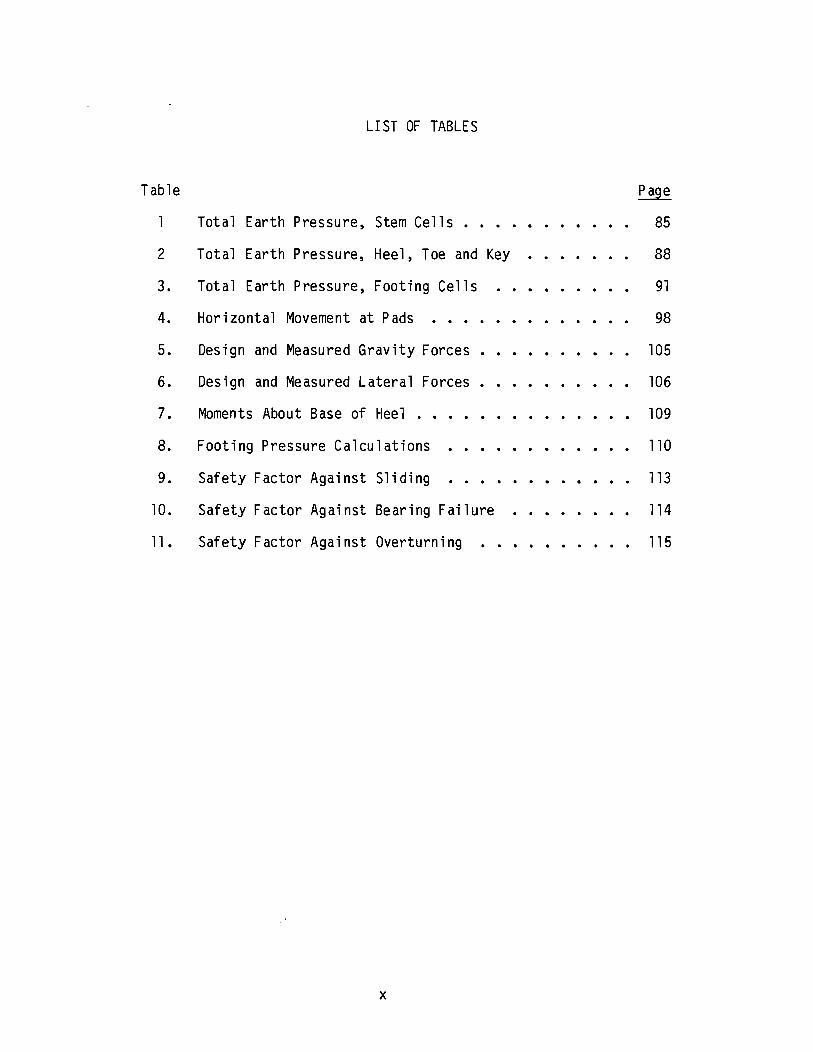
LI ST OF TABLES
Table Page
1 Total Earth Pressure, Stem Cells. · · · · 85
2 Total Earth Pressure, Heel, Toe and Key 88
3. Total Earth Pressure, Footing Cells 91
4. Hor i zonta 1 Movement at Pads · · · · 98
5. Design and Measured Gravity Forces • 105
6. Design and Measured Lateral Forces • 106
7. Moments About Base of Heel . . . . . . . . . 109
8. Footing Pressure Calculations 110
9. Safety Factor Against Sliding · · · · . 113
10. Safety Factor Against Bear i ng F ai 1 ure · · . . 114
ll. Safety Factor Against Overturning 115
x
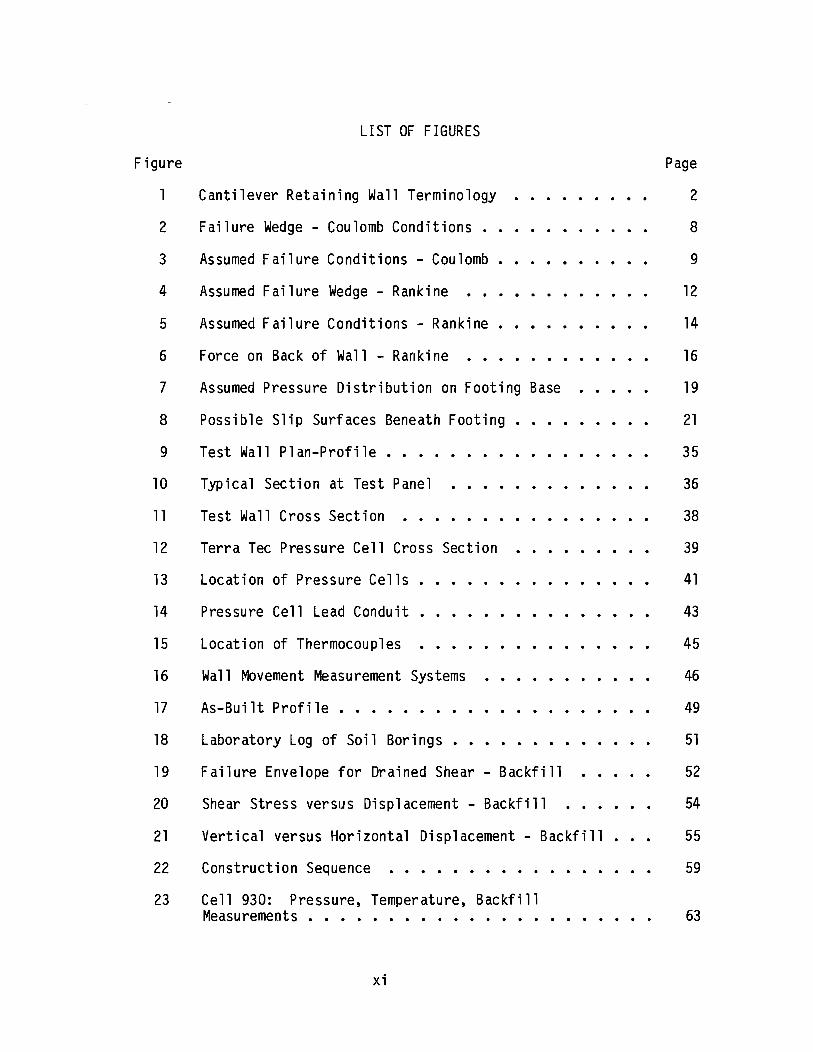
Figure
2
3
4
5
6
7
8
9
10
11
12
13
14
15
16
17
18
19
20
21
22
LIST OF FIGURES
Cantilever Retaining Wall Terminology
Failure Wedge - Coulomb Conditions ••
Assumed Failure Conditions - Coulomb
Assumed Failure Wedge - Rankine
Assumed Failure Conditions - Rankine.
Force on Back of Wall - Rankine
Assumed Pressure Distribution on Footing Base
Possible Slip Surfaces Beneath Footing
Test Wall Plan-Profile
Typical Section at Test Panel
Test Wall Cross Section
Terra Tec Pressure Cell Cross Section
Location of Pressure Cells.
Pressure Cell Lead Conduit.
Location of Thermocouples
Wall Movement Measurement Systems
As-Built Profile •••
Laboratory Log of Soil Borings.
Failure Envelope for Drained Shear - Backfill
Shear Stress versus Displacement - Backfill
Vertical versus Horizontal Displacement - Backfill.
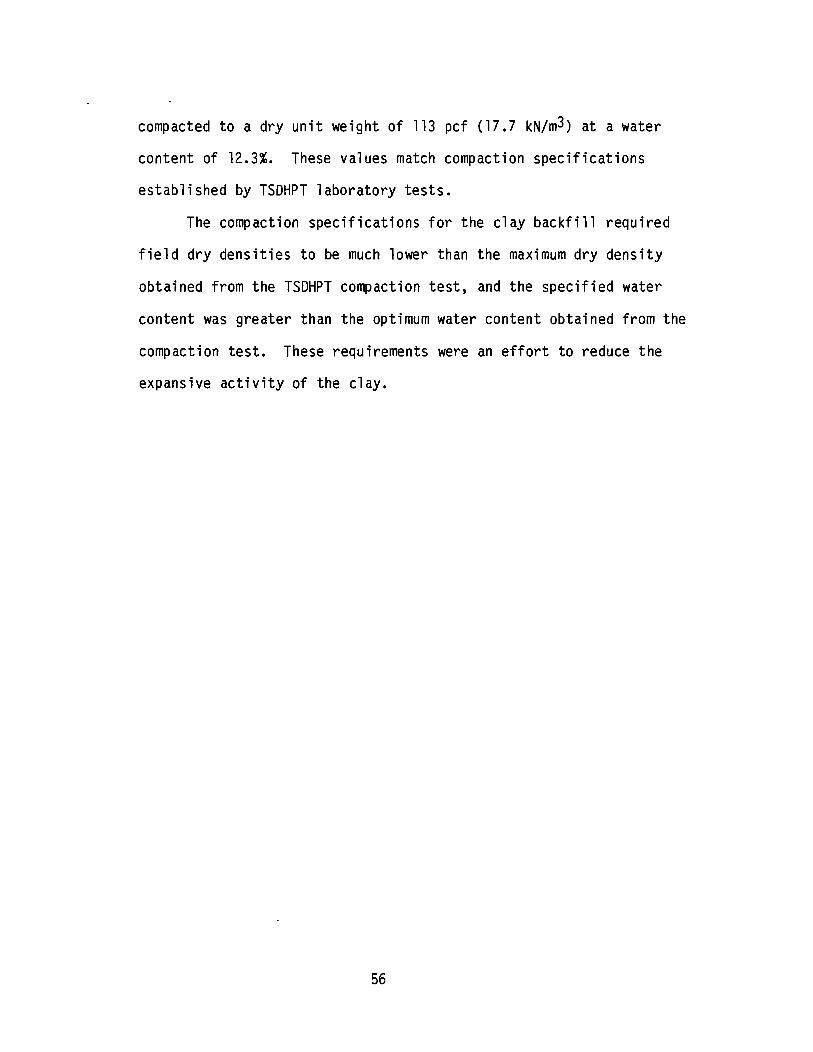
Construction Sequence
23 Cell 930: Pressure, Temperature, Backfill Measurements • • • • • • • • . • • . • • •
xi
Page
2
8
9
12
14
16
19
21
35
36
38
39
41
43
45
46
49
51
52
54
55
59
63
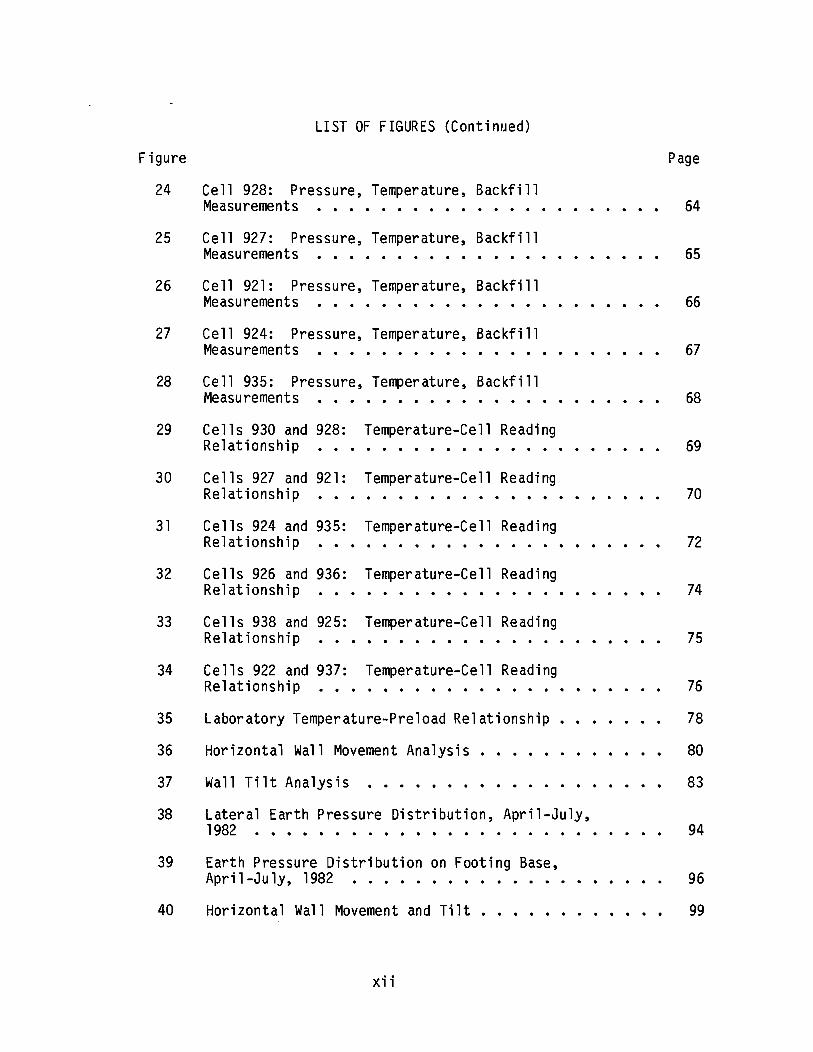
LIST OF FIGURES (Continued)
Figure Page
24 Cell 928: Pressure, Temperature, Backfi 11 Measurements · · · · · · · · · · · · · · · · · · · · · · 64
25 Ce 11 927: Pressure, Temperature, Backfi 11 Measurements · · · · · · · · · · · · · · · · · · · · · · 65
26 Cell 921: Pressure, Temperature, Backfi 11 Measurements · · · · · · · · · · · · · · · · · · · · · · 66
27 Cell 924: Pressure, Temperature, Backfi 11 Measurements · · · · · · · · · · · · · · · · · · · · · · 67
28 Cell 935: Pressure, Temperature, Backfi 11 Measurements · · · · · · · · · · · · · · · · · · · 68
29 Cells 930 and 928: Temperature-Cell Readi ng Relationship · · · · · · · · · · · · · · · · · · · 69
30 Cells 927 and 921: Temperature-Cell Reading Relationship · · · · · · · · · · · · · · · · · · · 70
31 Cells 924 and 935: Temperature-Cell Reading Relationship · · · · · · · · · · · · · · · · · · · 72
32 Cells 926 and 936: Temper ature-Ce 11 Reading Relationship · · · · · · · · · · · · · · · · · · · 74
33 Cells 938 and 925: Temper atu re-C ell Reading Relationship · · · · · · · · · · · · · · · · · · · 75
34 Cells 922 and 937: Temperature-Cell Readi ng Relationship · · · · · · · · · · · · · 76
35 Laboratory Temperature-Preload Relationship 78
36 Horizontal Wall Movement Analysis · · · · · · 80
37 Wall Tilt Analysis · · · · · · · · 83
38 Lateral Earth Pressure Distribution, April-July, 1982 . . . . · · · · · · · · · · · · · · · · · · · · 94
39 Earth Pressure Distribution on Footing Base, April-July, 1982 · · · · · · · · · · · · 96
40 Horizontal Wall Movement and Tilt · · · · · · · · · · · · 99
xii
LIST OF FIGURES (Continued)
Figure
41 Free Body Diagram~ District 12 TSDHPT Design
42
43
44
Foundation Soil Resistance to Deformation.
Proposed Wall Proportions ••.•••
Free Body Diagram~ Proposed Design
viii
Page
102
121
123
126
INTRODUCTION
Problem Statement
The Texas State Department of Highways and Public Transportation
(TSDHPT) is responsible for the acquisition of right of way, design,
construction inspection and maintenance of transportation facilities
throughout the state. Many high volume traffic routes pass through
urbanized areas which require grade separations at street or highway
intersections. This creates the problem of providing grade separations
within a minimum amount of right of way, and the problem is especially
prevalent in urban areas where land costs are very high. This problem
can be solved by utilizing a retaining wall, which is a structure used
to maintain a difference in elevation between ground surfaces when
space limitations prevent the use of a natural slope. Retaining walls
have been constructed successfully on TSDHPT projects for many years.
However, there is some concern among TSDHPT engineers that these walls
have been overdesigned. The future need for additional retaining walls
has led to the proposal that the current design procedures be verified
or that an improved design procedure be developed.
Terminology
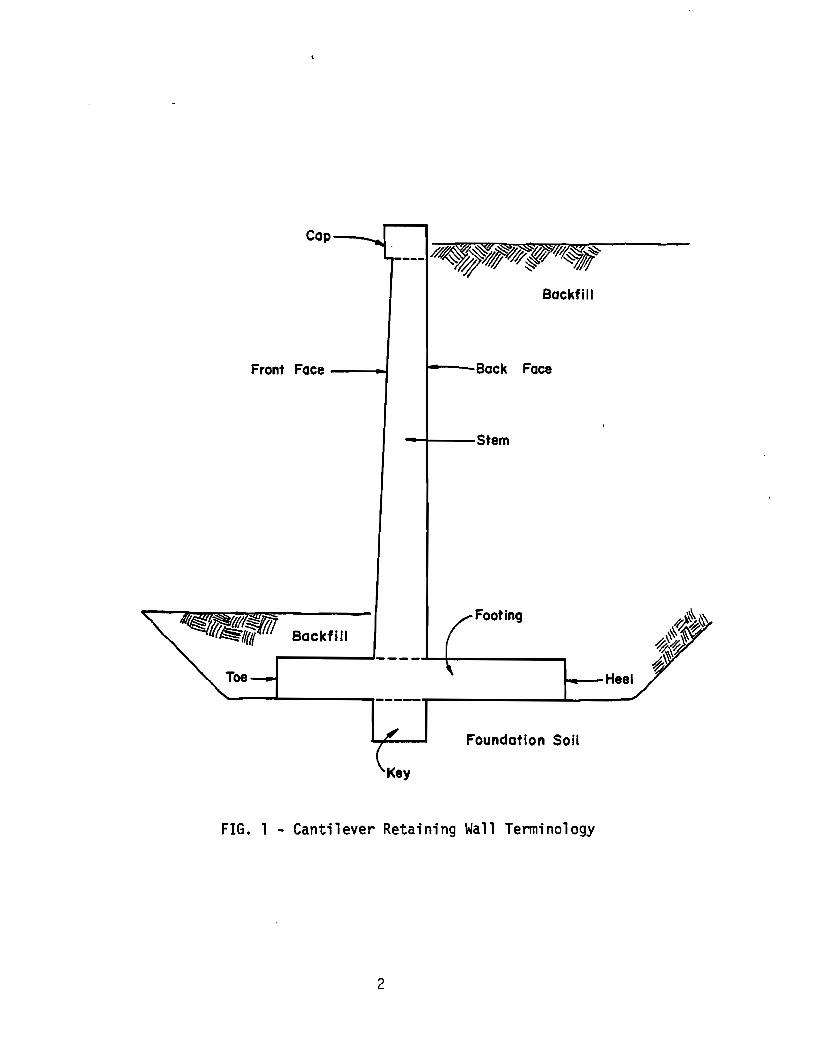
The terminology associated with a cantilever wall cross section is
given in Fig. 1. The stem acts structurally as a cantilever beam which
must resist the lateral thrust caused by the soil mass against the wall.
Numbers in parentheses refer to the references in Appendix I.
1
Cap----
--- #~~~~~q4(~jf Backfill
Front Face ---' t----Back Face
-+---Stem
Footing
Backfill
--------~----~~----------Heel
'---~--------~-----T------------~------
Foundation Soil
FIG. 1 - Cantilever Retaining Wall Terminology
2
The front face is the side of the stem which is exposed for much of the
wall height and the back face is the side of the stem which is adjacent
to the backfill for most of the wall height. The cap is an optional
component which is often included if a guard rail or barrier fence is
attached to the top of the stem. The footing is the structural
component that must transmit vertical forces to the undisturbed soil.
Consequently, the footing is designed using the same criteria as those
used for shallow foundations. Backfill is the disturbed material used
to bring the ground surfaces up to design elevations. A key is an
optional component that may be included to resist lateral thrust and
movement. Keys may be located at different positions along the base of
the footing. The heel is the face of the footing on the back side of
the wall, and the toe is the footing face on the front side of the
wall. Those portions of the footing on the front and back sides of the
wall are termed the toe projection and heel projection respectively.
Basic Design Procedures
Cantilever retaining walls are currently designed by a process of
trial and correction of section dimensions. Earth pressures acting on
the trial section are computed based on earth pressure theories, the
assumed wall movement and the geotechnical properties of the foundation
soil and backfill. The section dimensions are revised until the wall
is stable against sliding, bearing failure or excessive settlement and
overturning. Then computations for areas of steel, depth of sections,
bond stresses and resisting moments typical of reinforced concrete
design are performed, but are not a part of this study.
3

Objective of the Study
The objective of this research is to conduct a field performance
study on a full scale cantilever retaining wall in order to verify or
modify current design procedures and to propose an improved design pro
cedure. The design procedures to be proposed are based on measured
earth pressures, measured wall movements and the geotechnical prop
erties of the soil adjacent to the wall. The basic means to achieve
this objective are:
1. Review current design procedures to use as a format for the
proposed design procedure.
2. Review previous research to plan the field performance study
procedures and select instrumentation methods.
3. Install instrumentation to measure earth pressures on the
bearing surfaces of the test wall for the duration of the
study to obtain the critical earth pressure distributions to
be used in the proposed design procedure.
4. Install instrumentation to measure horizontal and vertical
displacement and tilt of the wall for the duration of the
study to obtain the response to earth pressures.
5. Obtain soil samples of the foundation soil and backfill to
determine the geotechnical properties and supplement these
results with reports of soil exploration at the site and soil
test results by the project inspector.
6. Compare the test wall design procedures with corresponding
study measurements.
4
CURRENT RETAINING WALL DESIGN PROCEDURES
Wall Proportions
Each project will impose certain requirements on the wall pro
portions. The height of the wall is a function of the required eleva
tion difference on each side of the wall and the depth of cover on the
toe side of the wall. The footing width is a function of wall height
and stability requirements established in the design procedures. A
cantilever wall is most often used and is the type of cross section
under consideration in this study. Trial proportions are given in many
references (1, 11).
Geotechnical Properties
The geotechnical properties of the foundation soil and backfill
should be measured in order to obtain the most efficient design. The
shear strength and compressibility of the foundation soil are needed to
ensure that bearing failure or excessive settlement does not occur.
Lateral earth pressures are a function of the unit weight and shear
strength of the backfill. The location of the ground water table is
important as porewater pressure affects each of the properties
mentioned above. The permeability of the backfill is also a considera
tion.
Gravity Forces
The gravity forces which contribute to the earth pressures are
the weight of the structure and the portion of the backfill included in
the free body diagram. Typical free body diagrams are given later.
The weight of any structure which falls within the free body diagram
must also be incl~ded. Many designers include live loads. In current
5
design procedures, liveloads are represented by an additional uniform
depth of backfill placed on the heel side of the wall (18, 19). This
hypothetical backfill is described as an equivalent surcharge.
Lateral Earth Pressures
The lateral earth pressures which develop on the vertical bearing
surfaces of the wall must be predicted. These predictions of lateral
earth pressures are generally based on limiting equilibrium mechanics
and the assumptions that the active state of stress develops in the
soil on the heel side of the wall and the passive state of stress
develops on the toe side of the wall. The concept associated with
limit or plastic equilibrium is that sufficient wall movement occurs so
that the full shearing strength of the backfill soil is developed. The
active state of stress corresponds to the minimum lateral pressure that
can develop, and the passive state of stress corresponds to the maximum
lateral pressure that can develop (8, 11). The at rest state of stress
implies no wall movement and elastic equilibrium conditions.
The lateral earth pressure predictions are based on the geotech
nical properties of the soil and the original classical earth pressure
theories of Coulomb in 1776 (1,8) or Rankine in 1857 (1,8). Designers
currently apply these theories either directly by analytical solutions
or indirectly through graphical and semi empirical methods.
Coulomb's Theory.- Coulomb's theory is an attempt to mathemati
cally interpret the force system acting upon a retaining structure.
There are two basic parts to this theory:
1. Obtaining the magnitude of the lateral force acting upon the
retaining structure, and
6
2. Describing the lateral pressure distribution in order to
define the point of application of the lateral force.
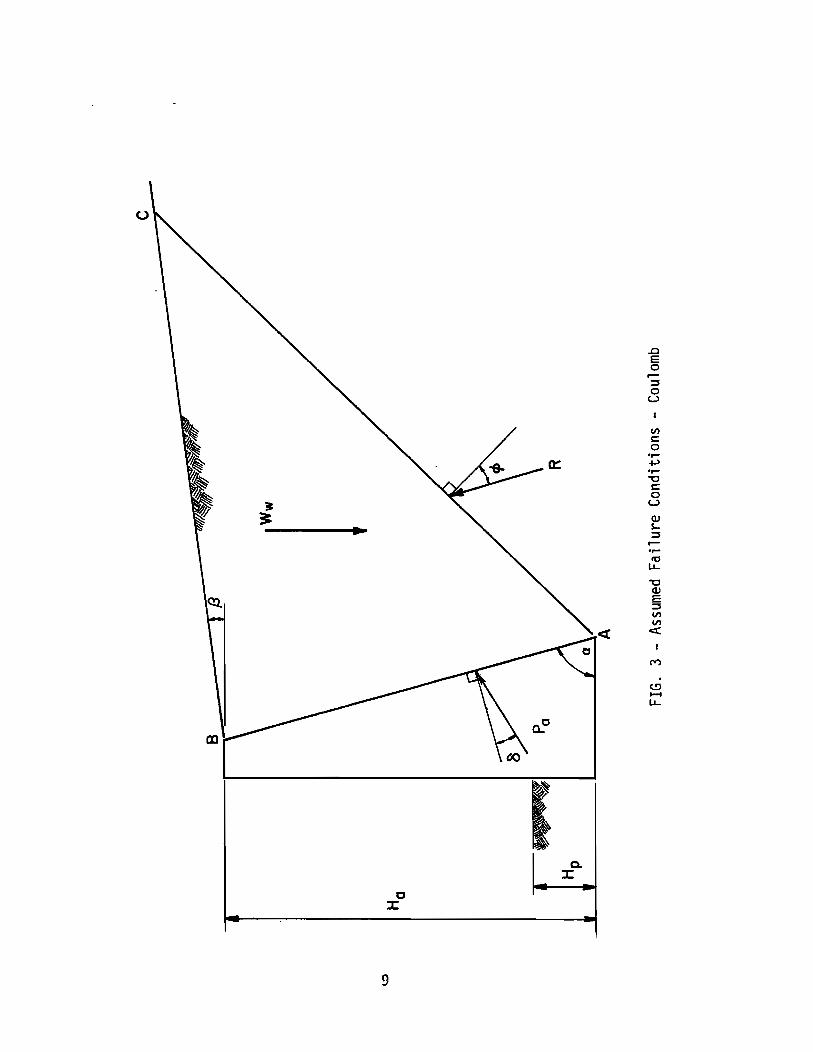
Coulomb observed that a wedge of soil formed behind the retaining
structure when the lateral force became a minimum. He made these
observations on walls with a planar back face. These conditions infer
that the active state of stress develops behind the wall and the soil
within the failure wedge is in a state of plastic equilibrium. The
failure wedge is bounded by the back of the wall and a rupture surface
through the backfill as shown in Fig. 2. To obtain the magnitude of
the lateral force, Coulomb assumed (1):
1. The soil is homogeneous and isotropic.
2. The rupture surface is a plane.
3. The shear resistance is uniformly distributed along the
rupture surface.
4. The failure wedge acts as a rigid body.
5. Friction is developed between the wall and the failure wedge.
6. Plane strain applies.
The magnitude of the minimum force against the wall is obtained by
considering equilibrium of the failure wedge in light of the assump
tions above. The force system is shown in Fig. 3. The weight of the
soil within the failure wedge is Ww• Pa is the resultant of the
pressures along the structure and acts at the wall friction angle, 0 ,
from the normal. R is the resultant of the normal and shear stresses
along the rupture surface and acts at the angle of shear resistance,~ ,
from the normal.
The point of application of Pa is obtained by considering that
7

III s:: 0 .... ...., ....
"0 s:: 0
U
..0 E 0 .... ::I 0
U CP ell
QJ 01
"0
"0
CP ~
QJ CP 3 .... ::3 QJ
~ ::I .... If .... ttl
U-
N
~ -U-
8
(.)
CD
o ::I:
9
a::
c. ::I:
..0 E 0 ,.... ~ 0
U
Vl C 0 .,.... ....,
.,.... -0 C 0
U
QJ ~ ~ ,....
.,.... 10 u.. -0 QJ E ~ Vl Vl
<C
M . C..!:l ...... u..
the force acts through the centroid of the earth pressure distribution
along the back face of the retaining structure. For this part of his
theory, Coulomb assumed a distribution that increases linearly with
depth, as a hydrostatic pressure. No attempt was made to justify this
assumption (22). This solution places the point of application of Pa
at one-third of the wall height above the base of the structure.
The hydrostatic pressure distribution and the development of
trigonometry simplified the calculation of Pa to
• • • • • • • • • • • • • • • • • • • • • • • • • • (1)
in which y = the unit weight of the backfill and Ha = the depth of
backfill on the heel side of the wall. Ka is the coefficient of
active earth pressure and is defined, in terms of Coulomb's conditions
as
Ka = -S-i n-2-a-s ,-. n-(-a_-o-)-=S~'« : a + S i ~ sin
(q,+o) (a-o)
sin sin
(cp-S) )2 (a+S)
• • • • • • • (2)
in which a,S ,0 and cp are angles as shown in Fig. 3. The derivation
of these equations can be found in many soil mechanics texts (1).
Passive earth pressures act on the front of the retaining struc
ture. By analogy, the resultant force of the passive earth pressure,
Pp, is defined by the equation
K YH2
Pp = P2 P ••• ~ •••••••••••••••••••••••• (3)
10

in which Hp = the depth of backfill in front of the wall. Kp is
the coefficient of passive earth pressure and is defined, in terms of
Coulomb's conditions, as
sin2 (a-<p) Kp = --=----~i~...>...:-~--:;::::;=:::;:::::;::::;:==:}2 . . . . . . . ( 4 )
2 (' :+0) sin (,1,+0) sin a sin (a+o) 1 _ ~ _ w ~ (a+o) sin (a+S)
The main deficiencies in Coulomb's basic assumptions are those
involving the ideal soil and plane rupture surface. Real soils are
neither homogeneous nor isotropic. A plane rupture surface was assumed
to simplify computations. This is considered to have a minor effect
for the active case but can lead to large errors for the passive case.
Cantilever retaining walls do not have the planar back face which is a
basic condition in the derivation of Coulomb's theory.
Rankine's Theory.- Rankine considered an infinitely long and deep
cohesionless soil deposit with no external forces and examined the
effects of laterally expanding or compressing the soil mass. This
condition implies that the change from an at rest state of stress to
the active passive state of stress is impending (22). In applying
Rankine's theory to retaining walls, both rupture surfaces must occur
within the soil (8,19). This condition requires that neither rupture
surface intersect the back face of the retaining wall; therefore, no
sliding occurs betweeen the wall and the soil. This is illustrated in
Fig. 4. Soil wedge ABF would remain in position and remain in an
elastic state of stress. The failure wedge would slip along the
rupture surface, or shear plane, AF, not along the back face of the
11

Q) Cl "0 Q)
~
Q) ~
::I
·S IL.
Q) ~
::I -Q. ::I
0:::
c X
12
(J) s:: .,.... ~ s:: ~
c::::
(J) t::n
"'0 (J)
:3: (J) So.. ~ ,.....
.,.... ~
LI...
"'0 (J)
E ~ III III
c:c
wall. This condition is often incorrectly treated as a requirement
that the back face of the wall be frictionless for Rankine's theory to
apply.
Rankine's active state of stress occurs when the soil within the
failure wedge is in a state of plastic equilibrium and the lateral
earth pressure developed is a minimum. Since no rupture surface occurs
along the retaining wall, the lateral force is determined on a vertical
plane which passes through point A on the failure wedge as shown in
Fig. 5. Ww is the weight of the soil bounded by the vertical plane
and the rupture surface. R is the resultant of the normal and shear
stresses along the rupture surface and it deviates from the normal to
the rupture surface by the angle of shear resistance of the soil, ¢.
Pa is the resultant of the active pressures along the vertical plane
and it deviates from the horizontal by the angle of the ground surface
slope,13 •
Pa acting parallel with the ground slope, is consistent with
Rankine's assumed ideal soil properties. A hydrostatic pressure
distribution is assumed. This places the point of application of Pa
and R at the lower one-third points of the vertical plane and the
rupture surface as illustrated in Fig. 5. The lines of action of these
forces intersect at the line of action of Ww as required for equilib
rium (8). The resultant force of the lateral earth pressure is
computed using Eq. 1, except the coefficient of active earth pressure
in terms of Rankine's conditions is used which is
Ka = cos cos 13 - ~ cos 2 13 - cos2 ~
+ ~ cos 2 13 - cos 2 ¢ cos 13-
(5)
13
cu s::: .'-~ s::: fa c:::
If)
s::: 0 .'-of.) .'-"0 s::: 0 u cu ~ ::l .--.'-fa
I.l..
"0 cu E ::l If) If)
> -------- <t c:::::
It)
(!' -I.l.. rE
14
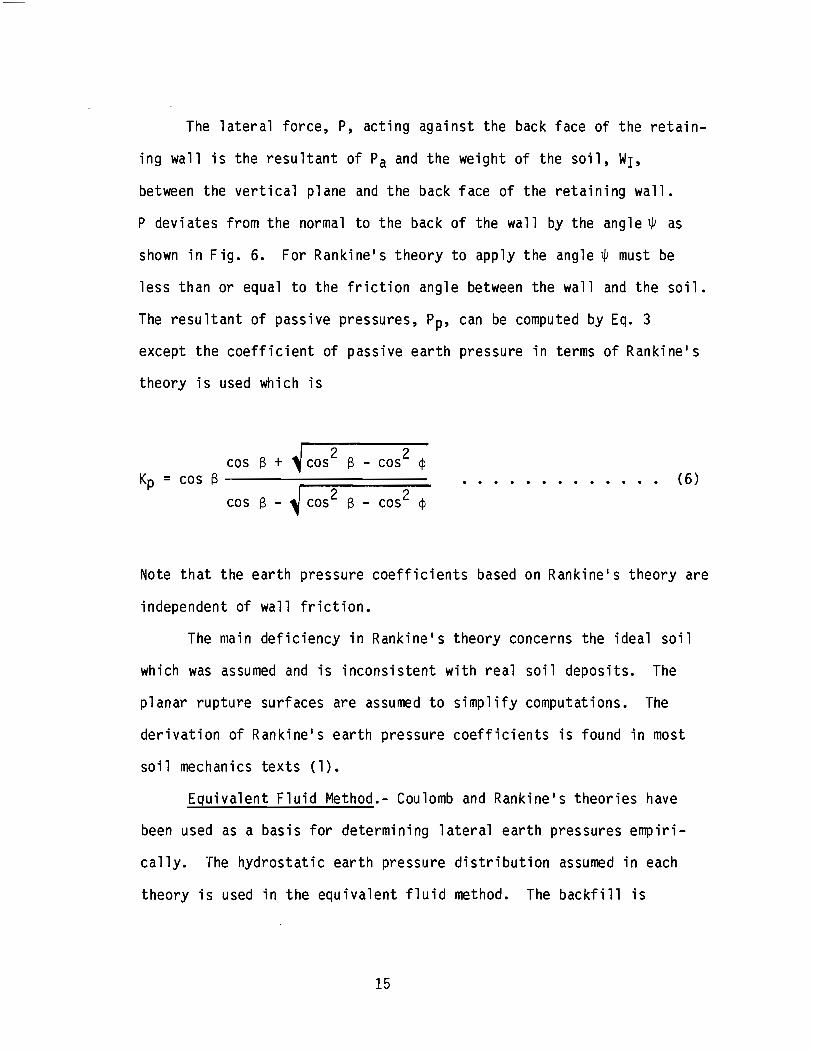
The lateral force, P, acting against the back face of the retain
ing wall is the resultant of Pa and the weight of the soil, WI,
between the vertical plane and the back face of the retaining wall.
P devi ates from the normal to the bac k of the wa 11 by the ang 1 e 1jJ as
shown in Fig. 6. For Rankine l s theory to apply the angle 1jJ must be
less than or equal to the friction angle between the wall and the soil.
The resultant of passive pressures, Pp, can be computed by Eq. 3
except the coefficient of passive earth pressure in terms of Rankine1s
theory is used which is
Kp = cos S cos S + ~ cos 2 S - cos2
cp
cos S - ~ cos2 S - cos2 cp
. . . . . . . . . . . . . (6)
Note that the earth pressure coefficients based on Rankine1s theory are
independent of wall friction.
The main deficiency in Rankine1s theory concerns the ideal soil
which was assumed and is inconsistent with real soil deposits. The
planar rupture surfaces are assumed to simplify computations. The
derivation of Rankine1s earth pressure coefficients is found in most
soil mechanics texts (1).
Equivalent Fluid Method.- Coulomb and Rankinels theories have
been used as a basis for determining lateral earth pressures empiri
cally. The hydrostatic earth pressure distribution assumed in each
theory is used in the equivalent fluid method. The backfill is
15

16
,..... ,..... ~ ~ o ~ U 1'0 co
c: o Q) u ~ o
LI..
. (.!:j ...... LI..
assigned a unit weight of an equivalent fluid, Ye, depending upon the
soil type. The magnitude of the lateral force on the heel side of the
wa 11 is
. . . . . . . . . . . . . . . . . . . . . . . . . . . (7)
in which H = the depth of backfill above the base of the heel. Values
of Ye range between 30 to 120 pcf (4.7 to 18.9 kN/m3) for backfills
placed horizontally (23). The point of application of Ph is at the
lower third point of the section considered. The section used for
cantilever retaining walls is typically a vertical plane which passes
through the heel of the footing. H is the vertical distance from the
bottom of the heel to the ground surface. The line of action of Ph
should be horizontal, but agrees better with theory if taken to be
parallel with the ground slope (8). The resultant force on the back of
the retaining wall is obtained as the vector sum of the weight of the
soil between the back of the wall and the vertical plane through the
heel and Ph.
The use of the equivalent fluid method is consistent with the
Rankine theory when the ground slope is horizontal. The equivalent
fluid method should not be used for sloping backfills as a fluid would
have a level surface. This discrepancy is partially offset by using a
Ye value which is larger than would be used for a level ground sur-
face (8,23).
The values of Ye discussed above apply to the active state of
stress. If the r~sultant of the passive pressure on the toe side of
17
the wall is desired, the value of Ye should be increased, but no
accepted method has been published. Also, most designers conservative
ly omit lateral support on the toe side of the wall.
Footing Pressure.
The lateral forces computed using the methods described previous
ly cause eccentric loading on the spread footing. The pressure distri
bution along the base of the footing is commonly computed using the
formula for flexure and direct stress in the form
q = ~ (1 + 6se) • • • • • • • • • • • • • • • • • • • • • • • • • • • (8)
in which V = the sum of the gravity forces above the footing, B = the
footing width and e = the eccentricity as illustrated in Fig. 7. The
solution of Eq. 8 yields the maximum and minimum footing pressures at
the toe and heel of the footing respectively. The distribution of
pressure is assumed to be linear as shown. The area of the pressure
diagram should equal the vertical load. The centroid of the area is on
the line of action of the vertical load. The footing is sized to
ensure that e is less than or equal to S/6 which results in the verti
cal force being applied within the middle third of the footing. This
assures a compressive contact pressure throughout the footing.
Stability
At this point in the design the engineer will have established:
the dimensions of the trial section, the geotechnical properties of the
soil and the earth pressures on the bearing surfaces of the retaining
wall. The next step is to eval uate the stabil ity of the design against
18

coiN
[.:9"-;":':':"" .::: :. ,, :
'" . ' .
c: E
tr
~:: . '! . '
... ~I----...l
..... '"
~: ~. " .
'0' •
.' ,- ..... "":": -:;-. ::-:.~ ~ .
• .':
.' " ,',
. 4.:~. ,:" ____ ....l
~ '. i ::
!~.' o· . '.' c , ;.~:
---jr------, .~ . .J ... j.~; ~ .~ ": '4 > ....:. ....:..-.: .... . , .. I::
Q
:;' ': '. q ", , ,
.' . ::. ",I . , ~ II ,
19
.. .'
"
. 0·.r--1---------1 .~ ..
." .'
)(
o E
tr
. o ..... u..

sliding, bearing and settlement failure, and overturning.
Sliding.- The lateral pressures tend to push the retaining wall
away from the higher backfill. A sliding failure can occur along the
contact surface of the bottom of the footing and the foundation soil,
or by shear along a surface through the soil beneath the footing. The
factor of safety against sliding is defined as the ratio of the forces
which resist sliding to driving forces. The contribution of the resul
tant force that would develop from the passive pressure on the front
side of the wall is often omitted, because the backfill may be placed
behind the wall before the fill is placed in front of the wall. Also,
passive pressures may not fully develop, especially if the fill is clay
(18). The resisting force is a function of the shear strength of the
foundation soil. If the resistance to sliding is not sufficient to
offset the driving forces, the footing size may be increased, or a key
is added to the footing. This may increase the length of the shear
surface and passive resistance and therefore, the magnitude of the
resisting force. There are several potential shapes the shear surface
may follow, which are affected by the location and length of the key as
illustrated in Fig. 8 (13). Deep seated failure surfaces may occur if
the footing is founded on a soft soil or a firm soil which overlies a
soft stratum. This problem is best solved using techniques based on
slope stability analysis but is not a part of this study.
Bearing and Settlement.- The footing should be sized to ensure
that the maximum contact pressure does not exceed the bearing capacity
of the soil. The bearing capacity of the foundation soil is determined
using the same criteria as for spread footings. A settlement analysis
20

----slip possible through heel
(a)
slip possible below key
(e)
heel
key
toe-....J---J
~, ~ -----slip possible
through toe
(b)
~ slip possible ~-...::...:...--along inclined plane
{d }
FIG. 8 - Possible Slip Surfaces Beneath Footing
21

is required if the applied pressures exceed the preconsolidation pres
sure of the foundation soil. The analysis is based on the computed
pressure distribution along the bottom of the footing. Also, excessive
differential settlement will contribute to the instability of the wall.
Walls that are founded on soft soils may settle towards the backfill
and significantly increase the earth pressures on the back face of the
wall (23). If these settlement problems cannot be overcome by adjust
ing the size of the footing, pile supports may be necessary.
Overturning.- Computations for the stability against overturning
are usually accomplished by comparing moments of the forces which tend
to overturn the wall and moments of the forces which resist overturning
(1,10,19,26). The factor of safety against overturning is the ratio of
the moments which resist overturning to the moments which cause over
turning. A considerable range in values for the factor of safety will
result, depending on the interpretation of the effect of each moment.
There is no generally accepted procedure for computing the factor of
safety (8). An alternate method of evaluation is to consider that a
wall is safe against overturning if the resultant pressure on the
foundation passes through the middle third of the footing if it is
founded on soil, or the middle fourth of the footing if it is founded
on rock (11,23). The size of the footing may need adjustment to ensure
stability against overturning.
Structural Design
The structural components of the retaining wall are treated as
separate cantilever beams with each component loaded with the appro
priate earth pressures acting on the bearing surfaces. Some adjustment
22
of wall dimensions may be necessary to develop the bending moments and
shear stresses necessary to resist the applied pressures.
Orai nage
It should be emphasized that the Coulomb and Rankine lateral
earth pressure computation procedures described previously are in terms
of effective stress. It is desirable to prevent water retention behind
the retaining wall; otherwise, the retaining wall must be designed to
withstand the porewater pressures developed in addition to earth pres
sures. This is accomplished by providing adequate surface drainage and
by using a free draining backfill material with direct outlets such as
weep holes or a collection system such as pipe drains. Filters may be
necessary to prevent the drainage system from becoming clogged with
fine soil particles.
Construction
Upon revising the initial wall proportions to meet the conditions
described above, the retaining wall should perform satisfactorily if
the field conditions do in fact match those assumed in the design pro
cedure. Special consideration should be given to verifying these
assumptions during the construction of the wall. The design engineer
should be apprised of any field changes that occur. Additional con
servatism in design is warranted if close field monitoring is not
expected. Most design procedures are based on cohesionless backfills,
as the classical theories apply directly to this type of backfill.
Also, cohesionless soils provide the high permeability required for
drainage to prevent porewater pressures from acting on the walls. Much
less is known or understood about the performance of retaining walls
23
L-_________________________ ~ __

which support cohesive soils.
24

REVIEW OF PREVIOUS RESEARCH
Large Scale Retaining Wall Tests
Laboratory Conditions.- Terzaghi made significant contributions
to the understanding of earth pressures in 1920 (20), 1934 (21), and
1936 (22). This study of the classical earth pressure theories was
initiated because many engineers and contractors claimed that the earth
pressures determined theoretically had no resemblance to observed earth
pressures during subway construction.
Terzaghi concludes that the use of Rankine's theory should be
discontinued because the assumptions are not compatible with the
stress-strain relationships observed in soils (22). Based on tests,
Terzaghi concludes that Coulomb's earth pressure theory is valid if
sufficient wall movement occurs. It is observed from tests that the
magnitude of lateral earth pressure proposed by Coulomb is developed,
and that a hydrostatic pressure distribution does occur. However, the
hydrostatic pressure distribution requires about ten times more
movement than that required to develop the active lateral force (22).
Tests were performed by backfilling large scale test walls and
then moving the walls away from the backfill. In one test, the wall
was rotated about its base, while in another test, the wall was moved
laterally away from the backfill. When the backfill was a dense sand,
the active force was developed when the wall movement was 0.0005H at
the midpoint of the wall and an approximate hydrostatic pressure dis
tribution developed when the top of the wall had moved 0.005H, at which
25
time lIa visible and audible slipll occurred. For loose sands, the active
earth force required much more average movement than O.005H and the
pressure distribution became hydrostatic with essentially no movement.
In summary, Terzaghi's conclusions are:
1. Rankine's earth pressure theory is not valid.
2. Coulomb's theory for the magnitude of lateral force is gener
ally correct because movements to develop the active state can
occur for most types of retaining structures.
3. Coulomb's assumption of a hydrostatic pressure distribution is
valid when every point on the wall moves O.005H. This is
generally true for retaining walls but is seldom true for
braced or rigid structures. Also, the pressure distribution
is approximately trapezoidal for wall movements less than
O.005H due to arching.
Most design standards and texts in use today include one or both
of the classical theories for earth pressure computations, and specify
a minimum movement requirement for the active state of stress to
develop. The movement specification in most published tables lies
between the values Terzaghi reported necessary to develop the active
state of stress and those necessary to produce the hydrostatic pressure
distribution.
Effect of Compaction.- Constructing the backfill in lifts with
relatively heavy compactive effort is a recent innovation with respect
to the development of the classical earth pressure theories used in
retaining wall design. The development of lateral stresses due to
26
compaction has been researched and reported by Sowers et al. in 1957
(17), Broms in 1971 (2), Carder et al in 1977 (3), and Ingold in 1979
(9). Results show earth pressures against the stem of retaining walls
to be different in magnitude and distribution than those predicted using
the classical earth pressure theories. In Ingold's test, compaction
caused the stem to crack. Broms and Ingold proposed new earth pressure
theories which predict the magnitude of the lateral pressures on the
stem as a function of compaction and soil properties. An approximately
uniform pressure distribution due to compaction was theorized based on
the analysis of these studies.
Field Performance Studies.- The West Riding County Council in
Yorkshire, England is responsible for the maintenance of 1600 bridges
that were built before the 1930 ' s. Some of the retaining structures for
these bridges have recently failed and many others show excessive
bulging and cracking in the middle of the walls. Simple deterioration
and classical lateral earth pressure theories do not explain the
distress and failures observed (16).
These failures led to the instrumentation, by Sims and others
(15,16), of a large retaining wall constructed between 1966 and 1968 on
the M1 Motorway in Rotterdam, England. This wall was designed using
Cou1omb ' s lateral earth pressure theory. Vibrating wire pressure cells
were installed in the backfill to measure horizontal and vertical earth
pressures. Strain gauges were installed in the front face and back face
of the reinforced concrete stem of the retaining wall. No pressure
readings were made until the backfilling had been completed to the top
27

of the wall.
The first pressure readings were significantly different from
those computed by the Coulomb theory. The earth pressures increased
with time, particularly after the motorway was opened to traffic.
Pressures increased more at the midheight of the wall for about
the first five years after the completion of construction. In all
cases, the lateral pressures were greater than predicted by the Coulomb
theory.
The significant differences between the theoretical earth pres
sures and pressure distribution and measured earth pressure and pressure
distributions require explanation. This is provided by the researchers
as follows:
1. Present construction methods are different from those used
when the theory was developed.
2. The overdesign of the stem due to excessive factors of safety
for stability contribute to the differences between measured
and predicted pressures and pressure distribution.
3. Traffic loads appear to have a significant effect on the earth
pressures acting on the wall.
Terzaghi evaluated the Coulomb theory using procedures inherent
with Coulomb's assumptions and basically practiced in construction
before the 1930's. At that time, walls were propped or braced during
backfilling. Compaction was minimal, essentially accomplished by the
construction equipment used to dump the backfill in place. Upon com
pletion, the props were removed, thereby allowing the necessary movement
28
to develop the Coulomb active earth pressure and hydrostatic pressure
distribution. The walls were relatively flexible gravity walls com
posed of rock stacked vertically with smaller rocks on the back face
and larger rocks on the front face.
Propping retaining walls during backfilling is no longer prac
ticed. Backfill is now placed in lifts and each lift is compacted.
Reinforced concrete walls built today generally are more rigid than
typical walls built in the past. The high safety factors against
sliding, the large footings and the rigidity of reinforced concrete
used in present designs are significantly different than walls and
conditions which Coulomb considered in the development of his theory.
These factors tend to keep the wall movements below those required to
develop the Coulomb active state of stress during the construction
process, although there is a possibility for sufficient movement to
occur after construction. Even so, design procedures should be based
on the maximum earth pressures the retaining structures must support.
Evidence indicates that earth pressures developed during construction
are greater than earth pressures obtained from Coulomb's theory.
Wright et ale (25), in 1975, reported on field performance
measurements of earth pressures and wall movements on the stem of a
precast panel retaining wall (12), and a cantilever retaining wall (5)
which was supported on H piling. It was concluded that the classical
earth pressure predictions were satisfactory for the upper portion of
the stem, but at rest lateral pressures are more appropriate for the
lower portion of the stem.
29
In 1978, a bridge abutment near Toronto, Canada was instrumented
to measure earth pressure and movements. It was observed that the
lateral earth pressures were approximately parabolic on the lower
three-fourths of the wall and decreased linearly on the upper one
fourth. A linear pressure distribution was recommended for design,
using the at rest triangular distribution, even though the movements
were sufficient for active pressures to develop according to published
criteria. Footing contact pressures were also measured. Nonsymmetri
cal contact pressures were observed which could not be explained by
theory, including finite element analysis.
The results of these research efforts clearly point to the need
for additional field performance tests on retaining walls to determine
earth pressures on retaining walls, the pressure distributions, and
associated wall movements. These parameters are common to design
procedures that have been in use for decades and are the logical
starting points for design modification recommendations.
Unstudied Design Aspects of Cantilever Retaining Walls
The small amount of published literature on cantilever retaining
wall performance tests reveals that several aspects have not been
satisfactorily studied. The bearing pressures on spread footings of
these retaining walls have not been measured. Most typical designs
include keys, but no field measurements have been made to evaluate
their effectiveness. In fact, so little is known about the contribu
tion of keys that many designers conservatively neglect certain con
tributions of keys in design. Some of the uncertainties in evaluating
30
pressures on the front of a cantilever wall can be clarified with field
measurements. No published literature can be found on field
measurements of lateral pressures produced by cohesive backfills.
Backfilling with clay is undesirable, but is often an alternative a
designer must consider because the use of a cohesionless backfill may
be economically prohibitive if this material is unavailable locally.
An empirical design procedure based on field performance studies of
retaining walls backfilled with cohesive soils would help fill a
significant void in the state of the art of retaining wall design.
Background on Present Research Program
Planning and Preparation.- A five-year research study was begun
in 1977 at Texas A&M University to measure earth pressures acting on
the bearing surfaces of cantilever retaining walls founded on spread
footings and to measure the-movement of the walls due to the applied
earth pressures. Initially the study was devoted to a literature
survey, preparations for field tests and site selections (13).
The literature survey established the state of the art for canti
lever retaining wall design and field performance studies. This
information influenced the procedures and instrumentation used to
achieve the objective of this study.
Earth pressure cells were selected based on reliability, simplic
ity, accuracy and satisfactory performance in other studies (5,6,12).
A method for installing the earth pressure cells was developed (13) and
a plan for locating the earth pressure cells was established. A wall
movement measurement system was developed based on procedures found to
be effective on similar studies (6,12). A soils investigation program
31
was established and data collection procedures were finalized.
Potential sites were reviewed and the criteria for test wall
selection were as follows:
1. The cantilever retaining walls were to have a conventional
cross section and be constructed of reinforced concrete.
2. The walls were to be supported on a spread footing with a
protruding key.
3. The cantilever walls were to be constructed on TSDHPT pro
jects.
4. The walls were to be located as near Texas A&M University as
possible to ensure adequate monitoring.
Although these selection criteria had the practical advantages of
minimizing the cost of the study and obtaining measurements from actual
field conditions, the major disadvantage was that construction progress
was entirely controlled by the contractor. Therefore, the progress of
the study was totally dependent upon the progress made by the con
tractor.
First Test Wall.- The first wall selected for instrumentation was
at the intersection of Interstate Highway 10 and Federal Road in
Houston, Texas. Instrumentation of the wall was accomplished, to pro
vide for measurements of:
1. Earth pressures on the footing, key and stem,
2. Tilt of the stem, and
3. Horizontal displacement of the stem.
Geotechnical properties of the in place soils were obtained from
the TSDHPT. An a-dditional test boring was made to provide soil samples
32
for testing at the Texas A&M Geotechnical Laboratory. These test
results were supplemented by field tests performed by project inspec
tors.
Measurements of earth pressures, wall tilt and horizontal dis
placement were made as the construction procedures allowed and the
backfilling operations progressed. The backfilling operations were
essentially completed during the summer of 1980 and the analysis of
these measurements were reported by Schulze (14). Shortly after this
report was completed, the instrumentation at this site was destroyed by
construction equipment working adjacent to the test wall. No addition
al useful information was obtained since TTl Report 236-1 was pub
lished; therefore, the field performance study of this wall is not
included herein.
33

TEST WALL
Test Site
The test site selected for this phase of the study is located at
the southwest intersection of State Highway 288 and South MacGregor
Avenue in the south central area of Houston, Texas.
crosses over State Highway 288 at this intersection.
MacGregor Avenue
Each is a multi-
lane roadway. MacGregor Avenue is open to traffic, and Brays Bayou
runs through the large median area which separates westbound North
MacGregor Avenue and the eastbound South MacGregor Avenue. State
Highway 288 is still under construction at this time (1983).
Test Wall Description
Panel 5 of wall LB was instrumented for this study. Panel 5 is
an interior panel which was selected to negate end effects. Wall LB is
a continuation of the retaining wall which supports the embankment of
South MacGregor Aveune. A portion of the plan and elevation views are
shown in Fig. 9. The entire length of the wall is 382.5 ft (116.6 m)
consisting of twelve 30 ft (9.14 m) panels and one 22.5 ft (6.86 m)
panel. Wall LB supports the Left Frontage Street Ramp which provides
access to the southbound lanes of State Highway 288 from South
MacGregor Avenue and the frontage road. The retaining wall is also
used to provide space within the right of way for the Left Access
Street as shown in Fig. 10.
Wall LB is a cantilever retaining wall which is supported by a
spread footing with a key protruding from the base of the footing. The
key is located directly below the stem. The stem is 14 ft (4.27 m)
34
W Ul
~-------______ r~~' ___ -~-------------,.-----[-~I---- __ L [7' t I I - ----I 1 I I I I I : ~----- - L ----1----__ J--------------..J---- -r--------J--1-----I. 30' Typ. .1
Rail Typ .
JI
II II
\ LB-3
• I
If :'I
II II . Ir , '64.3
'-'63.22 '6204 Test Panel
LB-4 LB-5 LB-6
·0 0 0 Finished Grade"",
____ J.J!V~ ___ _.l~()t.£OO!ID_«_....__ __ 48.50
FIG. 9 - Test Wall Plan-Profile (1 ft = 0.305 m)
L, J.,
! II T ...... -'60.61
LB-7
51.44

W 0"
~I q 0;:
Varies Varies
10' Usual 20.12 Usual
2.01 Min. 16.00
1
IIf·oqll Wlk.
3.881
2 Lanes (ci) 12.00=24.001
.4.00'
4.12 Usual
LEFT ACCESS STREET LEFT FRONTAGE STREET RAMP
GIG. 10 - Typical Section at Test Panel (1 ft = 0.305 m)
high at the center of panel 5. The footing is 9 ft (2.74 m) wide and
1.25 ft (0.38 m) thick, poured on a cement stabilized sand 8 in. (20
cm) deep. Drainage is provided by weep holes every 10 ft (3.05 m) with
fiber and wire mesh filters inset into the back face of the stem. The
dimensions at the center of panel 5 are given in Fig. 11. There are
construction joints between the footing and the stem, and between the
stem and the cap.
Instrumentation
The objective of the instrumentation was to measure the magnitude
and distribution of the earth pressure, and the magnitude and direction
of wall movement. These measurements were considered essential in
order to evaluate current design procedures. Earth pressure cells were
installed in the back face of the stem and in the footing. Measurement
points were attached to the front face of the stem and reference points
were set in the ground near the right of way line in order to measure
wall movement. Installation of instrumentation was controlled by
construction progress and procedures.
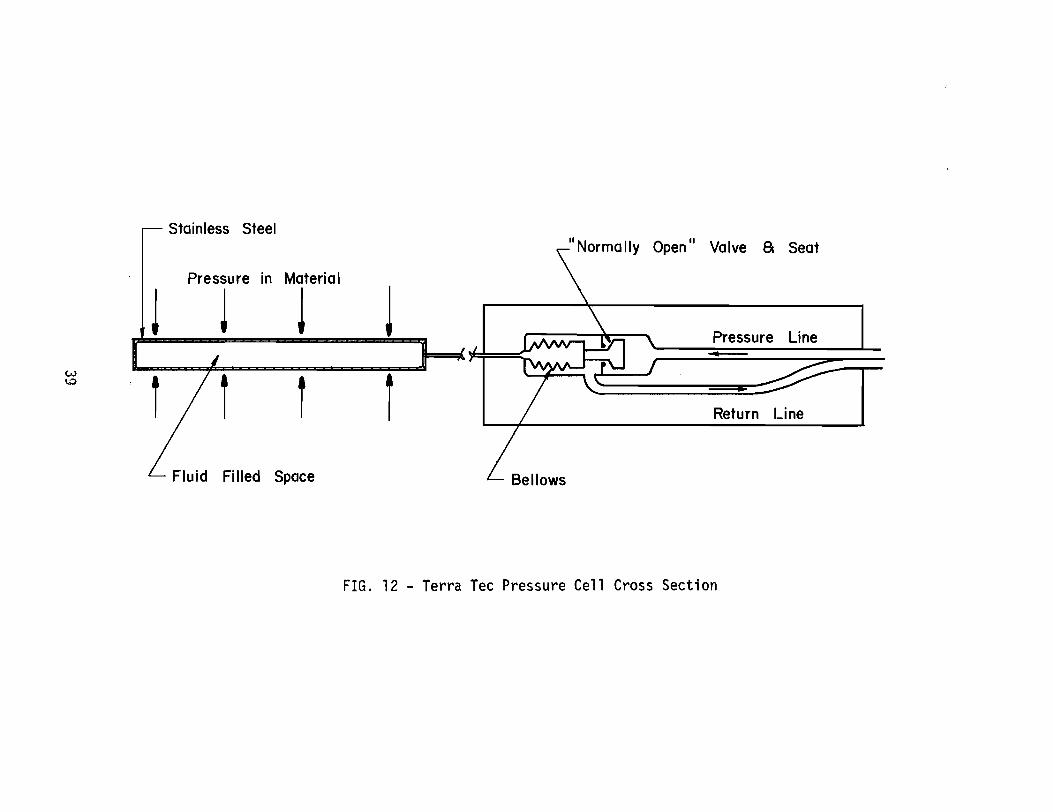
Earth Pressure.- Terra Tec pneumatic total pressure cells were
selected to instrument the test wall. These are composed of a fluid
filled loading plate, a bellows and valve mechanism, and a lead con
taining a pressure line and return line. A cross section of a Terra
Tec pressure cell is shown in Fig. 12. The loading plate has two
active faces which are 6 in. by 6 in. (152 mm by 152 mm) thin stainless
steel sheets welded together along the stiff rim.
Loading the active faces causes the fluid pressure within the
loading plate and the bellows mechanism to increase. The pressure on
37

Weep Hole with Blockout for Filter
Cement Stabilized Sand
II -C 1.00' ~-----------
112
12
, -- &
3.00' 4.33'
r-------~~~----------~------~-
9.00'
FIG. 11 - Test Wall Cross Section (1 ft = 0.305 m)
38
Stainless Steel II Norma Ily Open II Valve a Seat
\
l presrre in lteriOI
J ~ \
Pressure Line ,()' I I ---I I --/f w I
i i \.0
Return Line /
Fluid Filled Space
FIG. 12 - Terra Tee Pressure Cell Cross Section

the active faces of the cell is measured by a readout unit which
supplies nitrogen gas through the pressure line in the lead. When the
supply pressure matches the fluid pressure, the bellows contracts and
closes the piston valve. The readout unit monitors the return line
pressure which remains constant when the valve closes. Each cell has a
unique factory preload pressure, i.e., the cell reading is not zero
when no load is applied.
The manufacturer's specifications rate the cells at 250 psi (1720
kPa) capacity with an accuracy of 0.1%. Each cell was tested by the
manufacturer for proper function and a built-in preload pressure was
established. The results of these tests were supplied by the manufac
turer. Most of the cells were also tested at the Texas Transportation
Institute (TTl) calibration laboratory to verify linearity and repeata
bility prior to installation at the site. Cells which failed these
tests were returned to the manufacturer for repair and/or adjustment.
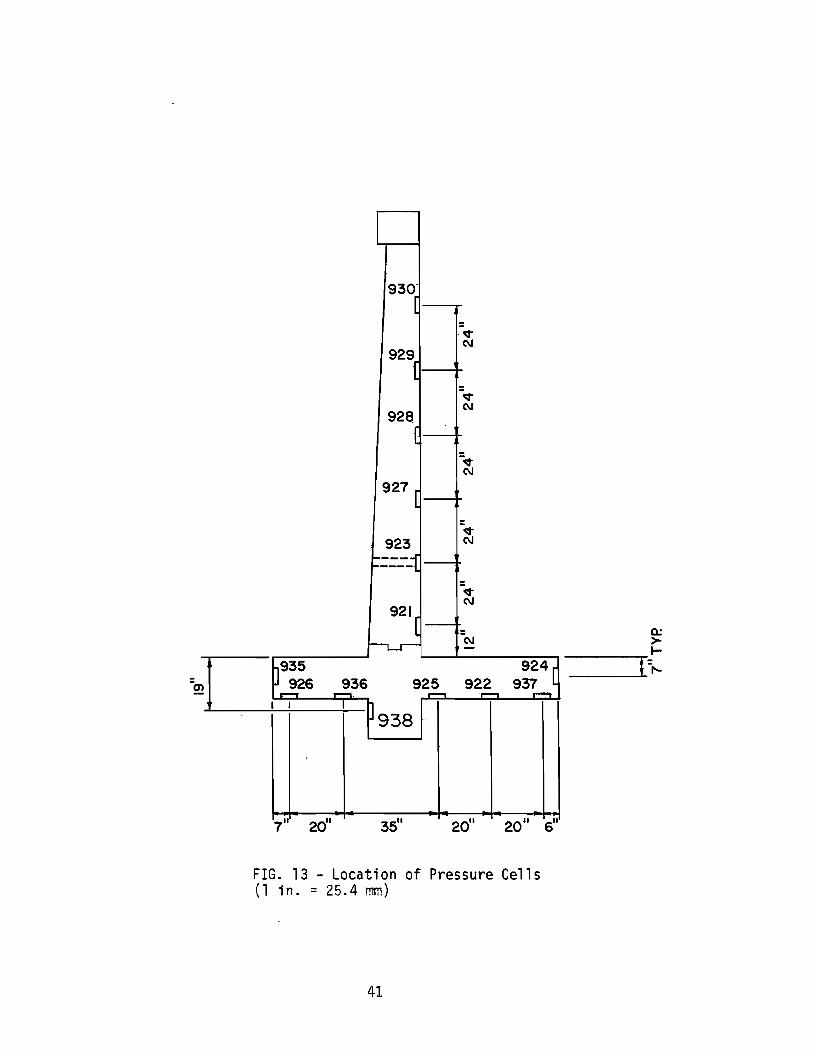
The cantilever retaining wall was instrumented with 14 pressure
cells, six in the back face of the stem and eight in the footing, at
the locations shown in Fig. 13. The cells were identified by the
manufacturer's serial numbers. The pressure cells were cast in place
since this is considered the best method of installation to prevent
damage to the cells during construction (13).
The pressure cells in the footing were placed in the middle of
the footing on a line perpendicular to the longitudinal axis, after the
reinforcing steel was in place. The five cells along the base of the
footing were pinned directly against the cement stabilized sand. The
cell installed in ·the key was pinned against the cement stabilized sand
40
I
930' -[
.q-C\J
929{
-~ (\I
92S (
=q-C\J
927 [ --q-
923 (\I
r---_i '----- I-I-
q-C\J
921[ 1-
r-----t-r--(\I
r935 924 [
936 925 922 937 926 E:::J 1"'""""1. 1"'""""1 '1"'""""1 1"'""""1
I I I ]938
2011
20" 611
FIG. 13 - Location of Pressure Cells (1 in. = 25.4 mm)
41
a.: >I------.-1·= .....
on the front side. Cells 924 and 935 were wired to the forms of the
heel and toe respectively. For protection, the pressure cell leads were
routed through a PVC pipe conduit as shown in Fig. 14. The PVC conduit
was located several feet from the axis of instrumentation. The footing
was instrumented and the concrete was placed in November of 1979.
Pressure cells were wired to the back face stem form on a vertical
line 1 ft (0.305 m) off of the center of the panel to avoid a form
splice. This installation was done in January of 1980. The leads were
wired to tensile reinforcing steel for protection and routed through the
PVC pipe conduit. The remaining reinforcing steel and front face form
was put in place and the stem concrete was poured in June of 1980. A
metal box was attached to the front face of the stem to house the
pressure cell lead terminals. The PVC conduit was extended from the top
of the footing into the metal box. Thermocouples, for temperature
measurements, were not installed during the construction of the retain
ing wall because prior research experience indicated that temperature
induced pressure variance would be negligible (5,6,12).
Several sets of pressure readings were made between November, 1979
and July, 1980. A significant change in pressure reading was observed
for each cell although it was expected that each cell would have a
constant reading approximately equal to its factory preload value,
especially those cells exposed to the atmosphere. The variation in
reading was systematic since each cell reading changed in approximately
equal increments when different sets of readings were compared. The
magnitude of the readings increased from the winter through summer
months. The variation in pressure readings on the stem and footing
42

Exit Point For All Leads '\
t
112
12
Stem
r+~ , 1
1--__ ---11 I 1 : I :
Backfill
Pressure Cell Leads From Stem
, ' I I , I I I '------------~ '-__________ _ _ ___ ..... , I ~ __ \
l ,~--------------------------, \ 1 '_'_: I I 1 ;.. '-+_.
I ~ ~ '-
PVC Pipe
Pressure Cell Leads From Key and Toe Area
Pressure Cell Leads From Heel Area
FIG. 14 - Pressure Cell Lead Conduit
43
faces could not be attributed to seasonal earth pressure changes because
no backfill had been placed against them.
Thermocouples were installed in August of 1980 to evaluate the
effect of temperature on the pressure readings. No backfill had been
placed behind the wall at this time, so thermocouples T, M, B, BF and FW
as shown in Fig. 15 , were installed. The toe of the footing was
covered with soil and thermocouple FF was installed in June of 1981 by
digging down to the toe of the footing, setting the thermocouple, and
replacing the soil. The thermocouple wires were routed through a PVC
conduit which ran through a weep hole and the conduit was attached to
the PVC riser from the top of the footing to the metal box.
Wall Movement.- Provision was made to measure horizontal and
vertical displacement, and wall tilt. The wall movement measurement
systems are shown in Fig. 16. The horizontal displacement was measured
directly with a steel tape. A rigid hook was securely embedded in the
front face of the stem. A reinforced concrete pier, to serve as a
reference point, was set near the right of way line with the top approx
imately flush with the ground surface to minimize disturbance by con
struction operations. The concrete pier was set in November of 1980
after the right of way line was cleared of excavation spoil. A 12 in.
(305 mm) bolt was cast in the top of the concrete pier. The top of the
bolt and the hook shaft were set at the same elevation in order to
obtain horizontal distances directly. A cross was cut in the bolt head
to obtain a specific measurement point. A steel tape was stretched
between the hook and the cross in the bolt head using a measured tension
of 10 pounds (44.5 N) for all observations and a tape thermometer was
44
FF 935
926
FW
936
930
938
M
B
924 925 922 937
FIG. 15 - location of Thermocouples
45
BF
;.I::>. 0"1
al
#7 Rebar .. Encased in 3 9J Pipe Filled with sand
.;i. , ~ .. ~', , .:;" ... "., .' ". "
.'.:
.. ". t.:
af
Stainless~ Steel Pads ~
2al
---
251
Plumb bob in heavy oil
#$~~~
A
B,
c
o
FIG. 16 - vIall r10vement Measurement Systems (1 in. = 25.4-mm, 1 ft = 0.305 ft)

used to establish the tape temperature for all observations. The
measured distances were adjusted for thermal-induced changes in the
tape length. An additional reference point was set in June of 1981 to
serve as a back-up for the concrete pier, and to serve as a means to
verify displacement measurements. The back-up reference point was a
groove cut in the top of a steel reinforcing rod. The installation
method is illustrated in Fig. 16.
The vertical displacement of the wall was obtained by differen
tial leveling using an automatic level and Philadelphia rod. Rod read
ings were taken on the hook shaft, bolt head, and later on the top of
the reinforcing rod. The bottom of the concrete pier was set at the
same elevation as the base of the retaining wall footing to help cancel
the effects of local heave or subsidence.
Wall tilt was measured using two independent methods. Both
methods utilized five stainless steel pads, A through E, which are
shown in Fig. 16. The pad faces were machined smooth after a point
marking their centers was established. Pads A through D were attached
on 2 ft (0.610 m) centers, opposite the stem pressure cells on the back
face. Pad E was set 1.427 ft (0.435 m) below Pad D to avoid covering
the weep hole. Pad E was set adjacent to the hook used for horizontal
and vertical movement measurements. Stainless steel pads were used
because they are noncorrosive and the coefficient of thermal expansion
for steel and concrete are almost identical.
One method of measuring tilt was to place an inclinometer on each
pad and read the observed angles. The magnitude and direction of the
tilt was obtained" by comparing subsequent readings with those initially
47
taken.
A second method for measuring tilt involved measuring the horizon
tal distance from a vertical line to the punch mark on each stainless
steel pad. A rigid bracket was attached to the front face of the stem
near the top of the wall. From the bracket a 12 pound (54 N) plumb bob
was suspended by a piano wire into a bucket of oil. The horizontal
distance between the piano wire and punch mark on each pad was measured
with a steel scale with a level vial attached. Wall tilt was computed
using the observed change in horizontal distance at each pad and the
vertical distance from the bracket to each pad. The horizontal move
ment at each pad was computed from the plumb line readings.
Soil Conditions
Profile.- The instrumented retaining wall was founded on a stiff,
fissured and extremely heterogeneous preconsolidated clay. Pockets and
lenses of fine sand and silt were randomly dispersed throughout the
clay. Fine sand and silt were often found in the fissure cracks.
The retaining wall was backfilled intermittently over a 15 month
period. The clay excavation spoil was dozed onto the footing on the
front side of the wall. Select backfill, a bank run sand, was used to
fill the excavation to natural grade on the back side of the wall. The
native clay was used as backfill for the remaining 9 ft (2.74 m). A
vertical sand blanket, about 2.5 ft (0.75 m) wide, was placed against
the back of the stem, separating the wall and the clay. A representa
tive profile of the backfill in July, 1982 is shown in Fig. 17. The
profile shown represents a field change agreed upon between the TSDHPT
field representative and the contractor. Originally, select backfill
48
~ ~
Concrete Pavement
Clay Backfill
/Foundation Soi I
Cement Stabilized Sand FIG. 17 - As-Built Profile
was to have extended to the dashed line shown in Fig. 17.
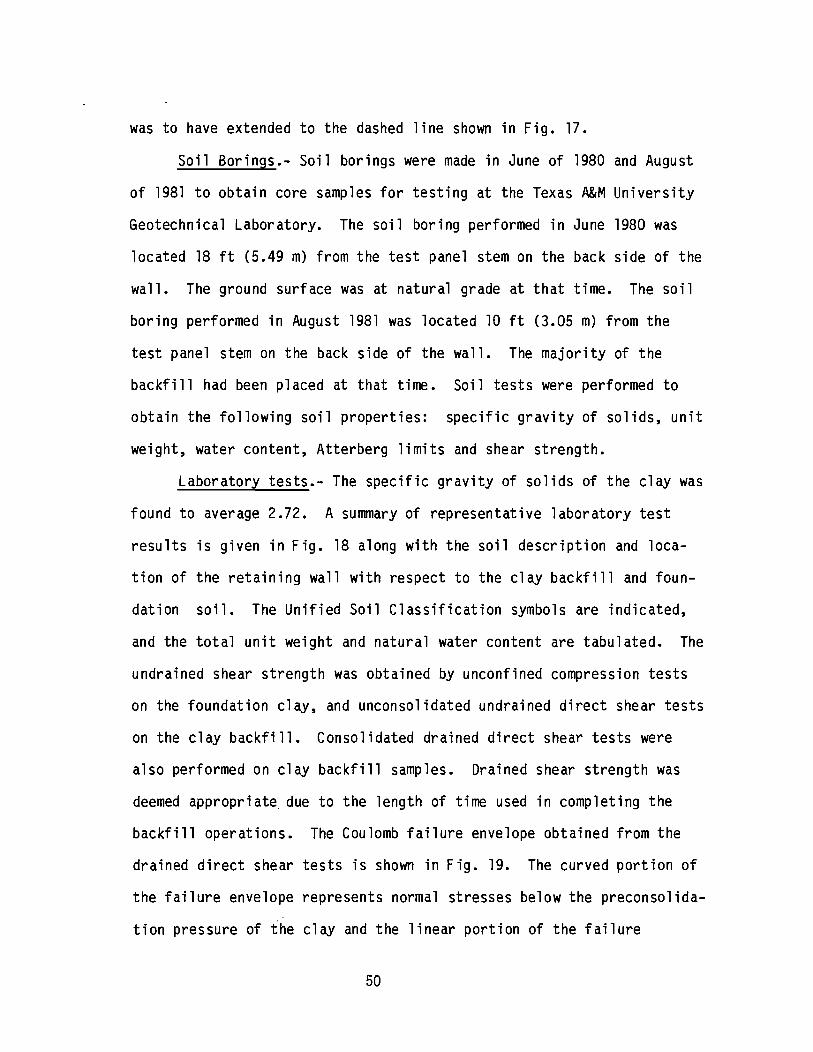
Soil Borings.- Soil borings were made in June of 1980 and August
of 1981 to obtain core samples for testing at the Texas A&M University
Geotechnical Laboratory. The soil boring performed in June 1980 was
located 18 ft (5.49 m) from the test panel stem on the back side of the
wall. The ground surface was at natural grade at that time. The soil
boring performed in August 1981 was located 10 ft (3.05 m) from the
test panel stem on the back side of the wall. The majority of the
backfill had been placed at that time. Soil tests were performed to
obtain the following soil properties: specific gravity of solids, unit
weight, water content, Atterberg limits and shear strength.
Laboratory tests.- The specific gravity of solids of the clay was
found to average 2.72. A summary of representative laboratory test
results is given in Fig. 18 along with the soil description and loca
tion of the retaining wall with respect to the clay backfill and foun
dation soil. The Unified Soil Classification symbols are indicated,
and the total unit weight and natural water content are tabulated. The
undrained shear strength was obtained by unconfined compression tests
on the foundation clay, and unconsolidated undrained direct shear tests
on the clay backfill. Consolidated drained direct shear tests were
also performed on clay backfill samples. Drained shear strength was
deemed appropriate due to the length of time used in completing the
backfill operations. The Coulomb failure envelope obtained from the
drained direct shear tests is shown in Fig. 19. The curved portion of
the failure envelope represents normal stresses below the preconsolida
tion pressure of the clay and the linear portion of the failure
50
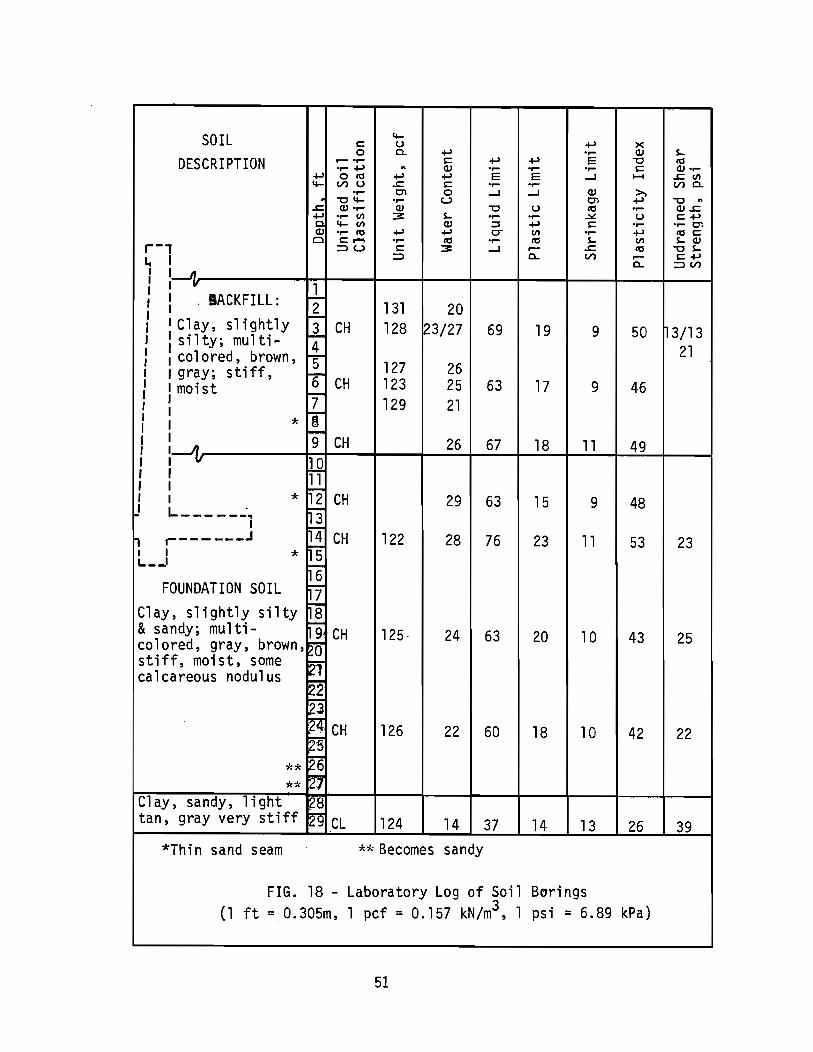
SOIL l+-s:: U +oJ X 0 0- +oJ ..... Q) ~
DESCRIPTION .......... s:: +oJ +oJ E "0 ~ ..... +oJ '" Q) ..... ..... ..... s:: Q) .....
+oJ O~ +oJ +oJ E E ..J >-4 oJ:: Vl I+- VlU oJ:: s:: ..... ..... Vl 0-..... 01 0 ..J ..J Q) >, . "0 l+- ..... U 01 +oJ "0 '" oJ:: Q) ..... Q) "0 U ~ ..... Q)oJ::
~ ..... Vl 3: ~ ..... ..... ~ U S::+oJ I+-Vl Q) ::::I +oJ s:: ..... • .... 01
Q) ..... ~ +oJ +oJ CT Vl ..... +oJ ~s:: Cl s:: 1"""1 ..... ~ ..... ~ ~ Vl ~Q) r-, :::> u s:: 3: ..J ..... oJ:: ~ "O~
:::> a.. Vl ..... S::+J ~ a.. :::> Vl I I
~ I : BACKFILL: I L 131 20 I Clay, slightly ~3/27 , J. CH 128 69 19 9 50 h 3/13 I silty; mu1ti-
~ 21 I colored, brown, I 5 127 26 I gray; stiff, ~ I moist CH 123 25 63 17 9 46 I ~ , 129 21 , * ~ I l-
I 9 CH 26 67 18 11 49 , I W ,
11 I r-, * ~ CH 29 63 15 9 48 ~
L ______ o ..
~ I
~ .-______ J 14 CH 122 28 76 23 11 53 23 I * ~ L_-' I-
FOUNDATION SOIL ~ J..
Clay, slightly silty 8 & sandy; multi- I-
~ CH 125· 24 63 20 10 43 25 colored, gray, brown, stiff, moist, some
~ calcareous nodulus 22 ~
~ CH 126 22 60 18 10 42 22 5
** t26 ** ~ C1 ay, sandy, 1 i ght [28
tan, gray very stiff ~ CL 124 14 37 14 13 26 39 *Thin sand seam ** Becomes sandy
FIG. 18 - Laboratory Log of Soil Borings (1 3 psi = 6.89 kPa) ft =.0.305m, 1 pcf = 0.157 kN/m , 1
51
~--------------------

20.0
15.0
·en a. ..
II) II)
(J1 CI)
10.0 N .... -(J)
.... 0 CI)
.s::. (J)
5.0
C'
0 0 5.0
// /
10.0 15.0
//
20.0
Normal Stress, psi
25.0
FIG. 19 ~ Failure Envelope for Drained Shear - aackfi11 (1 psi = 6.89 kPa)
30.0

envelope represents normal stresses above the preconso1idation pres
sure. The effective angle of shearing resistance is 250 for normal
stresses greater than the preconso1idation pressure. The stress-strain
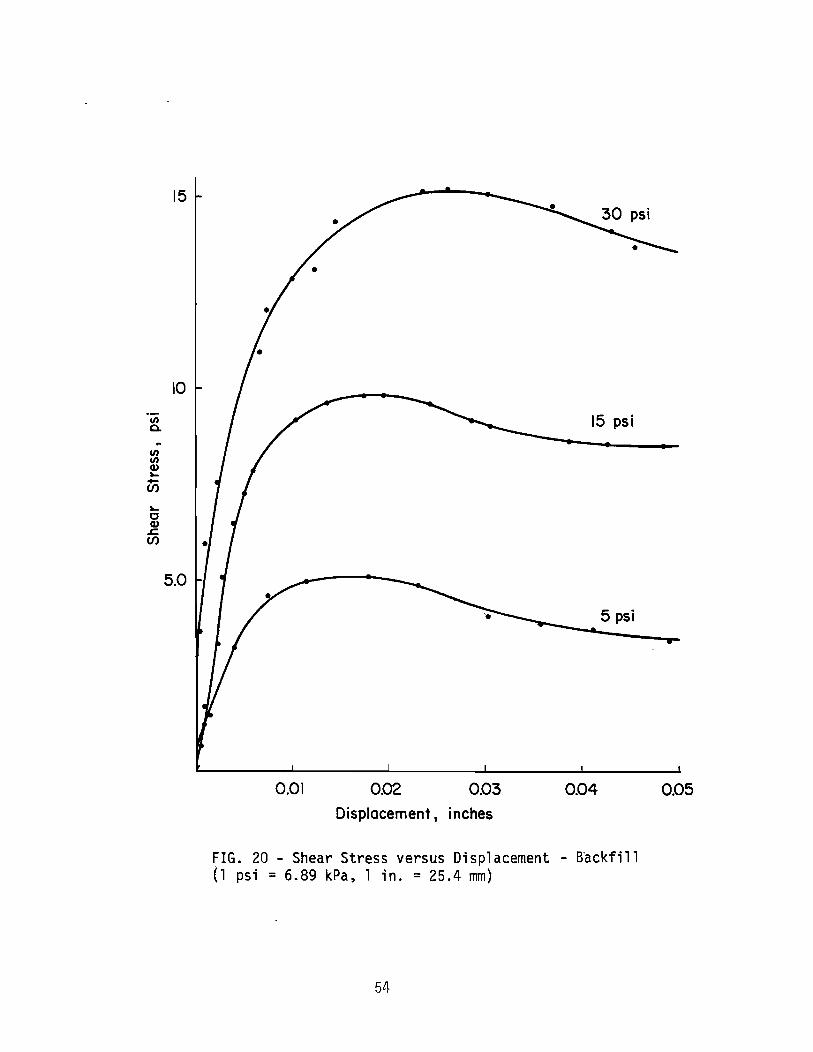
characteristics of the clay backfill are presented in Fig. 20, which
shows shear stress versus displacement from direct shear tests for
normal stresses of 5, 15 and 30 psi (34, 103 and 207 kPa). Displace
ment is used on the abscissa of the graph because the samples were
sheared on a circular cross section with a 2.50 in. (6.35 cm) diameter.
The clay is relatively brittle and small displacements caused failure.
Note that the peak shearing stresses occur at strains on the order of
one percent if the diameter is taken as the original length in the
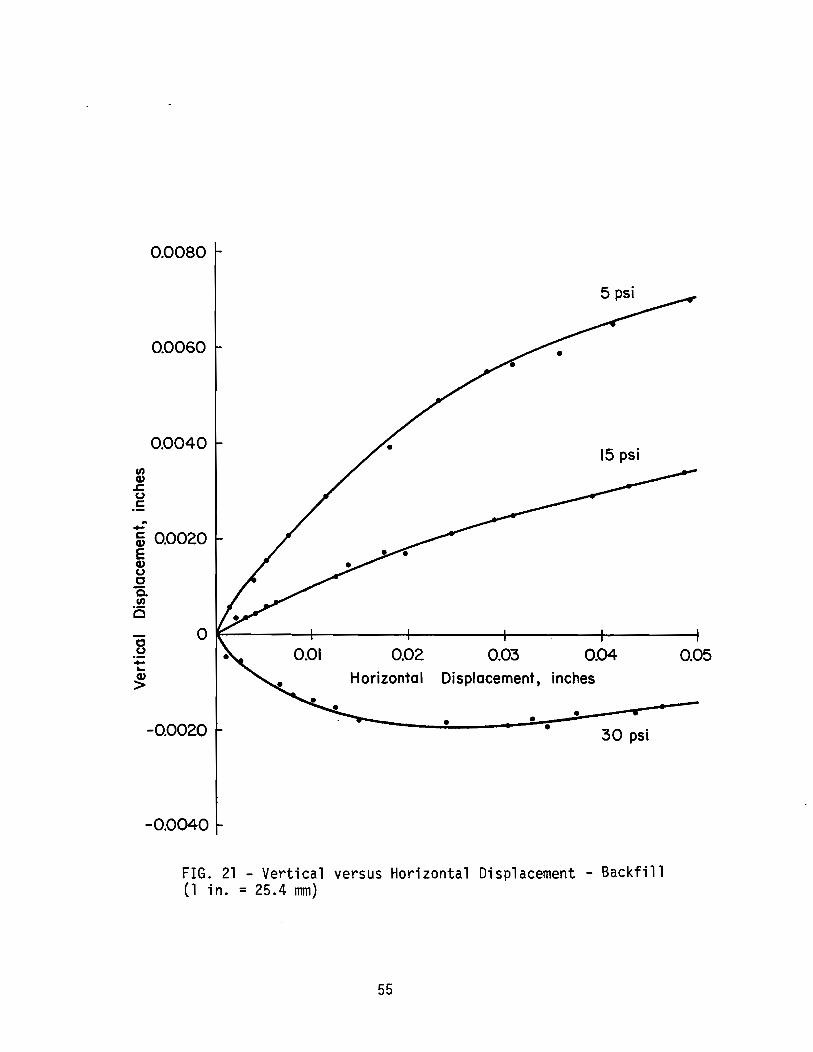
standard definition of strain. Fig. 21 illustrates the vertical
displacement the test samples underwent during slow shear for the same
tests given in Fig. 20. Note that the tests with normal stresses below
the 20 psi (138 kPa) dilated during shear and the test with the normal
stress above 20 psi (138 kPa) consolidated during shear.
Soil exploration reports were obtained from the TSDHPT to supple
ment the information gained from the soil borings and laboratory tests.
These reports show that the very stiff sandy clay stratum, (see Fig.
18), is 15 ft (4.57 m) thick and overlies a 44 ft (13.4 m) stratum of
dense to very dense silty sand. The ground water table is at least 12
ft (3.7 m) below the base of the retaining wall footing.
The sand blanket (see Fig. 17), serves primarily as a drain to
prevent porewater pressures from acting on the wall. The sand was
classified as uniform, fine, silty sand, SP-SM. Field density tests
performed by the TSDHPT inspector indicated that the sand blanket was
53
15
10
en 0-.. en en Q) ~ -(f) ~
c Q)
.s::. (f)
5.0
15 psi
5 psi
0.01 0.02 0.03 0.04
Displacement, inches
FIG. 20 - Shear Stress versus Oi sp1 acement - B'ackfi 11 (1 psi = 6.89 kPa, 1 in. = 25.4 mm)
54
0.05
en Q.) ~ u c .. -.
0.0080
0.0060
0.0040
~ 0.0020 E Q.) u c Q. en o
5 psi
15 psi
c .2
o ~----------r------------+--------+--______ --~------___ ~
-... ~
-0.0020
0.01 0.02 Horizontal
0.03 0.04 Displacement, inches
• • • • 30 psi
-0.0040
FIG. 21 - Vertical versus Horizontal Displacement - Backfill (1 in. = 25.4 mm)
55
0.05
compacted to a dry unit weight of 113 pcf (17.7 kN/m3) at a water
content of 12.3%. These values match compaction specifications
established by TSDHPT laboratory tests.
The compaction specifications for the clay backfill required
field dry densities to be much lower than the maximum dry density
obtained from the TSDHPT compaction test, and the specified water
content was greater than the optimum water content obtained from the
compaction test. These requirements were an effort to reduce the
expansive activity of the clay.
56

DATA COLLECTION, INTERPRETATION AND RESULTS
Data Collection
Schedule.- It was anticipated that the retaining wall would be
constructed and backfilled in early 1980. Soon thereafter, the paving
would be completed and the project opened to traffic. With this
sequence of events, the plan was to be at the site and closely monitor
the effects of compaction and backfill heights on earth pressure and
wall movement on a lift by lift basis. Measurements were to be made on
a biweekly basis after backfilling was completed until the system
stabilized. Then measurements would be made at intervals sufficient to
determine seasonal effects. The effect of traffic loading was also to
be monitored. With this systematic approach of obtaining measurements,
the critical or maximum loading condition could be identified and be
used for design modifications if necessary. The actual construction ..
progress prevented this approach to data' collection. The data collec-
tion schedule was modified so that inspection visits were made more or
less on a monthly basis. The TSDHPT project inspector and the con-
tractor's foreman were to notify the researchers of any construction
operations to be performed concerning the instrumented wall.
Pressure Cell Readings.- Data collection began with pressure cell
readings when the retaining wall footing was instrumented in November
1979. Typically, each cell was read three times for each set of
observations. Additional readings were taken on a particular cell if
the readings varied more than 0.2 psi (1.4 kPa). If the readings
stabilized, that value was recorded; otherwise, the average value was
57
'------------------------------

recorded. The pressure cell readings were estimated to 0.1 psi (0.69
kPa). Normally, the three cell readings were identical for a partic
ular observation. Stem Cells 923 and 929 became inoperative early in
1981. Temperature measurements were made adjacent to Cells 930, 928,
927, 921, and 924 beginning in September of 1980.
Wall Movement.- Wall movement measurements began in August of
1980 when the stainless steel pads were attached to the front face of
the stem and the plumb bob bracket was anchored to the wall. The
inclinometer readings were read and recorded to an accuracy of 1
minute. Repetitive measurements gave consistent results for the first
year, but significant variations in repetitive inclinometer measure
ments began to occur. The inclinometer had been damaged at the TTl
Laboratory and evidently was not satisfactorily repaired. The plumb
line readings were read and recorded to an accuracy of 1/64th of an
inch (0.4 mm). Repetitive plumb line measurements yielded consistent
results throughout the study. Horizontal and vertical wall movements
were read and recorded to a precision of 0.001 ft (0.3 mm) beginning in
November of 1980 when the concrete pier reference point was estab
lished.
Backfilling Sequence.- The height of backfill is an important
factor in this study. Since backfilling was not carried out in a short
time period, Fig. 22 is presented to show backfill heights with respect
to the date each particular profile was first observed. The position
of the backfill corresponding to initial measurements of pressure and
movement can be observed. Pressure cell readings were obtained for
several months before any backfill was placed. Also, the toe of the
58
U1 \0
: ~
t JAN. 82
JUN. 82 APR. 82
I I:':' :,: ,': :',,;,::,:,:1 (' JAN. 82 IX I~ , ." ',': :1 ' c OCT. 81
MAY 81
FEB. 81
NOV. 80
NOV, 80
JUL. 80
.:. ;.: .• ,'';, :'.; ••.. , .••• ' .•••.••••• '; .. : ~'I' ." "
, .
FIG. 22 - Construction Sequence

footing was covered with soil before wall tilt measurements were made
and approximately half of the clay backfill was in place before
horizontal and vertical wall movement measurements were made.
Data Interpretation
Total Earth Pressure.- Each Terra Tec Pneumatic pressure cell has
a built-in preload reading, therefore the pressure cell readings do not
give earth pressure directly. After loading, the earth pressure is
obtained by subtracting the preload reading from the field pressure
reading. This is expressed as
Pe = Pi - Po • • • • • • • • • • • • • • • • • • • • • • • • • •• (9)
in which Pe = the total earth pressure, Pi = the field pressure
reading, and Po = the preload reading. Each Terra Tec pressure cell
was supplied with a test record form which contained the following
information:
"Each pneumatic total pressure sensor has a unique, built-in, offset (preload) value. The factory value for this specific pressure sensor is listed below •••
As a final installation step, a preload value reading should be recorded above. All subsequent data readings will be referenced to this base reading. This field value should be slightly different than the precise factory preload value. Corrected total pressure is computed by subtracting the field preload value from the inground values."
It is implied that the field preload is a constant for each individual
pressure cell and should be approximately equal to the factory preload
value. Typical1y~ when pressure cells are set in place, preload
60
---------------------------------------------------------
readlngs are obtained, and then the cells are covered with construction
material so only one set of field preload readings are obtained.
Variation in Pressure Cell Readings.- The foregoing procedure was
followed for the footing cells in this research program. The cells
along the base of the footing were loaded with the weight of the con
crete immediately after the preload readings were made. The cells on
the heel and toe of the footing were partially exposed to the atmos
phere so the preload condition existed until the backfill was placed.
Six sets of footing cell readings were obtained during the five months
the stem was being constructed. Eleven sets of preload readings were
obtained for the stem cells. Five sets of readings were made when the
cells were attached to the back face form, one set after the concrete
was poured and was still fresh, and five sets after the concrete
hardened and the stem forms were removed. No soil had been placed
against the stem cells, so the preload condition existed through August
of 1980. The magnitude of each pressure cell reading varied signifi
cantly during that time period.
This unexplained variation in cell readings prompted an investi
gation to determine the cause. The calibration of the readout unit was
checked in the TTl laboratory. The manufacturer was consulted, but
could not offer an explanation. Site conditions, including air temper
ature, barometric pressure, and soil moisture were recorded along with
the regular measurements. The variation in cell readings seemed to
correspond to the variation in air temperature, which led to the
decision to install thermocouples. The cell readings continued to vary
even after the backfill was in place. The measurements of field cell
readings, temperatures and backfill heights with respect to time for
61
Cells 930, 928, 927 921, 924, and 935 are presented in Figs. 23 through
28. It is important to note the variation in stem cell readings during
the preload period which was February through August of 1980 as shown
in Figs. 23 through 26. The cell readings observed in June of 1980
show the dramatic change in stem cell readings made just prior to and
just after the concrete was poured. The similarity between the cell
reading and temperature curves is apparent in each of these figures.
Temperature and Pressure Cell Reading Relationship.- The parti
cular relationship between temperature and pressure cell reading for
each cell was established by analyzing the data obtained between
February and October of 1981. The backfill heights were essentially
constant during this period and 10 sets of observations were obtained.
All the cells were covered with soil. As shown in Figs. 29 and 30, a
linear relationship between temperature and cell reading was observed
(solid line). The equation of the line which fit the temperature-cell
reading data for each cell was computed by regression analysis. The
slopes of the fitted lines indicate the effect of temperature on cell
reading for each cell.
Temperature and Preload Pressure Relationship.- It was necessary
to establish a temperature-preload relationship for each cell. Preload
readings had been obtained, but no direct temperatures had been
measured until September of 1980. At this time, stem Cells 930, 929,
928 and 927 were exposed to the atmosphere and a single point on the
temperature-preload graph for these cells was obtained. It was assumed
that the temperature-preload relationship is also linear. Furthermore,
it was assumed that the slope of the temperature-preload graph is
62
20 r ~1: • 800
w a::
m 15 r~ ~70°
W ~ ~60" ::;: w
en II-- ~500 0-
<£ 10 ~ -1.400 0
a:: ..J ..J W u
5
1979
l,~L!k l Temperature
Pressure
, \ \ \ \ ~ \ ~, I ...... , \ I.... .... ..... " r--
\ ~ f \ I \1\ I \ .II , J \ ,,/"
, ,,-" \ ' ," /
\ /" ---- // \ r --.. ---........ \ /
" I , I
" I '...;
TIME, DAYS
1982
FIG. 23. - Cell 930: Pressure, Temperature, Backfill Measurements (OC = 0.56 (OF - 32), 1 psi = 6.89 kPa)
'\

20 ... .,100"
90"
li-. taO" w II:
O'l 15 r~ fw
../=>0 ~ ~60° ::;; w
If) I- ~500 a.
c£ 10 f- -L400 0
II:
.J
.J W u
5
1979 o NqV. ~c o
J,~JLJbk fF' i:" l Temperature
Pressure '\
\ \ \ \ \ "'_... ..-.A \ tr ...... ..,/ ... ---~ ,. \ "\ / \ I \ ..-.11
\ .II \ , .... ..-~ /' \ " ,./ ..... _"" // , ..... ""'- ............. /
" ,-/ ..... / ~ -... ----..-, / , I
......... / ......... '"
9
TIME, DAYS
FIG. 24 - Cell 928: Pressure, Temperature, Backfill Measurements (OC = 0.56 (OF - 32), 1 psi = 6.89 kPa)
1\
20 f ~l: • 80"
w 0:
15 I-~ ~700 « 0:
0'\ I ~ ~60" (J"I
~ 1-500 (J) a..
<£ 10 I- -L400 0
0:
-' -' w u
5
1979 o NOV, DEC I JAN 6
~LJb~ fF' ~. l Temperature
Pressure
1980
, \ \
\ fI'-." \ r ..... .' ...... ---~ j \ I 'fI \ "--1
\ \ .... / \ \ #" \ ~ ............ / w... ,-'- """_...... / ",- -------4' " ,-
" r " / " I -..., I
''vi
1981 1982
TIME, DAYS
FIG. 25 - Cell 927: Pressure, Temperature, Backfill Measurements (OC = 0.56 (OF - 32), 1 psi = 6.89 kPa)
'\
..........

m m
If) Q.
~ 0 0:
...J
...J W u
20 r ~l: • 80"
w 0:
15 r~ fro"
Q. ~60° :::;: w
II-- ~500
10 ~ .J.40°
5
JLJLJbk Jt Temperature
Pressure
... , ~ ___ ......... ....,e
" ,.........', ". " / .... ......JI'
.......... .JJ .......... ~ ..... .............. --- ................".."
........ jY- -......----.-/ ................ /
o ll979 I 1960 '"'0' 1982
NqV. DEC o
TIME, DAYS
FIG. 26 - Cell 921: Pressure, Temperature, Backfill Measurements (OC = 0.56 (OF - 32), 1 psi = 6.89 kPa}
'\

20 K>O"
90" LL 0
80" W 0:
15 r~ 70"
0'1 -...J 60"
:::E w
C/) I t- ~5()0 0-
c.£ 10 ~ --'-40· 0
0:
....I
....I W 0
5
l,~L!k Temperature
Pressure
" "- "-, "- .....
Jt l _ ............ - ..... -r-- ...... --___ /
~ ---........--..... ....... - ........ ....----- _A ................ .,...,...-~ -. .....
TIME, DAYS
FIG. 27 - Cell 924: Pressure, Temperature, Backfill Measurements (OC = 0.56 (OF - 32), 1 psi = 6.89 kPa)
1982
9
1\

en 00
iii 0..
t5 0 0:
...J
...J W u
20 r .1: • 80"
w a::
15 r~ fw ~ ~60" :::;: w I- ~500
10 .. ..J.400
5
~LJbJt Temperature
Pressure
l ................ -_.................. ,.--
" ,JI " ~ " ~ " .... ..... ~ " ..-.. ---.....
~ 1979 1980 ''''0' 1982
°N~V, DEC I JAN, I ' I J ~ I, &; 6 " o 100 1:C;: I£/IIn 60 2'
TIME. DAYS
FIG. 28 - Cell 935: Pressure, Temperature, :Backfill Measurements (OC = 0.56 (OF - 32), 1 psi = 6.89 kPa)
'\

--'" Q. .. 15
0' C
--10 "C C CD a:: -Gi5 o
. -'" Q.
20
15
.. 10 at C .-
"C C CD
a:: 5
--CD o
20
Cell 930 • measured temperature + predicted temperature
40 60 80 Temperature, of
(0 )
---- Po
100
Cen 928 / •
( b)
•
40 60 80 100 Temperature, OF
FIG. 29 - Cells 930 and 928: Temperature-Cell Reading-Relationship (OC = 0.56 (OF - 32), 1 psi = 6.89 kPa)
69

--(/)
c. .. IS
0' C __ 10
-c c CD a: --S CD o
--(/)
c. ..
20
IS
0' CIO ---C C CD
0:::
--S CD o
20
Cell 927 • measured temperature + predicted temperature
40
Cell 921
40
60 80 Temperature, of
/ /
60 80 Temperature, of
(0)
100
( b)
I /
y+ /
100
FIG. 30 - Cells 927 and 921: Temperature-Cell Reading Relationship (OC = 0.56 lOF - 32), 1 psi = 6.89 kPa)
70
parallel with the slope of the temperature-cell reading graph for each
cell. These assumptions are illustrated in Fig. 29(a) and (b) and Fig.
30(a) which show the plot of temperature and cell reading, Pi, and
the assumed temperature and preload, Po, plot for Cells 930, 928, and
927. The preload curves pass through the single data point and are
parallel with the cell reading curves. The total earth pressure is the
difference between the measured cell pressure and the preload value at
the measured temperature. An equation for preload pressure as a
function of temperature, the equation of the dashed line, was
determined for Cells 930, 928, and 927. These equations were then used
to calculate the temperature for each day preload pressures were
measured from March through August 1980. The three computed tempera
tures for these three cells for each particular day were found to be in
close agreement. The maximum difference in computed temperature was
40F (2.20C) with an average difference of 1.70F (l.OOC) for each day.
These differences are within the precision expected if direct
temperature measurements had been made.
The predicted temperatures are considered to apply to those cells
that were exposed to the atmosphere, which include stem Cell 921 and
Cells 924 and 935 which are on the face of the heel and toe respective
ly (see Fig. 13). The computed temperatures and measured preload read
ings, Po, were plotted and a preload curve was established by fitting
a line through these plotted points which was parallel to the tempera
ture-cell reading, Pi, curve for each cell. These curves are shown
in Fig. 30(b) and Fig. 31(a) and (b). The preload curve for Cell 921,
Fig. 30(b), was established using the temperatures and preload readings
71

(0 )
15 Cell 924 --en 0- • measured temperature
x ) .. + predicted temperature
'" c
/~ ·-10 "tl /e
" CD ; .. a:: I -- Pi CD 5 1+ 0 e ---- Po
/ / I
40 60 80 100 120
Temperature, OF
15 / (b) .- Cell 935 en
1+ 0-.. '" I+' x C ·-10 "tl
" +;+ CD a:: - e / -
/ Pi CD5
0 / --- Po
;+ 40 60 80 100 120
Temperature, of
FIG. 31 - Cells 924 and 935: Temperature-Cell Reading Relationship (OC = 0.56 (OF - 32),1 psi = 6.89 kPa)
72

taken from July through August of 1980 after the stem had been placed.
The toe of the footing was covered with soil in late July of 1980 so
the temperature-cell readings after this event were not used to estab
lish the preload curve for cell 935. Confidence in the accuracy of the
computed temperatures was enhanced by observing the data from stem
Cells 923 and 929. Preload readings had been obtained for these cells
from March through August 1980 and temperature-preload curves could be
established. The points plotted along a straight line, which indicates
the computed temperatures are correct, because errors in temperature
would produce an erratic plot. The preload curves for these cells are
not shown because they ceased to function after August 1980.
The cells on the base of the footing and in the key posed a
special problem, because the computed temperatures, based on direct
preload pressure and temperature readings on the top stem cells, could
only be made back to March 1980, when the first stem cell readings were
recorded. The preload condition for the footing Cells 926, 936, 938,
922 and 937 along the base and key, occurred when the first cell
readings were taken in November 1979. Only the weight of the concrete
loaded these cells when cell readings were taken in January 1980. The
temperatures in November and January 1980 were predicted from the
temperature-preload pressure relationship for Cells 924 and 935 on the
face of the heel and toe respectively. The estimated temperature
preload curves for Cells 926, 936, 938, 922, and 937 are presented in
Fig. 32 through Fig. 34. No preload curve is given for Cell 925
because of erratic cell readings for the first year of the study.
73
15 --fI) Q. .. at C
--10 "0 0 Q) a:: --Q)5 0
20
.-15 fI)
Q. .. at C
:.c10 o Q) 0::
--Q)5 o
20
/ (0)
Cell 926 / ••• •• • measured temperature /~ / + predicted temperature
40
Cell 936
40
• / /
+ / +
/ Pi / ---- Po
/ 60 80 100
Temperature, OF
•
/ +/
/ 60 80
(b)
/ /
/ /
---- Po
100
Temperature, OF
FIG. 32 - Cells 926 and 936: Temperature-Cell Reading Relationship (~C = 0.56 (OF - 32), 1 psi = 6.89 kPa)
74

15 .-U)
0. .. tp c .- 10 -0 o Q)
0::
--Q) 5 (.)
20
.-U) 0.
30 .. tp C .--0 o Q) 0:: 20
Q) (.)
10
20
Cell 938 • measured temperature + predicted temperature
p. I
-.-- P o
/
/ /
Y
(a)
/ /
/
40 60 80 100
Temperature, of
(b)
Cell 925
40 60 80 100
Temperature, of
FIG. 33 -. Cells 938 and 925: Temperature-Cell Reading Relationship (OC = 0.56 (OF - 32), 1 psi = 6.89 kPa)
75
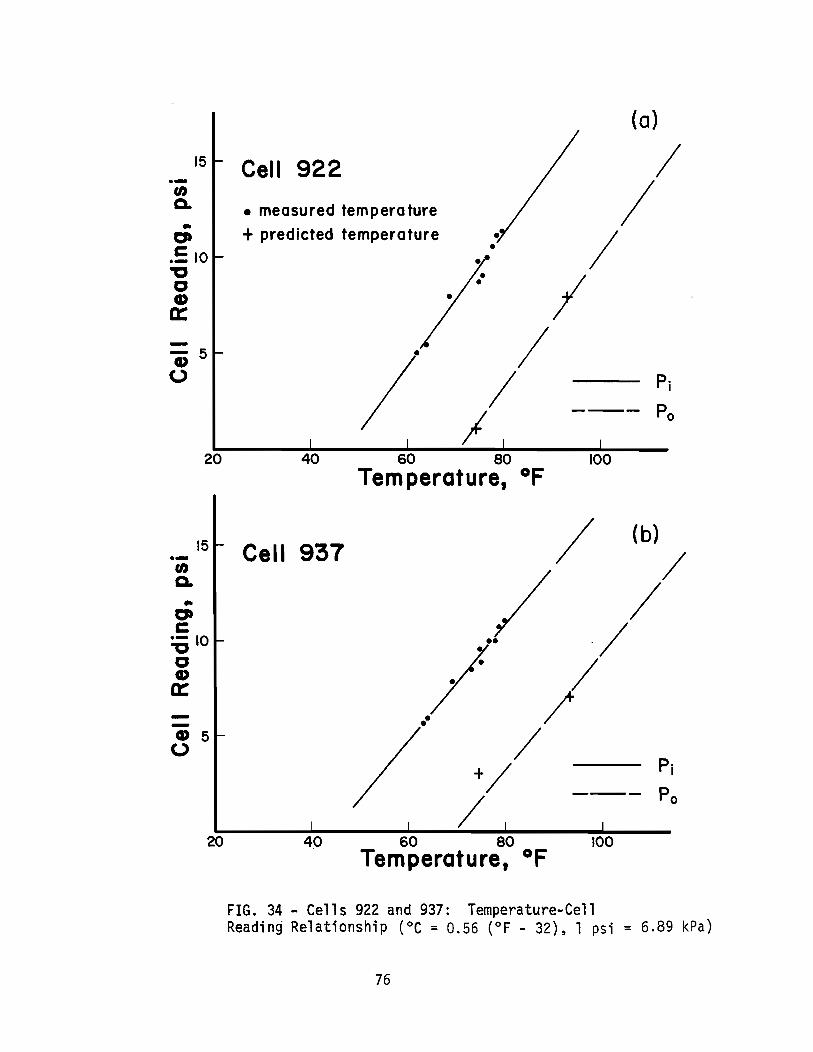
15 .-..
0' C ._ 10 ~ o Q)
a:: --5 Q)
o
20
15 .-rn a. .. 0' c .- 10 . ~ 0 Q)
a:: --Q) 5 0
20
Cell 922
• measured temperature
+ predicted temperature
/ 40 60
•
/ I
80
/
Tem perature, OF
Cell 937
/ ••
I
(0)
/ /
/
--- Po
100
/ (b)
/ /
./ / / / ••
/ / +/ Pi
---- Po /
40 60 80 100 Temperature, of
FIG. 34 - Cells 922 and 937: Temperature-Cell Readin~ Relationship (OC = 0.56 (OF - 32), 1 psi = 6.89 kPa)
76
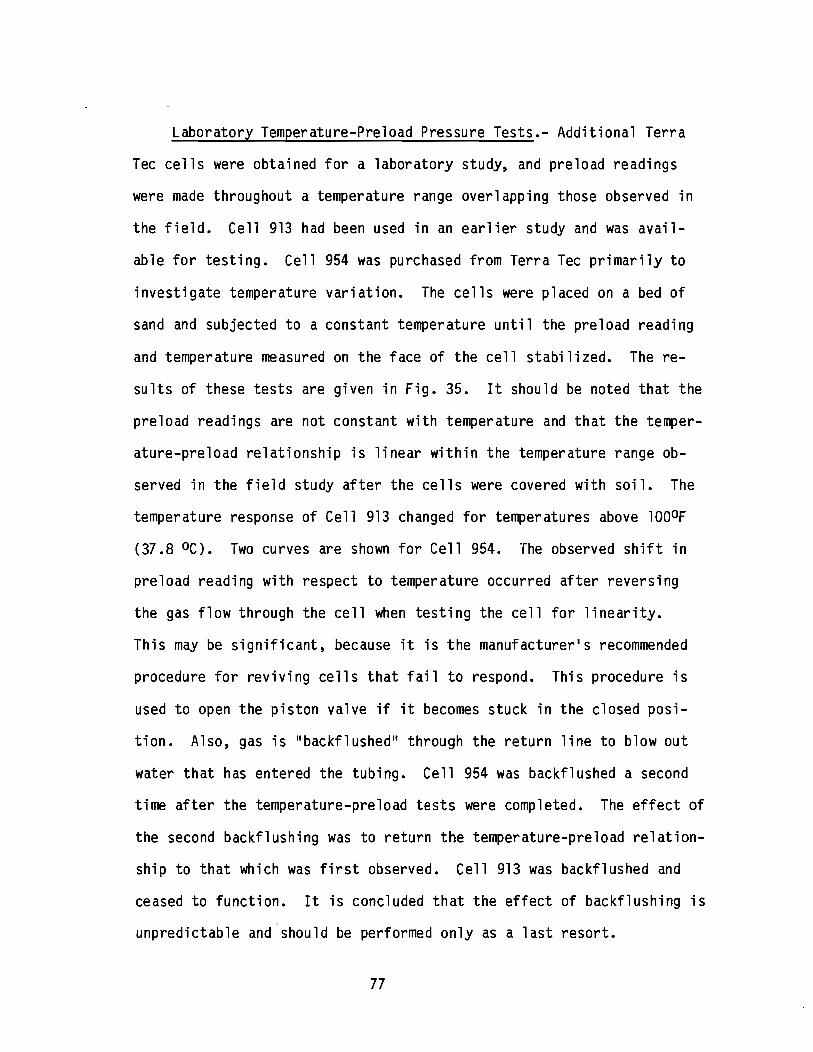
Laboratory Temperature-Preload Pressure Tests.- Additional Terra
Tec cells were obtained for a laboratory study, and preload readings
were made throughout a temperature range overlapping those observed in
the field. Cell 913 had been used in an earlier study and was avail
able for testing. Cell 954 was purchased from Terra Tec primarily to
investigate temperature variation. The cells were placed on a bed of
sand and subjected to a constant temperature until the preload reading
and temperature measured on the face of the cell stabilized. The re
sults of these tests are given in Fig. 35. It should be noted that the
preload readings are not constant with temperature and that the temper
ature-preload relationship is linear within the temperature range ob
served in the field study after the cells were covered with soil. The
temperature response of Cell 913 changed for temperatures above lOOoF
(37.8 0C). Two curves are shown for Cell 954. The observed shift in
preload reading with respect to temperature occurred after reversing
the gas flow through the cell when testing the cell for linearity.
This may be significant, because it is the manufacturer1s recommended
procedure for reviving cells that fail to respond. This procedure is
used to open the piston valve if it becomes stuck in the closed posi
tion. Also, gas is "backflushed" through the return line to blowout
water that has entered the tubing. Cell 954 was backflushed a second
time after the temperature-preload tests were completed. The effect of
the second backflushing was to return the temperature-preload relation
ship to that which was first observed. Cell 913 was backflushed and
ceased to function. It is concluded that the effect of backflushing is
unpredictable and should be performed only as a last resort.
77

25 Cell 913
Cell 954
__ 20 tJ)
0.
.. C» c: .- 15 "'tJ o CD 0::
-CD ... a.
5
0~--~---4--~------~------~------~--40 60 80 100 120 Temperature, of
FIG. 35 - Laboratory Temperature-Preload Relationship (OC = 0.56 (OF - 32), 1 psi = 6.89 kPa)
78
The backf1ushing procedure was performed on cells which failed to
respond during the field performance study. Cells 923 and 929 ceased
to function and did not register after backflushing. Cells 928, 927,
and 921 failed to respond and did register after backf1ushing in
January of 1980, Feburary of 1981, and January of 1982 respectively.
After extensive data analysis, the temperature-preload relation
ship for each pressure cell was established. The temperature-preload
relationships established give the best consistency for each cell and
for cell to cell comparisons. It is important to note that the
temperature-preload relationship is linear throughout the temperature
range observed. Also, backflushing is considered to have had
negligible effect on the temperature-preload response.
In summary, the total earth pressure is obtained by subtracting
the field preload pressure from the field pressure cell reading. The
field preload pressure was found to vary with temperature. Evidence
from field observations and laboratory tests indicates that the preload
pressure varies linearly for the temperature range measured in the
field study. The temperature preload relationship for each cell used
in the research study is shown in Figs. 29 through 34.
Wall Movement.- As shown in Fig. 36, the wall movement was
primarily established with respect to Pad E where direct horizontal,
vertical and tilt movements were measured. The movements at Pads A
through 0 were computed using the plumb line readings and the position
of Pad E.
The position of Pad E was determined from horizontal tape
measurements and leveling. The horizontal movement of the wall at
79

Plumb Line Position
I ~P.L.
Ai
Ao
Stem Face Position
I I
I
I
~A
I I
I I
Ej aE
Eo
Original Position
Subsequent Position
FIG. 36 - Horizontal Wall Movement Analysis
80

Pad E is the difference between the initial horizontal distance from
the hook adjacent to Pad E and the reference point and subsequent
horizontal distance measurements (see Fig. 16). The vertical movement
at Pad E is the difference in rod readings between the hook and the
reference point.
The horizontal movement of Pads A through D is the sum of the
horizontal movement of the plumb line and the difference between the
original plumb line reading and subsequent plumb line readings for each
pad. The movement of the plumb line is the sum of the horizontal
movement at Pad E and the change in plumb line readings at Pad E. This
is illustrated in Fig. 36 where ~E is a direct horizontal measurement.
The horizontal movement of the plumb line, ~P.L., is computed as
follows
~P.L. = ~E + Ei - Eo . . . . . . . . . . . . . . . . . . . . . .
The horizontal movement of the wall at the remaining pads is
illustrated using Pad A. The horizontal movement at Pad A, ~A, is
computed as follows
~ A = ~ P • L. + Ao - Ai . . . . . . . . . . . . . . . . . . . . . .
(10)
(11 )
The horizontal movement of the stem at Pads B, C, and D are computed
using the same procedures. The horizontal wall movements have a
precision of 0.002 ft (0.6 mm).
81

Wall tilt is computed using the difference in plumb line readings
at each pad, and the distance between the plumb bob support and each
pad. This is illustrated in Fig. 37 for Pad E and explained as
follows: the angular rotation or tilt angle, e, is defined by
. . . . . . . . . . . . . . . . . . . . . . . . . . . (12)
where ~RdgE is the difference between the original plumb line reading
and subsequent plumb line readings for Pad E, and RE is the distance
between the radius point and Pad E. The original plumb line position
and the subsequent plumb line position are considered to be coinciden-
tal which places the radius point at the same position as the plumb bob
support. The computed values of the tilt angle at each pad agree with-
in 0.5 minutes of arc for a set of measurements. The computed values
of wall tilt are verified with the inclinometer measurements. The tilt
angle values computed from plumb line readings are more precise and
considered more accurate than those obtained from inclinometer measure-
ments.
Results
Earth Pressure.- Total earth pressure is obtained by subtracting
the preload pressure reading from the field pressure cell reading as
explained previously. A significant finding in this research study is
that the preload reading varies with temperature. The logical conse-
quence of this evidence is that the preload pressure can be determined
only if a corresponding temperature is measured or can be accurately
estimated; theref6re, the total earth pressure can be determined only
82
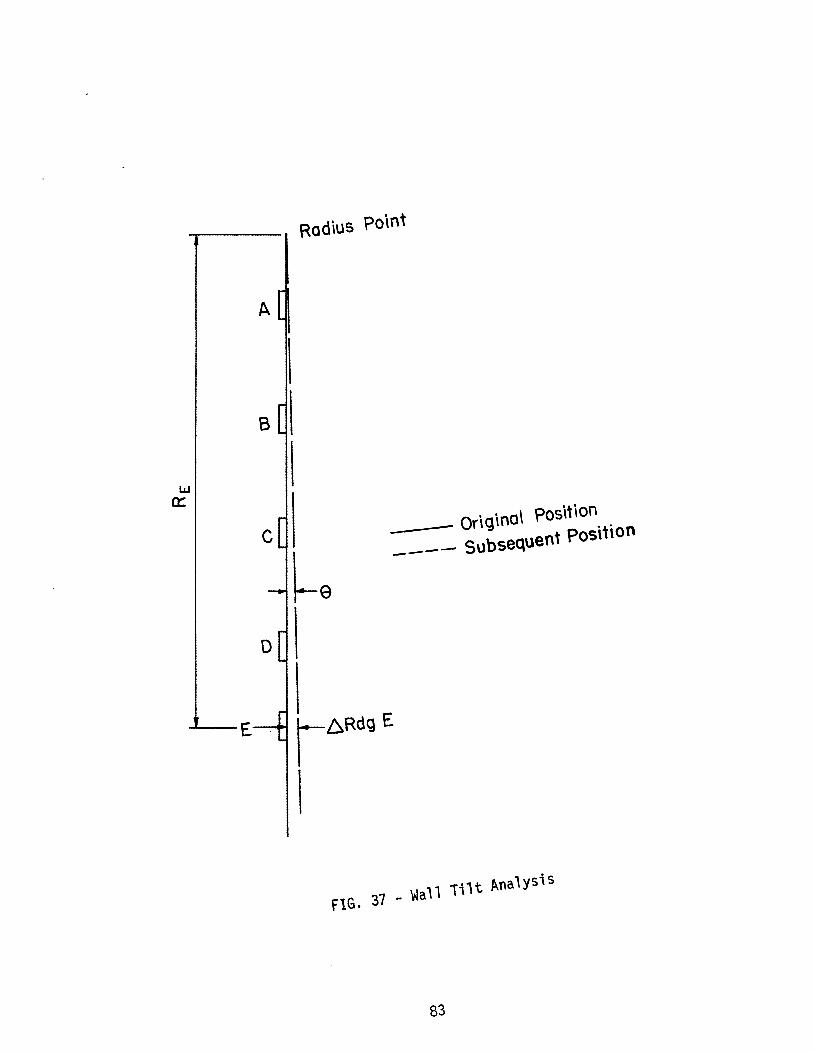
I.LJ a:
E .
Radius Point
A
B
--- Original Position ---- Subsequent Position
r6Rdg E
I
FIG. 37 - Wall Tilt Analysis
83

when the corresponding temperature is known. Complete data, to include
field pressure cell readings, measured or estimated temperatures,
measured or computed preload pressures and total earth pressures are
tabulated in Appendix No. III for each pressure cell.
Earth Pressure, Stem Ce11s.- Total earth pressures for the stem
cells are summarized in Table 1. Stem Cells 929 and 923 are omitted
because these cells ceased to function before earth pressures were
measured. Backfill was not placed against the backface of the stem
through August of 1980, so prior to that date the earth pressure should
be zero. A second set of values for earth pressures was not tabulated
for June 16, 1980 after the concrete was placed and was still fresh,
because these readings were not applicable.
There are some anomalies which deserve special attention. Cell
930 was not covered with soil until February of 1981, but positive
earth pressures were observed in November 1980 and January 1981. A
possible explanation is that a compressive stress on the cell was
developed due to bending caused by the friction on the back face of the
stem from compaction as observed by Ingold (10). The earth pressures
for Cell 921 are significantly different from zero from March 7 through
June 16, 1980, before the stem concrete had been placed. The earth
pressures for Cell 921 between July 9 and August 26, 1980 were approxi
mately zero after the stem concrete had been placed, but no backfill
had been placed against the backface of the stem during this time
period. A possible explanation is that cell reading response changed
after the concrete was placed. Another possible anomaly is the effect
on earth pressure -readings after backflushing. The earth pressure for
84

TABLE 1. - Total Earth Pressure, Stem Cells (1 psi = 6.9 kPa)
Date Total Earth Pressure, psi Time, days 930 928 927 921
7 Mar 80 180 0.0 0.0 + 0.2 + 4.9 1 Apr 80 133 - 0.5 - 0.3 + 0.3 + 3.0
22 Apr 80 154 0.0 + O. 1 + 0.2 + 4.2 4 Jun 80 197 + 0.4 - 0.1 + 0.1 + 3.9
16 Jun 80 209 + 0.2 - 0.2 0.0 + 2.7 16 Jun 80 209 * * * * 9 Jul 80 232 + 0.2 + 0.2 - 0.3 - 0.6
29 Jul 80 252 - 0.1 + 0.1 0.0 + 0.9 8 Aug 80 262 - 0.2 + 0.3. - O. 1 - 0.6
20 Aug 80 274 + 0.1 + 0.3 + O. 1 + 0.5 26 Aug 80 280 + 0.1 + O. 1 + 0.3 + 0.8 18 Sep 80 303 0.0 0.0 0.0 + 3.0 6 Nov 80 352 + 1.7 + 1.0 + 2.2 + 5.0
11 Nov 80 357 + 1.2 + 2.3 + 3.2 + 6.3 7 Jan 81 414 + 2.3 **+ 6.8 + 3.0 + 7.5
85

Date
12 Feb 81 12 Mar 81 20 May 81 2 Jun 81
10 Jun 81 30 Jun 81 9 Ju1 81
23 Ju1 81 10 Sep 81 1 Oct 81
29 Oct 81
6 Jan 82 4 Mar 82
15 Apr 82 26 May 82 10 Jun 82 7 Ju1 82
* - Unknown
TABLE 1. - (Continued)
Time Days
450 478 547
560 568 588 597 611 660 681 709 778 835 877 918
933 960
Total Earth Pressure, psi 930 928 927 921
+ 2.3 + 6.6 **+ 9.6 + 8.7 + 1.7 + 7.4 + 9.6 + 8. 1 + 2.3 + 8.4 + 11. 1 + 10.3 + 2.1 + 7.8 + 10.3 + 8.5 + 1.8 + 7.3 + 9.8 + 9.6 + 1.9 + 6.9 + 9.6 + 9.6 + 1.9 + 7.3 + 9.9 + 9. 1 + 2.3 + 6.9 + 9.4 + 9. 1 + 2.5 + 6.5 + 9.7 + 8.4 + 2.3 + 6.9 + 10.9 + 8. 1 + 2. 1 + 6.7 + 9.9 + 7.2 + 3.2 + 7.3 + 10.3 **+ 7.6 + 4.3 + 7.0 + 10. 1 + 8.8 + 4.7 + 7.7 + 10.3 + 8.6 + 5.0 + 8.5 + 10.8 + 9.6 + 4.9 + 8.8 + 10.6 + 10.7 + 5.2 + 8.3 + 10. 1 + 11. 1
** - Backf1ushed to obtain response
86

Cell 928 on January 7, 1981 is not consistent with the earth pressures
reported in November 1980 when the backfill height was the same. The
cell was backflushed on the January 1981 date. Cell 927 was back
flushed on February 12, 1981 and a significant increase in earth
pressure has been observed since that date, but a significant increase
in backfill corresponds to this event. Cell 921 was backflushed in
January 1982. No significant variation in earth pressure was observed
prior to or after this date. The effect of backflushing cannot be
determined conclusively based on field and laboratory observations.
Earth Pressures, Vertical Footing Cells.- Table 2 contains the
earth pressures for the cells on the vertical faces of the footing.
Cell 924 and Cell 935 are located on the heel and toe of the footing
and Cell 938 is located on the key of the footing. Earth pressures are
not tabulated if temperature measurements or accurate estimates are not
available. Cell 924 was partially exposed to the atmosphere until
September 1980 so earth pressures are tabulated for all dates except
June 16, 1980. Cell 935 was covered with soil in July 1980 so no valid
temperature estimates could be made until September 1980 when tempera
ture measurements began. The temperature estimated for the stem cells
on June 16, 1980 is not considered valid for the footing cells because
the stem cells were shaded by the forms and Cells 924 and 935 were not.
It is important to note that a temperature difference of 30F (1.670 )
will cause a cell reading change on the order of 1 psi (6.89 kPa). No
earth pressures are tabulated between March and August of 1980 for Cell
938, because no accurate temperatures can be estimated during this time
87
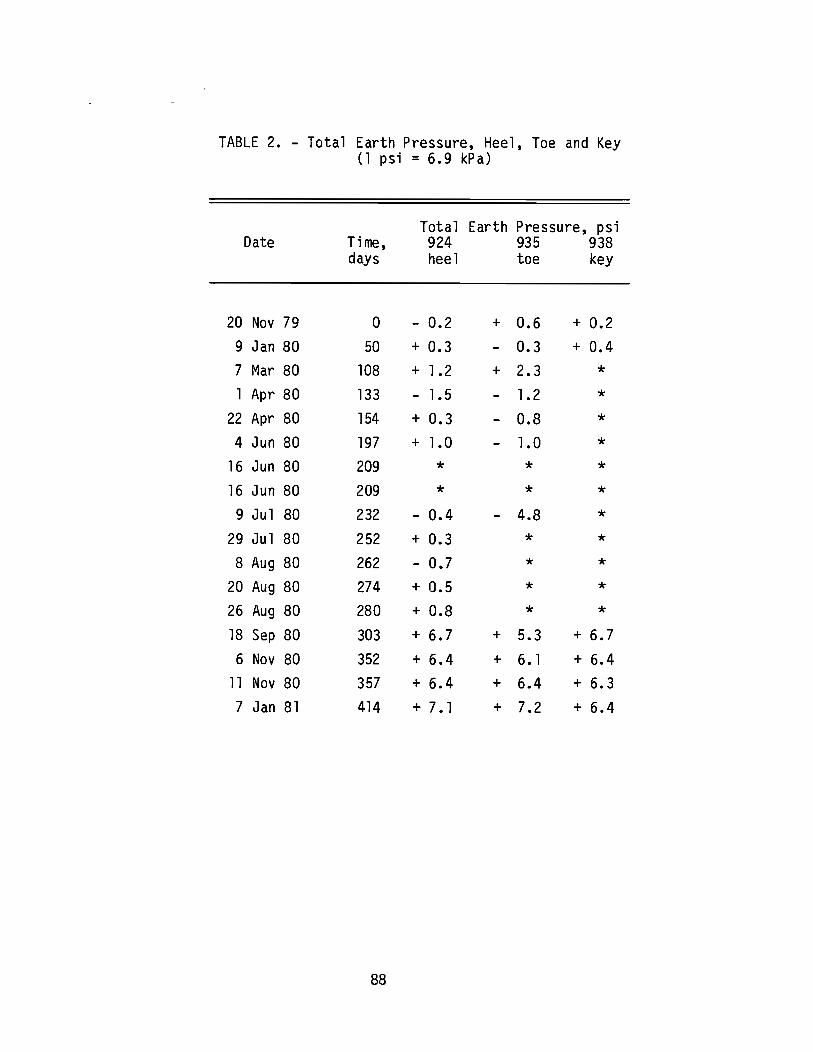
TABLE 2. - Total Earth Pressure, Heel, Toe and Key (1 psi = 6.9 kPa)
Date
20 Nov 79 9 Jan 80 7 Mar 80 1 Apr 80
22 Apr 80 4 Jun 80
16 Jun 80 16 Jun 80 9 Ju1 80
29 Ju1 80 8 Aug 80
20 Aug 80 26 Aug 80 18 Sep 80 6 Nov 80
11 Nov 80 7 Jan 81
Time, days
0 50
108 133 154 197 209 209 232
252 262 274 280
303 352 357 414
88
Total Earth Pressure, psi 924 935 938 heel toe key
- 0.2 + 0.6 + 0.2 + 0.3 - 0.3 + 0.4 + 1.2 + 2.3 * - 1.5 - 1.2 * + 0.3 - 0.8 * + 1.0 - 1.0 *
* * * * * *
- 0.4 - 4.8 * + 0.3 * * - 0.7 * * + 0.5 * * + 0.8 * * + 6.7 + 5.3 + 6.7
+ 6.4 + 6. 1 + 6.4 + 6.4 + 6.4 + 6.3
+ 7. 1 + 7.2 + 6.4
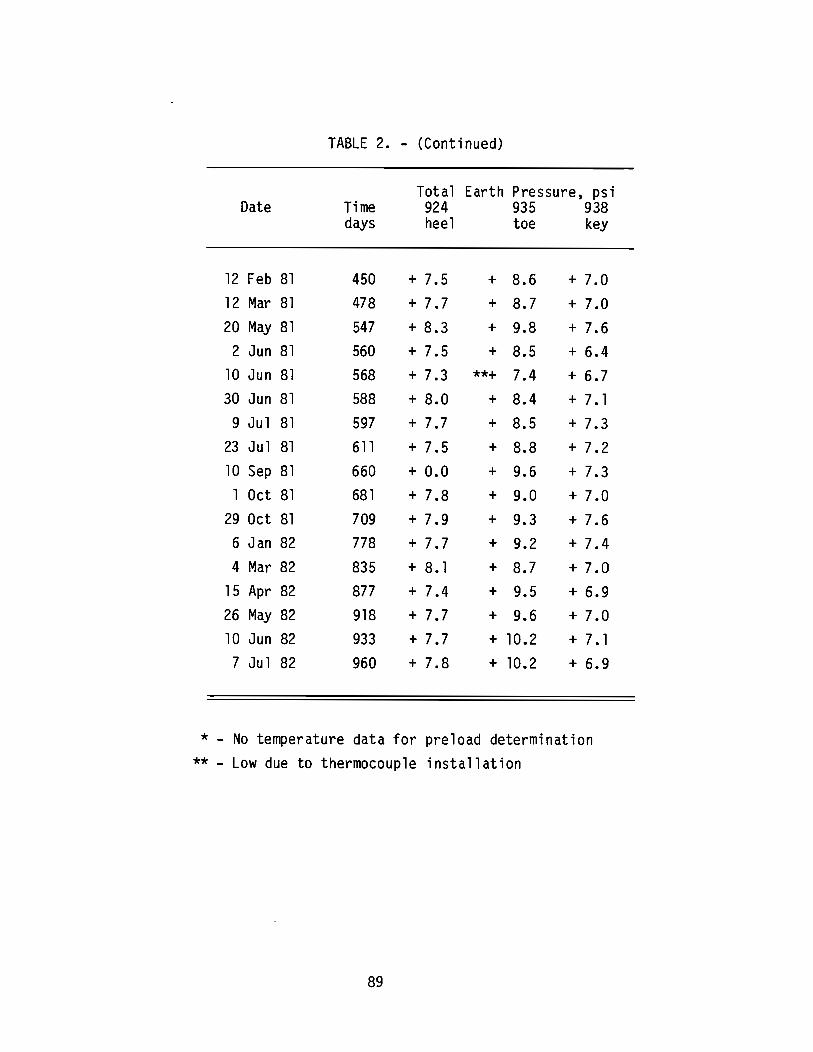
Date
12 Feb 81 12 Mar 81 20 May 81 2 Jun 81
10 Jun 81 30 Jun 81 9 Jul 81
23 Jul 81 10 Sep 81 1 Oct 81
29 Oct 81 6 Jan 82 4 Mar 82
15 Apr 82 26 May 82 10 Jun 82 7 Jul 82
TABLE 2. - (Continued)
Time days
450 478 547 560 568 588 597 611 660 681 709 778
835 877 918 933 960
Total Earth Pressure, psi 924 935 938 heel toe key
+ 7.5 + 8.6 + 7.0 + 7.7 + 8.7 + 7.0 + 8.3 + 9.8 + 7.6 + 7.5 + 8.5 + 6.4 + 7.3 **+ 7.4 + 6.7 + 8.0 + 8.4 + 7.1 + 7.7 + 8.5 + 7.3 + 7.5 + 8.8 + 7.2 + 0.0 + 9.6 + 7.3 + 7.8 + 9.0 + 7.0 + 7.9 + 9.3 + 7.6 + 7.7 + 9.2 + 7.4 + 8.1 + 8.7 + 7.0 + 7.4 + 9.5 + 6.9 + 7.7 + 9.6 + 7.0 + 7.7 + 10.2 + 7.1 + 7.8 + 10.2 + 6.9
* - No temperature data for preload determination ** - Low due to thermocouple installation
89

period. The earth pressure readings should be zero prior to September
1980 for Cell 924, prior to July 1980 for Cell 935, and in November
1979 for Cell 938. These dates correspond to the preload condition for
each of the cells respectively. The observed variation from zero
pressure readings for Cells 924 and 935 is attributed to the fact that
the cells were partially covered with soil which sloughed off the face
of the excavation. This soil, though loose, probably provided an
insulation effect which caused the estimated temperatures to be
slightly in error.
Earth Pressure, Horizontal Footing Cells.- The earth pressures
for the cells located along the base of the footing are presented in
Table 3. No accurate temperature estimate could be made before
September 1980 when temperature measurements were begun, so earth pres
sures are not given before this date except for the preload condition
in November 1979 and the approximate preload condition in January 1980.
The earth pressures for November 1979 should be zero for these cells.
All but Cell 926 satisfy this requirement. The cell readings for Cell
926 were not consistent with the other cells early in the study, but
became less erratic after backfilling. It should be noted that the
earth pressures change very slightly between September 1980 and July
1982. This implies that the earth pressures along the base of the
footing are not significantly affected by the backfill height which
increased by a factor of 4.5 during this time period. The temperature
preload pressure relationship could not be established for Cell 925 so
earth pressures could not be obtained.
90

TABLE 3. - Total Earth Pressure, Footing Cells (1 psi = 6.9 kPa)
Date
20 Nov 79 9 Jan 80 7 Mar 80 1 Apr 80
22 Apr 80
4 Jun 80 16 Jun 80
16 Jun 80 9 Jul 80
29 Ju1 80 8 Aug 80
20 Aug 80 26 Aug 80 18 Sep 80 6 Nov 80
11 Nov 80 7 Jan 81
Time, days
0 50
108 133 154
197 209
209 232 252 262 274 280 303 352 357 414
-+
+
+
+
+
91
Total Earth Pressure, psi 926 936 922 937
1.6 + 0.1 + 0.1 + 0.1 4.2 + 0.8 - 0.2 + 1. 6
* * * * * * * * * * * * * * * * * * * * * * * * * * * * * * * * * * * * * * * * * * * *
9.0 + 7.9 + 6.4 + 7.7 8.8 + 7.4 + 6.9 + 6.7 8.7 + 7.5 + 7.0 + 6.8
9.3 + 8.3 + 7.8 + 6.9

Date
12 Feb 81 12 Mar 81 20 May 81 2 Jun 81
10 Jun 81 30 Jun 81 9 Jul 81
23 Jul 81 10 Sep 81 1 Oct 81
29 Oct 81 6 Jan 82 4 Mar 82
15 Apr 82 26 May 82 10 Jun 82 7 Jul 82
TABLE 3. - (Continued)
Time, days
450 478 547 560 568 588 597
611 660 681 709 778 835 877 918
933 960
Total Earth Pressure, psi 926 936 922 937
+ 10.0 + 9. 1 + 8.0 + 7.3 + 9.9 + 8.9 + 7.8 + 7.4 + 10.5 + 9.5 + 8.5 + 7.9 + 9.4 + 8.3 + 7.2 + 7.3 + 9.4 + 8.4 + 7.2 + 7.0 + 10.2 + 9.2 + 8.2 + 7.7 + 10.4 + 9.2 + 7.8 + 7.5 + 10.7 + 9.6 + 8.0 + 7.3 + 10.3 + 9.5 + 8.6 + 7.7 + 9.8 + 9. 1 + 8.0 + 7.4 + 9.7 + 8.7 + 8.2 + 7.3 + 10.4 + 9.4 + 8.2 + 7. 1 + 9.4 + 9. 1 + 8.4 + 7.5 + 9.5 + 8.8 + 7.4 + 6.8 + 9.5 + 8.8 + 7.7 + 7. 1 + 9.6 + 9.3 + 8.0 + 7.3 + 10. 1 + 10.2 + 8.2 + 7.6
* - No temperature data for preload determination
92
Pressure Distribution, Heel Side.- The distribution of earth
pressures is an important consideration in the design of retaining
walls. Design should be based on the maximum pressures. This
condition occurred after the backfill and paving of the Left Frontage
Street Ramp was completed and includes the earth pressures observed
from April 15 through July 7, 1982.
The minimum to maximum values of earth pressures obtained during
this time period for the stem cells and the cellon the heel of the
footing are presented in Fig. 38. The pressure distribution is linear
for those cells which were above the natural ground surface - Cells
930,928 and 927. The linear distribution projected to the surface
results in a earth pressure of 2 psi (13.8 kPa) which is consistent
with the earth pressures measured near the surface when the backfill
height was at the same level as Cells 928 and 930. This probably
represents a portion of the residual lateral earth pressure due to
compaction. The indicated linear increase in lateral pressure with
depth would be developed using a coefficient of earth pressure equal to
one. The pressures decrease appreciably at Cell 921 at the base of the
stem and Cell 924 on the heel. These cells were completely covered
with sand which was dumped into the void created by the footing excava
tion and then the sand was compacted lightly. The relatively low
compactive effort and sand backfill contribute to the lower pressures
measured at these cells. Also, arching probably occurred between the
stem and footing and the face of the footing and face of the excava
tion, which reduced the pressures measured at these cells.
93
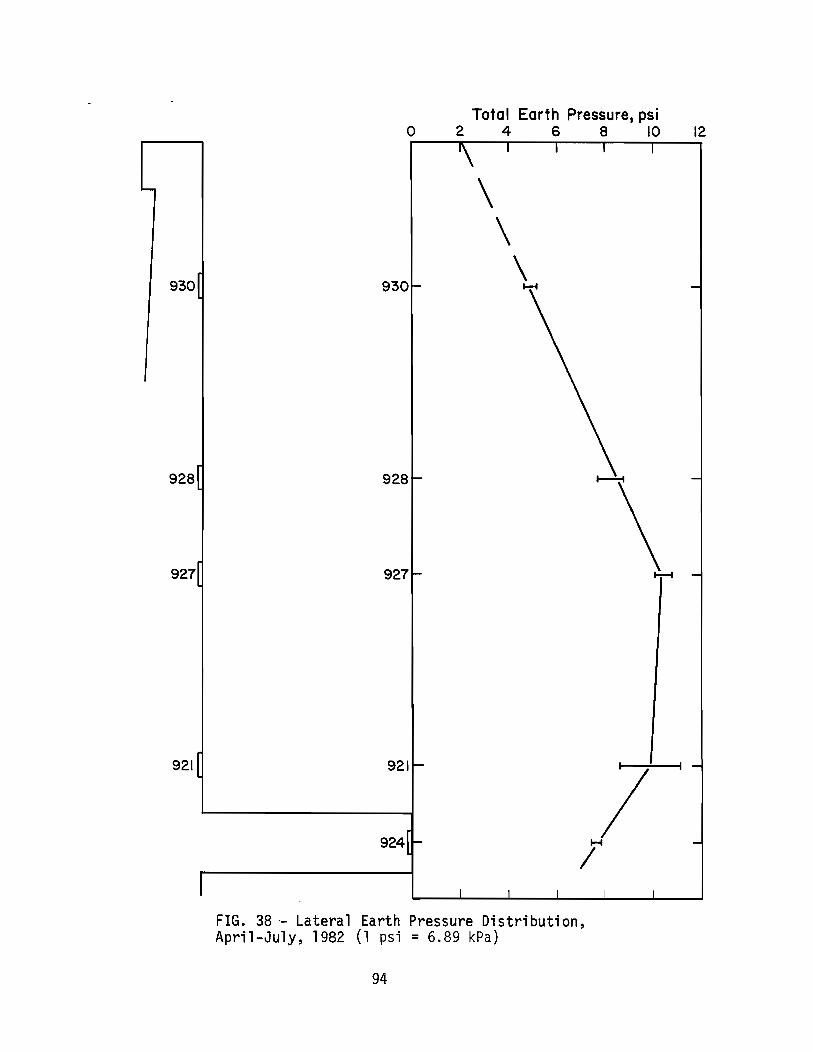
930
928
927
921
o
930
928
927
Total Earth Pressure, psi 2 4 6 8 10
\ \ \
/ 1-1
/
FIG. 38"- Lateral Earth Pressure Distribution, April-July, 1982 (1 psi = 6.89 kPa)
94
12
Pressure Distribution, Toe Side.- The pressure on the toe side of
the wall was measured at the face of the toe and the face of the key
only. Assuming the pressure distribution is similar to the top portion
of the pressure distribution shown in Fig. 38, the coefficient of earth
pressure would be 3.5 above the base of the footing. The coefficient
of earth pressure at the key would be 2.5 if the effect of compaction
is neglected. The earth pressure coefficients given above are consis
tent with the earth pressures between April and June 1982 in Table 2,
and the depth of backfill for these dates.
Pressure Distribution, Base of Footing.- The earth pressure
distribution along the base of the footing observed between April 15,
1982 through July 7, 1982 is shown in Fig. 39. The pressure decreases
linearly from a maximum at the toe to a minimum at the heel of the
footing. The pressure distribution corresponding to September 1980,
when the backfill heights on each side of the stem were approximately
the same, was nonlinear with greater pressures at the heel and toe and
lower pressures near the center. The distribution became linear as the
backfill height behind the wall increased.
Accuracy of Earth Pressures.- The accuracy of the earth pressures
depends on the accuracy of the measured field pressures and the cor
responding preload pressures. Field pressure measurements were
repeated and consistent readings typically observed for each date read
ings were obtained. The procedure of backflushing is assumed to have
no effect on the field pressure readings.
The preload pressures were found to be highly temperature depen
dent. Nominally, the precision of the preload pressure is 0.33 psi/OF
95
.~------ ----------
926 --
0
2
In 0.4
Q) ~
~ 6 In Q) ~
a.. S
.s::. -~ 0 w10
12 926
936 925 922 -- - ......---.
936 925 922
FIG. 39 - Earth Pressure Distribution on Footing Base, April-July, 1982 (1 psi = 6.89 kPa)
96
937 .---.
937
(4.14 kPa/oC). The precision of measured temperatures is about
1.50F (0.12 0C).
The overall accuracy of the earth pressures is a function of the
several factors discussed previously. The indicated precision of earth
pressures as presented in Tables 1 through 3 is apparently inconsistent
with the precision implied in the previous discussion. The tabulated
values of earth pressures are consistent with direct observations and
best estimates of temperature. It is believed that the best indicator
of the precision of the earth pressures for each cell is the range of
measured values corresponding to a particular backfill height. This is
shown graphically in Figs. 38 and 39. The effect of pressure redis
tribution with time and cell linearity are also incorporated in the
range of earth pressures shown.
Wall Movement.- The wall movement was measured in separate compo
nents of horizontal movement, vertical movement and tilt. The horizon
tal movement at the stainless steel pads is presented in Table 4. The
negative sign indicates movement towards the heel. The horizontal
movements were computed from the direct horizontal movement at Pad E
and the plumb line readings as described previously. Direct horizontal
measurements were begun in November 1980. Plumb line readings and
inclinometer readings were taken earlier in August 1980. There was no
change in either the plumb line readings or inclinometer readings
between August and November which indicates that no tilt occurred dur
ing that time. The horizontal movement values given in Table 4 and
illustrated in Fig. 40 represent minimum values because some transla
tion probably occurred since 7 ft (2.13 m) of backfill had been placed
97
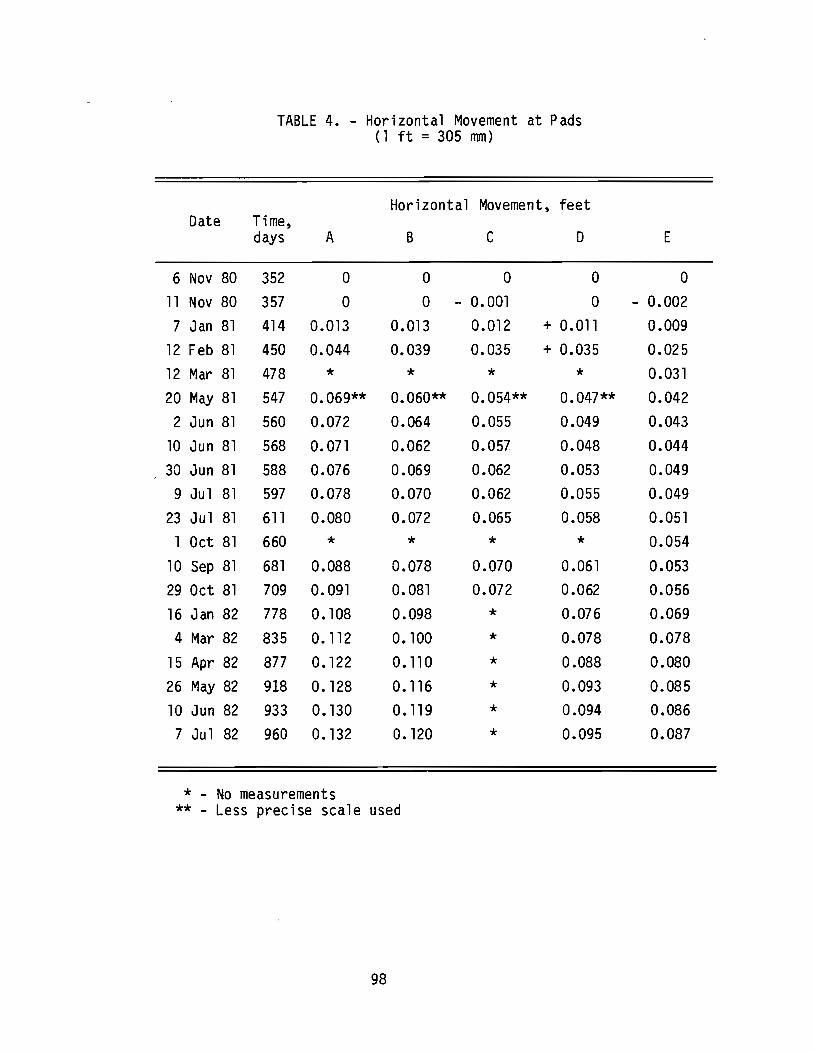
Date
6 Nov 80 11 Nov 80 7 Jan 81
12 Feb 81 12 Mar 81 20 May 81 2 Jun 81
10 Jun 81 30 Jun 81 9 Jul 81
23 Jul 81 1 Oct 81
10 Sep 81 29 Oct 81 16 Jan 82 4 Mar 82
15 Apr 82 26 May 82 10 Jun 82 7 Jul 82
TABLE 4. - Horizontal Movement at Pads (1 ft = 305 mm)
Horizontal Movement, feet Time, days A B C D
352 0 0 0 0
357 0 0 - 0.001 0 414 0.013 0.013 0.012 + 0.011
450 0.044 0.039 0.035 + 0.035
478 * * * * 547 0.069** 0.060** 0.054** 0.047**
560 0.072 0.064 0.055 0.049
568 0.071 0.062 0.057 0.048
588 0.076 0.069 0.062 0.053 597 0.078 0.070 0.062 0.055
611 0.080 0.072 0.065 0.058
660 * * * * 681 0.088 0.078 0.070 0.061
709 0.091 0.081 0.072 0.062
778 0.108 0.098 * 0.076
835 0.112 O. 100 * 0.078
877 0.122 0.110 * 0.088
918 O. 128 0.116 * 0.093 933 0.130 O. 119 * 0.094
960 O. 132 o. 120 * 0.095
* - No measurements ** - Less precise scale used
98
E
0 - 0.002
0.009 0.025 0.031 0.042 0.043 0.044 0.049 0.049 0.051 0.054 0.053 0.056 0.069 0.078
0.080 0.085 0.086 0.087
o Inches
1 I ~
I
t I ! I !
26 Aug 80 6 Nov - 7 Jan 81 12 Feb-I Oct 81 . 6 Jan 82
FIG. 40 - Horizontal Wall Movement and Tilt (1 in. = 25.4 mm)
99
A
B
c
D
E
7 Jul 82
during that time span. Plumb line readings could not be obtained in
March and September of 1981 so no horizontal movements are tabulated
for Pads A through E on these dates. Pad C was vandalized in January
1982. The horizontal wall movement with respect to particular dates
and backfill heights is shown graphically in Fig. 40. It can be seen
that the stem remained rigid.
The wall tilt is also indicated in Fig. 40. The computed tilt
for the six dates shown, in minutes of arc, are 00, 01, 07, 15, 19 and
21 respectively. The inclinometer readings verify these values. It
should be pointed out that the front face of the stem is on a batter so
the impression that the wall is overturning, as indicated by Fig. 40,
is not correct.
The vertical wall movement was measured directly at Pad E. The
total settlement was 0.034 ft (10 mm) measured between November 1980
and July 1982. This represents a minimum value, since some settlement
probably occurred prior to November when vertical movement measurements
began. The relatively low settlement was expected because the footing
is supported by a stabilized sand overlying a stiff preconsolidated
clay.
100
TEST WALL DESIGN
District 12 TSDHPT Design
Wall Proportions.- The as-built proportions and dimensions of the
test wall have been given in Fig. 11. These proportions are represen
tative of those obtained using current design procedures. A cross sec
tion of unit width is used in the design procedures.
Geotechnical Properties.- The geotechnical properties of the
foundation soil are determined from laboratory tests and/or correla
tions from the TSDHPT cone penetration test. Spread footings without
piling or pier suppports are considered appropriate for clay foundation
soils which have an undrained shear strength greater than 2000 psf
(95.8 kPa) (13). The backfill is assumed to be a granular soil with a
unit weight of 115 pcf (18.1 kN/m3). The equivalent fluid method is
the basis for this design procedure. An equivalent fluid unit weight,
Ye, equal to 40 pcf (6.3 kN/m3) for horizontal backfill is
specified.
Gravity Forces.- The gravity forces due to the weight of the
structure and the soil above the base of the footing are computed as
the product of the unit weight of the material and the appropriate area
(areas 1, 2, 3, 4 and 5) as indicated in Fig. 41. A live load, an
equivalent uniform surcharge, equal to 2 ft (0.61 m) of backfill is
included in the TSDHPT design. The weight of the key is neglected.
Lateral Forces.- The lateral force due to the equivalent sur
charge is
Phs=YeHs H ••• . . . . . . . . . . . . . . . . . . . . . . .
101
(13)
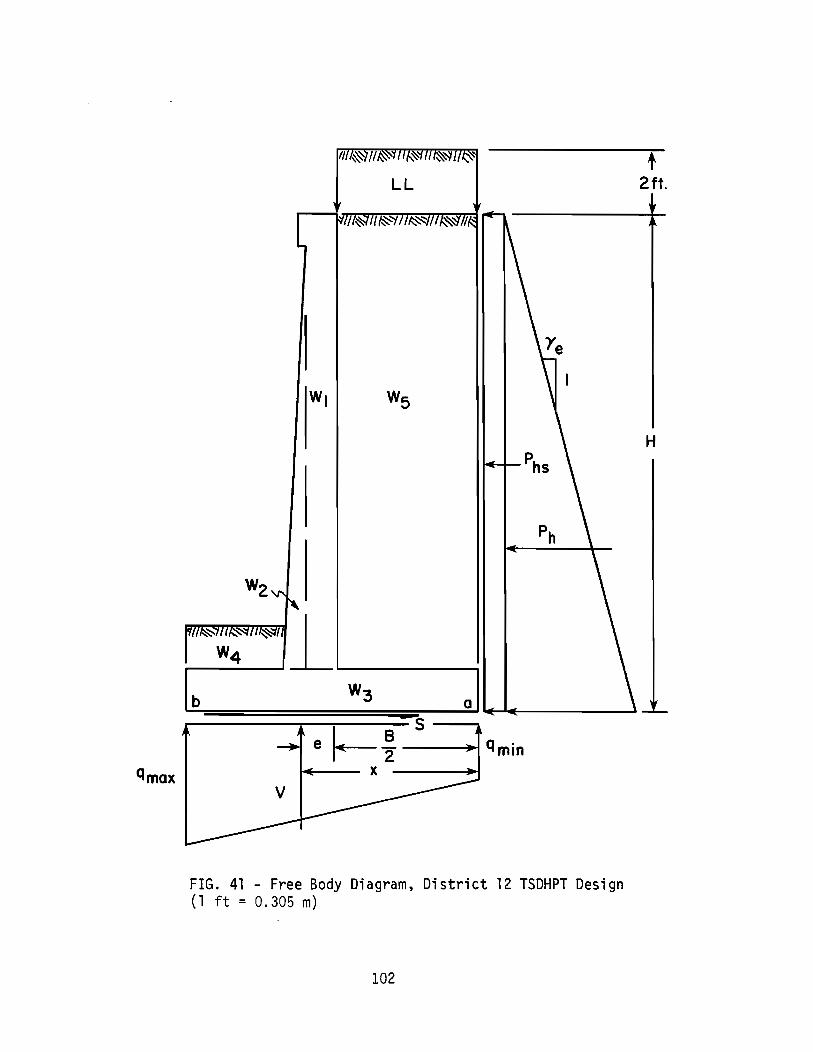
qmax
FIG. 41 - Free Body Diagram, District 12 TSDHPT Design (1 ft = 0.305 m)
102
+ 2ft.
H
in which Hs = 2 ft (0.61 m) and H = the design height. The lateral
force due to the equivalent fluid is computed using Eq. 7, repeated
here for reference
y H2 Ph = + ............................ (7)
The lateral forces on the toe side of the wall are conservatively
considered to be zero in the TSDHPT design.
Footing Pressure.- The maximum and minimum footing pressures
acting on the base of the footing are computed using Eq. 8 discussed
previously and repeated here for ready reference
q = BV (1 + 6e) - B . . . . . . . . . . . . . . . . . . . . . . . . . . (8)
Reviewing, V is the sum of the gravity forces and e is the difference
between x and B/2. Moments are taken about the bottom of the heel,
point a, in order to obtain the value of x. These terms are shown in
Fig. 41.
Stability.- The stability against sliding is achieved by the
shear force that develops in the foundation soil beneath the footing
and the lateral force acting on the front side of the wall. The TSDHPT
design assumes the slip surface occurs along the base of the footing
and neglects the beneficial effects of the key with respect to the
increased slip surface length and the lateral force on the face of the
key, as well as the front face of the toe and stem. The specifications
state that the allowable bearing capacity of the foundation soil must
103

not be exceeded to assure stability against bearing failure. The wall
is considered stable against overturning if e is less than B/6.
Structural Design.- The District 12 TSDHPT design standard in
cludes the size and placement of steel reinforcement in the retaining
wall. The structural analysis is based on allowable stresses of 1 200
and 20 000 psi (8 300 and 138 000 kPa) for the concrete and steel
respectively.
Drainage.- The provision for drainage, as discussed previously,
is weep holes on 10 ft (3.05 m) centers for the test wall design.
Lateral drains are sometimes used (14).
Construction.- Construction was governed by TSDHPT specifica
tions. Only one TSDHPT field representative was assigned to the
project.
Comparison with Study Results
Wall Proportions.- The as-built wall dimensions agree with the
project plans and specifications within acceptable tolerances. Had the
designer anticipated a clay backfill, the width of the footing would
have been considerably larger, based on current design procedures.
Geotechnical Properties.- The foundation soil properties are
consistent with those assumed in the TSDHPT design. The clay backfill
is significantly different than the granular backfill assumed in the
design. By comparison, the Ye value for a horizontal stiff clay
backfill material is 120 pcf (18.8 kN/m3) (8,23).
Gravity Forces.- The calculations for gravity forces are summar
ized in Table 5. The forces were computed by multiplying the unit
weight of the material by the appropriate area. The dimensions used in
104
the area computations are found in Fig. 11. The differences in gravity
forces W4 and W5 are due to the use of the measured unit weight of
the backfill material and the assumed design value. No surcharge was
applied so the measured value is zero. The tabulated values of the
measured resultant gravity force V were obtained by summing measured
gravity forces Wl through W5 and computing the area of the measured
footing distribution given in Fig. 39. The difference in these values
(12.70 and 11.07) may be attributed to measurement errors. There is
possibly a vertical component of resistance to movement on the face of
the toe. The assumption that the value of V is approximately equal to
the gravity forces is valid.
TABLE 5. - Design and Measured Gravity Forces (1 kip/ft = 14.6 kN/m)
Force Kip/foot District 12 TSDHPT Measured
Wl 0.150(1.00)(14.0) = 2. 10 0.150(1.00)(14.0) = 2. 10
W2 0.150(0.67)(13)/2 = 0.65 0.150(0.67)(13)/2 = 0.65
W3 O. 150 ( 9 • 0)( 125 ) = 1.69 O. 150 (9.0)( 1. 25) = 1.69
W4 0.115(3.0)(1.3) = 0.45 O. 128 (3.0)( 1. 3) = 0.50
W5 0.115(4.33)(14.0) = 6.97 0.128(4.33)(14) = 7.76
LL 0.115 (4.33)(2.0) = 1.00 NA = 0
V Wl+W2+W3+W4+W5+LL = 12.76 Wl+W2+W3+W4+W5 = 12.70
V NA Area Fig. 39 = 11.07
105
Lateral Forces.- The computations for lateral forces are summa-
rized in Table 6. These calculations are based on TSDHPT design
procedures, wall dimensions from Fig. 11, measured lateral pressures
and horizontal equilibrium.
Force kip/foot
Phs
Ph
Ptoe
Pkey
S
TABLE 6. - Design and Measured Lateral Forces (1 kip/ft = 14.6 kN/m)
District 12 TSDHPT Measured
40(2)(15.25) = 1.22 NA
40(15.25)2/2 = 4.65 Area of Fig. 38
Assume = 0 1.42 (1. 25)
Assume = 0 1.00 (1.33)
=
=
=
=
Phs + Ph = 5.87 Ph - Ptoe - Pkey =
0
16.43
1.77
1.33
13.33
The lateral force due to the equivalent surcharge, Phs, used
in the TSDHPT design is due to a live load. The live load is zero in
the measured column as no live loads were applied during the course of
the study.
A significant difference between the design and measured values
of the force, Ph, was observed. This difference is partially attri
buted to the difference between the granular backfill anticipated by
the designer and the clay backfill used in the construction plus resid
ual lateral stresses induced by compaction. In fact, had the designer
106
used an equivalent fluid unit weight corresponding to stiff clay, the
computed value of Ph would increase by a factor of three, which
better agrees with the measured value. The measured value of Ph was
determined as the resultant of the lateral pressure distribution of
Fig. 38.
The TSDHPT design conservatively omits the force that develops on
the face of the toe and neglects the force which develops on the front
face of the key. Therefore, these forces are shown as zero in Table 6.
The measured pressure on the face of the toe is approximately 3.5 times
larger than the measured pressure on the back face of the stem at the
same depth of backfill. The measured pressure on the front face of the
key is less than the pressure on the toe of the footing. This may be
due to restricted relative movement of the key against the soil. The
adhesion of the soil to the base of the footing in front of the key
probably reduced the effect of the movement of the key into the soil.
This drag effect on the key cell was enhanced because the cell was
placed at the top of the key. Also~ little residual stress due to
compaction was developed on the face of the key.
The shear force, S, tabulated in Table 6 reflects the horizontal
force necessary to achieve horizontal equilibrium. Lateral pressures
were not measured on the front face of the stem due to the 1.3 ft (0.40
m) of backfill above the top of the footing~ so the value of 13.33 in
the measured column probably overestimates the magnitude of the shear
force needed for horizontal equilibrium. Despite this fact, a signifi
cant difference between design and measured lateral forces exists.
Footing Pressure.- The pressure distribution on the base of the
107
footing is determined using Eq. 8. The point of application of V is
determined by summing moments about the base of the heel, point a in
Fig. 41. The summation of moments yields the distance x which is used
to determine the eccentricity, e (see Fig. 41). Thus, the terms in Eq.
8 are evaluated. The computations of moments are presented in Table 7
for both the TSDHPT design and measured gravity and lateral forces.
The forces given in Table 5 and Table 6 are repeated in Table 7 for
ready reference. The moment arms can be verified by referring to Fig.
11 and Fig 41. Ptoe and Pkey are considered to act at the center
of the toe and key respectively. Dual moment arms are tabulated for
Ph and S. The moment arms for Ph, 5.08 and 6.41, correspond to the
locations of the centroid of the pressure distributions shown in Fig.
41 and Fig. 38 respectively. The moment arms for S which are 0 and
1.33 correspond to the assumed location of S. The TSDHPT design
assumes that S acts along the base of the footing. It is assumed for
this text that S acts on a horizontal plane through the base of the key
for the measured condition as shown in Fig. 8(c). The summation of
moments is also tabulated in Table 7.
The computations of x, e and q based on moments of the TSDHPT
design forces and measured forces, as well as the measured footing
pressure distribution are given in Table 8. Significant differences
among the x and e values were obtained. The TSDHPT values are consis
tent with the assumed granular backfill and design standard from which
the test wall was constructed. The x and e values based on the moments
of the measured forces are consistent with current design procedures
and show a need to 'redesign the footing width. These values indicate
108
TABLE 7. - Moments About Base of Heel
(1 kip/ft = 14.6 kN/m, 1 ft = 0.305m, 1 ki~tft = 4.45 kN~m)
Force Moment Moment Symbol kip/foot Arm kip-foot/foot
TSDHPT Measured Feet TSDHPT Measured
W1 2. 10 2.10 4.63 10. 14 10. 14
W2 0.65 0.65 5.55 3.61 3.61
W3 1.69 1.69 4.50 7.61 7.61
W4 0.45 0.50 7.50 3.38 3.75
W5 6.97 7.76 2. 17 15. 12 16.84
LL 1.00 0 2. 17 2. 17 0
Phs 1.22 0 7.63 9.30 0
Ph 4.65 16.43 5.08/6.41 23.64 105.32
Ptoe 0 1.77 0.63 0 -1. 12
Pkey 0 1.33 0.67 0 0.89
S 5.87 13.33 0/1.33 0 17.33
V 12.86 12.70 x -12.86x -12.70x
TSDHPT Measured Sum of Moments
74.97 - 12.86x 164.77 - 12.70x
109
TABLE 8. - Footing Pressure Calculations
(1 ft = 0.305 m, 1 ksf = 47.9 kPa)
x Measured Calculations: x, e, q Pressure Distribution
e Fig. 39
t-> q TSDHPT (moments) Measured (moments) t-> a
x, feet 74.97/12.86 = 5.83 164.77/12.70 = 12.97 Centroid Area = 4.77
e, feet 5.83- 4.50 = 1.33 12.97- 4.50 = 8.47 4.77-4.50 = 0.27
qmax, ksf 12.86 [1 + 6(1.33)] = 2.70 9.0 . 9.0 NA 10. 1/6. 94 = 1. 46
qmin, ksf 12.86 II + 6 (1 .33) ] = O. 16 9.0 9.0 NA 7.0/6.94 = 1.01

that the point of application of V is beyond the toe of the footing!
Current design procedures would require the heel projection to be
extended 6.0 ft (1.83 m) in order to reduce the eccentricity to a value
of B/6 or less. The increased heel extension cited above is of the
same order of magnitude that would be required if the design had been
based on a clay backfill as was used in construction. The anomalous
values of x and e based on the measured footing pressure distribution
deserve special attention. These values indicate that the point of
application of V is near the center of the footing despite the large
lateral forces. This condition cannot be explained by current design
procedures, which infers significant design parameters are neglected.
Respective maximum and minimum footing pressures also differ. The
TSDHPT values agree with the assumptions made in the TSDHPT design
standard. The pressure distribution is nearly triangular. The pres
sure distributions cannot be obtained for the measured forces using Eq.
8, as this equation only applies if e is less than or equal to B/6.
This condition indicates an extremely large contact pressure of the
toe, and tensile values over a significant portion of the base of the
footing. The measured footing pressure distribution is nearly uniform
as shown in Fig. 39. The computations shown in Table 8 for the
measured footing pressure distribution are simply the conversion of
units of the measured maximum and minimum pressures. The Table 8
values can also be obtained using Eq. 8 for this case.
Stability.- A satisfactory design is achieved if the resisting
lateral forces exceed those which tend to translate the wall horizon
tally, the bearing capacity is not exceeded and the tendency to
111

overturn is resisted. Safety factors are applied to ensure that the
wall will remain stable. The conventional safety factor definition is
the ratio of factors which cause stability to factors which cause
instabil ity.
Sliding is resisted by the lateral forces on the toe side of the
wall and the maximum shear force that can develop within the foundation
soil or along the base of the footing. The maximum shear force that
can develop in the clay foundation soil, Smax, can be estimated
by
Smax = C u L • • • • • • • • • • • • • • • • • • • • • • • • • •• ( 14 )
in which Cu = the undrained shear strength and L = the length of the
slip surface. The minimum value of L is the footing width B while the
measured value of Cu is 3.17 ksf (152 kPa). The evaluation of the
safety factor against sliding is given in Table 9. The length of the
slip surface used in the computations is 9.0 ft (2.74 m) even though a
slightly larger value can be justified because of the key (see Fig. 8).
The magnitudes of the lateral forces are taken from Table 6. The
computed safety factors are greater than 1.5 which is commonly used
(1,8,10,11,19,23).
The stability against bearing failure is achieved if the maximum
footing pressure imposed is less than the shear strength of the founda
tion soil. The bearing capacity is obtained using the same criteria as
that for spread footings. The ultimate bearing capacity of clay in
terms of undrained conditions can be conservatively estimated,
112
neglecting the surcharge term as, (23)
qult = 5.14 Cu • • • • • • (15)
TABLE 9. - Safety Factor Against Sliding
(1 kip/ft = 14.6 kN/m)
Lateral Force Dictrict 12 Measured kip/foot TSDHPT
Smax 3.17(9.0) = 28.53 3.17(9.0) = 28.53
Ptoe 0 1.77
Pkey 0 1.33
Sum, (resist) 28.53 31.63
Phs 1.22 0
Ph 4.65 16.43
Pkey 0 * Sum (cause) 5.87 16.43
Safety Factor 28.53/5.87 = 4.86 31.63/16.43 = 1.93
* - Not measured
The evaluation of the safety factor against bearing failure is given
in Table 10. The calculated safety factors against bearing failure
are much greater than 3.0 which is typically specified for clay
foundation soils (1,8). The measured settlement at the face of the
stem was only 0.41 in. (10 mm) which is tolerable. Excessive
settlement is not expected for preconsolidated clays.
113

TABLE 10.- Safety Factor Against Bearing Failure (1 ksf = 47.9 kPa)
Soil Pressure TSDHPT Measured ksf
qmax 2.70 1.46
qult 5. 14(3. 17) = 16.29
Safety Factor 16.29/2.70 = 6.0 16.29/1. 46 = 11.2
There are two commonly used methods for checking the stabilitity
against overturning as described previously. In one method, the wall
is considered stable if the eccentricity is less than B/6 (8,11,23), or
1.50 ft (0.46 m) in this case. Inspection of Table 8 reveals that the
TSDHPT design and measured footing pressure distribution satisfy this
requirement (1.33 and 0.27 are less than 1.50). The eccentricity based
on the moments of the measured forces fails this requirement (8.47 is
much greater than 1.50). The TSDHPT design is based on a granular
backfill, so it does not apply. The eccentricity based on moments of
measured forces is consistent with current design procedures and pre
dicts overturning, even though the test wall is stable as indicated by
the eccentricity of the measured footing distribution. These observa-
tions infer that the current design procedures neglect a significant
component of stability.
Many designers determine the stability against overturning by
summing moments about the base of the toe, point b in Fig. 41. Only
the forces above -the base of the foot i ng are cons i dered. The safety
113
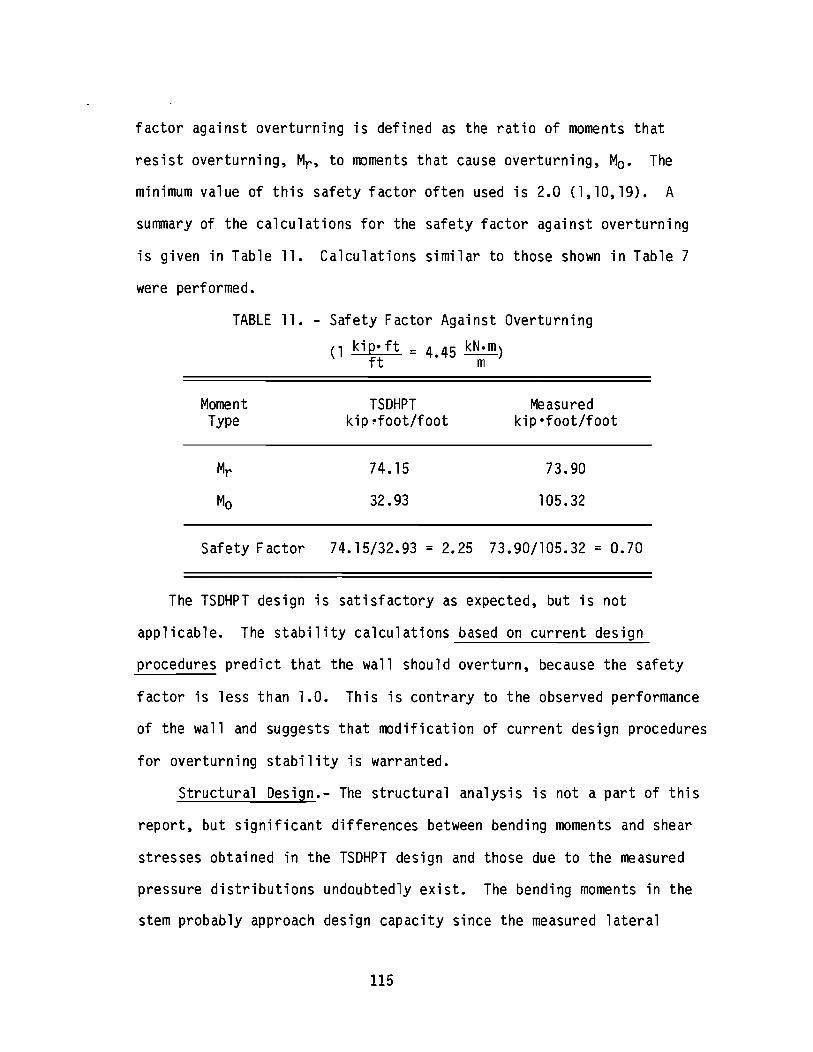
factor against overturning is defined as the ratio of moments that
resist overturning, Mr , to moments that cause overturning, Mo. The
minimum value of this safety factor often used is 2.0 (1,10,19). A
summary of the calculations for the safety factor against overturning
is given in Table 11. Calculations similar to those shown in Table 7
were performed.
TABLE 11. - Safety Factor Against Overturning
(1 kip·ft = 4.45 kN.m) ft m
Moment TSDHPT Measured Type kip~foot/foot kip·foot/foot
Mr 74.15 73.90
Mo 32.93 105.32
Safety Factor 74.15/32.93 = 2.25 73.90/105.32 = 0.70
The TSDHPT design is satisfactory as expected, but is not
applicable. The stability calculations based on current design
procedures predict that the wall should overturn, because the safety
factor is less than 1.0. This is contrary to the observed performance
of the wall and suggests that modification of current design procedures
for overturning stability is warranted.
Structural Design.- The structural analysis is not a part of this
report, but significant differences between bending moments and shear
stresses obtained in the TSDHPT design and those due to the measured
pressure distributions undoubtedly exist. The bending moments in the
stem probably approach design capacity since the measured lateral
115

pressures are about three times greater than those used in design.
Similarly, the footing is likely to be overdesigned due to the differ
ence between the design and measured pressure distributions.
Drainage.- The drainage system used in the design was presented
previously, and no measurements were made to evaluate its effective
nesss.
Construction.- The significant departures from specifications are
the use of clay as backfill and the extremely slow construction
progress. The field technician considered the sand blanket to be a
satisfactory "cushion" for the earth pressures imposed by the clay
backfill. The contractor often abandoned the project for months at a
time, thereby stalling the construction and study progress.
Analysis of Comparisons
Wall Proportions.- The wall proportions typically used in current
design procedures are generally satisfactory, based on the stability of
the test wall and cantilever walls in general. For clay foundation
soils, a logical modification in current design procedures would
involve sizing the footing width as a function of sliding stability
instead of assuming a trial width, then correcting if necessary.
Geotechnical Properties.- This field study can be used as the
basis for a rational design procedure for using clay as the backfill
material. The unit weights of the backfill and foundation soil must be
established. Also, the undrained shear strength of the foundation soil
must be determined. These soil properties are typically required in
current design procedures.
Gravity Forces.- The current procedure for calculating gravity
116
forces is satisfactory. A recommended modification is to include the
weight of the key and the weight of the foundation soil above the
bottom of the key with the gravity forces. In other words, the free
body diagram should be extended to the base of the key, especially if
lateral forces on the key are considered. Since no traffic loads were
measured in the study, the equivalent surcharge currently used is
assumed to be a satisfactory approximation.
Lateral Forces, Heel Side.- The uniform equivalent surcharge
would cause a uniform lateral pressure as used in current design pro
cedures. Compaction of the backfill in lifts causes large lateral
pressures. The measured pressure distribution can be approximated as
a trapezoid. For simplicity, the trapezoid can be broken down into a
rectangle and a triangle, where the rectangular distribution can be
conveniently described as that induced by compaction, and the triangu
lar distribution as that due to lateral earth pressure. The measured
uniform pressure was 2 psi (14 kpa). The measured coefficient of
earth pressure on the heel side of the wall, Kh, was unity for a
significant portion of the triangular pressure distribution. The
resultant force of the trapezoidal pressure distribution, as des
cribed, overestimates the measured lateral force by 15 to 20%. The
moment of the resultant force of the trapezoidal distribution is about
5% more than the moment of the measured resultant force. Therefore,
the trapezoidal pressure distribution is reasonably accurate and
conservative.
No pressure measurement was made on the heel side of the key, but
it can be approximated as the product of Kh and the vertical
117
pressure at the middepth of the key. This is consistant with the
measurement on the toe side of the key. The pressure distribution can
be assumed to be uniform.
Lateral Forces, Toe Side.- TSDHPT design procedures assume these
forces to be zero. The lateral pressure was measured at the face of
the toe of the footing only. Assuming a trapezoidal pressure dis
tribution as observed on the heel sid~, the earth pressure coefficient
on the toe side, Kt, is 3.5 based on the measured pressure.
The measured lateral pressure on the toe side of the key corre
sponds to the product of the vertical pressure at the middepth of the
key and an earth pressure coefficient of 2.5. The pressure distribu
tion can be assumed to be uniform.
Footing Pressure.- The measured pressure distribution along the
base of the footing varied approximately linearly as assumed in the
conventional design. The significant difference is that the measured
distribution is more nearly uniform. Measured toe and heel pressures
are within 18% of a uniform pressure distribution. The TSDHPT design
procedures yield toe and heel pressures 89% more and less than a
uniform pressure. The resultant of the measured pressure distribu
tion, V, is 13% less than the weight of the material above the foot
ing, so can be conservatively taken to be equal.
Stability.- The stability against sliding is considered to be the
most influential in proportioning the footing width for the conditions
of the field study. The lateral forces on the heel side of the wall
are likely to be overestimated, as described previously.
Settlement 'and bearing failures typically are not problems for
118
footings on preconsolidated clays.
Perhaps the most significant observation of the study is that the
test wall is stable against overturning even though the conventional
method of summing moments about the toe indicates that an unstable
condition exists. This can be explained by evaluating the basic
assumptions inherent with this method. The structure and the soil
above the footing are assumed to rotate rigidly about the toe, much
like tipping over a refrigerator about its edge. This analogy is not
consistent with measured movements. The wall translated and rotated
simultaneously until the backfilling was complete and then rotated
slightly about the center of the base of the footing which indicates a
point of rotation. Also, rotation about the toe assumes a loss of
contact between the footing and the soil except at the toe. Rotation
about the center of the footing and the measured pressure distribution
indicate contact throughout the width of the footing. The resulting
deformation in the foundation soil would be resisted by the shearing
strength of the foundation soil which is interpretated as the compo
nent of stability that is neglected in current design procedures.
The resistance of the foundation soil to deform can be interpre
tated as a couple, equal and opposite vertical forces, applied at the
heel and toe of the footing; therefore the moment arm is equal to the
footing width. The couple would resist overturning and explain the
nearly uniform pressure distribution observed on the base of the foot
ing and wall stability.
The magnitude of the couple must be established. It is con
ceivable that rotation about the center of the base of the footing, as
119

observed, would develop a semicircular slip surface through the
foundation soil with a radius of B/2. The resultant force along this
slip surface, F, would be expressed as
T1TB F = -2- ......•........•.......•... . (16)
in which T = the average shear stress along the slip surface required
for equilibrium. The moment arm of F is B/2. These concepts are
illustrated in Fig. 42.
Structural Design.- The structural components of the cantilever
retaining wall should be designed based on the pressure distributions
measured in the study. Wall proportions will be essentially un-
changed, but significant reinforcing steel requirements are expected.
Drainage.- The effectiveness of the drainage system was not
quantitatively evaluated. Water was often observed dripping from the
weep holes and no significant change in total pressure was measured
for a particular backfill height which indicates that hydrostatic
pressures did not build up behind the wall.
Construction.- The use of clay backfill was accepted by the
TSDHPT field technician, but not anticipated by the design engineer.
This situation is likely to be common in practice. The construction
delays were inexcusable. Action should be taken to ensure that it is
not economically prudent to habitually exceed contract time schedules.
120
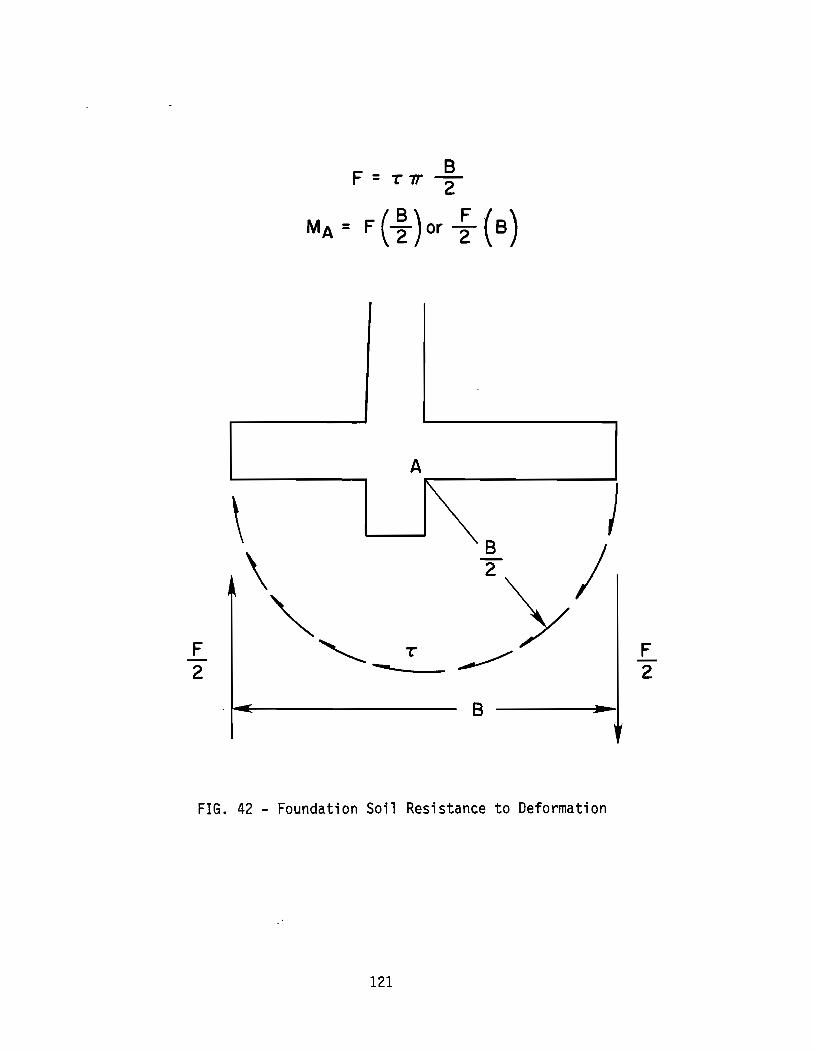
F 2
\ \
"
A
~
"- " ------B
FIG. 42 - Foundation Soil Resistance to Deformation
121
/
F 2

PROPOSED DESIGN PROCEDURES
Application
The following design procedures are based on the results from
this full scale field performance study of a typical cantilever re
taining wall. The design procedures are a modification of the cur
rently used procedures so that calculated values will correspond with
those measured in this study.
In particular, the proposed design procedures will apply to
cantilever walls founded on a preconsolidated clay with horizontal
clay backfill. The concepts are general and can be extended to
various soil conditions if appropriate adjustments are made based on
current knowledge and further verification from field studies.
Wall Proportions
The proportions of the proposed wall section are given in Fig.
43 and much of the following discussion will relate to this figure.
A cross section one unit wide is used in the proposed design
procedure.
Wall Height.- The wall height is a function of the particular
site requirements. The design height, H, is the vertical distance
between the bottom of the footing and the top of the stem. The bottom
of the footing on the toe side should have about 3 ft (0.91 m) of
cover for protection (1), therefore, the total height of the wall is
the sum of the required difference in elevation between the surfaces
on the heel and toe sides and 3 ft (0.91 m). The proposed design is
considered appropriate for design heights up to 20 ft (6.10 m).
122

--'1 r- 1.00 ft r---
0.04
1.00 I
* 1.00 f t. min. B 2 - -'-~--
t 0.1 H*
f 0.1 H*
~-------------------B
FIG. 43 - Proposed Wall Proportions (1 ft = 0.305 m)
123
H
..
Stem.- The front face of the stem should be battered to give the
illusion that the walls remain vertical after tilting. A satisfactory
horizontal to vertical ratio is 0.04 to 1.00. The top of the stem
should be 1.00 ft (0.305 m) wide to provide an adequate opening for
placing concrete and cover for reinforcing steel.
Footing.- The footing should be attached to the stem such that
the center of the footing coincides with the back face of the stem.
The stem should be keyed into the footing. The trial thickness of the
footing should be 0.1 H but not less than 1.00 ft (0.305 m). The
footing width will be determined in the design procedures.
Key.- The key should be directly beneath the stem. This provides
a convenient point for anchoring the stem reinforcing steel. The
depth of the key should be about 0.1 H, but not less than 1.00 ft.
(0.305 m). The width of the key should be approximately the width of
the base of the stem. From a practical viewpoint, the width of the
key will probably be the width of a backhoe bucket.
Geotechnical Properties
Foundation Soil.- The proposed design assumes the wall is founded
on a deep preconsolidated clay deposit. This infers that settlement
will be negligible if the applied footing stresses are lower than the
preconsolidation pressure of the clay. This assumption can be veri
fied by performing consolidation tests on the foundation soil and then
computing the settlement based on predicted footing pressures. The
undrained shear strength of the foundation clay should be obtained by
appropriate laboratory or field testing for the short term stability
analysis. The long term stability of the wall is a function of the
124

drained shear strength of the foundation soil which may be less than
the undrained shear strength for stresses below the preconsolidation
pressure. The drained shear strength of preconsolidated clays
particularly applies to deep seated slope failures which is beyond the
scope of the proposed design procedures, but this probably is not a
significant problem based on the lack of such failures on TSDHPT
projects. The total unit weight should also be determined
accurately.
Backfill.- The total unit weight of the backfill soil is re
quired. The use of clay backfill is consistent with the field study
upon which the proposed design is based. Compaction below the maximum
dry density should be specified. This reduces the lateral pressure
induced by compaction and possible expansion of the clay. A blanket
of granular material against the back face of the stem should be
included for drainage. A granular backfill material should be used if
available, and standard compaction should be specified.
Applied Forces
The retained soil may support structural loads which should be
included in the design. Live loads, such as traffic, may be approxi
mated by an equivalent uniform surcharge. Based on current practice,
the equivalent surcharge can be considered as an additional height of
backfill, Hs.
The free body diagram for the proposed design is given in Fig.
44. Much of the following discussion explains the details of this
figure.
125
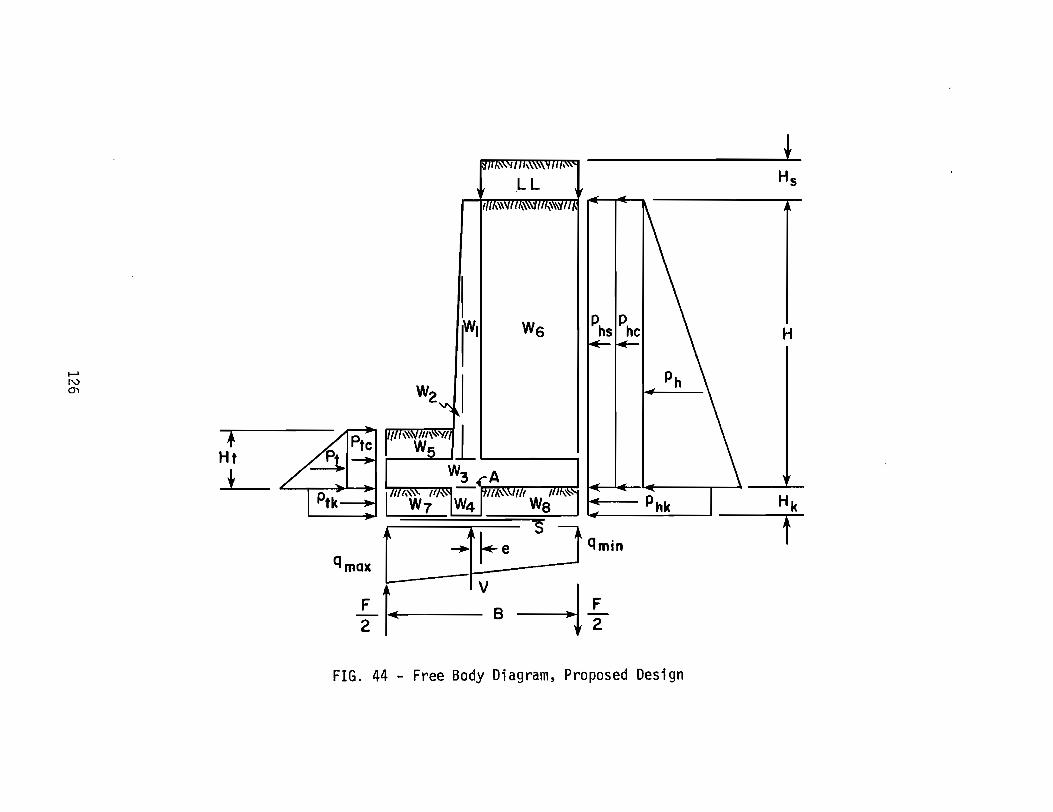
...... N 0"1
l Ht
t
IWI Ws Phs I PhC
Ph
Phk
FIG. 44 - Free Body Diagram, Proposed Design
~ Hs
H

Horizontal Equilibrium
The retaining wall must be in horizontal equilibrium, so the
horizontal forces must add to zero. The width of the footing is
determined in this portion of the design procedure.
Lateral Forces, Heel Side.- The lateral forces on the heel side
of the wall which must be evaluated are those induced by the live load
surcharge, compaction, backfill along the design height and the
foundation soil along the key. The lateral force due to the equiva
lent surcharge, Phs, is obtained by
Phs = Kh Y H s H • • • • • • • • • • • • • • • • • • • • • • • • • • (17)
in which Kh = the coefficient of earth pressure on the heel side of
the wall, Y = the unit weight of the backfill soil and H = the design
height of the wall. Kh was measured to be 1.0 in this study. Field
performance studies with granular backfill indicate Kh values equal
to or greater than the at rest coefficient of earth pressure, Ko,
(7,14,25). Recently published literature recommend the use of Ko in
lateral earth pressure computations (1,4,10). A conservative alterna
tive is to treat the structure as a nonyielding wall, since the
current construction practice of backfilling and compacting in lifts
tends to cancel the effect of wall movement (16). Earth pressure
coefficients for nonyielding walls have been published for various
types of soils and compaction methods (26). Hs is generally taken
to be 2 ft (0.61 m)(19).
The lateral-force due to compaction, as described previously, is
127

Phc = CH • • • • • • • . • • • • • . • • • • • • • • • • • • •• (18)
in which C = the lateral earth pressure induced by compaction. C was
measured to be about 0.288 ksf (13.8 kPa) in this study. A uniform
lateral pressure due to compaction is proposed by Ingold (9) for
cohesionless soils.
The lateral earth pressure on the design height causes a lateral
force of
. . . . . . . . . . . . . . . . . . . . . . . . . . . (19)
The terms in this equation have been described previously.
The lateral force on the key, Phk, can be estimated by
YfndHk Phk = Kh [Y(H + Hs) + 2 ] Hk • • • • • • • • • • • • • • •• (20)
in which Hk = the height of the key and Yfnd = the unit weight
of the foundation soil. This equation represents a uniform pressure
distribution along the face of the key with a magnitude equal to the
lateral pressure at the middepth of the key.
Lateral Force, Toe Side.- The lateral forces on the toe side of
the wall are those induced by compaction, backfill above the base of
the footing and foundation soil against the key. The lateral force
due to compaction is obtained by
128
Ptc = CHt . . . . . . . . . . . . . . . . . . . . . . . . . . . (21 )
in which Ht = the vertical distance from the base of the toe to the
ground surface.
The lateral force due to the backfill on the front of the wall
is
2 KtYHt p t = 2 .......................... ( 22 )
in which Kt = coefficient of earth pressure on the toe side of the
wall. The value of Kt measured in this study is 3.5.
Based on the measurements of this study, the lateral force on the
toe side of the key, Ptk, can be estimated as
Y H Ptk = Ktk (YHt + f~d k) Hk ••••••••••••••••••• (23)
in which Ktk was measured to be 2.5. This equation is consistent
with a uniform pressure distribution equal in magnitude to the lateral
pressure at the middepth of the key.
Horizontal 5hear.- Horizontal equilibrium is achieved by the
shear force which is developed in the foundation soil. Consider that
the shear force, 5, acts horizontally at the base of the key. For
equilibrium
5 = Phs + Phc + Ph + Phk - Ptc - Pt - Ptk • • • • • • • • • • • • (24)
129
The shear force, S, has previously been defined as the product of the
undrained shear strength of the foundation soil and the length of the
slip surface, Eq. 14. Therefore, the retaining wall will be in
horizontal equilibrium if the length of the slip surface and shear
strength of the foundation soil are sufficiently large.
Footing Width.- From Fig. 44, it can be seen that the length of
the slip surface corresponds to the footing width, B. It is desirable
to have the potential of developing a horizontal shear force that
exceeds the value of S necessary for equilibrium. This is
accomplished by using a design value, Sd, 1.5 times greater than S,
needed for equilibrium, which expressed in equation form is
Sd = 1.5 S . . . . . . . . . . . . . . . . . . . . . . . . .. ( 25 )
The footing width can then be computed as
(26)
The computed value of B should be rounded up to the nearest integral
foot for simplicity in construction and to ensure an adequate horizon-
tal slip surface length.
Stability Against Sliding.- The safety factor against sliding,
SF s, in terms of horizontal shear forces is
(27)
130
By design procedure, this ratio will exceed 1.5. It should be empha
sized that the proposed design procedure is not based on limit equi
librium, i.e., the lateral forces predicted do not correspond to
failure conditions, but maximum values observed in a field performance
study. It is probable that at failure conditions the lateral forces
on the toe side of the wall would be greater than those predicted and
the lateral forces on the heel side would be less than those pre
dicted. The safety factor obtained from Eq. 27 expresses quantita
tively an assurance that the equilibrium shear stress in the founda
tion soil (T) is less than the shear strength of the soil, cu.
Vertical Equilibrium
The vertical forces on the wall must equal zero for vertical
equilibrium. The stability against bearing failure is obtained in
this portion of the design procedure.
Gravity Forces.- The weights of the material above the bottom of
the key and the live load surcharge as shown in Fig. 44 must be ob
tained. The weight structure, Wc' is obtained by
Wc = Ycon(Al + A2 + A3 + A4) • • • • • • • • • • • • • • • • •• (28)
in which Ycon = the unit weight of concrete and Al through A4 = the
area per unit width of each of the components of the wall section.
The weight of the backfill, Wbkf is
(29)
131
and the weight of the foundation soil, Wfnd, is
Wfnd = Yfnd(A7 + AS) • • • • • • • • • • • • • • • • • • • • •• (30)
in which A5 through AS = the area per unit width of the appropriate
soil component.
The weight of the equivalent surcharge, LL, is
yH B LL = + . . . . . . . . . . . . . . . . . . . . . . . . . .. (31 )
The terms in this equation have been defined previously.
The weights of each of the components of Wc' Wbkf and Wfnd
should be computed and tabulated separately because the moment of each
gravity force will be needed in subsequent computations. The total
downward vertical force, W, is
W = Wl + W2 + W3 + W4 + W5 + W6 + W7 + Ws + LL • • • • • • • •• (32)
Forces on Base of Footing.- The forces acting on the base of the
footing include the reaction to the gravity forces, V, and the forces
which form the couple developed by the foundation soil. For vertical
force equilibrium, V is equal in magnitude to the total gravity force,
W, so
V = W • • • • . . . . . . . . . . . . . . . . . . . . . . . (33)
132

The forces forming the couple, F/2, are equal and opposite so do
not enter into the computations involving vertical force equilibrium.
Footing Pressure.- Based on the results of this study, the pres
sure distribution will decrease linearly from a maximum value,
qmax, at the toe to a minimum value, qmin, at the heel. The max
imum and minimum footing pressures are
1.lSV O.S2V qmax = Band qmin B •••••.••••••.••••• (34)
Stability Against Bearing Failure.- The maximum footing pressure
should not exceed the ultimate bearing capacity, qult, of the foun
dation soil. For clays, qult can be conservatively estimated using
Eq. 15 and repeated here as
qult = 5.14 Cu • • • • • • . . • • • • • • • • • . • . • • • •• (15)
The safety factor against bearing failure SFb is
. . . . . . . . . . . . . . . . . . . . . . . . . . . (35)
A safety factor of 3 is recommended. Excessive settlement is not
likely if the maximum footing pressure is less than the preconsolida
tion pressure of the foundation soil.
Moment Equilibrium
The moments of the forces acting on the free body diagram must
equal zero for monie'nt equi 1 ibrium. The moment arm of each of the
133
forces and the magnitude of the shear force F must be determined. The
stability against overturning is determined in this part of the design
procedure.
Moment Center.- The study results indicate that point A in Fig.
44 is near the center of rotation. This establishes a logical point
about which moments can be summed.
Moment Arms.- The forces previously computed pass through the
centroid of the corresponding area of the pressure distribution
diagram. The determination of the moment arm for those forces which
have a rectangular or triangular pressure distribution is straight-
forward. The moment arm for V is the eccentricity, e, which is
computed as
. . . . . . . . . . . . . . . . . . . . . . . . . . . (36)
where x is the distance from the heel of the footing to the point of
application of V. This is the position of the centroid of the footing
pressure distribution which is computed as follows:
. . . . . . . . . . . . . . . (37)
Couple Developed by Foundation $oil.- Rotation of the wall about
the center of the base of the footing is resisted by the shear
strength of the foundation soil. The couple developed in the founda-
tion is equal to the moment of the shear force, F, which acts on a
semicircular slip surface with radius B/2 (see Fig. 42). F was
134
previously defined by Eq. 16, and is repeated here for convenience
T1TB F = -2- . . . . . . . . . . . . . . . . . . . . . . . . . . . (16 )
in which T = the average shear stress on the semicircular slip surface
necessary to maintain moment equilibrium. The magnitude of T is un
known, but can be determined by summing moments about point A.
Moments.- The moments of the forces can be summed for those that
resist overturning, Mr , and those that cause overturning, Mo. If
an equation is written for moment equilibrium (Mr = Mo), the only
unknown will be the magnitude of T.
Stability Against Overturning.- The wall is stable against over
turning if T is less than cu' The safety factor against overturn
ing, SFo' is expressed as
SFo c u T • • • • • • • • • • • • • • • • • • • • • • • • • • • •
A safety factor of 2 is recommended.
Structural Design
(38)
The structural design of the cantilever wall should be performed
after a footing width has been determined which meets the required
safety factors for sliding, bearing failure and overturning. The
structural components are loaded with the pressure distributions
presented previously. Some modification of the wall proportions may
be indicated, such as the thickness of the footing.
135
Drainage
Drainage must be provided by any of the conventional methods.
If a sand blanket is used, a suggested minimum width is 2 ft (0.61
m) with weep holes at 5 ft (1.5 m) intervals.
Construction
The performance of the wall should be monitored during con
struction. The minimum compaction necessary to reduce settlement
and develop the required strength of clay backfill should be
specified. Lateral pressures in excess of those predicted by the
proposed design could occur if standard compaction specifications
are required because increased compactive effort will induce larger
lateral compaction pressures and expansion pressures in clay backfill.
The proposed lateral pressure computations are probably appropriate
for granular backfills if standard compaction specifications are
followed.
Example Design Problem
The preceding procedure is illustrated in the following example
problem. Consider that an earth retaining structure is required to
separate horizontal surfaces by a vertical distance of 12 ft
(3.66 m).
136

Wall Proportions
Dimensions: Refer to Fig. 43.
Design Height, H = 12.0 + 3.0 = 15.0 ft
Footing and Key Height, Hk = 0.1(15.0) = 1.50 ft
Stem Base and Key Width = 0.04(15.0-1.50) + 1.00 = 1.54 ft
Geotechnical Properties
Foundation Soil:
Shear Strength, Cu = 3 ksf
Unit Weight, Yfnd = 0.125 kcf
Backfill and Blanket Drain:
Unit Weight, Y = 0.120 kcf
Applied Forces
Equivalent Surcharge:
Surcharge Height, Hs = 2.0 ft
137
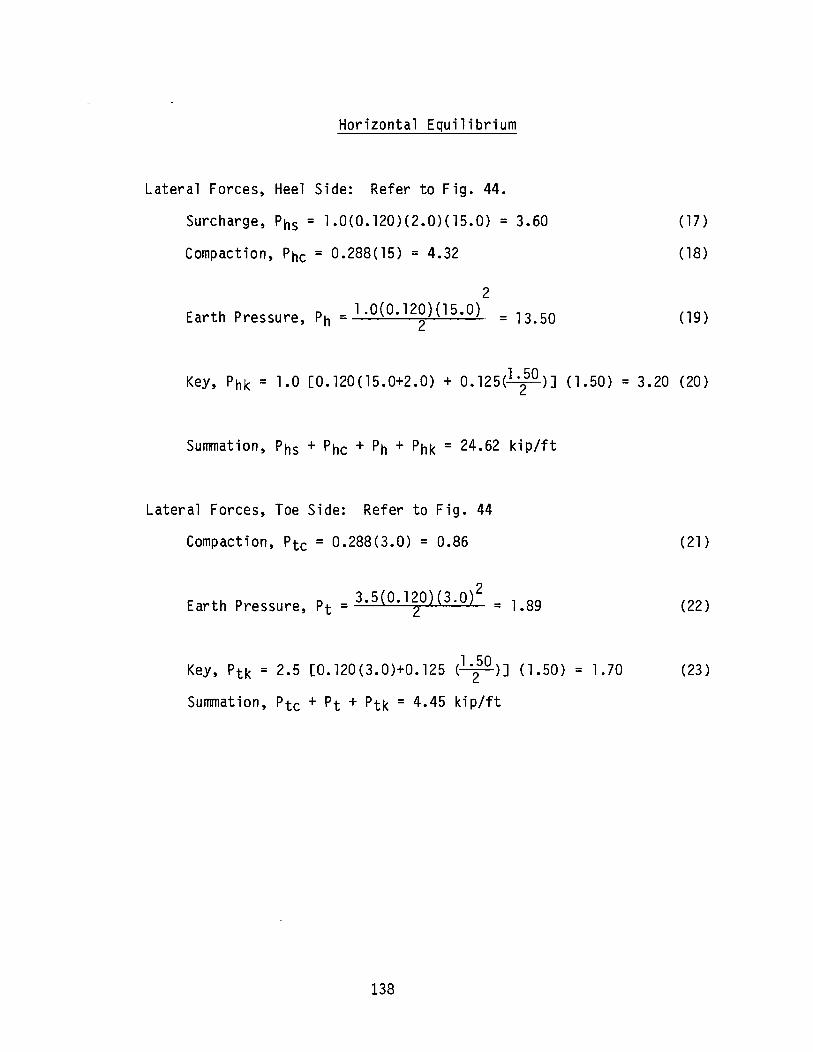
Horizontal Equilibrium
Lateral Forces, Heel Side: Refer to Fig. 44.
Surcharge, Phs = 1.0(0.120)(2.0)(15.0) = 3.60
Compaction, Phc = 0.288(15) = 4.32
2 Earth Pressure, Ph = 1.0(0.12~)(15.0) = 13.50
(17)
( 18)
(19 )
Key, Phk = 1.0 [0.120(15.0+2.0) + 0.125(1 250)J (1.50) = 3.20 (20)
Summation, Phs + Phc + Ph + Phk = 24.62 kip/ft
Lateral Forces, Toe Side: Refer to Fig. 44
Compaction, Ptc = 0.288(3.0) = 0.86 (21)
2 E th P P - 3.5(0.120)(3.0) ar ressure, t - 2 = 1.89 (22 )
Key, Ptk = 2.5 [0.120(3.0)+0.125 (1 250)J (1.50) = 1.70 (23)
Summation, Ptc + Pt + Ptk = 4.45 kip/ft
138

Horizontal Equilibrium (Con't)
Horizontal Shear:
Equilibrium Shear, S = 24.62 - 4.45 = 20.17 kip/ft (24)
Footing Width:
Design Shear, Sd = 1.5(20.17) = 30.26 kip/ft (25)
Footing Width, B = 3°326 = 10.09 ft (26)
Let B = 11.00 ft
Stability Against Sliding:
Safety Factor, SFs = 3·~~:~700) = 1.6 > 1.5 (27)
139
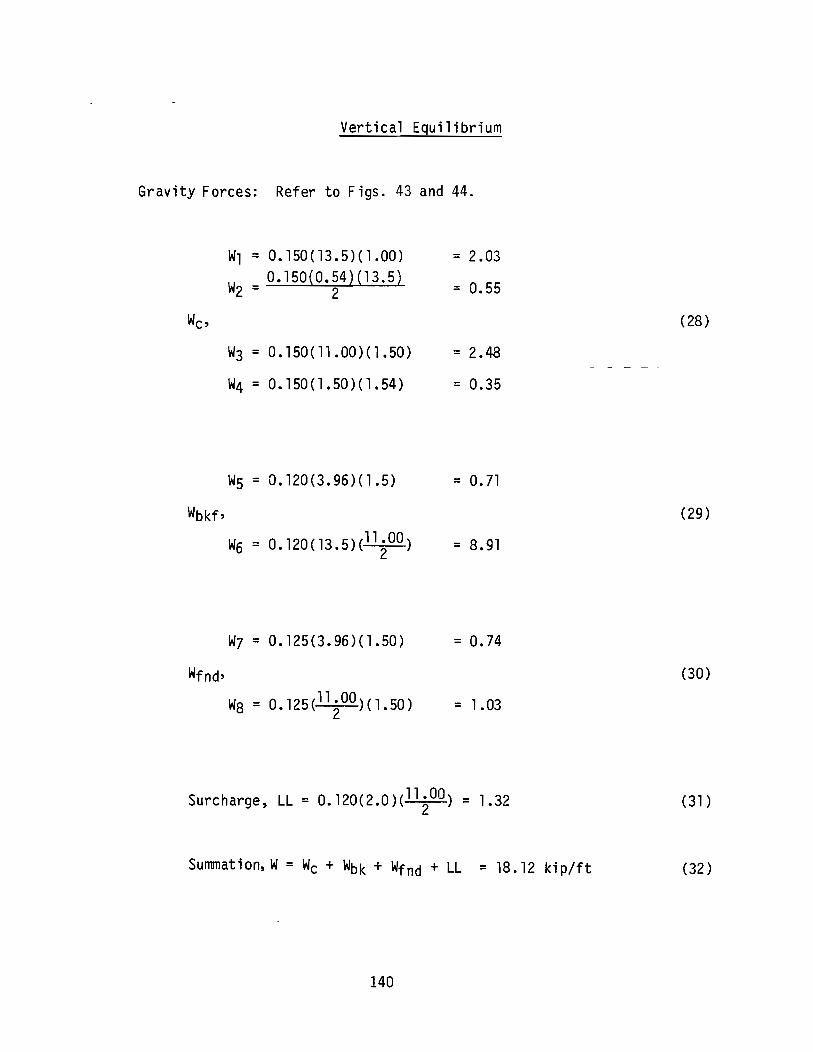
Vertical Equilibrium
Gravity Forces: Refer to Figs. 43 and 44.
Wl = 0.150(13.5)(1.00) = 2.03
W2 = 0.150{0.54)(13.5} = 0.55 2
Wc' (28)
W3 = 0.150(11.00)(1.50) = 2.48
W4 = 0.150(1.50)(1.54) = 0.35
W5 = 0.120(3.96)(1.5) = 0.71
Wbkf, (29)
W6 = O. 120 ( 13.5 )( 11 200 ) = 8.91
W7 = 0.125(3.96)(1.50) = 0.74
Wfnd' (30)
W8 = 0.125(11 200)(1.50) = 1.03
Surcharge, LL = 0.120(2.0)(11 200) = 1.32 (31)
Summation, W = Wc + Wbk + Wfnd + LL = 18. 12 kip/ft (32 )
140

Vertical Equilibrium (Con't)
Forces on Base of Footing:
Resultant, V = W = 18.12 kip/ft
Couple Forces, ~ are equal and opposite
F = TTI (11 200) = 17.28T ft
Footing Pressure:
Toe Pressure, 1.18(18.12) qmax = 11.00 = 1.94 ksf
o . 82 ( 1 8. 12) = Heel Pressure, qmin = 11.00 1.35 ksf
Stability Against Bearing Failure:
Bearing Capacity, qult = 5~14(3.0) = 15.42 ksf
15.42 Safety Factor, SFb = 1.94 = 7.95 > 3.0
141
(33)
(34)
( 15)
(35)

Moment Equilibrium
Moment Center:
Center of Base of Footing, point A Fig. 44.
Moment Arms: Refer to Fig. 44.
Point A to Centroids of Pressure Distributions
2 '.2 (1. 35)( 11. 0) + (0.5.9)( 11. 0)
2 3 _ 11 200 = 0.32 ft e = 18.12 (36)
Moments that Resist Overturning, Mr :
Phb 3.20 (1.50 ) = 2.40 2
Pte, 0.86 ( 125 ) = 0.65
Pt, 1.89 (3.0) = 1.89 3
W3, 2.48 (0) = 0
W6, 8.91 (5.50 ) 2 = 24.50
W8, 1.03 (5.50) = 2.83 2
LL, 1.32 (5.50) 2 = 3.63
V, 18.12(0.32) = 5.80
F ( 17/8 T)( 11. 00)= 95.04 2'
Summation, Mr = 41.70 ki~~ft + 95.04 T ft
142
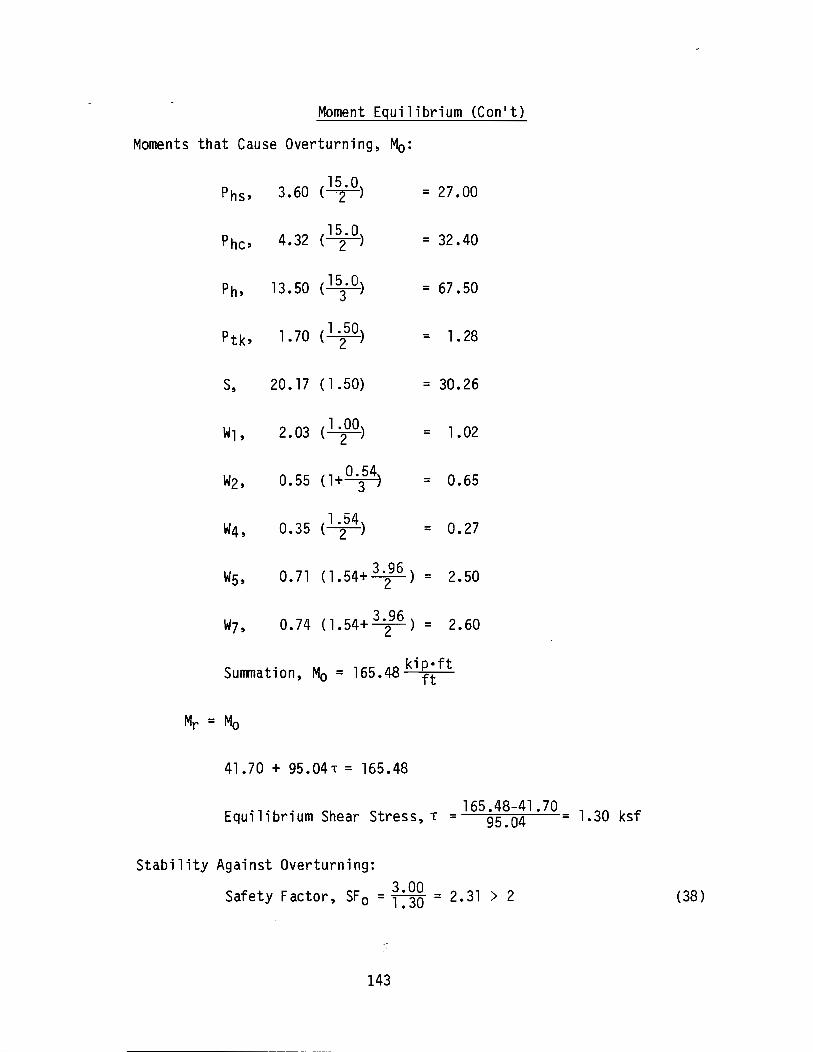
Moment Equilibrium (Can't)
Moments that Cause Overturning, Mo:
Phs, 3.60 ( 152,0) = 27.00
Phc' 4.32 ( 152, 0) = 32.40
Ph, 13.50 ( 15,0) 3 = 67.50
Ptb 1. 70 (1 '250) = 1.28
S, 20. 17 ( 1 ,50) = 30.26
Wl, 2.03 ( 1.00) 2 = 1.02
W2, 0.55 (1+ 0 '354) = 0.65
W4, 0.35 ( 1 '254) = 0.27
W5, 0.71 (1.54+ 3'i6) = 2.50
W7, 0.74 (1.54+ 3'i6) = 2.60
Summation, Mo = 165.48 ki¥~ft
41 .70 + 95.04 'r = 165.48
165.48-41.70 Equilibrium Shear Stress, T = 95.04 1.30 ksf
Stability Against Overturning:
Safety Factor, SFo = ~:~~ = 2.31 > 2 (38)
143
CONCLUSIONS AND RECOMMENDATIONS
The basic objective of this study has been met. Indicated modifi
cations in current design procedures have been proposed based on the
field performance study.
Conclusions
Measurements.- The basic measurements performed included earth
pressures, wall movement, backfill soil profiles and geotechnical
properties. Conclusions concerning these measurements are discussed
below.
The earth pressure cells used in this study had a preload reading
different from zero which was found to vary with temperature for both
field and laboratory conditions. The accuracy of the measured earth
pressures was primarily dependent upon the predicted preload pressures.
After accounting for the temperature-induced preload variation, the net
earth pressure is found to be relatively constant at a particular
backfill height and cell location.
The pressure cells were backflushed if no response to normal cell
reading procedures was observed. The effect of backflushing on cell
readings could not be definitely established.
The wall movement measurement systems yielded satisfactory
results. Construction procedures prevented horizontal and vertical
movement measurements from being made until a portion of the backfill
had been placed, so the reported movements are probably less than those
which actually occurred. The tilt measurements probably represent
actual movements "because the initial measurements were made when the
144

toe extension was covered and no backfill had been placed on the heel
extension.
Backfill soil profiles were established at each observed change in
backfill height. The geotechnical properties of the backfill and
foundation soil were obtained from laboratory testing and supplemented
with data from TSDHPT soil reports and from the project inspector.
These parameters were established to the normal standard of care and
accuracy.
Resu1ts.- The measured earth pressures on the heel side of the
test wall were greater than those predicted by current design proce
dures. This phenomenon was attributed to the construction practice of
compacting the backfill in relatively thin lifts. A lateral earth
pressure of 2 psi (14 kPa) was observed at the backfill surface and the
lateral pressure increased linearly with depth to about the natural
ground surface, then decreased from natural grade down to the heel.
The proposed design procedure considers a uniform pressure distribution
and a triangular distribution that increases linearly from the ground
surface to the base of the footing. This should conservatively over
estimate the lateral pressure on the heel side of the retaining wall.
The proposed uniform pressure is 2 psi (14 kPa) and the earth pressure
coefficient is unity; both are probably related to compactive effort.
The measured lateral pressure on the toe was about 3.5 times
greater than the pressure measured on the heel side of the stem at the
same depth. This indicates that a significant contribution to
stability is potentially available if the toe side is backfilled prior
145
L-____________________________________________ _
to backfilling the heel side of the wall. Therefore, this procedure
should be required and verified by field inspection.
The key contributed to the stability of the wall; it undoubtedly
affected the performance of the test wall, and therefore the proposed
design parameters. Use of the proposed design procedures should
predict the wall behavior more accurately if a key is included.
The measured earth pressures along the base of the footing were
more uniform than would be expected from current design procedures.
This is attributed to the foundation soil resistance to deformation.
This contribution to stability has previously been omitted but should
be considered in future designs, as proposed.
The total horizontal movement of the midpoint of the stem was
about O.007H which exceeds published movements necessary to develop the
active state of stress (26). This was not observed and is explained in
terms of current construction practice. The net movement of the stem
at any vertical position is that which occurs after the backfill is
above that position. In other words, the net movement is zero at the
backfill surface, therefore the net movement is much less than the
total movement. The earth pressures may reduce to the active state if
sufficient movement can occur after construction is complete. The wall
must be stable during construction so the at rest movement and earth
pressure conditions are more applicable than active stress conditions.
The vertical movement (settlement) and tilt were relatively small in
magnitude as expected for the stiff preconso1idated foundation soil.
The lateral earth pressures were found to be directly proportional
146
to the unit weight and height of the backfill. The undrained shear
strength of the foundation soil was used in the proposed design because
it is the appropriate strength parameter during construction and
generally is conservative.
Recommendati ons
Measurements.- The earth pressures should be measured with two
methods or types of pressure sensors in order to verify results.
Unanticipated problems would not be as likely to influence both types
of pressure sensors, or at least to the same degree. Laboratory
calibrations should be performed to determine the accuracy and response
of each cell under the environmental conditions the pressure sensors
will experience. The effects of backflushing should be investigated.
Temperature sensors should be installed adjacent to pressure sensors
that are found to be temperature dependent. Field calibrations should
be performed for those factors found to be significant in the labora
tory.
A more complete set of data would be obtained if the pressure
sensors are placed along cross sections near the ends of the test panel
as well as a section along the center line. Sensors should also be
placed on the top of the footing, front face of the stem and on the
bottom and back face of the key, in order to obtain a more complete
pressure distribution on all bearing surfaces.
The wall movement should be measured at the cross sections where
the pressure sensors are located. Direct translation measurements
should be made from points near the top and bottom of the stem at each
location. Vertica'l movements should be measured on the stem and near
147

the toe of the footing. Pads attached to the front face of the stem
for tilt measurements should be made of stainless steel. Corrosion and
distortion of the pads will be minimized because of the corrosion
resistance of this material and because the thermal properties of steel
and concrete are almost identical.
The geotechnical properties of the foundation soil and backfill
must be obtained. The backfill heights should be measured when changes
occur.
Construction Control.- The successful completion of a field per
formance study will be enhanced if the researchers have some control
over the construction procedures. The project specifications should
include penalties if the construction is not completed before the study
terminates, if the construction procedures prohibit instrumentation
installation and calibration, or if the instrumentation is damaged.
Additional Studies.- The proposed design modifications are based
on a single field performance study. The accuracy of the proposed
parameters can be improved by additional studies on walls with similar
proportions and soil conditions. The general application of the
proposed design procedures should be based on studies of walls with
different proportions and various foundation soils and types of back
fill.
148
APPENDIX I. - REFERENCES
1. Bowles, J. E., Foundation Analysis and Design, 2nd. ed., McGrawHill Book Co., New York, 1977, pp. 321-333, 374-375, 377-405.
2. Broms, B., "Lateral Earth Pressures Due to Compaction of Cohesionless Soil,1I Proceedings, Fourth Budapest Conference on Soil Mechanics, Budapest, Hungary, 1971, pp. 373-384.
3. Carder, D. R., Pocock, R. G., and Murray, R. T., "Experimental Retaining Wall Facility - Lateral Stress Measurements with Sand Backfill,1I Report 766 Transportation and Road Research Laboratory, Crowthorne, England, 1977, pp. 1-8.
4. Casagrande, L., IIComments on Conventional Design of Retaining Structures, II Journal of the Soil Mechanics and Foundations Division, ASCE, Vol 99, No. SM2, Proc. Paper 9568, February, 197~p. 181-198.
5. Corbett, D. A., Coyle, H. M., Bartoskewitz, R. E., and Milberger, L. J., IIEvaluation of Pressure Cells for Field Measurements of Lateral Earth Pressures on Retaining Walls,1I Research Report No. 169-1, Texas Transportation Institute, Texas A&M University, September, 1971.
6. Coyle, H. M., Bartoskewitz, R. E., and Milberger, L. J., "Field Measurements of Lateral Earth Pressures on a Cantilever Retaining Wall,1I Research Report No. 169-2, Texas Transportation Institute, Texas A&M University, September 1972.
7. Felio, G., IlMonitoring of a Bridge Abutment Founded on a Granular Compacted Fill," thesis presented to Carleton University, at Ottawa, Canada, in 1980, in partial fulfillment of the requirements for the degree of Master of Engineering, pp. 241-251,277-343.
8. Huntington, W. C., Earth Pressures and Retaining Walls, John Wiley and Sons, Inc., New York, 1957, pp. 1-7, 53-73, 139-142, 218-234, 283-290, 294-300, 314-320, 385, 390-393, 406-409.
9. Ingold, T. S., IIRetaining Wall Performance During Backfilling," Journal of the Geotechnical Division, ASCE, Vol. 105, No. GT5, Proc. Paper 14580, May, 1979, pp. 613-626.
10. McCarthy, D. F., Essentials of Soil Mechanics and Foundations, 2nd. ed., Reston Publishing Company, Inc., Reston, Virginia, 1982, pp. 507-519.
11. Peck, R. B., Hanson, W. E., and Thornburn, T. H., Foundation Engineering, 2nd. ed., John Wiley and Sons, Inc., New York, 1974, pp. 415-428.
149
~---------------- ----- --

12. Prescott, D. M., Coyle, H. M., and Bartoskewitz, R. E., "Field r~easurements of Lateral Earth Pressures on a Pre-Cast Panel Retaining Wall," Research Report No. 169-3, Texas Transportation Institute, Texas A&M University, September, 1973.
13. Prikryl, W., "Measurements of Earth Pressures for the Design Modification of Cantilever Retaining Walls," thesis presented to Texas A&M University, at College Station, Texas, in 1979, in partial fulfillment of the requirements for the degree of Master of Science.
14. Schulze, L. W., Coyle, H. M., and Bartoskewitz, R. L, "Field Measurements of Earth Pressure on a Cantilever Retaining Wall," Research Report No. 236-1, Texas Transportation Institute, Texas A&M Unversity, January, 1981.
15. Sims, F. A., Forrester, G. R., and Jones, C. J. F., "Lateral Earth Pressures on Retaining Walls," Journal of the Institution of Highway Engineers, England, Vol. 17, No.6, June, 1970, pp. 1930.
16. Sims, F. A., and Jones, C. J. F., "Comparison between Theoretical and Measured Earth Pressures Acting on a Large Motorway Retaining Wall," Journal of the Institute of Highway Engineers, Engl and, Vol. 21, No. 12, December, 1974, pp. 26-29.
17. Sowers, G. F., Robb, A. D., Mullis, C. H., and Glenn, A. J., "The residual Latral Earth Pressures Produced by Compacting Soi ls," Proceedings, Fourth International Conference on Soil Mechanics and Foundations Engineering, Rotterdam, Vol. 3, 1957, pp. 243-247.
18. Stiles, J. W., "Practical Aspects of Cantilever Retaining Wall Design," Highway Research Record No. 302, Washington, D. C., 1970, pp. 87-88.
19. Teng, W. C., Foundation Design, Prentice-Hall, Inc., Englewood Cliffs, New Jersey, 1962, pp. 337-341.
20. Terzaghi, K., "Old Earth Pressure Theories and New Test Results," Engineering News Record, Vol. 85, No. 14, September, 1920, pp. 632-637.
21. Terzaghi, K., IILarge Retaining Wall Tests, Part 1," Engineering News Record, Vol. 112, February, 1934, pp. 136-140.
22. Terzaghi, K., IIAFundamental Fallacy in Earth Pressure Computations," Journal of the Boston Society of Civil Engineers, April, 1936, pp. 71-88.
23. Terzaghi, K., and Peck, R. B., Soil Mechanics in Engineering Practice, 2nd. ed., John Wiley and Sons, Inc., New York, 1967, pp. 219, 361-378~
150
24. Weiler, W. A., Jr., and Ku1hawy, F. H., "Factors Affecting Stress Cell Measurements in Soil," Journal of the Geotechnical Division, ASCE, Vol. 108, No. GT12, Proc. Paper 17558, December, 1982, pp. 1529-1548.
25. Wright, W. V., Coyle, H. M., and Bartoskewitz, R. L, "New Retaining Wall Design Criteria Based on Lateral Earth Pressure Measurements." Research Report No. 169-4F, Texas Transportation Institute, Texas A&M University, August, 1975.
26. Wu, T. H., "Retaining Walls," Foundation Engineering Handbook, Winterkorn, H. F., Fang, H. Y., editors, Van Nostrand Reinhold Company, New York, 1975, pp. 402-417.
151
APPENDIX II. - NOTATION
The following symbols are used in this paper:
Ai,
Ao'
An = area per unit width of component, n, n = 1, 2, •• ;
A, B, C, D, E, = stainless steel pads;
Bi, Ci, Di,
Bo' Co, Do,
Ei = subsequent plumb line reading on pad;
Eo = original plumb line reading on pad;
B = footing width;
C = uniform 1 ateral pressure attributed to compaction;
Cu = undrained shear strength;
e = eccentricity;
F = resultant shear force on semicircle slip surface;
H = design height;
Ha = vertical distance from ground surface to base of
footing for active stress conditions;
Hk = height of key;
Hp = vertical distance from ground surface to base of
footing for passive stress conditions;
Hs = height of equivalent live load surcharge;
Ht = vertical distance from ground surface to base of
footing, toe side of wall;
Ka = coefficient of earth pressure, active state of
stress;
Kh = coefficient of earth pressure, heel side of
wall;
Khk = coefficient of earth pressure, heel side of key;
152
Ko = coefficient of earth pressure, at rest state of
stress;
Kp = coefficient of earth pressure, passive state of
stress;
Kt = coefficient of earth pressure, toe side of wall;
Ktk = coefficient of earth pressure, toe side of key;
L = length of slip surface below footing;
LL = gravity force due to uniform live load surcharge;
Mo = sum of moments that cause overturning;
Mr = sum of moments that resist overturning;
Pa = lateral force due to active earth pressure;
Ph = lateral force attributed to earth pressure, heel
side;
Phc = lateral force attributed to compaction, heel
side;
Phk = lateral force, heel side of key;
Phs = lateral force due to live load surcharge;
Pp = lateral force due to passive state of stress;
Pt = lateral force attributed to earth pressure, toe
side;
Ptc = lateral force attributed to compaction, toe
side;
Ptk = lateral force, toe side of key;
Pe = total earth pressure;
Pi = pressure cell reading;
Po = preload cell reading;
153

qmax = maximum pressure on footing base;
qmin = minimum pressure on footing base;
qult = bearing capacity of foundation soil;
R = resultant force on Coulomb/Rankine failure surface;
RE = radial distance from bracket to pad E;
S = shear force required for horizontal equilibrium;
Sd = shear force for design;
SFb = safety factor against bearing failure;
SFo = safety factor against overturning;
SFs = safety factor against sliding;
V = vertical force required for equilibrium;
W = sum of gravity forces;
Wcon = weight of retaining wall;
Wbkf = weight of backfill above footing;
Wfnd = weight of foundation soil below footing;
Wn = weight of component n, n = 1, 2, 3, ••• ,
Ww = weight of soil in assumed failure wedge;
WI = weight of soil between vertical plane and back
face of wall, Rankine theory;
x = distance from heel to point of application of V;
a = angle at base of stem between horizontal and the
backface of stem;
S = angle between horizontal and backfill surface;
Y = unit weight of backfill;
Ycon = unit weight of concrete;
Ye = unit weight of equivalent fluid;
154
Yfnd = unit weight of foundation soil;
!:::.A, !:::.B, !:::.C, !:::.D, !:::.E, = horizontal movement of pads;
!:::.P.L. = horizontal movement of plumb line;
!:::.Rd9E = change in plumb line reading at Pad E;
6 = wall friction angle;
e = ti lt angle;
T = shear stress on semicircular slip surface required
for moment equilibrium;
¢ = angle of shear resistance; and
~ = wall friction angle, Rankine condition.
155
APPENDIX III. - EARTH PRESSURE DETERMINATION
The total earth pressure, Pe, is determined by subtracting the
preload pressure, Po, from the field pressure cell reading Pi, as
described in the text. It was observed that the preload pressures and
the field pressure cell readings varied with temperature. The tempera
ture response of each cell was obtained by regression analysis of the
ten direct temperature-field pressure cell readings for each cell
obtained between February and October of 1981 as shown in Figs. 29
through 34 when there was little change in the backfill profile. The
average R-square value was 0.97 for the temperature and field pressure
cell reading relationships. A similar temperature response was assumed
to exist for the preload pressures of each cell. This assumption has
been verified by studies recently reported in the literature (7, 24).
An equation for predicting the preload pressure as a function of
temperature was derived for each cell based on the regression analysis,
measured preload pressures, and measured or predicted temperatures that
correspond to preload pressure readings. These equations along with
the pertinent field study data and computed pressures are presented in
Table 111.1 through Table 111.11. The date, elapsed time and field
cell readings are tabulated in the first three columns for each cell
that functioned throughout the duration of the study. The temperatures
prior to September of 1980 were computed as described in the text.
Since September of 1980, direct temperatures were measured adjacent to
Cells 930, 928, 927, 921 and 924 (see Fig. 13) by thermocouples. An
additional theremocouple was installed adjacent to Cell 935 on June 10,
156
1981 so direct temperature measurements were obtained since that date.
Temperatures at the remainder of the footing cells; 926, 936, 938, 922
and 937 (see Fig. 13) were obtained by interpolation. The tabulated
preload pressures were obtained by solving the equation given in the
table title. Note that some computed preload values are negative, but
the corresponding earth pressure is consistent with those with the same
backfill profile.
157
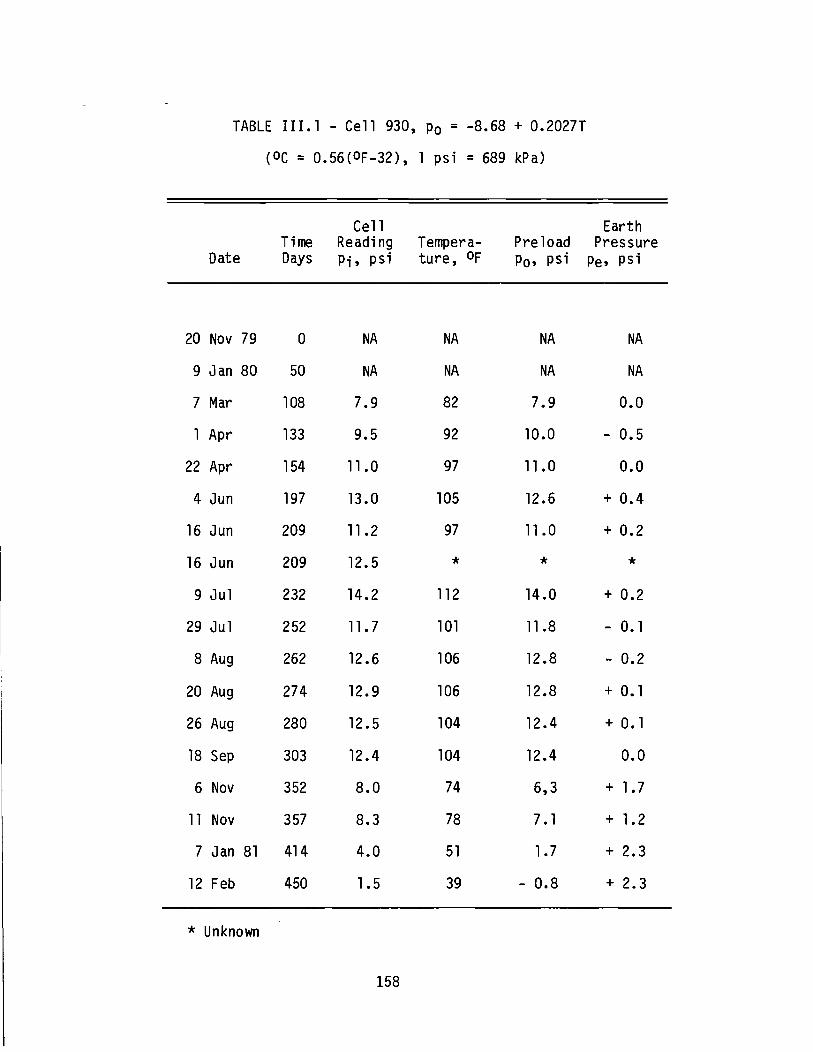
TABLE 111.1 - Cell 930, Po = -8.68 + 0.2027T
(OC = 0.56(OF-32), 1 psi = 689 kPa)
Date
20 Nov 79
9 Jan 80
7 Mar
1 Apr
22 Apr
4 Jun
16 Jun
16 Jun
9 Ju1
29 Ju1
8 Aug
20 Aug
26 Aug
18 Sep
6 Nov
11 Nov
7 Jan 81
12 Feb
* Unknown
Cell Time Reading TemperaDays Pi, psi ture, of
0 NA NA
50 NA NA
108 7.9 82
133 9.5 92
154 11.0 97
197 13.0 105
209 11.2 97
209 12.5 * 232 14.2 112
252 11.7 101
262 12.6 106
274 12.9 106
280 12.5 104
303 12.4 104
352 8.0 74
357 8.3 78
414 4.0 51
450 1.5 39
158
Earth Preload Pressure Po, psi Pe, psi
NA NA
NA NA
7.9 0.0
10.0 - 0.5
11.0 0.0
12.6 + 0.4
11.0 + 0.2
* * 14.0 + 0.2
11.8 - O. 1
12.8 - 0.2
12.8 + O. 1
12.4 + 0.1
12.4 0.0
6,3 + 1.7
7. 1 + 1.2
1.7 + 2.3
- 0.8 + 2.3
TABLE 111.1 - Continued
Cell Earth Time Readi ng Tempera- Pre load Pressure
Date Days Pi, psi ture, of Po, psi Pe' psi
12 Mar 81 478 5.6 62 3.9 + 1. 7
20 May 547 8.0 71 5.7 + 2.3
2 Jun 560 10.0 82 7.9 + 2. 1
10 Jun 568 11.4 90 9.6 + 1.8
30 Jun 588 10.4 85 8.5 + 1.9
9 Jul 597 10.7 86 8.8 + 1.9
23 Jul 611 12.5 93 10.2 + 2.3
10 Sep 660 11.0 85 8.5 + 2.5
1 Oct 681 11 .5 88 9.2 + 2.3
29 Oct 709 6.8 66 4.7 + 2. 1
6 Jan 82 778 7.5 64 4.3 + 3.2
4 Mar 835 8.4 63 4. 1 + 4.3
15 Apr 877 11.0 74 6.3 + 4.7
26 May 918 12.9 82 7.9 + 5.0
10 Jun 933 14.5 90 9.6 + 4.9
7 Ju1 960 14.8 90 9.6 + 5.2
159

TABLE III.2 - Cell 928, Po = -16.45 + 0.2697 T
(OC = 0.56(OF-32), 1 psi = 6.89 kPa)
Cell Time Readi ng Tempera- Preload
Date Days Pi, psi ture, of Po, psi
20 Nov 79 0 NA NA NA
9 Jan 80 50 NA NA NA
7 Mar 108 5.7 82 5.7
1 Apr 133 8.1 92 8.4
22 Apr 154 9.8 97 9.7
4 Jun 197 11.8 105 11.9
16 Jun 209 9.5 97 9.7
16 Jun 209 17.7 * * 9 Jul 232 14.0 112 13 .8
29 Jul 252 10.9 101 10.8
8 Aug 262 12.4 106 12. 1
20 Aug 274 12.4 106 12. 1
26 Aug 280 11.7 104 11 .6
18 Sep 303 11.6 104 11.6
6 Nov 352 4.0 72 3.0
11 Nov 357 5.5 73 3.2
7 Jan 81 414 5.5 56 - 1.3
12 Feb 450 3.6 50 - 3.0
12 Mar 478 7.9 63 0.5
* Unknown
160
Earth Pressure Pe, psi
NA
NA
0.0
- 0.3
+ 0.1
- O. 1
- 0.2
* + 0.2
+ 0.1
+ 0.3
+ 0.3
+ o. 1
0.0
1.0
2.3
6.8
6.6
7.4

TABLE III.2 - Continued
Cell Earth Time Readi n9 Tempera- Preload Pressure
Date Days Pi, psi ture, of Po, psi Pe, psi
20 May 81 547 11.9 74 3.5 8.4
2 Jun 560 13.2 82 5.4 7.8
10 Jun 568 14.0 86 6.7 7.3
30 Jun 588 13.6 86 6.7 6.9
9 Jul 597 13.2 83 5.9 7.3
23 Jul 611 14.7 90 7.8 6.9
10 Sep 660 13.0 85 6.5 6.5
1 Oct 681 13.4 85 6.5 6.9
29 Oct 709 9.4 71 2.7 6.7
6 Jan 82 778 8. 1 64 0.8 7.3
4 Mar 835 7.5 63 0.5 7.0
15 Apr 877 10.9 73 3.2 7.7
26 May 918 13.4 79 4.9 8.5
10 Jun 933 15.5 86 6.7 8.8
7 Jul 060 15.9 89 7.6 8.3
161
TABLE III.3 - Cell 927, Po = -17.63 + 0.2772T
(OC = 0.56(OF-32), 1 psi = 6.89 kPa)
Cell Earth Time Reading Tempera- Pre load Pressure
Date Days Pi, psi ture, of Po, psi Pe, psi
20 Nov 79 0 NA NA NA NA
9 Jan 80 50 NA NA NA NA
7 Mar 108 5.9 82 5.7 + 0.2
1 Apr 133 8.7 92 8.5 + 0.2
22 Apr 154 9.9 97 9.7 + 0.2
4 Jun 197 12.2 105 12. 1 + 0.1
16 Jun 209 9.7 97 9.7 0.0
16 Jun 209 15.8 * * * 9 Jul 232 13.7 112 14.0 - 0.3
29 Jul 252 11.0 101 11.0 0.0
8 Aug 262 12.3 106 12.4 - 0.1
20 Aug 274 12.5 106 12.4 + O. 1
26 Aug 280 12.0 104 11.8 + 0.2
18 Sep 303 11.8 104 11.8 0.0
6 Nov 352 5. 1 72 2.9 + 2.2
11 Nov 357 6.4 73 3.2 + 3.2
7 Jan 81 414 1.5 56 - 1.5 + 3.0
12 Feb 450 6.4 50 - 3.2 + 9.6
12 Mar 478 10.0 63 0.4 9.6
* Unknown .
162
TABLE 111.3 - Continued
Cell Earth Time Reading Tempera- Preload Pressure
Date Days Pi, psi ture, of Po, psi Pe, psi
20 May 81 547 14.6 74 3.5 11. 1
2 Jun 560 15.7 81 5.4 10.3
10 Jun 568 16.6 86 6.8 9.8
30 Jun 588 16.4 86 6.8 9.6
9 Jul 597 15.9 83 6.0 9.0
23 Jul 611 17.3 90 7.9 9.4
10 Sep 660 16.0 85 6.5 9.7
1 Oct 681 16.5 85 6.5 10.0
20 Oct 709 12.6 71 2.7 9.9
6 Jan 82 778 11.0 64 0.7 10.3
4 Mar 835 10.5 63 0.4 10. 1
15 Apr 877 13.5 73 3.2 10.3
26 May 918 15.7 79 4.9 10.8
10 Jun 933 17.4 86 6.8 10.6
7 Ju1 960 17.7 89 7.6 10.1
163

TABLE III.4 - Cell 921, Po = -28.56 + 0.3540T
(OC = 0.56(OF - 32), 1 psi = 6.89 kPa)
Cell Earth Time Reading Tempera- Pre load Pressure
Date Days Pi, psi ture, of Po, psi p, psi
20 Nov 79 0 NA NA NA NA
9 Jan 80 50 NA NA NA NA
7 Mar 108 5.4 82 0.5 4.9**
1 Apr l33 7. 1 92 4. 1 3.0**
22 Apr 154 10.0 97 5.8 4.2**
4 Jun 197 12.5 105 8.6 3.9**
16 Jun 209 8.5 97 5.8 2.7**
16 Jun 209 12.6 * * *
9 Jul 232 11.3 112 11.9 - 0.6
29 Jul 252 8.1 101 7.2 + 0.9
8 Aug 262 8.4 106 9.0 - 0.6
20 Aug 274 9.5 106 9.0 + 0.5
26 Aug 280 8.6 104 8.3 + 0.3
18 Sep 303 4.5 85 1.5 + 3.0
6 Nov 352 2.3 73 - 2.7 + 5.0
11 Nov 357 3.6 73 - 2.7 + 6.3
7 Jan 81 414 1.6 64 - 5.9 + 7.5
12 Feb 450 1.4 60 - 7.3 + 8.7
* Unknown ** Respon$e before concrete was placed
164
TABLE 111.4 - Continued
Cell Earth Time Reading Tempera- Preload Pressure
Date Days Pi, psi ture, of Po, psi Pe, psi
12 Mar 81 478 2.2 64 - 5.9 + 8. 1
20 May 547 6.5 70 - 3.8 + 10.3
2 Jun 560 7.6 78 - 0.9 + 8.5
10 Jun 568 8.7 78 - 0.9 + 9.6
30 Jun 588 9.0 79 - 0.6 + 9.6
9 Jul 597 8.2 78 - 0.9 + 9. 1
23 Jul 611 9.6 82 0.5 + 9. 1
10 Sep 660 8.9 82 0.5 + 8.4
1 Oct 681 8.6 82 0.5 + 8. 1
29 Oct 709 4.5 73 - 2.7 + 7.2
6 Jan 82 778 1.7 64 - 5.9 + 7.6
4 Mar 835 2.5 63 - 6.3 + 8.8
15 Apr 877 4.5 69 - 4. 1 + 8.6
26 May 918 7.6 75 - 2.0 + 9.6
10 Jun 933 10.0 79 - 0.6 + 10.7
7 Ju1 960 11.6 82 + 0.5 + 11. 1
165
TABLE III.5 - Cell 924, Po = -24.85 + 0.3319T
(OC = 0.56(OF - 32), 1 psi = 6.89 kPa)
Date
20 Nov 79
9 Jan 80
7 Mar
1 Apr
22 Apr
4 Jun
16 Jun
16 Jun
9 Jul
29 Jul
8 Aug
20 Aug
26 Aug
18 Sep
6 Nov
11 Nov
7 Jan 81
12 Feb
* Unknown
Cell Time Reading TemperaDays Pi, psi ture, of
0 5.8 930
50 0.0 74
108 3.6 82
133 4.2 92
154 7.6 97
197 11.0 105
209 11.9 97
209 10.9 *
232 11.9 112
252 9.0 101
262 8.3 106
274 9.5 106
280 10.6 104
303 9.7 84
352 6.1 74
357 5.8 73
414 3.8 65
450 3.6 63
** Due to-construction acti vity
166
Earth Preload Pressure Po, psi Pe, psi
6.02 - 0.2
- 0.3 + 0.3
2.4 + 1.2
5.7 - 1.5
7.3 + 0.3
10.0 + 1.0
7.3 + 4.6**
* *
12.3 - 0.4
8.7 + 0.3
9.0 - 0.7
9.0 + 0.5
9.7 + 0.8
3.0 + 6.7
- 0.3 + 6.4
- 0.6 + 6.4
- 3.3 + 7. 1
- 3.9 + 7.5
,--------- -------------
TABLE III.5 - Continued
Cell Earth Time Reading Tempera- Pre load Pressure
Date Days Pi, psi ture, of Po, psi Pe, psi
12 Mar 81 478 4. 1 64 - 3.6 + 7.7
20 May 547 6.4 69 - 1.0 + 8.3
2 Jun 560 6.9 73 - 0.6 + 7.5
10 Jun 568 7.3 75 0.0 + 7.3
30 Jun 588 8.0 75 0.0 + 8.0
9 Ju1 597 8.4 77 0.7 + 7.7
23 Ju1 611 8.5 78 1.0 + 7.5
10 Sep 660 9.7 80 1.7 + 8.0
1 Oct 681 9.5 80 1.7 + 7.8
29 Oct 709 8.9 78 1.0 + 7.9
6 Jan 82 778 5.8 69 - 1.9 + 7.7
4 Mar 835 4.5 64 - 3.6 + 8.1
15 Apr 877 5.5 69 - 1.9 + 7.4
26 May 918 6.7 72 - 1.0 + 7.7
10 Jun 933 7.4 74 - 0.3 + 7.7
7 Ju1 960 8.8 78 1.0 + 7.8
167

TABLE 111.6 - Cell 935, Po = -22.55 + 0.3418T
(OC = 0.56(OF - 32), 1 psi = 6.89 kPa)
Date
20 Nov 79
9 Jan 80
7 Mar
1 Apr
22 Apr
4 Jun
16 Jun
16 Jun
9 Jul
29 Jul
8 Aug
20 Aug
26 Aug
18 Sep
6 Nov
11 Nov
7 Jan 81
12 Feb
* Unknown
Cell Time Reading TemperaDays Pi, ps i ture, of
0 9.8 93
50 2.4 74
108 7.8 82
133 7.7 92
154 9.8 97
197 12.3 105
209 11.0 * 209 13.9 * 232 10.9 112
252 13.4 * 262 11.2 * 274 11.0 * 280 11.8 * 303 11.5 84
352 8.5 73
357 8.8 73
414 6.2 63
450 5.9 58
168
Earth Preload Pressure Po, psi Pe, psi
9.2 + 0.6
2.7 - 0.3
5.5 + 2.3
8.9 - 1.2
10.6 - 0.8
13.3 - 1.0
* *
* * 15.7 - 4.8
* *
* *
* *
* * 6.2 5.3
2.4 6. 1
2.4 6.4
- 1.0 7.2
- 2.7 8.6

TABLE 111.6 - Continued
Date
12 Mar 81
20 May
2 Jun
10 Jun
30 Jun
9 Jul
23 Jul
10 Sep
1 Oct
29 Oct
6 Jan 82
4 Mar
15 Apr
26 May
10 Jun
7 Jul
Cell Time Reading TemperaDays Pi, psi ture, of
478 7.3 62
547 10.8 69
560 12.3 77
568 11.5 78
588 12.2 77
597 12.3 77
611 12.9 78
660 14. 1 80
681 13.5 79
709 12.0 74
778 7.5 61
835 7.0 61
877 9.9 67
918 12.0 73
933 14.0 77
960 15.0 80
** Due to thermocouple installation
169
Earth Preload Pressure Po, psi Pe, psi
- 1.4 8.7
1.0 9.8
3.8 8.5
4. 1 7.4**
3.8 8.4
3.8 8.5
4. 1 8.8
4.8 9.6
4.5 9.0
2.7 9.3
- 1. 7 9.2
- 1.7 8.7
0.4 9.5
2.4 9.6
3.8 10.2
4.8 10.2

TABLE 111.7 - Cell 926, Po = -16.04 + 0.2549T
(OC = 0.56(OF - 32), 1 psi = 6.89 kPa)
Date
20 Nov 79
9 Jan 80
7 Mar
1 Apr
22 Apr
4 Jun
16 Jun
16 Jun
9 Jul
29 Jul
8 Aug
20 Aug
26 Aug
18 Sep
6 Nov
11 Nov
7 Jan 81
12 Feb
* Unknown
Cell Time Reading TemperaDays Pi, psi ture, of
0 6.1 93
50 7.0 74
108 9.5 * 133 9.0 * 154 11.0 * 197 15.8 * 209 15.7 * 209 23. 1 * 232 18.7 * 252 14.8 * 262 14.5 * 274 14.4 * 280 16.0 * 303 14.4 84
352 11.4 73
357 11 .3 73
414 9.3 63
450 9.0 59
170
Earth Preload Pressure Po, psi Pe, psi
7.7 - 1.6
2.8 4.2
* *
* *
* *
* *
* *
* *
* *
* *
* *
* *
* * 5.4 9. 1
2.6 8.8
2.6 8.7
0.0 9.3
- 1.0 10.0
Date
12 Mar 81
20 May
2 Jun
10 Jun
30 Jun
9 Ju1
23 Ju1
10 Sep
1 Oct
29 Oct
6 Jan 82
4 Mar
15 Apr
26 May
10 Jun
7 Ju1
TABLE 111.7 - Continued
Cell Time Reading TemperaDays Pi, psi ture, of
478 9.7 62
547 12.0 69
560 13.0 77
568 13.2 78
588 13.8 77
597 14.0 77
611 14.5 78
660 14.7 80
681 13.9 79
709 12.5 74
778 9.9 61
835 9.2 62
877 10.5 67
918 12. 1 73
933 12.3 77
960 14.5 80
171
Earth Preload Pressure Po, psi Pe' psi
- 0.2 9.9
1.5 10.5
3.6 9.4
3.8 9.4
3.6 10.2
3.6 10.4
3.8 10.7
4.4 10.3
4.1 9.8
2.8 9.7
- 0.5 10.4
- 0.2 9.4
1.0 9.5
2.4 9.5
3.6 9.6
4.4 10. 1

TABLE 111.8 - Cell 936, Po = -18.47 + 0.2809T
(OC = 0.56(OF - 32), 1 psi = 6.89 kPa)
Cell Earth Time Reading Tempera- Pre load Pressure
Date Days Pi, psi ture, of Po, psi Pe, psi
20 Nov 79 0 7.8 93 7.7 + 0.0
9 Jan 80 50 3. 1 74 2.3 + 0.8
7 Mar 108 13.0 * * * 1 Apr 133 11.5 * * *
22 Apr 154 13.9 * * * 4 Jun 197 16.2 * * *
16 Jun 209 12.6 * * * 16 Jun 209 16.5 * * * 9 Jul 232 21.4 * * *
29 Jul 252 10.8 * * * 8 Aug 262 11.4 * * *
20 Aug 274 12.7 * * * 26 Aug 280 15.8 * * * 18 Sep 303 13.0 84 5. 1 7.9
6 Nov 352 9.4 73 2.0 7.4
11 Nov 357 9.5 73 2.0 7.5
7 Jan 81 414 7.8 64 - 9.5 8.3
12 Feb 450 7.5 60 - 1.6 9. 1
* Unknown
172

TABLE 111.8 - Continued
Cell Earth Time Reading Tempera- Pre load Pressure
Date Days Pi, psi ture, of Po, psi Pe, psi
12 Mar 81 478 8. 1 63 - 0.8 8.9
20 May 547 10.4 69 0.9 9.5
2 Jun 560 11 .5 77 3.2 8.3
10 Jun 568 11.8 78 3.4 8.4
30 Jun 588 12.4 77 3.2 9.2
9 Jul 597 12.4 77 3.2 9.2
23 Jul 611 13.0 78 3.4 9.6
10 Sep 660 13.5 80 4.0 9.5
1 Oct 681 12.8 79 3.7 9. 1
29 Oct 709 11.0 74 2.3 8.7
6 Jan 82 778 8.6 63 - 0.8 9.4
4 Mar 835 8.0 62 - 1. 1 9. 1
15 Apr 877 9.4 68 0.6 8.8
26 May 918 11. 1 74 2.3 8.8
10 Jun 933 12.5 77 3.2 9.3
7 Jul 960 14.2 80 4.0 10.2
173
TABLE III.9 - Cell 938, Po = -15.60 + 0.2435T
(OC = 0.56(OF - 32), 1 psi = 6.89 kPa)
Date
20 Nov 79
9 Jan 80
7 Mar
1 Apr
22 Apr
4 Jun
16 Jun
16 Jun
9 Ju1
29 Ju1
8 Aug
20 Aug
26 Aug
18 Sep
6 Nov
11 Nov
7 Jan 81
12 Feb
* Unknown
Cell Time Reading TemperaDays Pi, psi ture, of
0 6.8 93
50 2.8 74
108 5.4 * 133 5.8 * 154 10.0 * 197 15.1 * 209 11.8 * 209 11.8 * 232 13.6 * 252 11 .2 * 262 11.4 * 274 11.7 * 280 12.6 * 303 11.6 84
352 8.6 73
357 8.5 73
414 6.4 64
450 6.0 60
174
Earth Preload Pressure Po, psi Pe, psi
7.0 - 0.2
2.4 0.4
* *
* *
* *
* *
* *
* *
* *
* *
* *
* *
* * 4.9 6.7
2.2 6.4
2.2 6.3
0.0 6.4
- 1.0 7.0
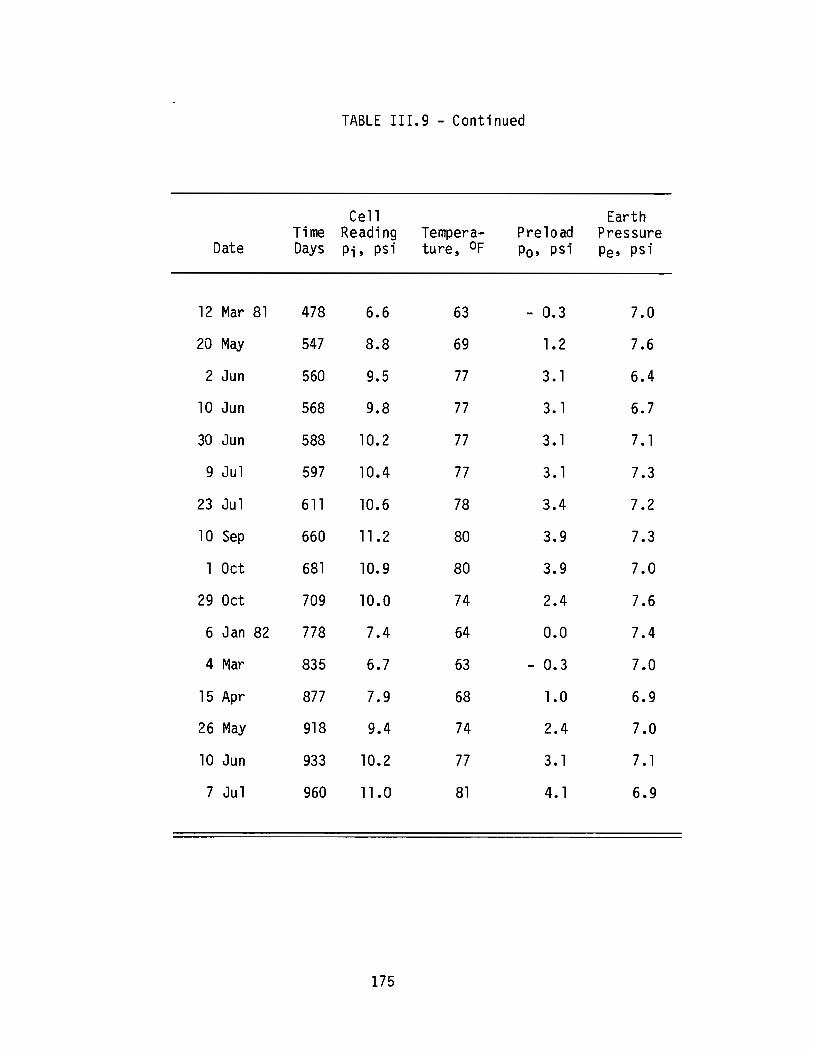
Date
12 Mar 81
20 May
2 Jun
10 Jun
30 Jun
9 Ju1
23 Jul
10 Sep
1 Oct
29 Oct
6 Jan 82
4 Mar
15 Apr
26 May
10 Jun
7 Jul
TABLE III.9 - Continued
Cell Time Reading TemperaDays Pi, psi ture, of
478 6.6 63
547 8.8 69
560 9.5 77
568 9.8 77
588 10.2 77
597 10.4 77
611 10.6 78
660 11.2 80
681 10.9 80
709 10.0 74
778 7.4 64
835 6.7 63
877 7.9 68
918 9.4 74
933 10.2 77
960 11.0 81
175
Earth Preload Pressure Po, psi Pe, psi
- 0.3 7.0
1.2 7.6
3. 1 6.4
3. 1 6.7
3. 1 7. 1
3. 1 7.3
3.4 7.2
3.9 7.3
3.9 7.0
2.4 7.6
0.0 7.4
- 0.3 7.0
1.0 6.9
2.4 7.0
3. 1 7. 1
4. 1 6.9

TABLE 111.10 - CELL 922, Po = -24.37 + 0.3445T
(OC = 0.56(OF - 32), 1 psi = 6.89 kPa)
Cell Earth Time Reading Tempera- Pre load Pressure
Date Days Pi, psi ture, of Po, psi Pe, psi
20 Nov 79 0 7.8 93 7.7 + O. 1
9 Jan 80 50 1.0 74 1.2 - 0.2
7 Mar 108 3.3 * * * 1 Apr 133 4.0 * * *
22 Apr 154 7.3 * * * 4 Jun 197 11.0 * * *
16 Jun 209 11.3 * * * 16 Jun 209 16. 1 * * * 9 Ju1 232 16.6 * * *
29 Ju1 252 10.4 * * * 8 Aug 262 10.6 * * *
20 Aug 274 11.5 * * * 26 Aug 280 13.5 * * * 18 Sep 303 11.0 84 4.6 6.4
6 Nov 352 8.0 74 1.1 6.9
11 Nov 357 7.8 73 0.8 7.0
7 Jan 81 414 5.5 64 - 2.3 7.8
12 Feb 450 5.0 62 - 3.0 8.0
* Unknown
176
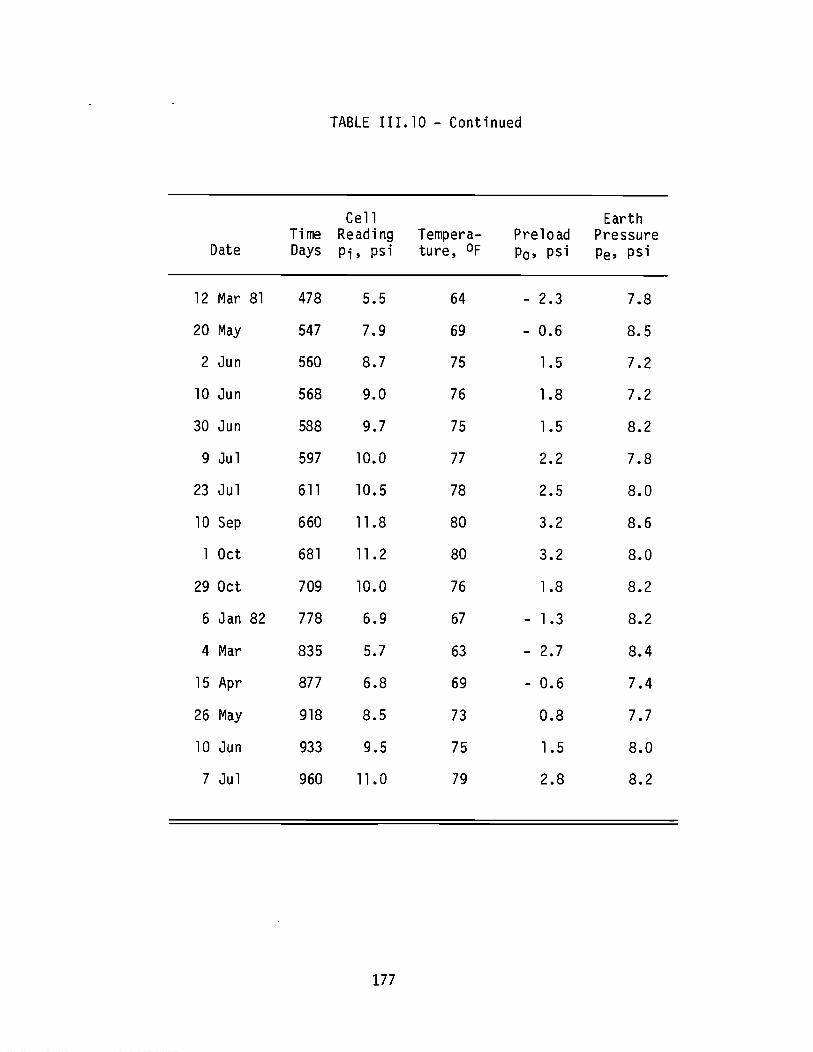
TABLE III. 10 - Continued
Cell Earth Ti me Reading Tempera- Pre load Pressure
Date Days Pi, psi ture, of Po, psi Pe, psi
12 Mar 81 478 5.5 64 - 2.3 7.8
20 May 547 7.9 69 - 0.6 8.5
2 Jun 560 8.7 75 1.5 7.2
10 Jun 568 9.0 76 1.8 7.2
30 Jun 588 9.7 75 1.5 8.2
9 Jul 597 10.0 77 2.2 7.8
23 Jul 611 10.5 78 2.5 8.0
10 Sep 660 11.8 80 3.2 8.6
1 Oct 681 11.2 80 3.2 8.0
29 Oct 709 10.0 76 1.8 8.2
6 Jan 82 778 6.9 67 - 1.3 8.2
4 Mar 835 5.7 63 - 2.7 8.4
15 Apr 877 6.8 69 - 0.6 7.4
26 May 918 8.5 73 0.8 7.7
10 Jun 933 9.5 75 1.5 8.0
7 Jul 960 11.0 79 2.8 8.2
177

TABLE 111.11 - Cell 937, Po = -20.70 + 0.3000T
(OC = 0.56(OF - 32), 1 psi = 6.89 kPa)
Cell Earth Time Reading Tempera- Pre load Pressure
Date Days Pi, psi ture, of Po, psi Pe, psi
20 Nov 79 0 7.3 93 7.2 + O. 1
9 Jan 80 50 3. 1 74 1.5 1.6
7 Mar 108 5.2 * * * 1 Apr 133 5.4 * * *
22 Apr 154 9.5 * * * 4 Jun 197 14.2 * * *
16 Jun 209 14.0 * * * 16 Jun 209 19.8 * * * 9 Jul 232 17.7 * * *
29 Jul 252 9.9 * * * 8 Aug 262 10.4 * * *
20 Aug 274 11.3 * * * 26 Aug 280 14.2 * * * 18 Sep 303 12.2 84 4.5 7.7
6 Nov 352 8.2 74 1.4 6.7
11 Nov 357 8.0 73 1.2 6.8
7 Jan 81 414 5.7 65 - 1.2 6.9
12 Feb 450 5.5 63 - 1.8 7.3
* Unknown
178
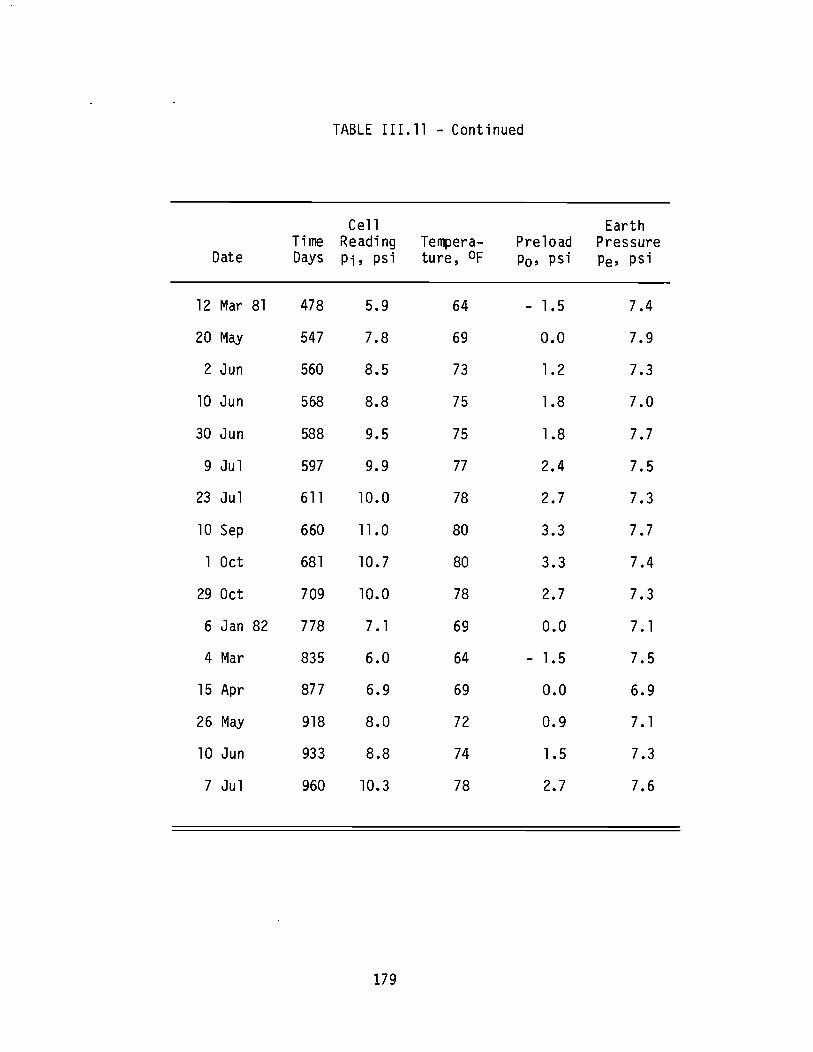
TABLE 111.11 - Continued
Cell Earth Time Readi ng Tempera- Pre load Pressure
Date Days Pi, psi ture, of Po, psi Pe, psi
12 Mar 81 478 5.9 64 - 1.5 7.4
20 May 547 7.8 69 0.0 7.9
2 Jun 560 8.5 73 1.2 7.3
10 Jun 568 8.8 75 1.8 7.0
30 Jun 588 9.5 75 1.8 7.7
9 Ju1 597 9.9 77 2.4 7.5
23 Ju1 611 10.0 78 2.7 7.3
10 Sep 660 11.0 80 3.3 7.7
1 Oct 681 10.7 80 3.3 7.4
29 Oct 709 10.0 78 2.7 7.3
6 Jan 82 778 7. 1 69 0.0 7. 1
4 Mar 835 6.0 64 - 1.5 7.5
15 Apr 877 6.9 69 0.0 6.9
26 May 918 8.0 72 0.9 7. 1
10 Jun 933 8.8 74 1.5 7.3
7 Ju1 960 10.3 78 2.7 7.6
179
