technical report no„ 3 tre electrical … electrical resistivity of cold-worked ax0mxnum singi.e...
TRANSCRIPT

Technical Report No„ 3
TRE ELECTRICAL RESISTIVITY OF COLD-WORKED AX0MXNUM SINGI.E
CRYSTAL
Author: A. Sosin
Project Supervisor: J. S. Ko«hier
Board of Trustees
University of Illinois
Urhana. Illinois
Period Covered
Feb. 1, 1953 to May 1, 1954
Contract DA-11~022-CBD-1212
Project No. TB2-000K756)

—» JM. . ••'"•jpgyyi———H •PBWP""JWW
FROM LOW CONTRAST COPY.
•MM

THIS REPORT HAS ^EEN DELIMITED
AND CLEARED FOR PUBLIC RELEASE
UNDER DOD DIRECTIVE 5200,20 AND
NO RESTRICTIONS ARE IMPOSED UPON
ITS USE AND DISCLOSURE,
DISTRIBUTION STATEMENT A
APPROVED FOR PUBLIC RELEASE;
DISTRIBUTION UNL1M!TED,
BM

••
( )
CHAPTER I
INTRODUCTION
O
A large amount of work has been devoted in recent years
to the study of imperfections in solids. Whereas a number of
physical properties have been investigated for this purpose,
the electrical resistivity has probably been more widely ex-
ploited than any other,. In a recent review article, Broom"1"
has compiled the extensive work on electrical resistivity as
well as describing other closely related work such as stored
energy and stress-strain measurements. This paper will not
attempt to restate this data; the reader is referred directly
to Broom's article. Only data immediately related to this
experiment will be discusseii,
I
i AJussa^jM^t

~SE_
C- ) CHAPTER II
PRELIMINARY DISCUSSIONS
The list of imperfections possible in a lattice is consider- 2
able. Seitz has labelled phonons, electrons and holes, excitons,
vacant lattice sites (vacancies) and interstitial atoms (inter*
stitials), foreigi atoms, and dislocations as primary imperfections
with light quanta, charged radiation and uncharged particles as
transient imperfections. Calculations have been made of the effect
of a particular imperfection on electrical resistivity.
Dislocations., The first calculation of the increase of
resf
O
tistivity due to dislocations was performed by Koehler^. The
calculation has been subsequently corrected by Mackenzie and
Sondheimer^, Landauer' Hirone and Adachi , Dexter', Saens , and a
Hunter and Nabarro . According to the later calculations, dis-
locations should scatter conduction electrons anisotropically:
there should be no additional scattering in the direction of the
dislocation axis for either edge type or screw type dislocations
whereas there will be scattering normal to this direction. For
screw dislocations, scattering normal to the dislocation axis
should be isotrcpicj for edge dislocationsf the additional resis-
tivity increase in the slip direction should be one-third that
normal to the 3lip plane. 7
Dexter has also calculated the magnitude of the reals it ivity
changes to be expected from edge dislocations. He requires on the
order of 5x10^ pairs of positive and negative dislocations per
square centimeter to account for the observed resistivity increase
in heavily cold-worked copper. This is not in good agreement with

I ( I
o
I in* I
(
r
I I I
the estimate of Koehler obtained from stored energy measurements.
Hunter and Nabarro . referring to isotroplc resistivity increases,
calculate the following changes for copper (N is the number of dis-
location lines/ cm, )
Edge d is! ocati ons -. t>j. * 0,59xl514 Hj i. r . r„~,
Screw dislocations: tAr;-» 0.l8xl0"*^f^» J\,Cr.\. M Average" : <4/- 0.39xlO"1Vv^X- CfT*
These values also require about 5 x lO1-* dislocation lines/cm.
Klemen3 has also estimated the scattering of electrons due
to stacking faults. He finds the scattering to be comparable to
that of purc dislocations.
Vacancies* Dexter"*"'' ha« calculated the increase of resis-
tance due to one atomic percent of vacancies in copper to be about
0 .13 ,4<» -f"\cru» Jongenburger*10 has criticised this calculation and
obtained a value of 1.3i>..jr\,cnu It would also be interesting to have
values for conglomerates. According to Seits , conglomerates will
scatter less than individual vacancies. 12 Interstitials. Dexter ~ has calculated the increase of re-
sistance due to one atomic percent of interstitials in copper to
be a bout- 0 »6 *\ f —cm >
Studies of the recovery of resistivity have also been made*
To interpret these data, reference can be made to the following
calculations. Huntingdon and Seitz and Huntington have found
the activation energy for movement of a single vacancy in copper to
be about 1 ev, Seitz suggested that the activation energy for a
pair of vacancies should be lower than this value: calculations of 17 Bartlett and Dienes confirm this, showing an activation energy
for a pair to be somewhat less than i ev, They also calculated the
.»^5& :s§ *p*s£ '*" s$2fs? ^'u^M-^^k^- j£., •

o
( )
p%&
4
energy required to dissociate a pair to be between 0„25 and 0.59
ev» This implies some pairing should occur. The activation energy
for motion of single interstitials was caxculatod by Hunt in gt on to
be between 0,07 ev„ and 0,24 ev» in copper. It is difficult to
define an activation energy for disiocationso
We are here most concerned with the effect of deformation on
the electrical resistivity. It is now generally accepted that work-
hardening is due to the motion and generation of dislocations and
the subsequent generation of vacancies and Interstitials as well as
the interaction of these defects. In factv it is the ultimate pur-
pose of this work to arrive at a reasonable picture of these events.
In deforming a metal to measure the resistivity, it is im-
portant to note that, unless the deformation is done at a suffic-
iently low temperature, simultaneous recovery will occur. This
was first brou ht ovt clearly by the experiments of Molen&ar and 18 Aarts , They pulled soft-annealed wires of copper, silver9 and
aluminum to about ten percent extension in a liquid nitrogen bath
(78°K), warmed to room temperature (300°K) for periods ranging
between ten minutes and eighteen hours, then pulled further in the
bath. They observed the ordinary stress-strain behavior with no
apparent effect due to the warming. However,, the resistivity,
which increased in the first loading, dropped upon warming, then
rose with further strain. They concluded that the work hardening
mechanism " is at least in part different from that producing the
change in resistivity" . 19 ( ) This work was extended by Druyvesteyn and Manintveld and
20 by Manintveld ., Wires of copper, silver and gold were strained
at 78° K, then annealed to various temperatures for 15 and 45 minute

>
irradiated ccpper with 12 Mev deuterons at ?o K. Overhauser found
a high-temperature recovery near -60 C with an activation energy
of O068 t 0o02 «Vo He also found a recovery which extended over a
5
intervals. Two recovery processes are distinguishable in this
manner. For copper, one recoTery takes place in the range of
-110° C with an activation energy of 0,20 - 0.03 ev; the other takes
place in the range of 0° C- with an activation energy of 0.88 * 0„09
ev. In a personal communication, Manirtveld states that recovery
takes place in aluminum at 78° K. The authors have suggested that
the high temperature is due to the diffusion of single vacancies
and the low temperature recovery is due to the conglomeration of
vacancies. Under the assumption of single vacancy diffusion, they
arrived at a diffusion M radius*' of about 1 micron-- a figure
usually associated with mosaic block lengths.
The above work was done on polycrystalline material., 21 f ') Blewitt, Redman, and Sherrill have deformed single crystals of
copper at 4° K, 78° K, and 300° K» They were unable to detect any
resistance changes for strains less than .25. For larger strains
at 78 K, the recoverable portion of the resistance after an hour
anneal at 300° K depended upon the amount of strain. They also
found no temperature dependence of the critical shear stress afvr
the entire temperature region; the stress-strain curve is linear.
In addition, they observed a strain--aging phenomenon in crystals
extended at 78° A. 22 Eggleston has twisted 10 mil copper wires in a liquid
helium bath (4° K). He also finds two anneals between -I4O0 C and
20° C with activation energies of O.44 * 0.06 ev and 0.67 - 0.09 ev, 23
These results should be compared with those of Overhauser who / . V. 4«>roH4at.o^ MAMI1 with "! 2 MB» danfcornns at 7£ K . Oiferhfliinor* i~r\,,nA
'.-.^•^••^•i.J^y'~^:~'::'^[ ll^iiltlPlltJ'., "'" -aiia .

.
( )
(.)
wide temperature ran^e to which he assigned an average activation
energy of Q.UU ev at about -100 C„ Furthermore, Overhauser was
able to account for the higher temperature recovery by a second-
order reaction suggesting the recombination of vacancies and inter-
stitials. One-half of the resistivity increase recovered in the
range of -185° C and -60° C; one quarter recovered between -60° C
and room temperature,, Annealing to 167 C produced only an
additional four percent recovery,
It would also be desirable to correlate the resistivity
increases with a quantity such as stress and strainc Weyerer
has found that the resistivity-extension curve saturates for load-
ing at 300° K, indicating defect production and simultaneous anneal* 25 ing seem to balance. However, van Beuren " quotes unpublished
Ai,
results of Manvn.tveld showing that A P«< £ where € is the per-
cent elongation; van Bueren is able to account for this theoreti-
cally. He proposes that Ap*Af X+B6 where h£Vl~ is the dislocati
resistance and u£ is the vacancy or interstitial resistance.
Thus he claims that the electron scattering is due entirely to
vacancies and interstitials.
Pry and Hennig2", working on copper at -195° C and annealing
at room temperature between strain increments, find that the
recoverable resistivity at each period is linearly proportional to
the unrecoverable portion, Blewitt also reports this result* This
may say that the recoverable portion is produced by the unrecover-
able portion and depends on the density of latter generators (i.e.,
vacancies and interstitials being produced by dislocations and
annealing).
From these data, it is obvious that it would be of consider-
on
4-z.y - J -

t I
("'
1 <
27
able Interest to determine more directly the mechanism of resistiv-
ity increase. Realising that, the scattering of electrons by
vacancies and interstitials, edge dislocations, screw dislocations,
stacking faults, etc. should have different symmetry properties, it
is suggested that one should look for the anisotropic behavior of
the resistivity. This is, indeed, the primary concern of the
present investigation.
Con* investigation of Shis effect has been made. Broom
and Broom and Clothier'0 measured ihe resistivity of heavily cold-
rolled strips of several metals and alloys. Using a calibrated
current flow pattern, they attempted to statistically, analyse the
resistivity for anisotropic effects. Any observed effects were
small and the longitudinal resistivity was greater than, equal to,
or smaller than the transverse resistivity, depending on the
material. Broom also tells of work of Berghout on tbln strips
deformed lightly in pure tension. Broom reports that " experimental
uncertainties were such that only general confirmation of theory
was obtained-w
The present experiment is a further attempt to observe the
anisotropic changes in resistivity. It is clear from the previous
vork and from general considerations that certain conditions had
to be fulfilled for decisive results:
1. Since recovery of resistivity occurs at • elevated"
te&^ratures, the work has been done at sufficiently low tempera-
tures to " freeze in" the defects.
2. The behavior of polycryst.illine material is probably
mdesirable for a basic understanding of defect formation because
of the inherent difficulties in analysing the results for aniso-
"rr • '

o
(
8
tropy as well as the rn;re basic complication of interaction between
crystallites of different orientation. Single crystals have been
used.
3. The method of measurement of resistance should yield
more or less direct results bearing on the question of anisotropy
(i.e., a single experiment should give the desired information
obviating the need of statistical analysis of several experiments).
4. The theoretical work for dislocation scattering has beer-
done for elastically isotropic material. Among the metals tungsten
is the best in this respect but, for experimental reasons, aluminum
ha? been used. Aluminum is only slightly poorer than tungsten and
is considerably better than copper in this respect.
5. It is desirable to work with a material which is initial-
ly electrically isotropic. This is true of cubic metalsj aluminum
is face - centered cubic.
,•'-.'•-'..•'-.v. V". ' -V** '..--. \i- • -'-•-/jjXi'^xi•'-. " -•»'• ! W-' •*&£! -

!
O CHAPTER III
EXPERIMENTAL PROCEDURE
The bulk of the experimental work was done on 99-99* percent
pure aluminum supplied by the Aluminum Corporation of America•
Principle impurities were iron, copper, and silicon with traces oi
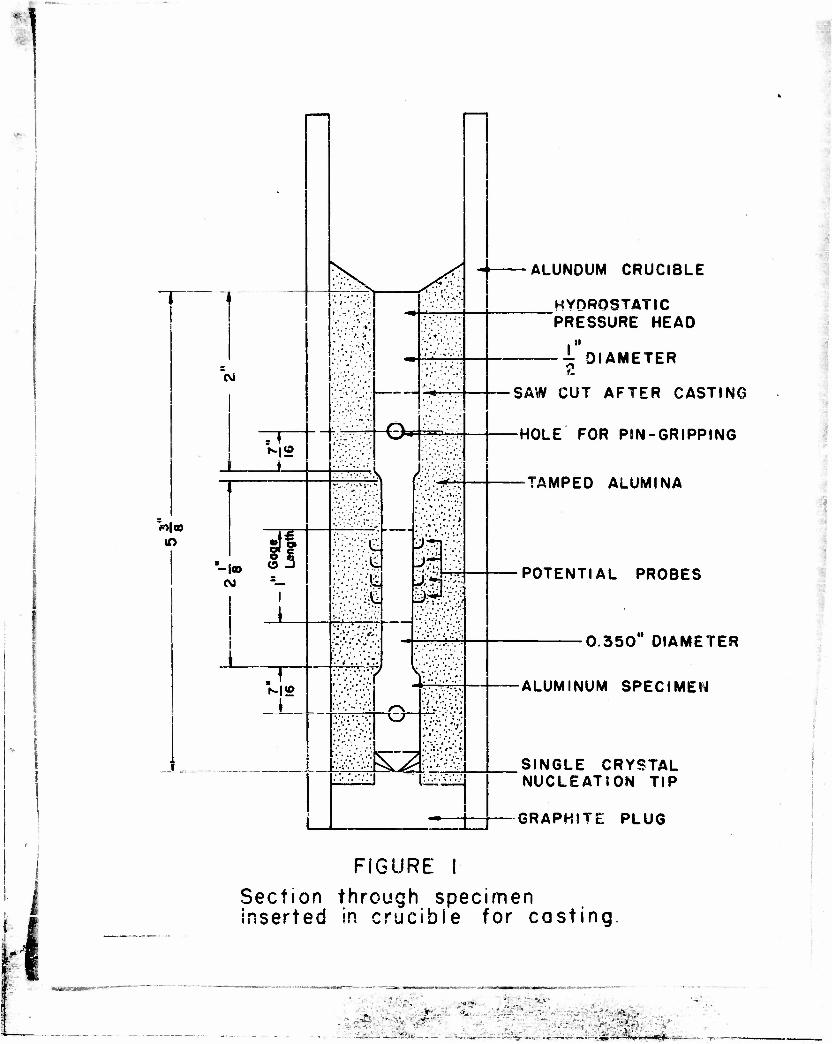
calcium and magnesium. Preparation of the samples follows a tech- 29
nique developed by Moggie . Stcck m^orial in the form of 1-2
inch round rod or square bar was ma chined to the typical shape
shown in figure lo Since the geometry of the specimen is an
important factor in the calculations, a careful machining schedule
was followed.
( 1. Aluminum stock was cut to appropriate len th, the ends
faced and center-tapped.
2. The reduced section was turned to about 0.350 inches.
3. Flat faces were milled on the unreduced end poritons,
the faces being 90 apart.
4« Setting the specimen down on its flat facej on a gauge
block and using a vernier height marker, shallow lir»es were scribed
90 apart and parallel to the specimen axis. Thus a vector drawn
i.om and normal to the specimen axis and through a scribe line
defines the normal direction for a flat face.
5. Number 21 holes were drilled in the ends normal to the
flat faces and centered on the scribe lines,
6„ Two circles approximately one inch apart and centered
{ ' on the reduced section were scribed so that the planes of the
circles were normal to the specimen axis* This defines the gauge
; s*tt
- . _>-! iiisfcisto

o
9- Pure aluminum wire, drawn to 0.01/* inch diameter, were
farced into the holes.
Following machining and a careful cleaning and etching, thei
specimen was inserted into the crucible as shown in figure 1. Using
the Bridgeman technique, single crystals were grown in a vacuum
( 2 x 10** mm of Hg.) furnace. Following the casting, the specimen
was etched* Assuming a single crystal had been obtained in tne
melt (efficiency was approximately 90 percent), the specimen was
oriented by the Laue back reflection method. Inserting the square
faces in a special holder, x-ray shots of two perpendicular faces
were taken.
The ends of the specimen were next sawed off as shown in
figure 1 with a jewelers* saw in such a manner that deformation
was limited entirely to the region of cutting. The final step
before an experimental run was a 12 hour vacuum furnace anneall>bCo\).
Pulling of the crystals was performed in a tensile machine
designed and built in the laboratory prior to the initiation of the
experiment. Basically the load is delivered to the specimen over
a fulcrum using a variable lever arm. Actually %he loading was
accomplished by electrically driving either a 50 pound or 5 pound
*»V«^t G&T away from the fulcrum* As the car traveled out applying
C i° length of the specimen.
7. Using a traveling stage microscope on a Tukon hardness
machine, four indents were made along each of the four scribe lines
and between the two circles. The first indent was 1/2 cm from a
given circle; the following indents were 1/2 cm from each other.
8. Number B0 holes (0.0135 inches) were drilled, centered
on the indents.
»««»»-£ - sa**ssaezsZ2?5g-~~£^2&-ii&

O " more load, elastic extension of the pulling system and plastic flow
of thp specimen caused the lcve:' arm to fall slightly. This acti-
vated a switch turning on a * raising" motor which raised the
fulcrum to compensate for the extensions.
The fulcrum was a carlide knife edge. One inch from this
»U($e wys another such edge, inverted from the first, A yoke swing-
in £ over this edge connect e> to a pull rod which transmitted the
load to the si«cimen. To cllow complete rotation of the specimen,
universal joints were also included in the pulling system; the
specimen was held by ginbls joints for this purpose, also. The
specimen was p in-loaded. The pull red itself was 1-4 inch diameter
o tenperature and above. For helium operations, the double Uewar
flask technique was employed, liquid nitrogen in the outer flask and
liquid helium in the irner one. To shield the liquid helium from
abov? as well, a stain .ess steel can was mounted above the helium
bath inside the inner flask. This can was filled with liquid nitro-
gen. The can was fixed to the table upon which the tensile machine
was mounted.
The specimen was connected through a gimble joint to the
eerter of a base plate, the bottom plate of a tripod arrangement.
Connecting the tripod arid the stainless steel can was a 3-16 inch
wall thickness pyrex glass sleeve. Thus, while the pull rod,
specimen, universal joints, and girables were under extension, the
tripod, glass sleeve and stainless steel can were under compression.
The function of the glass sleeve, aside from transmitting
load, was to form a buffer between the liquid helium in the inner
.
s*;.>el tube of 0.020 inch tfali thickness.
The machine was dasigned for operation at liquid helium

o
i )
12
flask and the liquid nitrogen in the stainless steel can. Similar-
ly, the pull rod was made of stainless steel because of its low
thermal conductivity. The rod passed through a central port hole
in the stainless steel can. To minimize heat leaks, the current
carrying leads were passed through one of three aeeentric port
holes in the can. The other port holes carried the potential
leads, thermocouples and the helium transfer tube.
Helium was transferred in a manner to permit maximum ex-
change in the Initial filling by passing the cold helium vapor
through the tripod to the base of the Dewar flask. To do this,the
transfer tube was gently pushed into contact with a funnel connected
to the tripod. For subsequent transfers, the transfer tube was
lifted away from the funnel. In this way, the initial helium
vapor, warm compared to the liquid below in the Dewar flask, was not
passed through the liquid. To accumulate four liters of helium in
the flask initially required approximately 7 1/2 liters.
Using either the 50 pound car or the 5 pound car offered a
total applied load of 1000 pounds or 100 poundu respectively. Full
load was applied in approximately 75 minutes. Load was directly
recorded by counters geared to t^e fine-thread (40 threads per
inch) screw drive of the loads cars. Head motion was read directly
to 10"** inches by a counter geared to the raising .cptor.
The procedure used in pulling the crystal and making measure-
ments varied with the immediate purpose of the run. Typically the
specimen was strained a given amount and resistance then measured,
the specimen strained further and resistance remeasured. This
sequence was possibly interrupted for a high temperature anneal.
These anneals were accomplished as follows. Assuming the
•.•;."<•;•«• ,-"•?.:.•!

o 13
deformation was carried out at 4° K, to warm to ?(J K one siizpiy
transferred liquid nitrogen into the inner dewar containing liquid
helium* This caused the liquid helium to boil away quickly, leaving
the dewar filled with liquid nitrogen. After a suitable period at "70 f ' o 8 K, to return to 4 K a glass tube extended from the bottom of the
* >*W&'$M&'' ^ *;.ir,-&«?l*?&^i:*&
. inner flask through a port hole in the stainless steel can, and out
the top of the flask. This tube connected to a 25 liter liquid
nitrogen storage can which in turn was connected to a vacuum fore
pump. In this manner the nitrogen was pumped cut of the dewar Into
the storage can. When all but a slight bit of nitrogen was removed
from the inner flask, liquid helium was trarsferred into the flask.
To anneal to room temperature, the Dewar system was removed
/ from about the specimen. Returning to 4° K only required the reas-
sembly and new transfer of helium.
For several specimens strained at liquid nitrogen tempera-
ture, the liquid nitrogen-room temperature range was explored by a
nitrogen vapor technique which allowed the attainment and mainten-
ance of a desired temperature to * 1° C. A similar method has been
described in the literature.
The resistance measurements were made by the IH drop method.
That is, a known current of between 15 and 22 amperes was passed
down the specimen and the drop in voltage between various sets of
probes determined. A schematic diagram of the apparatus is ebown
in figure 2. Six volt storage batteries were the source of poten-
tial. Leakage currents and heating effects vere searched for by
( ) varying'the current level but found to be absent. Total heat
dissipation in the specimen and current contacts was less than four
milliwatts,

o 1}.
To compensate for contact and thermals EMFs, reading of po-
tential drop was made with the direction of the current reversed.
The stray EMF calculated by this procedure agreed very closely with
the measured no-current potential.
Temperatures were measured by means of two topper-constantan
thermocouples placed at the ends of the specimen. Readings from
either thermocouple were reproducible in themselves although read-
ings between thermocouples were different. Preliminary calibration
showed these different, readings were apparently due to different
compositions in the thermocouples rather than different tempera-
tures: no temperature gradients were observed. -
•f •"•••• • ... ••• v , .r l . •'- --.r •-••'! 1 . r »• •J-.V.f:>: .. • .'•

!
( ^
(
CHAPTER IV
METHOD OP COMPUTATION
Before describing the methods of computation, it would be
helpful to consider the problem involved. Assume the specimen has
been given some extension. Following this extension, a current is
passed axially through the specimen and voltage readings are made
between any desired pair of potential probes. The problem is, then,
how can these measurements be interpreted in terms of the components
of electrical resistivity.
Under the usual experimental condition where one is inter-
ested only in some average value of resistivity, the analysis is
simple. Presumably the potential probes are a distant'; 1 apart
after extension and th« cross-sectional area is A. These dimensions
are related to the initial value of 1Q and AQ by the obvious rela-
tions 1 - 6 10 and A - Ac/£ 0 If V is the measured voltages and I
is the current, we would have
n EA ? A©/* 1 V A« / • 1 - I -ToT" " ? i %
In the present experiment, the situation is more complicated. r • -•
The relation A • AQ/( still holds. For two potential probes
rotated about the specimen with respect to each other, we can no
longer write 1 • €• 10. Thus one problem to consider is that of
geometry: knowing where the potential probes are with respect to
each other initially, what are the. new positions after some exten-
sion?
Furthermore, we can no longer write O » BA/l « VA/lJg since
we now are interested in all the components of the re3isitivity

\
o
o
fr
16
tensor. Instead it is necessary to make a more general calculation
of the potential distribution in the specimen. This distribution
will be some function of the components of resistivity. Having
effectively determined the distribution of potential by sufficient
voltage measurements on the specimen, we should be abla to deter*
mine these components.
Since the analysis is somewhat complicated and since a small
amount of arbitrariness is possible, the results for specimen 32
are treated in detail in the appendix.
We describe the geometry first. The description follows
that of Schmid and Boas . Two coordinate systems suggest them-
selves. These are shown in figure 3* The obvious one we may call
the laboratory system. The coordinate axes of this system are
defined by the specimen axis, taken as the sf -axis, and two other
orthogonal directions. It is convenient to choose these as the
direction of incidence of the x-ray beam when taking a Lane shot
(x'J and the third orthogonal direction (y»). With this choice of
axis, all the potential leads at the beginning of the experiment
lie either on the xf-axis or the y'-axis.
The other coordinate system chosen reflects the fact that
all of the experimental runs were made using crystals which de-
ft rated in single slip throughout the run. These coordinate axes
are the slip direct!on--the y-axls (110), the normal to the slij
plans—the s-axis (111}, and the third orthogonal direction—the MO
x-axis (112). The relationship between the two systems is shctfn
in figures 3 and 4 with the pertinent angles also indicated.
To fllow the motion of lattice points under elongation, con-
sider figure to Quantities before deformation have the subscript o;
1-W&

17
following deformation,£ . Since the deformation is a pure shear
in the direction y of a magnitude a, eac^ P. (x„* vA. zn) trans-
forms into the point f£ (x5, ys-1 zt> ) by glide in the y-direction.
Thus the transformation is
c- ~o i I 7 c" yo • a3o
^_ - z o I Also for the line elements of Pn and P we have
1o - *o • y0 + 2o x\ m \* + & * £'
Vo " Xo cos Ao 7 c. - 1 x. cos /1.<-
zQ - lc sin /XQ z im » l fe sin ^Sfr
Combining equations it follows that
2 222 2 2^ (leA0) - xe * 7fr » *fe - 10 • 2ay0z0 • a gg
1 2 o *o 1-.2
•ln^. sin % o
From the diagram it is obvious that 10 sin A 0 * 1 fr sin^V
and, since E e. » a zQ ? 1 fc sin /C^. " 1 sin /C
^ { X*- sin /t<» _ ain/C we have fc * ^p " "TTTT^ "^—5T i-0 sin /l^ »JJI (\i£
o
o ^ o
o
... .....,« -r^K.-. ,.
or (14/10) - l*2a sin^Q cos A Q • a2 3in^0 i I
Solving for a,
a * stoTE— L^1"* Slr^ °^ " cos/^o where ^ " l*A0
In a better form for computation
cos ^ cos /"I 0

i
1*
C) It has been well verified that volume is conserved in plastic flow. (
Thus we may write for the new cros3-sectional area A in terms of
the old A
This essentially concludes the problem of geometry. The
problem of finding the potential distribution may be solved an
follows:
Let X SL(ST £ or £ ~ pT
where A, is the electrical current density, £ is the electrical
field, <sr is the electrical conductivity and p is the electrical
resistivity. Since "X. and E are vectors, <s~ and p are second
rank tensors. The equation of continuity is d*^r ~X + //6t*W"
Assuming a steady state, o is not a function or time, $f/ot s ®
41so c • «. grad <b where "* is the electrical potential.
Thus div [V~ grad <^ J - 0
This is the second order differential equation to be solved. The
boundary conditions are
on the surface of the cylinder. A is the cross-sectional area of
the cylinder and JL^ is the component of current density normal to
the surface of the cylinder. I is the total current.
The differential equation for d> can be solved rigorously.
Following Maxwell, we may take <5~ to be a symmetric tensor• How-
ever, we are more particularly concerned with the values of the
principal axes of r or ." = Following Sondheimer and Mackenzie ,
we take the coordinate axes oi the slip sysceia to be the directions

*
* •
I \
i
19
of the principal axes. It deems clear from symmetry considerations
that these should be the principal axes for a system in single slip.
It is also necessary to assume ,o or C5~ are not functions of
position.
Under these assumptions and working in the slip coordinate
system, we have <T« SOL 4-<SJ £F .^_^--£ ^ ^ ^ -/% 3^
where [ * <5~ - O <^ O
\0 o <rt
The solution to the differential equation is
with |T/=(4a' where F, G, H, and K are constants.
Therefore the current density is everywhere parallel to the
specimen axis. It is obvious that this solution satisfies the
differential equation and the boundary condition.
To evaluate the constants, we see that
£x=~ 4fi m~r ~ J>»$* i etc.
Since the current density is axial,
v etc.
Finallyp since we arc only interested In differences in potential,
,•:•••' '••••>' " . ,•*'?• • .;••., • x' •..-/: -.

20
Or, in toxins of the angles used in figure 4,
^s AL/^^/V/^I C^^" *"/* **** In the remainder of the work A?/l is called the resistance R.
The sinner in which those calculation o «fe used ia shown in
the appendix where the data pertaining to specimen 32 are treated.
( I
-i_: . .....^i;=» — _-•)!</:—JtaEil!^
——yo^r—wapti!••«•«ji"" ~-*-T n'nr^..-.--.^.-

I ( CHAPTER IV
DISCUSSION OF ACCURACY
It has been stated previously that the cold-working should
be dons at a sufficiently low temperature to n freese In" all
the deformation products. It is shown here that some annealing
does occur below liquid nitrogen temperature. This is a primary
reason for extending the research to liquid helium temperature
In analysing the data, it Is implicitly assumed that 33 Matthieasen's rule is obeyed. This rule states that the resis-
tivity , p*, can be broken up into t-«o parts: a temperature -"epeadent
part, p t and a temperature independent part, p^ , the residual re-
sistivity. Furthermore the rule states that crystal defects affect
only P^ • This has been shewn to be the ease for small iwpurity
content in a pure metal.
It is generally believed that Matthiesaen-s rule is aJLso
I
obeyed for SST»1L1 deformation* There have been reports for and 34-39
against the application of the rule to cold work • However, the 40
recent work of Boas and Niehoia* seems to indicate that the rule
holds for pure materials but not for alloys. Some testing of it
was done in the present research and no clear deviations were seen.
Howevers it sssms desirable to circumvent this controversy. If
Matthieasen's rule doec not hold, phonon interaction with e?schanical
defects should be the main cause. For this reason, as well as
attempting to avoid temperature correction, the measurements have
been made at 4 &•

22
( There is also & more important reason for measuring n in
helium. If we were content to measure an average resistivity, we
could write R • /£ • y2r where 1 is the distance between potential A V
probes, A is the cross-sectional area, and V is the volume. Since •
volume is conserved,
^
-....•**• :r-.-V.^J-- •*•' •:-::.u..*j-:. •,-,-j,:.-?; -:.f..v-/ :.?.»v;.-
• ' :•=•••••••• •••*.. : ... :.••<..,., sj.*.*y;--:*l\r--\>.-?^.>*:'-?tr?'••-..
Thus an accurate determination of f, is necessary unless E>> R^*
This is only the case at 4°K. For this reason, no reproducible re-
suits were obtained of anisstrcpy for s*»«m»*«*nfc« at 78°K.
The results obtained from measurements at &°X concerning
( anisotropy are listed In Tables I-III, To illustrate the handling
of the data, a portion of the data related to specimen 32 is pre*
seated in detail in the appendix.
Since a cubic metal is initially electrically isotropic, all
combinations of potential probes should have given the same average
resistivityr This was not observed. However microscope examination
showed shifting of the leads with respaet to each other axlally.
This is presumably a combination of error in drilling and an actual
shift in melting. To minimise this error, the axial distance (A «*)
were adjusted so uhst the measured value of resistance between
probes at 0°C agreed with the adjusted211', In no cas» did the
adjustment axcsed the wire diameter.
/ , Following elongation of a specimen, the calculated new posi-
tions of the leads were compered with tho«« observed in a microscope.
(Actually the positions measured and observed were the axial com-
ponent, & a *, of the separation of two leads often not on the same
^•>. ;::&.--.

( >
23
face.) A typical sat of the data is given in Table V. The agree*
meat is certainly better than 2 o/o. Thift in Itself confirms the
accuracy of the single^elip geometry analysis since the microscope
readings involve considerable error.
The analysis of the data presents one peculiar difficulty.
It will be noted that the contribution of a resistivity component
to the actual resistance reading is weighted with an angular cosine
dependence as well as lead separation. It would have been very
desirable to place potential probes at particular positions so that I
the resistance reading gave the desired resistivity component
diraetlv. Tachnlcallv thia is «"!*• impossible. In fact, thssrst-
ically it is always impossible to fix stationarv nrohaa t© define j
the normal to the slip plane direction and, with the exception of
one unique orientation, to define the x-direction. Only the slip
direction could be permanently defined by a fixed set of stationery
probes. Thus a wra feasible arrangement was chosen.
Since current is passed axially through the specimen, it is
an unfortunate fact that eos(^xs') is always much smaller than the
other cosines. The x«diraction is always close to the horisontal
for a vertical current flow. To aggravate the matter, cos(/xs')
becomes smaller with slip. This has the effect of introducing a
large amount of error in P^ To minimise this error 6 an attempt
was made to choose orientations yielding as large a value of
eosC^xs') ee possible, as well as representing crystals which re-
mained well out of the double slip regies* o£ the unit stereographie
triangle. For this reason, cosi^/xa1) is shown for each specimen in
Tables I-III. For comparison, cos(^ys*) - cos{^ss?) 2*0.7. 1% is
easy to see %imt the results for specimen 33, which represents an

o
(
24 almost ideal orientation In these respects c are mob more consist oat
then the others in its values of P x, although not completely so
( p goes up slightly after the first anneal). The values of A
must be regarded as the most poorly determined experimental
quantity.
It is difficult to calculate the error in the aniaotropy
data. An estimate of the error in the absolute value of the resis-
tivity was made as follows. Having derived the best values of
resistivity by the methods shown in the appendix, these values are
taken and inserted back into the equation for a particular set of
leads. The equations are of the form
coa{/Lx*')Axpz * eos(£ys')Ay/y • cooUss'tasgHU
Substituting calculated values of resistivity components on the left
side allows a comparison with the measured resistance shown in the
right side* The disagreement between values serves as an excellent
Index of error since the error here is accumulated from all sources
such as inaccuracy in position of probes, x-ray orientation, strain
and resistances measurements. The errors here are about 2 to 2 1/2
o/o. This will imply different errors In the determination of the
various componentsft»r the reasons stated above* ?OJr/*y «*d />9 «&
error under 1 o/o Is implied. The errors in &x can extend to much
greater values, perhaps to 1$ o/o.*
However, the error of Interest is not in the absolute value
but In the differences of resistivity such as those before deforma-
tion and those following extension. The magnitude of the errwB If) involved in the differences -fill vary witH tltm ssgnitude of the
i difference, being largest for small differences. A fair estimate
of accuracy seems U- be about 10 o/o for strains less than 6 o/o
. ^ii«—•^,^;__

]
25 ( ) to about 5 o/o for the larger strains. This la the case tor p
hsxd p> z. In the ease of £> y the corresponding errors were 50 o/o
and 20 0/0. Cn comparing different specimens, no systematic trend
is observed from the conclusions to be drawn concerning anisotropy.
^SoJ$ i;:••''••< "•". W^M •

i f
i *
( ) CHAPTER V
EXPERIMENTAL RESULTS
•
i
1
From Tables I-III we may conclude the following: within the
gtatgd error, the changes in resistivity due to defprmtion and I i — -
strain curve is also linear. J£ p •** 45"
4» The behavior of the stress-strain evrvQ depends sharply
• '-v....,7j.t • ft
. -' :• &*&>
r .- .
annealing are isotropic. This simple statement should be regarded
ae the primary result of this research.
Besides this statement of comtr?*-te lsctropy. It is possible
to make several other more or less definite ones.
1. Referring to Table I?, we see that approximately 10 o/o
of the resistivity increase anneals between 4°K and 7$°K; of the
remainder, approximately 65 o/o meals between 78 K and 300VK.
This last anneal represents about 55 o/o of the total resistivity
change* Probably more important than these figures is the tendency
for larger annealing to occur with larger strain, although the
tendency is small.
2P The increment of resistivity is larger for specimen 31
strained at 4°K and annealed at ?8°K than for specimen 32 strained
at 7S°K despite the fact that 32 received a large:* extension than
31* This difficulty disappears, however, when the resistivity
increments are compared with the stress rather than the strains.
Here we have the expected association that the larger resistivity
increment is associated with the larger stress. 2
3« Figure 5 represents a plot of A^va* e , It Is seen
that the curve is linear. Since, as discussed below, the stress-
-*4_

o
( )
I «•
27
on tempei*ature.
a. The curve is linear in the range investigated for ex-
tensions at 4°K, as shown in figure 6. If the strained sample
is annealed to 300 K and restrained at 4°K, a distinct upper
yield point phenomenon is present. An examination of figure 7,
which is a magnification of fig-are 6 in the region of the
upper yield point, disposes that there is annealing of the
curve as well. However, the magnitude of the yield point is
so large that an additional stress above the final stress in the
first load is needed in the reloading to reinitiate plastic flow.
At first glance it would appear that there had been no annealing,
but comparing the reloading curve with the original loading curve
shows a characteristic anneals
b9 The curve is parabolic for extension at 7&WK as shown o„ _ w
in figure t,c If the sample is annealed &t. ^00 K and re
strained at 7# K, appreciable annealing occurs and a slight
yield point is observed<> No detailed examination was sade
of relative magnitudes of yield points but some idea can be
gained from the fact that yield points at 78 K went unnoticed
until the large yield point at 4°K was noted. To explore
t»he magnitudes further, head motion observations were made
and compared with self-recording measurements of applied
load* The yield phenomenon showed Itself in both eases.
These measurements confirm the relatives magnitudes stated
above.
It is also interesting to note that the yield point was
also present on specimens pulled at J6 K and given a rest

( »
•7fti&L " ....*" "'"•>T--T^-
... . . "•'-•..••.••'• 'Ai*^' • • •'• ..-ft...- --.'C .'.••.• -i ; •>"-,.-•*.&, ',',
2d
(lJ period «v 78°K. The magnitude Increased as the length of the
rest period was increased, as one would expect.
Figure 8 also shows the enhanced annealing when the spear-
men was taken to 550°K between loading at 78°K.
c. The curve is parabolic for extensions at 300°K as 1m
shove, in figure 9* Reloading after a rest period shows
annealing but no yield point is detected.
d. Specimen 34, pulled at 4°K, warmed to 7£°K and pulled
further at 78°K failed to show the yield point. Unfortunately
there is som* doubt in this result due to experimental diffi-
culties* After this specimen w»a given an additional rest
period at ~*°5\ the yield point of the usual magnitude was
observed. Warming to room temperature and straining farther
at 7&°K again showed the yield point. Warming to room tempera-
ture and pulling still further at room temperature failed to show
the yield point.
5* Considerable effort was made in an effort to observe the
temperature ranges of the resistivity anne*ls. 1\, was simple to
find the higher anneal. This was observed to occur in the range of
~100°C although the * exact*1 temperature depended on the strain (or
stress) level. Annealing was observed over the entire range from
«80°C to -120°C. beginning at lower temperatures for higher strain
levels.
6. Prompted by the statement from Msnintveid that annealing
also occurs &>r the resistivity in aluminum at liquid nitrogen
temperature, en effort was madti to observe this. Under ordinary
conditions, no such recovery was found* Believing that the process
of recovery may have been occurring too rapidly to be detected by

29
(_. our relatively slow methods, an attempt was made to load instantan-
enously and follow a possible resistivity decay* Taking resistivity
measurements after extensions of the order of 30 o/e only two min-
utes after initiating deformation and continuing for an hour or two
still failed to show this annealing. It is believed that the anneal-
ing of resistivity found between 4°K and 78°K corresponds to that of
Kanintveld although it is not simple to explain the discrepancy.
Since the basic purpose o£ this research &t» to measure
electrical resistivity, the measurements of the •trees-strain be-
havior were somewhat Incidental though considerable effort was made
in this direction also. However, it is obvious from this catalog
of observations made above that considerable more work remains to
get a truly consistent picture. Some of the observations made were
cade only once, others several times. Some measurements (such as
the behavior of a sample strained at 4°K, annealed to 76°K, and
strained further at 4°K) were not $ven made. Having shown that the
resistivity changes are isotroplc, it will be much simpler and
more economical in the future to pursue stress-strain behavior with
less of the tedious precautions required by anieotropy measurements.

I'
( CHAPTER VII
DISCUSSION OF RESULTS
The complete iaotropy of resistivity found In this research
is an unexpected result. It is impossible to fully explain this
result at the present time but we may list some possible explana-
tions.
1. The scattering of electrons by dislocations is negligible
This may be due to a loif domsity of dislocation or a low scattering
cross-section per dislocation length. The latter possibility would
confirm the calculation of magnitude given by Dexter and Hunter and
NabaxT-o. The resistivity changes are then due to interstitlals,
cuctuicies, etc.
2. The calculation of anisctropy for screw and edge com-
ponents are incorrect. This does not seem likely for, although the
numbers may be incorrect, it seess clear that r.^a>e anistfvropy is to
be expected.
5. The array cf dislocations laid down is Isotrople. This
is contrary to the Intent of the experiment since work has been
limited to the single slip region. Since there exists a distribu-
tion of dislocations lengths, one would expect some multiplication
on inactive slip planes but It is difficult to account in this nay
for the relatively large changes observed.
To make these comments more quantitative, assume that micro-
s-epic slip will start on the !#*«* slip plane when the resolved
shear stress in that plane is equal to the yield stress. Take the
critical yield stress to be ~100 ga/ss2 at 4 *, although it is
i ..It**.* ••-'.• ••i'/ * , I .-...._ - - - .:^;:^*>«--- -

i
o 31
actually higher. Referring to a standard projection of the crystal
orientation of specimen 33, it is found ths*., for the latent system,
Vi.3 (slip plane normal and specimen axis)?* 85°
Xxm (slip direction and specimen axis) — 20
But C-T (resolved) * 0T(axial) cos '•%. ccs 2 ^cr tne latent
slip plane.
J 2 c°8 A 2
considerably more than 5C0 pounds would be required to initiate dis-
location generation on the inactive plane. Furthermore, since the
calculation has been somewhat hissed towards a low estimate of the
critical stress and since no account has been taken of hardening
effect of the active slip plane* which would also raise the critical
stress for the inactive system, it seems reasonable to assume a
negligible amount of cross-slip throughout the entire experimental
run with maximum load of 750 pounds. It can be reported that no
evidence for cross-slip was evident on the surface of the specimen
after the run and even after some further extension. Also the
excellent agreement- between measured and calculated positions of
potential probes points to solely single slip since the calculations
assume this. It should be noted that ? Dercent extension was
achieved with 220 pounds applied; these measurements showed isotropy
in £>y and u z to ± 2 o/o.
In attempting to explain the behavior of the crystal in
(_' terms of particular defects, it is essential to compare the results
obtained here with past results. One of the most comforting con-
clusions that is quite clear in this way is that9 with the exception
Cos V" 2 cos ?. ? < 1/3 x 10"1
2 , 2
<? (axial) > 30 <r (resolved) ££ 4-5 x 10 lb/in 2
Since the area of the specimen is about 1/8 in , a load of
imb '

( ') 32
of the anisotropy resulta which are essentially the first obtainable,
all the results of this research on aluminum are similar to those
obtained by Blewitt and Pry and Hennig on copper* At the risk of
oversimplification, one might propose that aluminum and copper are
the * same" metal, but with shifted characteristic temperatures.
Realizing that two such metals do not provide a sufficient
test for these remarks, it is nevertheless tempting to draw the con-
elusion that the results of deformation in a metal are rather gross
distortions of the lattice. The particular electronic structure of
the metal atom and other such detailed characteristics seem to be
of lesser importance. This is, of course, in general agreement with
the concept of dislocations, vacancies and interstitials. It would
be very desirable to compare the behavior of these face-centered
cubic metals with other structures such as hexagonal metals (e.g.,
zinc).
As was stated in the preliminary discussion, the annealing
behavior in cold-worked and Irradiated copper seems to be the same
in the range of -20°C. Since dislocations are not expected to
anneal below room temperature in copper, one is tempted to Identify
this •mi sal with a defect such as vacancies. The present data seem
to fit into this picture very well. However, there is one disturb-
ing feature present. The csrresnondine annealing in aluminum re-
duces the mechanical strength. In copper, the mechanical strength o
la not annealed until about 100 C. Presumably in aluminum the two
( annealing processes are not resolved. The fact that the resistance o
recovery in aluminum occurring between -120 C and room temperature
is spread out over a range of temperature again points toward dis-
location annealing.

{ 33
It is also important to remember that the resistance changes
produced by irradiation are large. inu«i**ting that point defects are
effect IT e scatterera or that an extremely large number are produced.
Still another piece of evidence bearing on this subject is
the results of the quenching experiments of Koehler and Kauffman . A
They quenched heated gold wires from temperatures such as 600 C to
liquid nitrogen and find a substantial resistivity increase. Since
the concentration of vacancies is far gr%*v,er than that of other
point defects at high temperatures, it is hollered that they have
succeeded in quenching vacancies. Their investigation shows mobility
of vacancies at -20~C. It would be very inter 'eating to see tne
effect of these vacancies on the yield stress.
On tho basis of these remarks, it seems possible to conclude
tentatively that the -100°C anneal in aluminum corresponds to vaean-
cles and dislocations simultaneously annealing. In copper, one
would expect these to be resolved, as earlier suggested. Besls-
tivity-wise, the effect of vacancies overwhelms that of dislocation
so that the recovery appears isotropic in aluminum. It is possible •
that, if one can succeed in making an accurate investigation of
possible resistivity anisotropy at very low strain levels, the
annealing in the range of -120eC to -80°C could be resolved into
two steps. The outlook for such resolution using the methods of
this experiment are not encouraging since present accuracy and sen-
sitivity are not sufficient.
Possible sources for vacancies (and interstiti&ls) in cold-
working have been suggested and widely discussed recently^*^.
An effective source seems to be the crossing of screw dislocations.
When a moving a crew on the active* slip plane crosses a screw in
^AriftreTft«iE. «>»—

/T
i
*/
34
latent plane, a line of vacancies or interstitials should be left
behind, depending on the signs of the two dislocations.
It would be very convenient to explain the dc'*,? on the basis
o<: the following sort of model.. If it is assumed that a trail of
vacancies is left behind when an expanding Frank-Read loop crosses
a ac°.*ew dislocation, that about 1 ev. 13 required to create such a
vacancy and that the shape of the loop retains the form of a circle,
one f.mds £\p<* 6 **„ as van Beuren has calculated.
however„ there is room for criticism here. Since the screw
component of the loop is the one concerned with vacancy production,
one would expect this portion of the loop not to move as far as the
edge competent through a network of intersecting dislo .aticna. This
is in agret^ent with the recent observations of Ghsn and Pond that
slip bands i\ aluminum grow more slowly in the direction perpen-
dicular to th? active slip direction than in the slip direction.
Using thi3 ide; , one would expect the shape of the loop to resemble
an ellipse more than a circle.
Consider t\ loop with Burger's vector in the y-directions We
expect the loop tc become an ellipse with Its major axis along the
y~directior\, its m.jior axis along the x-dlrectlon. Focussing our
attention on the -art of the ellipse which is primarily screw, let
•i be the density of screw dislocations crossing the slip plane, a be
;ne atomic separation of atoms, E the energy to form a vacancy and
CiT the applied stress. The number of trails of vacancies formed in
expanding the loop to an ellipse of seiri~min,.r axis x per unit length
in wh-5 y-direction in the predominantly screw portion is approxi-
mately Nxu To expand the ellipse a distance dx along the x-direc-
tion requires an energy per on of NxdxE T'be wox*k done */y the a
•^•SA-

I
o
:
I
35
stress field is <S a dx. Thus the ellipse expands to a critical
aistance x„ r~ N5
Consider now the portion which is*primarily edge-type in
nature. The force on an incremental length, ds, is >r»u<L& • <F!\ '•< Utf
where R is the radius of curvature and <l& is the corresponding
incremental arc. The line tension is approximately ^~ d 0 . Thus
the critical radius of curvature is Rc • 3^. a
Now, from calculus, R Jr'IftU* \ / **<&W. If our elipse
is given by —7 * * * - 1. we find R • l c f /e*g i „ „e c ,c xjt yjt
evaluate the radius of curvature when x • o *nd v »v_- Thsr. x2 x 2 ' ,•
Re « _£_ „ Therefore yc « _^ » Since s.c •* «T and Rc - /<g , we
Yc Rc
/ have y e*. «<-*. This would say that the edge portion moves much V c
further than the screw portion.
We should also calculate the resistivity increase due to
vacancies. The number of vacancies per ellipse is of the order of
Assuming the resistivity increase to be proportional to the number
of vacancies, we have Ap <^ Xg yc oi c~ ^
This certainly is not in agreement with experiment* Consider
however, the magnitude of the critical distances
Recent work indicates that, for good single crystals„ N is
less than 5x10 lines./cm. We shall take a value of shear stress
corresponding to the applied load of 750 pounds for specimen 33.
Taking E - lev - 1.6xlQ-12, N - ;xlOa linea/cB2^ * 2xl0S dynes/cm2
^s^3

36
V ' a * 2x10* cm. and <5» - 5x10 dynes/cm, we get y =ss 10 cm., -2
xc^ss2xl0 cm. v/hereas the value of x is reasonable, y^, indicates
that the loop has run out of the crystal in this direction.
This suggests how the model should bo modified. We shall,
instead, assume that, for some small value of stress depending on
the correct value of N, the edge component of the loop runs cut of
the crystal. It is conceivable that the yield stress alone is
enough to cause this, since, at the present stage of knowledge, N
may well be considerably smaller than the value assumed here.
There are some experimental observations to support such a
44 model* Chen and Pond have examined the formation of slip bands,
comparing the rates of formation of the band in the slip direction
and normal to it. They found the band to form faster in the normal
direction, indicating the emergence of the edge component. It
would be interesting to have quantitative data on rate of formation
as function of direction under constant stress rate.
(
Wu and Smoluchowski* have found a breakdown of Schmid's re-
solved shear stress law for very thin specimens. They used pure
aluminum sheet material with cross-sectional dimensions of 0.2 mm.
The direction of slip was then controlled by the direction offering
least glide necessary to reach the surface as well as the rssolved
shear Stress* This again indicates that slip depends heavily on
the ability of a loop to reach the surface. If this is true,
macroscopic strain should be largely accounted for by surface slip
lines. It would be very desirable to have a * census" of slip lines
to see how much the strain can be accounted for in this way.
It is alsc possible that the differences concsming the
correct picture of slip lines between Heidenreich and Shock!ey *uad
—B«W

37 ( ) 47
Kuhlmann-Wilsdorf and Wilsdorf will be resolved by a sizs-effect.
It would be desirable to see if the yield strength depends on size
in this manner.
Having assumed that the edge component runs to the surface
for very small stress, we now have y„ • the radius of the specimen
except for small stress. Thus, again except for small stress,
j\j) * Xc «* <S~ ^ ^&rea of loop ^ jc v <s-
These are just the dependences experimentally observed. This
make the calculations more quantitative more information is needed.
io How many 8ou?€@u are active? This should be determined
from future slip line study.
* 2« How many loops does a given source send forth? This will
be controlled by the back-stress of the previous loops on the
source as well as the number of obstacles cluttering the slip plane
due to the motion of previous loops.
3. What is the M exact" shape of the loop? The ellipse used
here is probably only a reasonable approximation.
4<» What role does temperature play? Is it a diffusion of
vacancies out of the slip plane? Can this account for the linear
stress-strain curve at low temperature, the parabolic one at higher
temperature?
The aging phenomenon found at low temperatures is interest-
ing in itself. Since the aluminum i3 high purity {and the copper
used by Blewitt and Pry and Hennig even more pure}, it would seem
to rule out the possibility of this being an impurity effect, Hew-
ever j since the yieM point is a phenomenon most sensitive to the
length of the longer dislocation lengths, it should take but a
O
.•'••'
agreement -nay vanish if piling up of dislocations is considered. To
-—Hn *•*. - "< 4MW

o 39
TABLE I
SPECIMEN 31 cos(I xz') - 0.145
-Jl+CBI X 1(
6 1.0 1.09
1.15
1.15 1,15
6„78 8. 22
13.80
13.03 8c 72
A 6.17 9.19
13-35 8„7«
6„49 9.51
14.89 13o64
12.95 9.05
Remarks
As-grown specimen Pulled to 9 o/o elongation
at 4° K Pulled to 15 o/o elongation
at 4<> K Annealed at 78°K over night Annealed at 300°K for two __!- —
..- :-'•••• 9 ; : jtf£ -'•'- i* ' -A77 <&£* ''-'•' - '••••' -••

TABLE II
40
SPECI:*;N 33 cos ilxz') - 0.37
— tt-ACE x 10
1.0 1.03
7.10 8.01
7.03 7.46
•v fit? f *w»
7.53
1.09 10.62 10.42 10.85
1.09 1.09
10.79 8„78
10.05 8.10
10.26 a.27
1.13 12.42 11.74 12.02
Remarks
As-grcwr. speciaan Pulled to 3 0/0 elongation
at 4°K Pulled to 9 0/0 elongation
at 4°K Annealed at 78°K OYer night Annealed at 300°K for four
days Pulled further at 4°K
(
I
. "-. •••••••*?• \..-. --?"

( ) a
TABLE III
SPECIMEN 32 cos (£xa') » 0.11
6 1.0 1.16
1.16
— uJiem x 10
/* -A -A 7.76 7.91 7.68 8.60 13*54 12.96
10.32 9.37 9,17
Remarks
As-gro?m specimen Pulled to 16 0/0 elongation
at 78°K Annealed to }00°K for three
days
• *.• •::• e. •;.-Jft".' *! •••e-*4'.:v fH-r-; ~;- «$ pS ' vjv.
I 3

42
^
1 ( %
CO
M e w > CO f~>
eg
5
rH
X
<J
f*sto ro * * -
tower*
c-ocrs • O Q
o of\ •HrHeH
S3 O -*
«r\OtO 9 0S
v4) &
V\NO rHf-4
• • *
CO
ms bO i<5 r»>
O CV 5 9 E
*> e c 1 O B
«-. © 0,0 ©
3 ex £ re co «
ad JO • O ©:^ us •^ec; • 0^
-**: "v» +3T> 0 CO C -P«0 •p
CD co £>• <rj •X3 OTJTJO
eg O 03 0) t) m 6_i M S3 m S © <i> U ©
a s a a rH 5 cB ••« CO
•Pr-i rH » -H •9 ro «M CO !*»*> +>o 4J t, 0> © -4" (0
rmed
c ed
cry
ed
cry
ed a
t >> g TS © 0 a s e
© c 3 0 3
*fe £3 -C3 %-l«H <HO *H O S S 9 9<0 41 •H 5} tJ-O tJ fofj ** . (IJULJLI Ol A» C-. «So O 6 U ca d a © 0 >»>%>.£
© *>W H4>*>*> «J >H -H >H ,H E-riO
>•><»> C >o *> -H «H 'H O-H e^s g»JppTj^*J o) ol to 01 C O -H "H -H 3
© to 0 TJ-H+S
(4 CO «o 01 CO nj © CD © Q.U U U
© J<
• • a a II
oc^cj* e ? •4
rH J V
c a
c ©
o ©
CO
•P O
as

;
I • TABLE V
SPECIMEN 22
43
Lead Numbers Computed
7-14 0.485 9-15 1.434 2-12 1.210
10 - 8 1-257 5-16 2-118 1 - 16 1.983 1-8 1.821 9-12 1,926
Axial Separation (cm.)- Measured
0.479 - O.496 1.375 - 1.381 I.257 - 1.263 1.228 - I.234 2.081 - 2.093 lc956 - 1.962 1,840 - 1,834
1-934
(
I ( '
•••-••••-'.' . -"i . - i R. ....•', - .'"••• M i ' • i ' -•-.• •• • .:•'*".' .-:-'\J.-
; ~^J-.- -v. ,T.- • ••>• ' ''••.'.. .} ', .- •' -.•.->• . ,
2S&L5i*$—

••«
44
BIBLIOGRAPHY
1. T. Broom, Adv. in Phvs.s 3, 27 (1954)
2. F. Seitz, Imperfections in Nearly Perfect Crystals (New York: Wiley)
3. J. S. Koehler, Phys, Rev.,_7_5_, 1Q6 (1949)
4. J. K« Mackenzie and E. H. Sondheimer, Phys. Rev., 77, 264 (1950)
5. B. Landauer, Phys. Rev., 82, 520 (1951)
6» Re Hirone and Ke Adachi, Scni* Reg» Res, Inst. Tohoku Univ. A. J, 454 (1951)
7. D. L. Dexter, Phys. Rev., _86_,770 (1952)
8. A. W. Saenz, Phys. Rev-., 21, 1142 (1953)
9. S„ C. Hunter and F. K. w. Nabarro, unpublished (see ref. 1.)
10. J„ S. Koehler, Phys. Rev.,_60, 398 (1941)
11. P. G. Klemens, Auat. J. Phys.,.A, 122 (1953)
3.2. D. L. Dexter, Phys. Rev.,JJ, 768 (1952)
13» P. Jongenburger, Phys. Rev.,_90, 710 (1953)
14. F. seitz, Adv. in Phys., 1, 43 (1950)
15o K. B. Huntingdon, Phys. Rev. 61, 315 (1942)
16. H. B. Huntington, Phys. Rev., .61, 325 (1942)
17. J. H. Bartlett and G. J. Dienes, Phys. Rev.r 89, 848 (1953)
18. J„ Molenaar and V. H. Aarta, Nature, Lend., 166 (690) 1950
19* Um J. Druyvesteyn and J. A. Manintveld, Nature, Lond., loiL 868 (195l)
20. J. A. Maniatveld, Nature, Lond., i£2, 623 (1952)
21. T. H. Blewltt. J. K. Redman, and F. A.Sherill, Phys. Rev., 91, 236 (1953)
«3«» &• Ro Eggleston, J„ Appl. Phys, .21, 1400 (1952)
23. A. W« Overhauser, Phys. Rev.,J90_ 393 (1953)
I
• -n.T ~ • • -*-?". *****»/, tW——

c 45
24. H. Weyerer, Zeit, Metall. ££» 51 U951)
250 K. G, van Beuren, Acta- Met-, 1, 532 (1953)
26. Ro Ho Pry and R, W* Hennig, Acta Met,, 2 (2) (1954)
27. T, Broom, Phil. Mag.. ^2S 56 (1952); Aust., J. Sci. Res. t > 5o 128 (1952).
28. T. Broom and W. K. Clothier, Aust,. J. Sci. Res. A, 5. 119 (1952)
29. T. S. Noggle, Rev. Sci. Inst., 2^, I84 (1953)
3O0 P. W. Bridgeman, ProcAmer. Acad. Arts. Sci., 60;, 305 (1925)
11, E. Schmid and W. Boss. Plasticity of Cry at a la (F« A, Hughes Co., London, 1950)
32» D. Hanson and M. A. Wheeler, J. Inst. of Metals, 4J5, 229 (1931)
33 » A« MatthieoSen, *iep« erioion Assoc*, i£, i-44 (X8o2j
34. C, W. Berhout, Physica, 18* 58? (1952)
* 35. J- Wo Rutter and J. Reekie, Phys. Rev., 7_8, 70 (1950)
36« F= Bowen. R. R. Eggleston snd R. !i. Kropschot, J, APDI, Phvs.u 23, 630 (1952)
37. W. Geiss and J. A. H« van Liempt, Zeit. Physik, 4_1» £67 (192?)
380 H. Masima and G. Sachs, Zeit Physik, j[l, 321 (1928)
39. Ko Lucke, Zeit. Metall., /£, I, (1951)
40o Wo Boas and J« F« Nicholas, Aust. J„ Phys. 6, 116, (1953)
41. Js W, Kauffman and J. S. Koehler, Phys. Rev. 88, I49 (1952)
42. A. Ha Cottrell, Dislocations and Plastic Flow in Crystals (Clarendon Press, xy^)j
43. Wo T. Read, Jr., Dislocations in Crystals (McGraw-Hill„ 1953)
44. N. K. Chen and R. B, Pond, J« Metals, 4, 1085 (1952)
45. I*. L= Wu and R. Smoluchowski, Phys. Rev. 7_8, 468 (1950)
46. Ro D. Heidenreich and W. J. Shockley, J. Appl. Phys„, 18, 1029 I Q (1947) "~"
1 47. K. Wilsdorf and D. Kuhlmann-Wilsdorf, Z„ angew. Phys., 4, 36I £ 409, U« (1952)
\;-c^.i-^

46
4d. J. Washburn, K, Kennedy, L. 0. Seaborn and S* R. Parker, Tech. Rep. 2, Ser. 27 (1951)
49. E. I. Salkovitz and J. S. Koehler, Acta Met.. 1, 562, (1953)
50. P. Haasen. Doctoral Dissertation, U. of Coettingen (1953)
^t».-

I
47
' APPENDIX I
SAMPLE ANALYSIS OF SPECIMEN 32
Leads AX* My* A*' (R/R) n **' 300°K (corrected)
cm 6-9 •0.4432 +0.4432 0.5 1.0239 0.5119
1 •- 4 1 - 3
AX* -£yT A*' 'cm cm cm
•0.4432 +0.4432 0.5 •0.4432 -0.4432 1.0 -0,4432 •0.4432 1.0 -0.4432 +0.4432 1.0 +0.4432 -0.4432 1.0
0 0 1.5 0 0 1.5
+0.4432 •0.4432 1.5
14 - 12 +0.4432 -0.4432 1.0 1.0004 3,0004 5-3 -0,4432 +0.4432 1.0 1.0117 1.0117
16 - 10 -0.4432 +0.4432 1.0 0.9966 0c996S 2-8 +0.4432 -0.4432 1.0 0.9306 0.9306
13 - 16 0 0 1.5 0.9379 1.4819 1.0032 1.5043 0.9955 1.4925
By examining the Laue orientation of the crystal., one derives the transformation.
o ,,/T' o rfo ^y0 " -.45936^X0' + .43309^yo
? • .77270 A z»
^z0 - .43322 AX0* - .64894/iy0 + .62546 A z«
Transforming, we have:
Leads
6-9 14 - 12 5-3
16 - 10 2-8
13 - 16 1-4 1-8
V
I Also from the Laue picture, we have:
I cos fi 0 - cos ( ixz') * .IO83O cos A.0 « cos ( /yz')«.77270
j ' sin %0 - cos (^sz») - .62546 sin £ Q .« .63475
A© - .6171 cm2 cos Ao/3in^0 - 1,23541
Electrical data for the grown specimen follows (resistance) repre- j sents two or more readings; spread of readings is indicated.
AXo A*o /)zc cm cm cm
.6748
.1763 .3861 .2246 .3752 1-1053
.0416 1..1795 .1532
.0400 1.1680 .1439
.1742 .3599 1.0929 ,1605 1.1451 .9269 .1630 i.Io28 .9412 .2296 .7555 1.4131

()
48
iieaas
6-9 14 - 12 5-3
16 - 10 2-8
13 - 16
1-8
300°K
2.0384 t .0003 3.9835 * .0001 A.0284 * .0000 3.9690 t . 0014 3.9045 ± .0005 5.9006 t .0002 5.9918 ± .0001 5.9458 i .0001
4°K 9 a[ u-fu x 1G~;
0.6479 r -0013 1.2564 x -0021 1.2661 t .0003 1.2937 2 -0023 1.2398 * .0002 1.8687 * .0112 1.9229 - .0072 1.8664 * .0207
ous e Az Leads
Using the readings at 4°K, one gets the following simultc quations from cos C£xz*)px^a x * cos (Z.yz,)/?_Ay • cos
cos (/xz')-^x cos {Z.yz1)Aj cos {/zzf)4z
At— (Zzz»)/> z
6-9 14 -'12 5-3
16 - a.0 2-8
13 - 16
!:!
\
i
V:
.0731
.0191
.0045
.OO43
.0189 0174 0177 / 0249 /
cm
/•
/.2963 I .2899' .9114 .0025 .2781 .8848
\.8985 V5838/
cm
.1405\
.6913 \ / -0958
.5797 j "
.5687/
OS
.O64B
.1256
.1266
.1294 • .1240
.1869
.1923
.1866 y-°-x 10
Using a least square method of solution, one gets
J>x - .1257A - 7.76 x 10*9-A-cm
A „1281A - 7.91 x 10~9_n-cm
fz " .1244A - 7.68 x 10~9_n_cm
Check these values with the experimental values:
Leads
6-9 14 - 12 5-3
16 - 10 2-8
13 - 16
\:%
R( calculated) (^ jv. xlO} R( experimental) {« xvxlO)
.0649
.1255 -12QT .1273 .1230 .1876 .1905 mJLOf ©
The specimen was now given a 16 0/0 extension, new resistivities, we proceed as follows:
1.159 A
.0648
.1256
.1294
.1240
.1869
.1923
.1866
To calculate the
.- £«?• :

o cos 06 » COS fi /(
sin JL^ « sin/C
cos ^/sin^- 1.55043
.09344 sin ^L- ain/£„ 3T"
.53965 cos /(.„ - .83669
a * C08^»~ cos Ao 6 sin£fr sm^0
49
- .54767
- .31502
Ax , « /*xA * o A y -^ y0 -» afr ^ s0 *i^z(
MVUUS
6 14
5 16
2 13
1 1
9 12 3 10 8 16
A y*
1
IS
.38611
.3752 1.1795 1.1680
.3599 1LS1 1628 7555 / \';
a,
• .31502
Az,
/ ,2246 \ / -4569 / 1.1053 \ / .7234
.1532 I ' 1.2278 I - 1.2133 \ .7042
1.4371 . / 1.4593 / / 1 1.2007/ \
153 .1439
1.0929 .9269 .9412
1.4131
This gives the simultaneous equation:
2, R( »JLX 10 ) at 4 K
1,378 3.079 2.848 2.751 2.927 4.298 4.365 u.» if s. >
Leads
6-9 14-12
5-3 16-10 2-8 13-16
1-3
/.063l\ / .0165 »
.0039
.0037
.0163
.0150 ,0152
\ .0215
,3823 \ .6053 \
1.0273 1.0152
.5892 1.2024
\ 1.2210 \1.0046/
/ .1212i / -5
A
\
965 .0827\ .0777 .5898 .5002 .5079 .7626
JL
1«w? \
/ \
3079 \ 2848 I 2751 .2927 4298 / 4365 / 442> 1
These are solved as previously.
i-i I • gga
_S.3)l3«i

() -0
APPENDIX II
It is interesting to compare the relative resistivity con-
tributions of dislocations and vacancies. Using the values quoted
in the introau-t-jrv remarks, we take the resistivity increase due to
dislocations to be A A • 0,4x10 TLA cm, where N is the number of dis-
locations per cm , andAJK- ">l*3/iAcin per percent of vacancies. In one
cor there are approximately 0.3x10 ' atoms. Thus 1 percent of 21 3 vacancies is equivalent to 0.3x10 vacancies per cm . Along a row -3 7 of atoms there are 1/a « 1/2.5x10" • 4x10 atoms. Thus 1 percent
cf vacancies is equivalent to 0.3x10/4x10' - 2x10^ lines of 3 13 \ vacancies per cm . Now 2x10 dislocation lines in 1 cm-* would gire
a resistivity increase of 0.4xl0"1^ x 2x10^ - 0.8x10" MjLcmj
therefore the ratio of increases for one percent of vacancies com-
pared to an equivalent density of dislocations if 1.3 / 0.08 - 15.7
Thus we deduce that vacancies are on the order of fifteen
times more effective than dislocations in producing resistivity
increases.

o 51 Atpmnix in
The present investigation suggests several possible new
experiments:
1. A complete study of the dependence of resistivity in-
crease on stress in face-centered cubic and hexagonal metals should
yield information concerning the interaction of dislocations on dif-
ferent glide planes. This has already been discussed.
spots after kinking sine. For an xray beam perpendicular to the
bend axis, the spots are smeared radially^ for a beam parallel to
the bend axis, the spots are smeared tangentlally. This is in line
with the belief that an array of positive (or neoatiw*) *d*» dis-
locations from a kink corner. P. Haaseu suggests that slip gsro-
cecds simultaneously on all slip planes in aluminum, even at lowest
stresses. This could account for resistivity isotropy without ruling
out dislocations as a major source of resistivity increase. By
examining asterism in aluminum relative to different directions in
the lattice (i.e., relative to different slip planes), this matter
could be further clarified.
5* It has been suggested here that crossing screw dislocations
may form the major source of vacancy production. Another source say
•••-» ";;._\", ..; .'v--.' a x*'- .-.,*;->*' - .*:'.•<, ,-.-*•• .-r-.-r, . ,
2. The stress-strain behavior in aluminum should be pursued
further at low temperatures. This should be combined with annealing
studies.
3. Parker and Washbura have deformed sine in pure shear.
To further reduce the complication of latent slip systems, it may
be desirable to look for anieotropic changes in resistivity, strain -
ing in a similar manner. 49 4* Salkovits and Koshler have examined asterism of Laue
i
V

i
• « i 1 •>
••*••••-• '.• •••• • • , i ••"••••;;. '•• •••.••i'.-'V..-.:-:<
5*
be jogs in dislocations. To study the creation of vacancies, It
would be useful to be able to Introduce an axceea of one type o£
dislocation Into the lattice. An experiment suggested by Koehler ie
to compare the resistivity behavior of specimens that have been
previously twisted to introduce screw dislocations and specimens
that have been bent to introduce edge dislocations.
6. ?acaneles surely affect hardness* Since quenching from
high temperatures presumably yields a high concentration of vacancies
it would be interesting to quench to temperatures just above and
below the place where these vacancies become mobile and examine the
stress-strain behavior in these regions.
7. The aging phenomena should be further examined. : 1
w|co
cvi
s-|o> CVJ
i
o
7f~
^->S • i • • .;.*.'
•.».• •. .•>•
^•;C&
.^LJ.v...;:
' ** v '•*'•'
V
X7"
S2
ALUNDUM CRUCI8LE
HYDROSTATIC PRESSURE HEAD
± DIAMETER Z
SAW CUT AFTER CASTING
•HOLE FOR PIN-GRIPPING
-TAMPED ALUMINA
POTENTIAL PROBES
0.350 DIAMETER
ALUMINUM SPECIMEN
SINGLE CRYSTAL NUCLEATION TIP
GRAPHITE PLUG
FIGURE I
Section through specimen inserted in crucible for casting
^_~iu; ..i..

g *
K Z Q. < 3k !- O
I Z O a: < O Hi H 2
\ 5L Z UJ O O I
1 u o v-i z
a> E a> *_ 3 </> O a> E a> o
CNJ c o
•4—
UJ v> a: in o 0)
w. o u. O
E.t: JZ o o *- </) o
I
w IK !
... ;*r>WH •'•
N6i .'V-ria-...L'J. vf^ ^_^

SLIP \ PLANE
NORMALX SLIP DIRECTION
FiGURE 3
-

i i as I
LU a: Z> e> u..
i > • i <e

i
CM
Vf
FIGURE 5
ii

X.
'.000 /
SPECIMEN No. 33 4°K
.80 .90 234S6789
LOO 1.10 1.20 Head Motion (Inches) iO II 12 %
FIGURE 6
I

£ O O O
m 00
o o o in oo r-
o o o m ID
(spuncM) poo-)
. • . - • • -••: 1 ^' mm s Hume

\
•
10001—
II I;
SPECIMEN No. !5
LOADINGS AT 78*K
SECOND LOADING AFTER ANNEAL AT 300WK
THIRD LOADING AFTER ANNEAL AT <v550°K
^0 44 48
Stain (%)
FIGURE 8
I? *1W»Wi» i*—
,VJL—

600 —
500
SPECIMEN No. 25 300°K
I i 400
v> T3
3 O
~ 300 o -J
200
100 I—/
0«- 1 8 !2 16 20 24 28
Stroin (%) 3;
i
!l I
FIGURE 9
..•«* • X1 • •..•••'.•• •'''•••*'•'*' Sif!- '-T'".-•'•'•v.'^-':^/y.-y::.\'.:^\h
-. • .i

I
lOU
FIGURE Specimen Orientation
**... •: • -; x.- -.. '» " ' '••"• ; • . • - - J v.
::..,=... ..."i.; r.2f-i :..,.-:.- t:Sjtt