technical report minimum incremental motion and … · minimum incremental motion and holding...
TRANSCRIPT

1
Technical Report Minimum Incremental Motion and Holding Stability in Beamline Positioning Stepper versus Servo – A Comparison of Drive Technologies
Brian O’Connor Product Manager Aerotech Inc. Byron Fruit Applications Engineer Research, Aerospace, and Defense Group Aerotech Inc.

2
Background Many beamline applications such as X-ray microscopy and Computed Tomography (CT) require positioning of samples, detectors, and optics in order to perform measurements. Microscopy applications often require imaging of the structure of matter at the sub-micrometer and even nanometer level. Good holding stability, both short-term and long-term, is required because movement of the sample or optics over the time of measurement will cause poor images. Also, the ability to make small mechanical movements on the order of nanometers is often critical for alignment and adjustment of samples or optics. Stepper and servomotors are two common drive methods for controlling position in mechanical positioning systems used in beamline applications. Stepper motors are brushless DC devices that divide 360 degrees of rotation into equal steps. Motion is induced by energizing segments of the coil winding sequentially. A stepper motor can hold position by energizing one segment of the coil, without any feedback, making it a good choice for low-cost, precision applications requiring holding stability. Servomotors are typically brushless AC devices, but in contrast to stepper motors, most often use three phases of coil winding plus a feedback device like an encoder or resolver. This feedback device allows a controller to commutate the motor phases and close a PID servo loop around the actual position of the motor, providing a significant advantage in applications that require small step sizes and good holding stability.
Study Objective The purpose of this study is to evaluate the performance differences of motor and feedback technologies on minimum incremental motion (achievable mechanical step size), short-term stability, and long-term stability. Short-term stability, or in-position jitter, is the amount of motion measured at the point of interest over a short time duration (four seconds chosen for this study). Long-term stability is measured over a larger time duration (60 minutes chosen for this study). Long-term stability tests are performed when the stages are at equilibrium and directly after a move-sequence to replicate typical motion and move sequences present when aligning samples, optics, or other equipment. To evaluate and isolate these aspects of performance, Aerotech designed a mechanical positioning stage based on our ANT180-L platform that could be fitted with several different drive technologies including a 12 mm diameter x 1 mm pitch ball screw driven by a stepper motor, a 12 mm diameter x 1 mm pitch ball screw driven by a rotary servomotor, and a linear servomotor. The bearings used in the ANT180-L stage for all tests are crossed-roller bearings with an anti-cage-creep mechanism. Optical encoders are used for position feedback and commutation on the servomotors. These include both rotary encoders (1000 lpr, 1 Vpp output) mounted to the motors and direct-metrology linear encoders (glass scales, 20 μm signal period, 1 Vpp output) in line with the direction of motion. The use of a common mechanical platform with modular drive and feedback technologies effectively controlled for variation in results due to different bearing types, friction, preload, and variation in manufacturing or assembly. A summary of the stage motor and feedback configurations tested is shown in Table 1.

3
Table 1. Stage motor and feedback configurations tested.
Stage Type/Drive Description of Motor/Feedback
Linear Motor Motor: 3-phase linear motor (BLM-142-A)
Linear encoder: 20 μm signal pitch encoder on glass; 1 Vpp output (0.3 nm interpolated electrical resolution)
Ball Screw and Stepper Motor
Ball screw: 12 mm diameter x 1 mm pitch Motor: 0.9°/step bipolar stepper (Lin P/N: 5709G-01P)
Full step resolution: 2.5 μm Microstepping resolution: 0.5 nm (x5000)
Ball Screw and Servomotor (No Linear Encoder)
Ball screw: 12 mm diameter x 1 mm pitch Motor: 3-phase slotless AC servomotor (BMS60)
Rotary encoder: 1000 cnts/rev; 1 Vpp output (0.5 nm interpolated electrical resolution)
Ball Screw and Servomotor (With Linear Encoder)
Ball screw: 12 mm diameter x 1 mm pitch Motor: 3-phase slotless AC servomotor (BMS60)
Rotary encoder: 1000 cnts/rev; 1 Vpp output (0.5 nm interpolated electrical resolution) Linear encoder: 20 μm signal pitch encoder on glass; 1 Vpp output (0.3 nm interpolated
electrical resolution)
Solid models of the various stage configurations used for testing are shown in Figure 1.
(A) (B) (C)
Figure 1. (A) ANT180-L stage with ball screw and servomotor, (B) ANT180-L stage with ball screw and stepper motor, and (C) ANT180-L stage with linear motor.

4
Test Setup All testing was performed on an air-isolated granite table in Aerotech’s Engineering Lab located on the ground floor of the building. The ANT180-L stage was mounted to aluminum vacuum rails on the granite. For all tests, the work point was located at approximately 25 mm above the surface of the linear stage. In most beamline experiments, this is a best-case scenario as most offsets and stage stacks can be hundreds of mm in length. However, the test setup used enables a true comparison of the drive and feedback technology and eliminates stage stack arrangements that are application dependent. The metrology fixturing was manufactured out of Invar in order to minimize the effects of temperature fluctuations on the metrology loop. Also, the test structure was designed to ensure that the structural loop stiffness was sufficiently high so as to not influence the in-position stability measurements. The first resonant frequency of the metrology loop fixturing is approximately 615 Hz (bending in the Y direction). Position data for both the in-position stability and minimum incremental motion tests were captured with Lion capacitive sensors (Driver P/N: CPL290, Probe P/N: C9.5-5.6-2.0) and an Agilent 35670A Dynamic Signal Analyzer. Unless noted, data were low-pass filtered at 500 Hz (below the first metrology loop structural resonance). Thermocouples were used to capture the temperature of the air, granite, motor, and carriage during the long-term stability measurements. All tests were performed with linear amplifiers (Aerotech’s Ensemble HLe). The Ensemble control platform was selected because this is the typical Aerotech controller platform found in synchrotron applications. Linear amplifiers were chosen so that no noise from amplifiers, such as PWM (pulse width modulated) switching noise, was induced into the stage or measurement. The test setup is shown in Figure 2. Note the coordinate system indicates the positive direction of the capacitive sensors used in the testing. For all tests, the direction of travel is oriented in the X-direction.
Figure 2. Test setup.

5
Results
Metrology Loop (Structural) Noise Floor Before commencing with minimum incremental motion and stability tests, the structural metrology-loop noise, which includes the cap sensor noise, was measured on all X, Y, and Z probes. Figure 3 shows the test setup where the stage was replaced with a series of fixture blocks.
Figure 3. Test setup for measuring capacitance and metrology loop noise.
Data were captured for four seconds and low-pass filtered to a 500 Hz measurement bandwidth. Table 2 shows the results obtained from this measurement.
Table 2. Measured metrology loop (structural) noise.
Direction RMS pk-pk
X 0.14 nm 1.11 nm
Y 0.16 nm 1.10 nm
Z 0.18 nm 1.45 nm
6
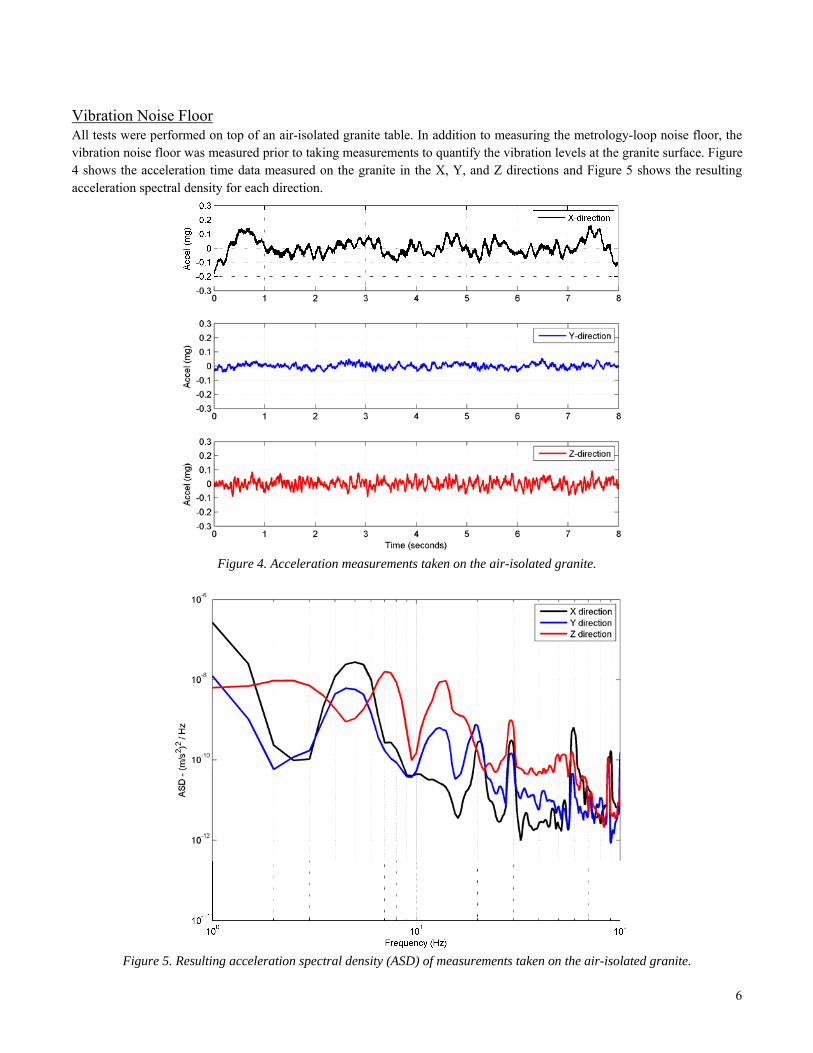
Vibration Noise Floor All tests were performed on top of an air-isolated granite table. In addition to measuring the metrology-loop noise floor, the vibration noise floor was measured prior to taking measurements to quantify the vibration levels at the granite surface. Figure 4 shows the acceleration time data measured on the granite in the X, Y, and Z directions and Figure 5 shows the resulting acceleration spectral density for each direction.
Figure 4. Acceleration measurements taken on the air-isolated granite.
Figure 5. Resulting acceleration spectral density (ASD) of measurements taken on the air-isolated granite.

7
Minimum Incremental Motion Testing The stage configurations and minimum incremental motion test results are shown in Table 3. Each test started at the fundamental resolution of the stage and the commanded step size was increased until the stage was capable of performing 10 forward and 10 reverse steps reliably and with reasonable accuracy.
Table 3. Stage configurations and achieved minimum incremental motion results.
Stage Type and Drive Linear Encoder
Resolution Rotary Encoder
Resolution Measured Minimum Incremental Motion
Figure Number
Linear Motor 0.3 nm N/A 1.5 nm 6
Ball Screw and Servomotor (No Linear Encoder)
N/A 0.5 nm 50 nm 7
Ball Screw and Servomotor (With Linear Encoder)
0.3 nm 0.5 nm 1.5 nm 8
Ball Screw and Stepper Motor N/A 0.5 nm(1) 250 nm 9 1. Equivalent resolution achieved when microstepping.
Minimum Incremental Motion Testing Conclusions ● The linear motor stage achieved a 1.5 nm minimum incremental motion. ● In the case of the ball screw and servomotor without a linear encoder (Figure 7), a step size of 50 nm was
approximately the limit where the inaccuracy of each step did not make up a large percentage of the step size. Also, in this particular test case, approximately 25 nm of backlash was present in the positioning stage.
● Addition of the linear encoder to the ball screw and servomotor stage allowed for a 1.5 nm step size – the same as the linear motor stage.
● The stepper motor stage was capable of obtaining approximately 250 nm step sizes without significant step size inaccuracy. Smaller steps were discernible, but significant step inaccuracy was present. The vibration at the start of each step was a result of the stepper motor resonance. This vibration can be minimized by using a mechanical damper attached to the stage shaft or by applying electronic damping, neither of which were used in this study.
Figure 6. Minimum Incremental Motion step plot for the ANT180 linear motor stage.

8
Figure 7. Minimum Incremental Motion step plot for the ANT180 ball screw and servomotor stage without linear encoder.
Figure 8. Minimum Incremental Motion step plot for the ANT180 ball screw and servomotor stage with linear encoder.

9
Figure 9. Minimum Incremental Motion step plot for the ANT180 ball screw and stepper motor stage.
10
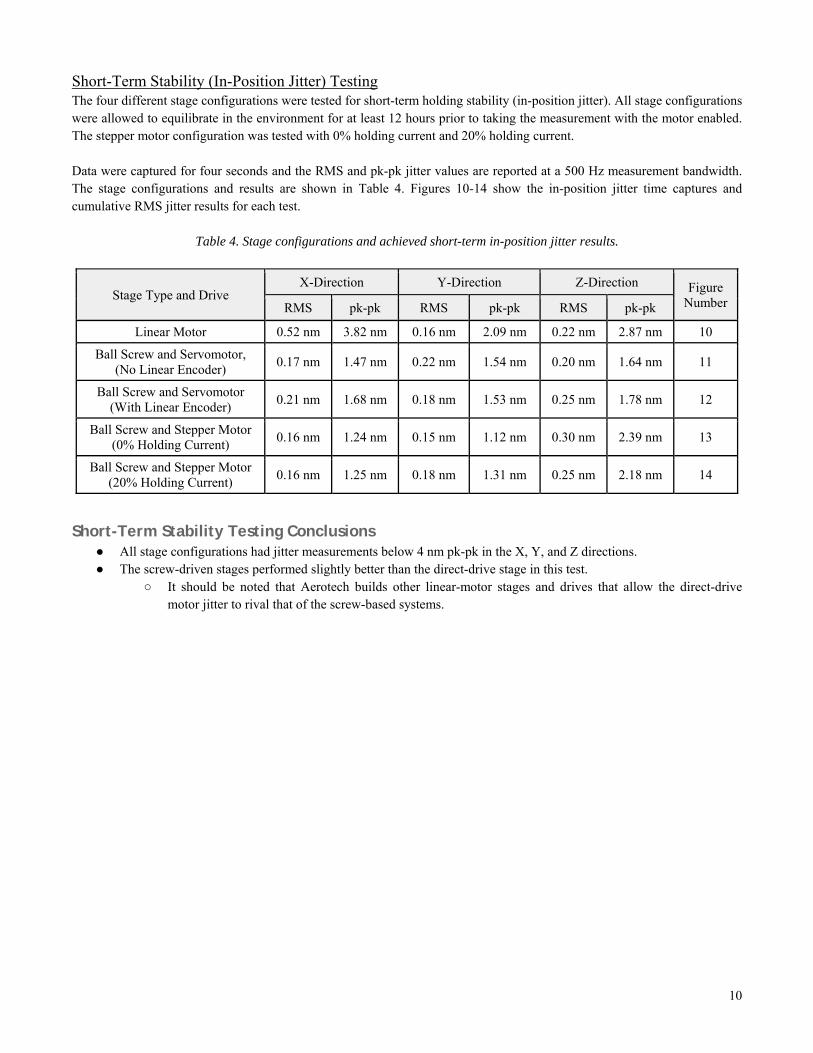
Short-Term Stability (In-Position Jitter) Testing The four different stage configurations were tested for short-term holding stability (in-position jitter). All stage configurations were allowed to equilibrate in the environment for at least 12 hours prior to taking the measurement with the motor enabled. The stepper motor configuration was tested with 0% holding current and 20% holding current. Data were captured for four seconds and the RMS and pk-pk jitter values are reported at a 500 Hz measurement bandwidth. The stage configurations and results are shown in Table 4. Figures 10-14 show the in-position jitter time captures and cumulative RMS jitter results for each test.
Table 4. Stage configurations and achieved short-term in-position jitter results.
Stage Type and Drive X-Direction Y-Direction Z-Direction Figure
Number RMS pk-pk RMS pk-pk RMS pk-pk
Linear Motor 0.52 nm 3.82 nm 0.16 nm 2.09 nm 0.22 nm 2.87 nm 10
Ball Screw and Servomotor, (No Linear Encoder)
0.17 nm 1.47 nm 0.22 nm 1.54 nm 0.20 nm 1.64 nm 11
Ball Screw and Servomotor (With Linear Encoder)
0.21 nm 1.68 nm 0.18 nm 1.53 nm 0.25 nm 1.78 nm 12
Ball Screw and Stepper Motor (0% Holding Current)
0.16 nm 1.24 nm 0.15 nm 1.12 nm 0.30 nm 2.39 nm 13
Ball Screw and Stepper Motor (20% Holding Current)
0.16 nm 1.25 nm 0.18 nm 1.31 nm 0.25 nm 2.18 nm 14
Short-Term Stability Testing Conclusions ● All stage configurations had jitter measurements below 4 nm pk-pk in the X, Y, and Z directions. ● The screw-driven stages performed slightly better than the direct-drive stage in this test.
○ It should be noted that Aerotech builds other linear-motor stages and drives that allow the direct-drive motor jitter to rival that of the screw-based systems.

11
Figure 10. In-position jitter measurements for the ANT180 linear motor stage.
Figure 11. In-position jitter measurements for the ANT180 ball screw and servomotor stage without linear encoder.

12
Figure 12. In-position jitter measurements for the ANT180 ball screw and servomotor stage with linear encoder.
Figure 13. In-position jitter measurements for the ANT180 ball screw and stepper motor stage with 0% holding current.
13
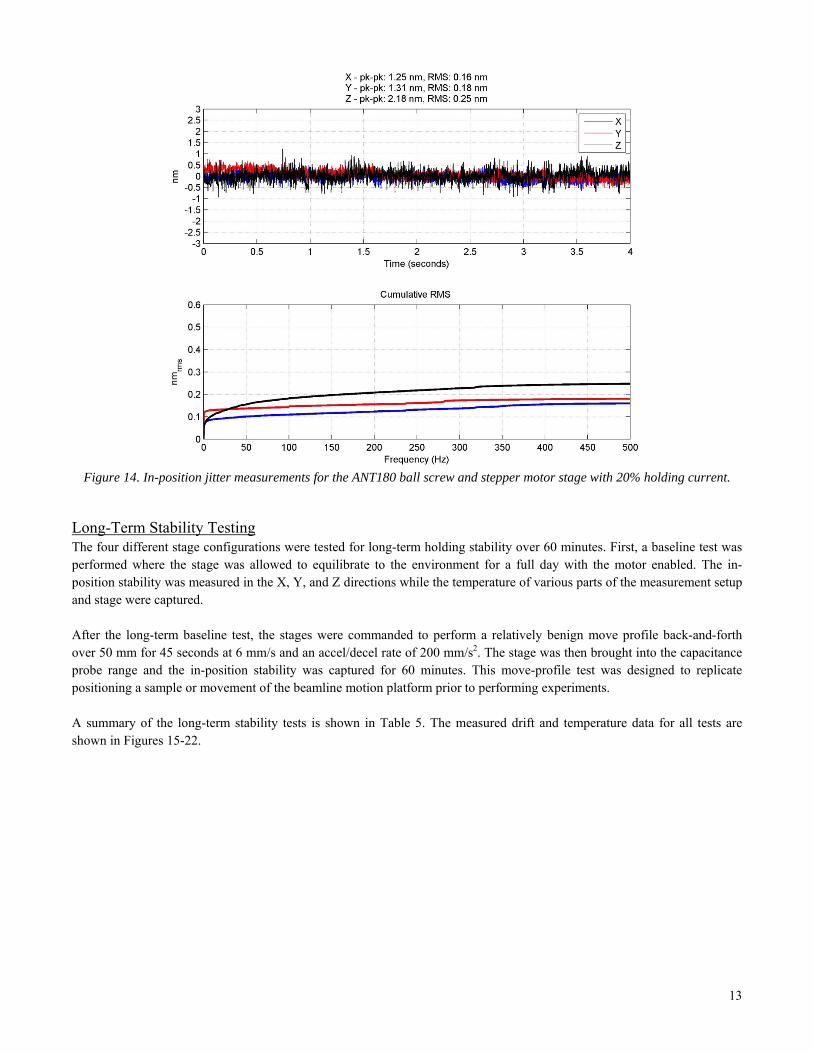
Figure 14. In-position jitter measurements for the ANT180 ball screw and stepper motor stage with 20% holding current.
Long-Term Stability Testing The four different stage configurations were tested for long-term holding stability over 60 minutes. First, a baseline test was performed where the stage was allowed to equilibrate to the environment for a full day with the motor enabled. The in-position stability was measured in the X, Y, and Z directions while the temperature of various parts of the measurement setup and stage were captured. After the long-term baseline test, the stages were commanded to perform a relatively benign move profile back-and-forth over 50 mm for 45 seconds at 6 mm/s and an accel/decel rate of 200 mm/s2. The stage was then brought into the capacitance probe range and the in-position stability was captured for 60 minutes. This move-profile test was designed to replicate positioning a sample or movement of the beamline motion platform prior to performing experiments. A summary of the long-term stability tests is shown in Table 5. The measured drift and temperature data for all tests are shown in Figures 15-22.

14
Table 5. Stage configurations and achieved long-term stability results.
Stage Type and Drive Move Routine Prior to Test
pk-pk X Stability (nm)
pk-pk Y Stability (nm)
pk-pk Z Stability (nm)
Figure Number
Linear Motor No 10.9 nm 9.3 nm 12.7 nm 15
Ball Screw and Servomotor (No Linear Encoder)
No 16.5 nm 9.9 nm 18.8 nm 16
Ball Screw and Servomotor (With Linear Encoder)
No 8.2 nm 9.5 nm 16.5 nm 17
Ball Screw and Stepper Motor (0% Holding Current)
No 7.0 nm 6.7 nm 15.8 nm 18
Ball Screw and Stepper Motor (20% Holding Current)
No 10.1 nm 5.5 nm 19.0 nm 19
Linear Motor Yes 11.7 nm 6.4 nm 21.5 nm 20
Ball Screw and Servomotor (No Linear Encoder)
Yes 115 nm 7.2 nm 28.1 nm 21
Ball Screw and Servomotor (With Linear Encoder)
Yes 38.2 nm 4.9 nm 15.8 nm 22
Ball Screw and Stepper Motor (0% Holding Current)
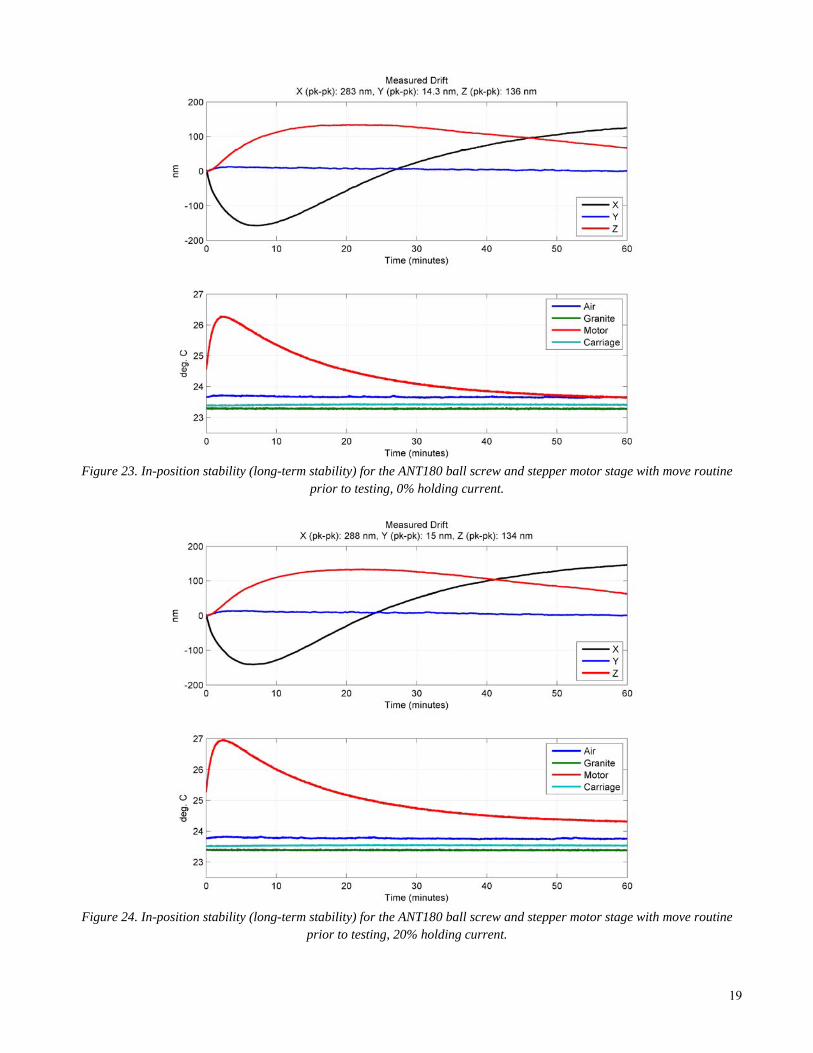
Yes 283 nm 14.3 nm 136 nm 23
Ball Screw and Stepper Motor (20% Holding Current)
Yes 288 nm 15.0 nm 134 nm 24
Long-Term Stability Testing Conclusions ● All stages performed similarly in the baseline long-term stability tests (no move routine). The differences in
measured drift between tests (5-10 nm) are well within expected amounts due to temperature variations in the room over the measurement time of 60 minutes.
● When a move routine was performed, the measured drift in the motion direction of the stepper-motor stage was 23 times higher than the linear-motor stage and approximately 7 times higher than the servomotor with linear encoder.
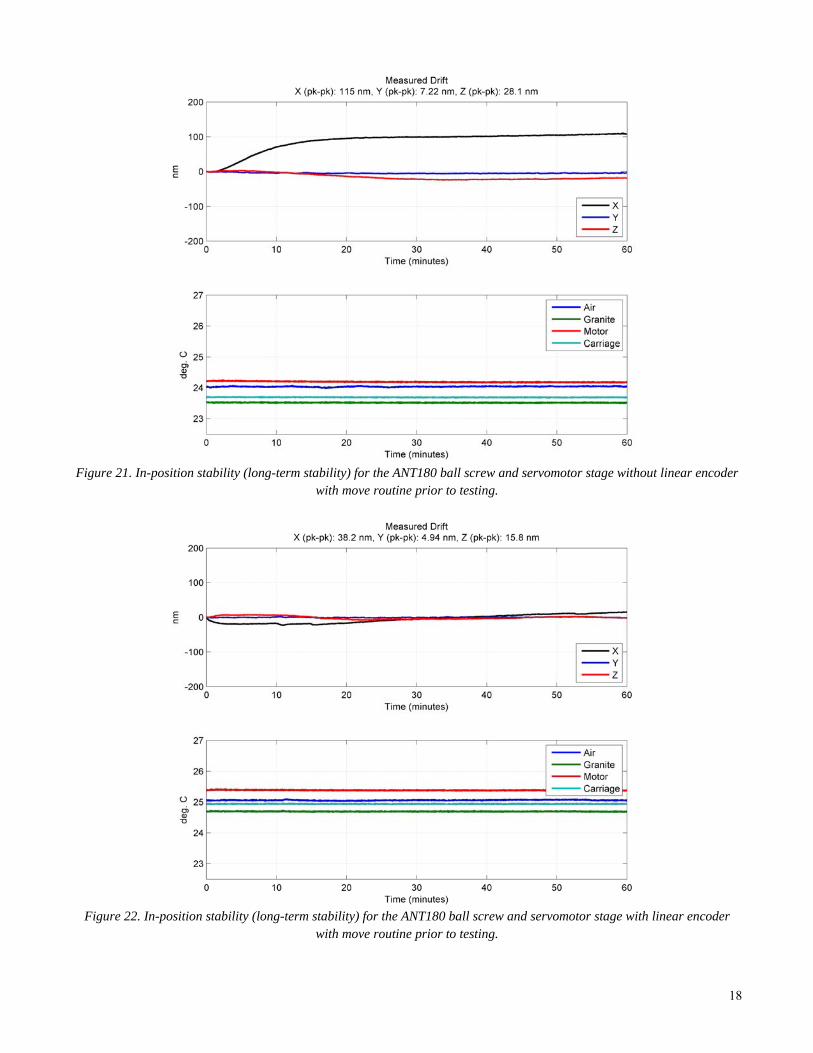
● For the test case with the ball screw/servomotor and move routine, about 115 nm of drift was observed in the X direction with minimal temperature rise at the measured points on the stage (motor experienced approximately 0.1 °C). The cause of this drift is likely due to heating and hysteresis in the ball screw as the measured displacement did not return to the starting position after allowed to equilibrate for 2-3 hours.
● As expected, the linear encoder (direct-feedback) helps significantly in reducing drift in the direction of motion.

15
Figure 15. In-position stability (long-term stability) measurements for the ANT180 linear motor stage (baseline).
Figure 16. In-position stability (long-term stability) for the ANT180 ball screw and servomotor stage without linear encoder
(baseline).

16
Figure 17. In-position stability (long-term stability) for the ANT180 ball screw and servomotor stage with linear encoder
(baseline).
Figure 18. In-position stability (long-term stability) for the ANT180 ball screw and stepper motor stage, 0% holding current
(baseline).

17
Figure 19. In-position stability (long-term stability) for the ANT180 ball screw and stepper motor stage, 20% holding current
(baseline).
Figure 20. In-position stability (long-term stability) measurements for the ANT180 linear motor stage with move routine
prior to testing.
18
Figure 21. In-position stability (long-term stability) for the ANT180 ball screw and servomotor stage without linear encoder
with move routine prior to testing.
Figure 22. In-position stability (long-term stability) for the ANT180 ball screw and servomotor stage with linear encoder
with move routine prior to testing.
19
Figure 23. In-position stability (long-term stability) for the ANT180 ball screw and stepper motor stage with move routine
prior to testing, 0% holding current.
Figure 24. In-position stability (long-term stability) for the ANT180 ball screw and stepper motor stage with move routine
prior to testing, 20% holding current.

20
Conclusions In applications requiring the highest levels of in-position jitter (shorter-term stability), a ball-screw-driven stage with a linear amplifier performs best. Direct-drive linear-motor stages rival ball-screw-driven stages with only slightly worse in-position jitter (~4 nm compared to ~2 nm pk-pk). Aerotech has standard linear-motor stage designs with in-position jitter values in the 1-2 nm range. Where direct-drive linear-motor stages significantly outperform screw-driven stages is in their ability to make small mechanical movements (minimum incremental motion) and maintain excellent holding stability over longer time periods. Adding a linear encoder to a ball-screw servomotor stage can improve both; however, speed and smoothness of motion generally suffer. For example, many new X-ray imaging applications require brighter X-rays (higher brilliance). With these brighter X-rays comes the potential to damage samples if not imaged quickly. For this reason, many applications are moving toward scanning and away from the step-measure-step-measure approach. Direct-drive stages are inherently better for these scanning applications due to a noncontact drive mechanism. Although stepper-motor stages are a cost-effective and simple way to perform positioning, they suffer from a major drawback – heat. When sitting at rest, it is quite common to reduce the current to lower levels (sometimes 0% holding current). However, as shown in this testing, even 45 seconds of stepper-motor stage movement will cause a few degrees of temperature rise that will cause hundreds of nanometers of drift and take >>1 hour to equilibrate. Applications in vacuum generally exacerbate this drift since thermal management becomes even more difficult. Servomotor stages have an inherent advantage in that they only use current when required. This effectively minimizes heating and thermal drift effects and allows for a more stable positioning system. As the quest to image samples at higher and higher resolution continues, the positioning system will play an ever-increasing role in achieving these high-quality images. This capability for extremely fine positioning and stability makes both linear and rotary servomotors an excellent choice for applications in which achieving submicron or even nanometer precision in sample and optics positioning is critical.