technical report - climate data for hydrologic scenario
TRANSCRIPT
Francis Chiew, Jin Teng, Dewi Kirono, Andrew Frost, Janice Bathols,
Jai Vaze, Neil Viney, Kevin Hennessy and Wenju Cai
June 2008
Climate data for hydrologic scenario modelling across the Murray-Darling BasinA report to the Australian Government from the CSIRO Murray-Darling Basin Sustainable Yields Project
Murray-Darling Basin Sustainable Yields Project acknowledgments
The Murray-Darling Basin Sustainable Yields project is being undertaken by CSIRO under the Australian Government's Raising
National Water Standards Program, administered by the National Water Commission. Important aspects of the work were
undertaken by Sinclair Knight Merz; Resource & Environmental Management Pty Ltd; Department of Water and Energy (New
South Wales); Department of Natural Resources and Water (Queensland); Murray-Darling Basin Commission; Department of
Water, Land and Biodiversity Conservation (South Australia); Bureau of Rural Sciences; Salient Solutions Australia Pty Ltd;
eWater Cooperative Research Centre; University of Melbourne; Webb, McKeown and Associates Pty Ltd; and several individual
sub-contractors.
Murray-Darling Basin Sustainable Yields Project disclaimers
Derived from or contains data and/or software provided by the Organisations. The Organisations give no warranty in relation to
the data and/or software they provided (including accuracy, reliability, completeness, currency or suitability) and accept no
liability (including without limitation, liability in negligence) for any loss, damage or costs (including consequential damage)
relating to any use or reliance on that data or software including any material derived from that data and software. Data must not
be used for direct marketing or be used in breach of the privacy laws. Organisations include: Department of Water, Land and
Biodiversity Conservation (South Australia), Department of Sustainability and Environment (Victoria), Department of Water and
Energy (New South Wales), Department of Natural Resources and Water (Queensland), Murray-Darling Basin Commission.
CSIRO advises that the information contained in this publication comprises general statements based on scientific research.
The reader is advised and needs to be aware that such information may be incomplete or unable to be used in any specific
situation. No reliance or actions must therefore be made on that information without seeking prior expert professional, scientific
and technical advice. To the extent permitted by law, CSIRO (including its employees and consultants) excludes all liability to
any person for any consequences, including but not limited to all losses, damages, costs, expenses and any other
compensation, arising directly or indirectly from using this publication (in part or in whole) and any information or material
contained in it. Data is assumed to be correct as received from the Organisations.
Acknowledgements
The authors wish to thank Prof Roger Grayson, etc who provided technical review of the report, and Becky Schmidt, CSIRO, for
her copy-editing.
Citation
Chiew FHS, Teng J, Kirono D, Frost AJ, Bathols JM, Vaze J, Viney NR, Young WJ, Hennessy KJ and Cai WJ (2008) Climate
data for hydrologic scenario modelling across the Murray-Darling Basin. A report to the Australian Government from the CSIRO
Murray-Darling Basin Sustainable Yields Project. CSIRO, Australia. 35pp.
Publication Details
Published by CSIRO © 2008 all rights reserved. This work is copyright. Apart from any use as permitted under the Copyright Act
1968, no part may be reproduced by any process without prior written permission from CSIRO.
ISSN 1835-095X
© CSIRO 2008 Climate data for hydrologic scenario modelling across the Murray-Darling Basin
Preface
This is a report to the Australian Government from CSIRO. It is an output of the Murray-Darling Basin Sustainable
Yields Project which assessed current and potential future water availability in 18 regions across the Murray-
Darling Basin (MDB) considering climate change and other risks to water resources. The project was
commissioned following the Murray-Darling Basin Water Summit convened by the Prime Minister of Australia in
November 2006 to report progressively during the latter half of 2007. The reports for each of the 18 regions and
for the entire MDB are supported by a series of technical reports detailing the modelling and assessment methods
used in the project. This report is one of the supporting technical reports of the project. Project reports can be
accessed at http://www.csiro.au/mdbsy.
Project findings are expected to inform the establishment of a new sustainable diversion limit for surface and
groundwater in the MDB – one of the responsibilities of a new Murray-Darling Basin Authority in formulating a new
Murray-Darling Basin Plan, as required under the Commonwealth Water Act 2007. These reforms are a
component of the Australian Government’s new national water plan ‘Water for our Future’. Amongst other
objectives, the national water plan seeks to (i) address over-allocation in the MDB, helping to put it back on a
sustainable track, significantly improving the health of rivers and wetlands of the MDB and bringing substantial
benefits to irrigators and the community; and (ii) facilitate the modernisation of Australian irrigation, helping to put
it on a more sustainable footing against the background of declining water resources.
Summary
This report is one in a series of technical reports from the CSIRO Murray-Darling Basin Sustainable Yields
Project. This report describes the climate data for the three climate scenarios used for the hydrological modelling
in the project. The three climate scenarios are historical climate, recent climate, and future climate. All three
climate scenarios have 112 years of daily climate data for 0.05o x 0.05o (5 km x 5 km) grid cells across the
Murray-Darling Basin (MDB).
The historical climate scenario (Scenario A) is the baseline against which other scenarios are compared. It is
based on observed SILO Data Drill climate data from 1895 to 2006. The recent climate scenario (Scenario B) is
used to assess future water availability should the climate in the future prove to be similar to that of the last ten
years. Climate data for 1997 to 2006 are used to generate stochastic replicates of 112-year daily climate
sequences. The replicate which produces a mean annual runoff closest to that observed in 1997 to 2006 is
selected to define this scenario. The future climate scenario (Scenario C) is used to assess the range of likely
climate conditions around the year 2030. Forty-five future climate variants, each with 112 years of daily climate
sequences, are used. The future climate variants come from scaling the 1895 to 2006 climate data to represent
~2030 climate, based on analyses of 15 global climate models (GCMs) and three global warming scenarios from
the Fourth Assessment Report of the Intergovernmental Panel on Climate Change (IPCC AR4).
The mean annual rainfall, averaged over 1895 to 2006, over the entire MDB is 457 mm. There is a clear east-
west rainfall gradient, where rainfall is highest in the south-east (mean annual rainfall of more than 1500 mm) and
along the eastern perimeter, and lowest in the west (less than 300 mm). In the northern MDB, most of the rainfall
occurs in the summer half of the year, and in the southernmost MDB, most of the rainfall occurs in the winter half
of the year. The mean annual areal potential evapotranspiration averaged across the MDB is 1443 mm, varying
from 1700 mm in the north to 1000 mm in the south.
The mean annual rainfall averaged over the MDB in the past ten years (1997 to 2006) is 440 mm, which is 4
percent lower than the 1895 to 2006 mean. However, rainfall over the past ten years in the southern MDB is
significantly lower than the long-term mean, by up to 15 percent lower in the southernmost parts.
There is considerable uncertainty in the global warming projections and in the predictions of how global warming
affects local rainfall. There are very significant differences in the future rainfall projections between the 15 GCMs.

Climate data for hydrologic scenario modelling across the Murray-Darling Basin © CSIRO 2008
However, the majority of the GCMs shows a decrease in future mean annual rainfall. The best estimate or median
indicates that the future mean annual rainfall in the MDB in ~2030 relative to ~1990 will be lower by about 2
percent in the north to 5 percent in the south. Averaged across the MDB, the best estimate or median is a 2.8
percent decrease in mean annual rainfall. The extreme dry and extreme wet estimates in the northern half of the
MDB range from a 10 to 15 percent decrease to a 10 to 15 percent increase in mean annual rainfall. In the
southern half of the MDB, the extreme estimates range from a 15 to 20 percent decrease in mean annual rainfall
to a 5 to 10 percent increase in mean annual rainfall, and in the southernmost parts, the extreme estimates range
from a decrease in mean annual rainfall of about 20 percent to little change in mean annual rainfall. Averaged
across the MDB, the extreme estimates range from a 13 percent decrease to an 8 percent increase in mean
annual rainfall. Most of the GCMs indicate that future winter rainfall is likely to be lower across the MDB. Most of
the rainfall and runoff in the southern MDB occur in the winter half of the year, and almost all the GCMs indicate
lower future winter rainfall there.
© CSIRO 2008 Climate data for hydrologic scenario modelling across the Murray-Darling Basin
Table of Contents
1 Introduction................................................................................................................................1
2 Historical climate data (Scenario A) ......................................................................................2 2.1 Gridded historical climate data .....................................................................................................................................2 2.2 Rainfall.........................................................................................................................................................................2 2.3 Areal potential evapotranspiration ................................................................................................................................4
3 Recent climate data (Scenario B) ..........................................................................................9 3.1 Method.........................................................................................................................................................................9 3.2 Annual rainfall modelling ............................................................................................................................................10 3.3 Disaggregation of annual rainfall ................................................................................................................................10
4 Future climate data (Scenario C) .........................................................................................12 4.1 Method.......................................................................................................................................................................12 4.2 Global warming ..........................................................................................................................................................13 4.3 Change in climate variables per degree global warming.............................................................................................15 4.4 Climate change projections for ~2030 ........................................................................................................................17 4.5 Change in future daily rainfall distribution ...................................................................................................................32
5 References ...............................................................................................................................35
Tables
Table 4-1. Storylines from the Intergovernmental Panel on Climate Change (2000) Special Report on Emission Scenarios......................................................................................................................................................................................... 14 Table 4-2. List of 15 global climate models used ............................................................................................................. 16
Figures
Figure 2-1. Mean rainfall: annual, summer (DJF) and winter (JJA)..................................................................................... 3 Figure 2-2. Locations of rainfall stations used to generate SILO Data Drill rainfall for various decades (stations shown in the plots have more than 2000 daily recorded values over the decade, that is, more than 55 percent of the data).............. 4 Figure 2-3. Mean temperature: annual, summer (DJF) and winter (JJA) ............................................................................ 5 Figure 2-4. Mean relative humidity: annual, summer (DJF) and winter (JJA)...................................................................... 6 Figure 2-5. Mean incoming solar radiation: annual, summer (DJF) and winter (JJA).......................................................... 7 Figure 2-6. Mean areal potential evapotranspiration: annual, summer (DJF) and winter (JJA) ........................................... 8 Figure 3-1. The 18 Murray-Darling Basin regions (left) and the percent difference between mean annual rainfall in 1997 to 2006 and in 1895 to 2006 (right) (regions are shown in red if the difference in mean annual rainfall is statistically significant) .......................................................................................................................................................................... 9 Figure 3-2. Comparison of statistics of the 50,000 112-year stochastic annual rainfall replicates with statistics of the historical data. Plots show the 5th percentile (lower yellow whisker), median (red line) and 95th percentile (upper yellow whisker) values from the 50,000 replicates and the values for the historical data. For each region, the statistics on the left are for 1895–2006 and those on the right are for 1997–2006............................................................................................ 11 Figure 4-1. Global average temperature over the last 150 years (from IPCC, 2007) ........................................................ 14 Figure 4-2. Example plots showing method used to estimate change in rainfall per degree global warming (Plots show summer (DJF) and winter (JJA) rainfall versus global average temperature from CSIRO-MK3.0 GCM simulations for 1895 to 2100 for two selected GCM grids in the MDB, with the slope of the regression line giving the rainfall change per degree global warming) ................................................................................................................................................................ 16 Figure 4-3. Percent change in mean annual temperature across the Murray-Darling Basin (~2030 relative to ~1990) from the 15 global climate models under the medium global warming scenario ........................................................................ 18 Figure 4-4. Percent change in mean annual relative humidity across the Murray-Darling Basin (~2030 relative to ~1990) from the 15 global climate models under the medium global warming scenario ................................................................ 19 Figure 4-5. Percent change in mean annual incoming solar radiation across the Murray-Darling Basin (~2030 relative to ~1990) from the 15 global climate models under the medium global warming scenario ................................................... 20

Climate data for hydrologic scenario modelling across the Murray-Darling Basin © CSIRO 2008
Figure 4-6. Percent change in mean annual areal potential evapotranspiration across the Murray-Darling Basin (~2030 relative to ~1990) from the 15 global climate models under the medium global warming scenario .................................... 21 Figure 4-7. Percent change in mean annual rainfall across the Murray-Darling Basin (~2030 relative to ~1990) from the 15 global climate models under the medium global warming scenario................................................................................... 23 Figure 4-8. Percent change in mean summer (DJF) rainfall across the Murray-Darling Basin (~2030 relative to ~1990) from the 15 global climate models under the medium global warming scenario ................................................................ 24 Figure 4-9. Percent change in mean winter (JJA) rainfall across the Murray-Darling Basin (~2030 relative to ~1990) from the 15 global climate models under the medium global warming scenario ........................................................................ 25 Figure 4-10. Number of global climate models showing a decrease (or increase) in future mean annual, summer (DJF), and winter (JJA) rainfall (note that 15 global climate models are used)............................................................................. 26 Figure 4-11. Percent change in mean annual rainfall across the Murray-Darling Basin (~2030 relative to ~1990) for the best estimate or median and the extreme dry and extreme wet variants ........................................................................... 27 Figure 4-12. Percent change in mean summer (DJF) rainfall across the Murray-Darling Basin (~2030 relative to ~1990) for the best estimate or median and the extreme dry and extreme wet variants ..................................................................... 28 Figure 4-13. Percent change in mean winter (JJA) rainfall across the Murray-Darling Basin (~2030 relative to ~1990) for the best estimate or median and the extreme dry and extreme wet variants ..................................................................... 29 Figure 4-14. Mean monthly rainfall averaged over the each of the 18 Murray-Darling Basin regions for the historical climate, with the extreme range for future climate shown in orange .................................................................................. 30 Figure 4-15. Example plots showing method used to estimate changes in the different rainfall amounts. The left hand side plots compare the 2046–2065 and 1981–2000 daily rainfall distributions. The right hand side plots show the percent changes in the different rainfall percentiles for 2046–2065 relative to 1981–2000............................................................. 33 Figure 4-16. Number of global climate models showing an increase (or decrease) in future extreme daily rainfall (1st percentile rainfall) in summer (DJF) and winter (JJA) (note that all 15 global climate models are used)............................ 34
© CSIRO 2008 Climate data for hydrologic scenario modelling across the Murray-Darling Basin ▪ 1
1 Introduction
This report is one in a series of technical reports from the CSIRO Murray-Darling Basin Sustainable Yields Project. The
terms of reference for the project are to estimate current and future water availability in each catchment and aquifer in
the Murray-Darling Basin (MDB) considering climate change, other risks, and surface-groundwater interactions; and
compare the estimated current and future water availability to that required to meet the current levels of extractive use.
Results from the project have been reported progressively for 18 contiguous regions across the entire MDB.
The purpose of this report is to describe in more detail the three climate scenarios used for the hydrological modelling in
the project. The three climate scenarios are historical climate, recent climate, and future climate. All three climate
scenarios have 112 years of daily climate data.
The historical climate scenario (Scenario A) is the baseline against which other scenarios are compared. It is based on
observed climate from 1895 to 2006. The historical climate data are described in Chapter 2.
The recent climate scenario (Scenario B) is used to assess future water availability should the climate in the future prove
to be similar to that of the last ten years. Climate data for 1997 to 2006 are used to generate stochastic replicates of 112-
year daily climate sequences. The replicate which produces a mean annual runoff closest to that observed in 1997 to
2006 is selected to define this scenario. The recent climate scenario is described in Chapter 3.
The future climate scenario (Scenario C) is used to assess the range of likely climate conditions around the year 2030.
Forty-five future climate variants, each with 112 years of daily climate sequences, are used. The future climate variants
come from scaling the 1895 to 2006 climate data to represent ~2030 climate, based on analyses of 15 global climate
models (GCMs) and three global warming scenarios. The future climate scenario is described in Chapter 4.
The Scenario A data described in this report are used for the rainfall-runoff modelling. The Scenario A data used for the
river system and groundwater recharge modelling are described elsewhere. The methods used to obtain the Scenario B
and Scenario C data, as described in this report, are the same for the rainfall-runoff, river system and groundwater
recharge modelling.

2 ▪ Climate data for hydrologic scenario modelling across the Murray-Darling Basin © CSIRO 2008
2 Historical climate data (Scenario A)
2.1 Gridded historical climate data
Historical daily climate data from 1895 to 2006 for 0.05o x 0.05o (~ 5 km x 5 km) grid cells across the Murray-Darling
Basin (MDB) are used. The source of the data is the SILO Data Drill of the Queensland Department of Natural
Resources and Water (http://www.nrw.qld.gov.au/silo and Jeffrey et al., 2001). The SILO Data Drill provides surfaces of
daily rainfall and other climate data interpolated from point measurements made by the Australian Bureau of
Meteorology.
The rainfall surfaces are interpolated using a trivariate thin plate smoothing spline with latitude, longitude and elevation
as independent variables. The other climate surfaces after 1957 are also interpolated using the same method, but a
different interpolation algorithm is used prior to 1957 because most of the available data before 1957 are not in digital
format (see http://www.nrw.qld.gov.au/silo/CLIMARC).
The gridded climate data is derived from observations that have been quality checked by the Australian Bureau of
Meteorology and have been subject to error checking by the Queensland Department of Natural Resources and Water.
Nevertheless, it is inevitable that there will still be errors in the data and the interpolation routines can also introduce
errors. In general, the data accuracy is expected to be lower in areas where the observation density is low relative to the
climate gradients. In this context, it should be noted that rainfall varies spatially more than the other climate variables, but
this is compensated by the generally denser rainfall observation network.
2.2 Rainfall
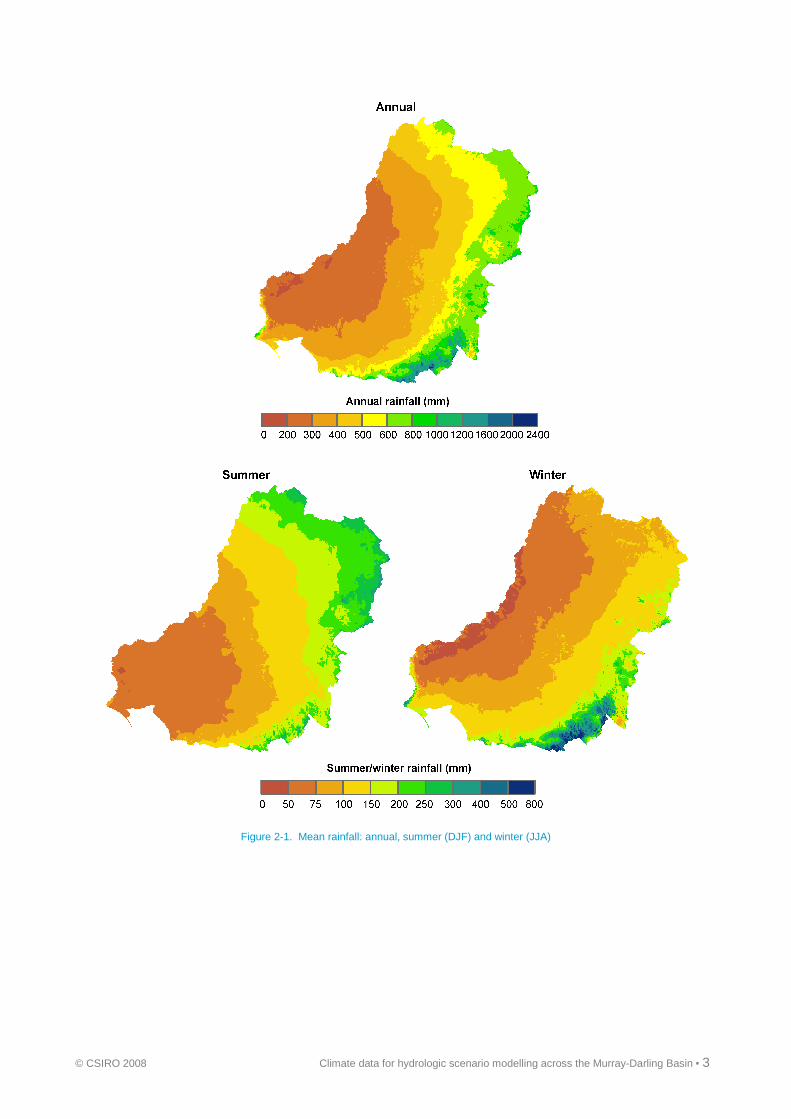
Figure 2-1 shows the mean annual, summer (December-January-February), and winter (June-July-August) rainfall
across the MDB. The mean annual rainfall averaged over the MDB is 457 mm. There is a clear east–west rainfall
gradient across the MDB, where rainfall is highest in the south-east (mean annual rainfall of more than 1500 mm) and
along the eastern perimeter, and lowest in the west (mean annual rainfall of less than 300 mm). In the northern MDB,
most of the rainfall occurs in the summer half of the year, and in the southernmost MDB, most of the rainfall occurs in the
winter half of the year. Potter et al. (2008) provide a detailed discussion of annual rainfall characteristics across the MDB.
Rainfall is the most important driver of the rainfall-runoff model. Rainfall is also much more variable, both temporally and
spatially, compared to the other climate variables. Figure 2-2 shows the density of rainfall stations used to generate the
SILO Data Drill rainfall data for various decades of the 20th century (stations shown in the plots have more than 2000
daily recorded values over the decade, that is, more than 55 percent of the data). Overall, more than 1400 stations have
operated at various times in the MDB. There are more than 1000 stations reporting at least 55 percent of days in a
decade for every decade between the 1920s and 1980s, with a peak of 1150 stations in the 1960s. Since the 1960s, the
number of reporting stations has declined and by the 1990s, only about 900 stations reported at least 55 percent of days.
Most of the increase in stations between the 1900s and 1960s occurred in the south and east. In contrast, the decrease
in station density since the 1960s has occurred throughout the MDB.
There is good coverage of rainfall stations in the south and east of the MDB where most of the runoff comes from, and
sparser coverage in the north-west where there is little runoff. The relative paucity of rainfall stations in the less
populated, mountainous and extreme high rainfall areas in the far south-east is of some concern because this area
generates substantial runoff and is characterised by large spatial rainfall gradients. Nevertheless, the SILO Data Drill
rainfall remains the best and most readily available source of gridded data for the project.
© CSIRO 2008 Climate data for hydrologic scenario modelling across the Murray-Darling Basin ▪ 3
Figure 2-1. Mean rainfall: annual, summer (DJF) and winter (JJA)

4 ▪ Climate data for hydrologic scenario modelling across the Murray-Darling Basin © CSIRO 2008
Figure 2-2. Locations of rainfall stations used to generate SILO Data Drill rainfall for various decades
(stations shown in the plots have more than 2000 daily recorded values over the decade, that is, more than 55 percent of the data)
2.3 Areal potential evapotranspiration
Daily rainfall and potential evapotranspiration (PET) are required as input data for the rainfall-runoff modelling. The daily
areal potential evapotranspiration (APET) is calculated from 0.05o x 0.05o climate data from the SILO Data Drill
(temperature; relative humidity, calculated as actual vapour pressure divided by saturation vapour pressure; and
incoming solar radiation) using Morton’s wet environment evapotranspiration algorithms
(http://www.bom.gov.au/averages and Morton, 1983; Chiew and Leahy, 2003).
The APET is defined as the evapotranspiration that would take place, if there was unlimited water supply, from an area
large enough that the effects of any upwind boundary transitions are negligible, and local variations are integrated to an
areal average. The APET is therefore conceptually the upper limit to actual evapotranspiration in the rainfall-runoff
modelling.

© CSIRO 2008 Climate data for hydrologic scenario modelling across the Murray-Darling Basin ▪ 5
The rainfall-runoff modelling results are much less sensitive to errors in the PET data than they are to errors in the rainfall
data. It is also easier to provide reliable PET data for the rainfall-runoff modelling, because compared to rainfall, PET is
relatively conservative in space with little day-to-day variation.
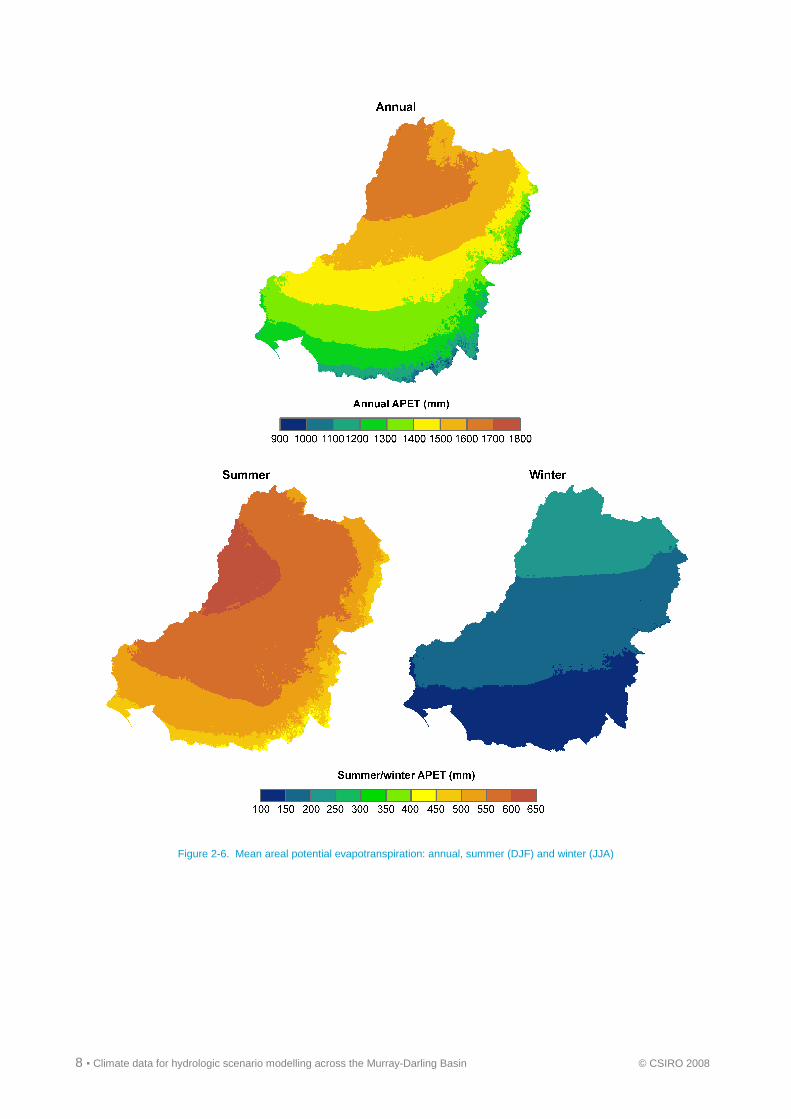
Figures 2-3, 2-4, 2-5 and 2-6 show the mean annual, summer and winter air temperature, average relative humidity,
incoming solar radiation and APET respectively across the MDB. The mean annual APET averaged across the MDB is
1443 mm, varying from 1700 mm in the north to 1000 mm in the south.
Figure 2-3. Mean temperature: annual, summer (DJF) and winter (JJA)

6 ▪ Climate data for hydrologic scenario modelling across the Murray-Darling Basin © CSIRO 2008
Figure 2-4. Mean relative humidity: annual, summer (DJF) and winter (JJA)

© CSIRO 2008 Climate data for hydrologic scenario modelling across the Murray-Darling Basin ▪ 7
Figure 2-5. Mean incoming solar radiation: annual, summer (DJF) and winter (JJA)
8 ▪ Climate data for hydrologic scenario modelling across the Murray-Darling Basin © CSIRO 2008
Figure 2-6. Mean areal potential evapotranspiration: annual, summer (DJF) and winter (JJA)

© CSIRO 2008 Climate data for hydrologic scenario modelling across the Murray-Darling Basin ▪ 9
3 Recent climate data (Scenario B)
3.1 Method
The recent climate scenario (Scenario B) is used to assess future water availability should the climate in the future prove
to be similar to that of the past ten years. The mean annual rainfall averaged over the Murray-Darling Basin (MDB) in the
past ten years (1997 to 2006) is 440 mm, which is 4 percent lower than the 1895 to 2006 mean (457 mm). However,
rainfall over the past ten years in the southern MDB is significantly lower than the long-term mean.
The Scenario B modelling is carried out only where the mean annual rainfall over the past ten years is statistically
significantly different from the long-term mean. Figure 3-1 shows the difference between the 1997 to 2006 mean annual
rainfall and the 1895 to 2006 long-term mean annual rainfall for the 18 MDB regions defined for this project. Regions are
shown in red if the 1997 to 2006 mean annual rainfall is significantly different to the 1895 to 1996 rainfall, at a statistical
significance level of α = 0.2 with the Student-t and Rank Sum tests. The statistical significance depends on the difference
between the 1997 to 2006 and 1895 to 1996 mean annual rainfalls and the inter-annual rainfall variability. The Scenario
B modelling is therefore carried only for the Eastern Mount Lofty Ranges, Wimmera, Loddon-Avoca, Campaspe,
Goulburn-Broken, Ovens, Murray and Murrumbidgee regions. Potter et al. (2008) present a detailed analysis and
discussion of recent rainfall and runoff characteristics across the MDB relative to the long-term historical data.
Figure 3-1. The 18 Murray-Darling Basin regions (left) and the percent difference between mean annual rainfall in 1997 to 2006
and in 1895 to 2006 (right) (regions are shown in red if the difference in mean annual rainfall is statistically significant)
Each region is considered separately in obtaining the Scenario B climate data. The first step in obtaining Scenario B
climate data is generating 100 stochastic replicates of 112 years of single-site annual rainfall (averaged over the region).
The annual rainfall series is generated based on the mean and standard deviation of 1997 to 2006 rainfall as well as
other statistics of 1895 to 2006 rainfall. This annual rainfall modelling is described in Section 3.2. The second step is
disaggregating the stochastically generated annual rainfall spatially and temporally to obtain daily rainfall and other
climate data at 0.05o x 0.05o grids across the region. This disaggregation is described in Section 3.3.
The method therefore provides 100 stochastic replicates of 112 years of daily rainfall and other climate data at
0.05o x 0.05o grids across a region. The data are used to run the rainfall-runoff model. The river system and groundwater
modelling use the stochastic replicate that produces a mean annual runoff for the region closest to the mean annual
10 ▪ Climate data for hydrologic scenario modelling across the Murray-Darling Basin © CSIRO 2008
runoff (not mean annual rainfall) in 1997 to 2006. The Scenario B data for the river system and groundwater modelling
can therefore be different from those shown in Figure 3-1.
Detailed stochastic rainfall-runoff and river system modelling is carried out for the Gwydir region and the area
encompassing the Loddon-Avoca, Campaspe and Goulburn-Broken regions (where the Goulburn Simulation Model is
used for the river system modelling). In this detailed modelling, reported in Frost et al. (2008), all the stochastic replicates
are used to explore how the range of plausible annual inflow sequences affects the modelling results. The method used
to obtain the Scenario A, B and C stochastic climate data for the detailed stochastic hydrological modelling is the same
as that described here.
3.2 Annual rainfall modelling
The single-site version of the lag-one autoregressive annual rainfall model of Frost et al. (2007) is used to generate the
stochastic annual rainfall. The model allows for non-Gaussian rainfall distribution using Box-Cox transformation and
considers parameter uncertainty using Bayesian methods with Markov Chain Monte Carlo parameter estimation.
The stochastic annual rainfall model has four parameters, µ, σ, ψ and λ, which relate to the mean, standard deviation,
lag-one serial correlation and the Box-Cox transformation (related to skewness) respectively. The mean and standard
deviation are estimated based on the 1997 to 2006 data, and the other two parameters are estimated based on the 1895
to 2006 data. The skewness and serial correlation are estimated using the entire data set because estimating the
parameters using data from only the past ten years would lead to very large uncertainties in the estimates.
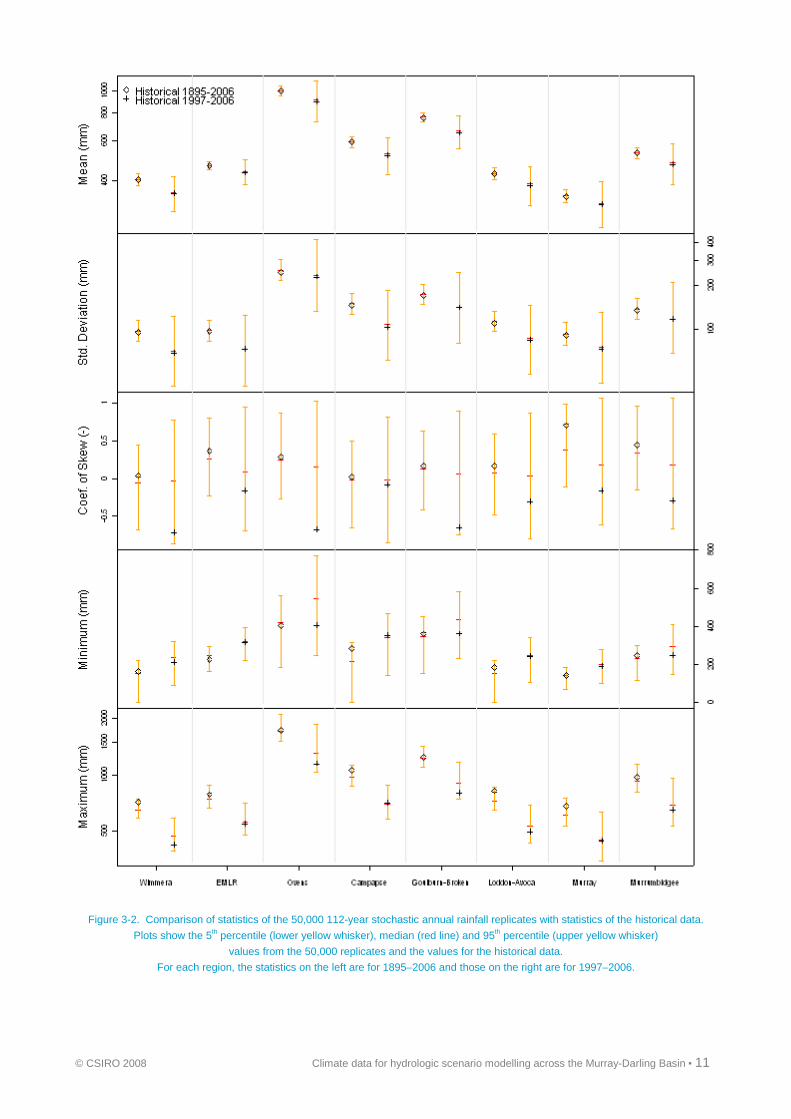
The ability of the stochastic model to reproduce the statistics of the historical data are verified by generating 50,000
replicates of 112-year annual rainfall data, and comparing the statistics of the stochastically generated data with those of
the historical data. The results (Figure 3-2) indicate that the stochastic model can reproduce satisfactorily the various
standard statistics (mean, standard deviation, skewness, minimum, maximum, ten-year rainfall sums and different lag
serial correlations), with the statistics of the historical rainfall data falling between the 5th and 95th percentile values of the
50,000 stochastically generated replicates.
Figure 3-2 shows a selection of the verification statistics, stratified into the 1895 to 2006 and 1997 to 2006 periods, for
the eight MDB regions where Scenario B modelling is carried out. The verification indicates that most statistics from most
of the historical series lie within the 90 percent confidence limits of the 50,000 replicates from the stochastic rainfall
model. Most of the observed values, particularly the mean and standard deviation, are close to the median values from
the 50,000 replicates. The observed skewness for the 1997 to 2006 period are generally lower than the median values
from the 50,000 replicates, but are mostly within the 90 percent confidence limits. The plots also highlight the wider
confidence limits and therefore greater parameter uncertainties in the statistics estimated from ten years of data (1997–
2006) compared to the statistics estimated from 112 years of data (1895–2006).
3.3 Disaggregation of annual rainfall
The 100 replicates of 112-year annual rainfall series (averaged over an entire region) are disaggregated spatially and
temporally to obtain daily rainfall series for 0.05o x 0.05o grids across the region. This is undertaken for each year of the
generated series by first selecting a ‘similar’ year in the historical record to that of the generated annual rainfall, and then
disaggregating the generated annual rainfall spatially and temporally using the observed rainfall pattern from that ‘similar’
year (and scaling the rainfall such that the annual rainfall over the region is the same as the generated annual rainfall).
For the other climate data, the data from the ‘similar’ year are used directly.
The modified method of fragments approach of Maheepala and Perera (1996) is used to determine the observed year
used for disaggregation. This method chooses the ‘similar’ year based on two criteria: it has a similar annual rainfall as
the stochastically generated annual rainfall; and the January rainfall for that year gives a realistic rainfall correlation from
December (from the previous year which has already been obtained) to January.
© CSIRO 2008 Climate data for hydrologic scenario modelling across the Murray-Darling Basin ▪ 11
Figure 3-2. Comparison of statistics of the 50,000 112-year stochastic annual rainfall replicates with statistics of the historical data.
Plots show the 5th percentile (lower yellow whisker), median (red line) and 95th percentile (upper yellow whisker)
values from the 50,000 replicates and the values for the historical data.
For each region, the statistics on the left are for 1895–2006 and those on the right are for 1997–2006.
12 ▪ Climate data for hydrologic scenario modelling across the Murray-Darling Basin © CSIRO 2008
4 Future climate data (Scenario C)
4.1 Method
The future climate scenario (Scenario C) is used to assess the range of possible climate conditions around the year
2030. Forty-five future climate variants, each with 112 years of daily climate sequences for 0.05o x 0.05o grid cells across
the Murray-Darling Basin (MDB), are used for the rainfall-runoff modelling. The future climate variants come from scaling
the 1895 to 2006 climate data to represent the climate around 2030, based on analyses of 15 global climate models
(GCMs) and three global warming scenarios.
The steps used to obtain the 45 112-year daily climate series are summarised below.
• Three global warming scenarios for ~2030 relative to ~1990 are used: high, medium and low. These three
scenarios are inferred from the Fourth Assessment Report of the Intergovernmental Panel on Climate Change
(IPCC AR4) (IPCC, 2007) and the latest climate change projections for Australia (CSIRO and Australian Bureau
of Meteorology, 2007). This step is described in detail in Section 4.2.
• Archived monthly simulations from 15 IPCC AR4 GCMs are analysed to estimate the change in rainfall and
other climate variables per degree of global warming. Each GCM is analysed separately. Data from each of the
four seasons are also analysed separately. This step is described in detail in Section 4.3.
• The percent changes in the climate variables per degree of global warming for each of the four seasons from
the 15 GCMs are then multiplied by the change in temperature for each of the three levels of global warming to
obtain the 45 sets of ‘seasonal scaling’ factors. The seasonal scaling factors are then used to scale the
historical daily climate data from 1895 to 2006 to obtain the 45 future climate variants, each with 112 years of
daily climate data. The rainfall and other climate projections for ~2030 relative to ~1990 are presented in
Section 4.4.
• The changes in the daily rainfall distribution are also considered by scaling the different rainfall amounts
differently. This is described in detail in Section 4.5.
The method used here takes into account two types of uncertainties. The first uncertainty is in the global warming
projection, due to the uncertainties associated with projecting greenhouse gas emissions and predicting how sensitive
the global climate is to greenhouse gas concentrations. The second uncertainty is in GCM modelling of local climate in
the MDB. The method also takes into account different changes in each of the four seasons as well as changes in the
daily rainfall distribution. The consideration of changes in the daily rainfall distribution is important because many GCMs
indicate that future extreme rainfall in an enhanced greenhouse climate is likely to be more intense, even in some
regions where a decrease in mean seasonal or annual rainfall is projected. As high rainfall events generate large runoff,
the use of simpler methods that assume the entire rainfall distribution to change in the same way would lead to an
underestimation of total runoff.
There are simpler as well as more complex methods to obtain future catchment-scale climate data to drive hydrological
models (see Chiew (2006a) for overview of methods). In particular, statistical and dynamic downscaling methods that
relate large synoptic-scale atmospheric variables to catchment-scale rainfall can potentially provide more reliable future
rainfall inputs to drive hydrological models. However, the use of downscaling methods was not possible given the time
constraints of this project. The downscaling methods also may not necessarily provide more reliable future rainfall than
the method used in this project because: (i) downscaling research is still developing and has not been used for
hydrologic investigations of this scale; (ii) it is difficult to calibrate the downscaling method for a large region like the
MDB; and (iii) there are limited archived daily GCM simulations from which to downscale to provide the range of
uncertainties in the future climate.
The method used here is similar to, but not the same as, the approach used by CSIRO and Australian Bureau of
Meteorology (2007) (http://www.climatechangeinaustralia.gov.au) to provide the climate change projections for Australia.
The key differences are: (i) this project uses 15 of the 23 IPCC AR4 GCMs, while the CSIRO/BoM projections use all
23 GCMs; (ii) this project assesses the extreme range of global warming by ~2030; and (iii) this project also considers
changes in the daily rainfall distribution.
© CSIRO 2008 Climate data for hydrologic scenario modelling across the Murray-Darling Basin ▪ 13
As the future climate series (Scenario C) is obtained by scaling the historical daily climate series from 1895 to 2006
(Scenario A), the daily climate series for Scenarios A and C have the same length of data (112 years) and the same
sequence of daily climate (for example, potential changes in the frequency and timing of daily rainfall are not
considered). Scenario C is therefore not a forecast climate at 2030, but a 112-year daily climate series based on 1895 to
2006 data for projected global temperatures at ~2030 relative to ~1990.
4.2 Global warming
This section summarises the global warming projections leading to the three global warming scenarios used for this
project. A comprehensive picture of the present state of knowledge on global climate change can be found in the IPCC
AR4 (IPCC, 2007; http://www.ipcc.ch). The recently released CSIRO and Australian Bureau of Meteorology (2007) report
provides detailed future projections of Australian climate and discusses past climate characteristics and drivers of
Australian climate.
There is an increasing body of research that supports a picture of a warming world with significant changes in regional
climate systems. Eleven of the last 12 years rank among the 12 warmest years in the instrumental record of global
surface temperature (since 1850) and the linear warming trend over the last 50 years is about 0.13oC per decade (IPCC,
2007). However, since 1976, the global temperature has risen more sharply at 0.18oC per decade (WMO, 2006). The
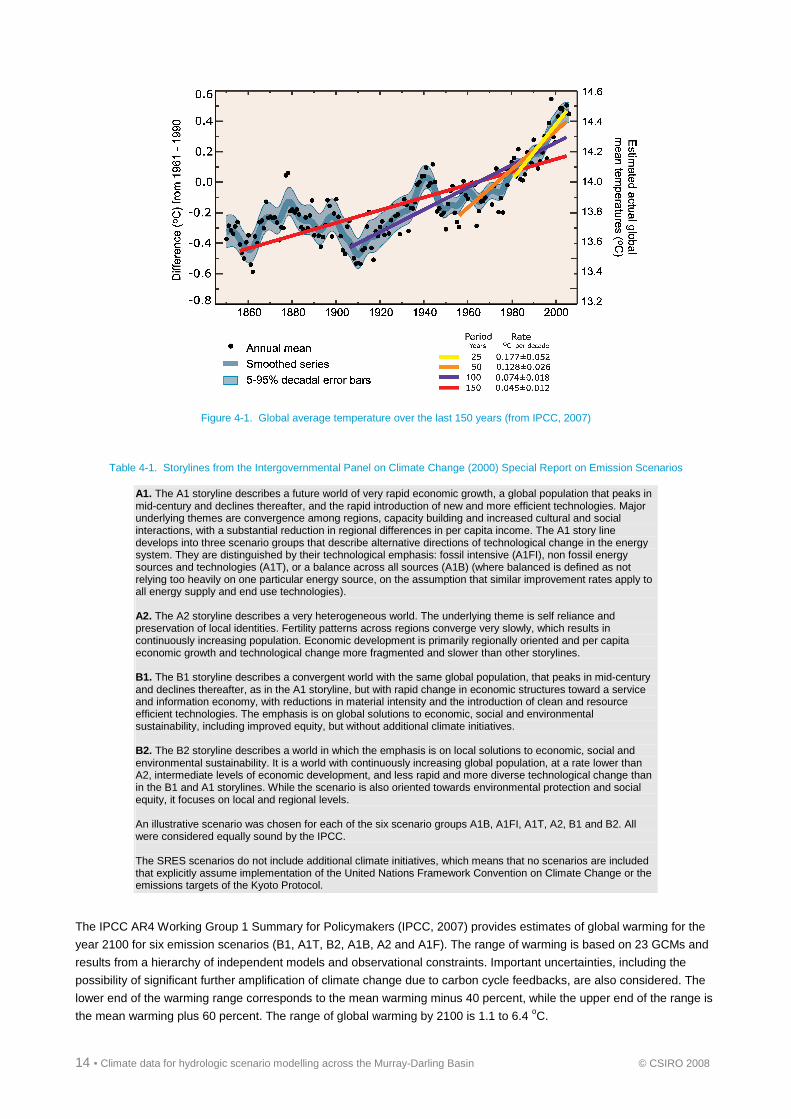
global average temperature over the last 150 years is shown in Figure 4-1. Based on many lines of evidence including
the widespread warming of the atmosphere and ocean, together with ice mass loss, the IPCC (2007) concluded that
most of the observed increase in the global average temperature since the mid-20th century is very likely due to the
observed increase in anthropogenic greenhouse gas concentrations.
The global climate system is highly complex, and therefore it is inappropriate to simply extrapolate past trends to predict
future conditions. To estimate future climate change, scientists have developed emission scenarios for greenhouse
gases and aerosols. The greenhouse gas emissions considered here are those due to human activities, such as energy
generation, transport, agriculture, land clearing, industrial processes and waste. To provide a basis for estimating future
climate change, the IPCC (2000) Special Report on Emission Scenarios (SRES) prepared 40 greenhouse gas and
sulphate aerosol emission scenarios for the 21st century that combine a variety of assumptions about demographic,
economic and technological factors likely to influence future emissions. Each scenario represents a variation within one
of four ‘storylines’ (A1, A2, B1 and B2, see Table 4-1) with projected carbon dioxide, methane, nitrous oxide and sulphate
aerosol emissions associated with each of the scenarios.
Increasing concentrations of greenhouse gases affect the radiative balance of the Earth. The balance between incoming
solar radiation and outgoing heat radiation defines the Earth’s radiative budget and average temperature. Radiative
forcing is the term given to an externally imposed change in the radiation balance, such as changes in atmospheric
concentrations of greenhouse gases. Carbon dioxide dominates the radiative forcing and has a warming effect.
14 ▪ Climate data for hydrologic scenario modelling across the Murray-Darling Basin © CSIRO 2008
Figure 4-1. Global average temperature over the last 150 years (from IPCC, 2007)
Table 4-1. Storylines from the Intergovernmental Panel on Climate Change (2000) Special Report on Emission Scenarios
A1. The A1 storyline describes a future world of very rapid economic growth, a global population that peaks in mid-century and declines thereafter, and the rapid introduction of new and more efficient technologies. Major underlying themes are convergence among regions, capacity building and increased cultural and social interactions, with a substantial reduction in regional differences in per capita income. The A1 story line develops into three scenario groups that describe alternative directions of technological change in the energy system. They are distinguished by their technological emphasis: fossil intensive (A1FI), non fossil energy sources and technologies (A1T), or a balance across all sources (A1B) (where balanced is defined as not relying too heavily on one particular energy source, on the assumption that similar improvement rates apply to all energy supply and end use technologies). A2. The A2 storyline describes a very heterogeneous world. The underlying theme is self reliance and preservation of local identities. Fertility patterns across regions converge very slowly, which results in continuously increasing population. Economic development is primarily regionally oriented and per capita economic growth and technological change more fragmented and slower than other storylines. B1. The B1 storyline describes a convergent world with the same global population, that peaks in mid-century and declines thereafter, as in the A1 storyline, but with rapid change in economic structures toward a service and information economy, with reductions in material intensity and the introduction of clean and resource efficient technologies. The emphasis is on global solutions to economic, social and environmental sustainability, including improved equity, but without additional climate initiatives. B2. The B2 storyline describes a world in which the emphasis is on local solutions to economic, social and environmental sustainability. It is a world with continuously increasing global population, at a rate lower than A2, intermediate levels of economic development, and less rapid and more diverse technological change than in the B1 and A1 storylines. While the scenario is also oriented towards environmental protection and social equity, it focuses on local and regional levels. An illustrative scenario was chosen for each of the six scenario groups A1B, A1FI, A1T, A2, B1 and B2. All were considered equally sound by the IPCC. The SRES scenarios do not include additional climate initiatives, which means that no scenarios are included that explicitly assume implementation of the United Nations Framework Convention on Climate Change or the emissions targets of the Kyoto Protocol.
The IPCC AR4 Working Group 1 Summary for Policymakers (IPCC, 2007) provides estimates of global warming for the
year 2100 for six emission scenarios (B1, A1T, B2, A1B, A2 and A1F). The range of warming is based on 23 GCMs and
results from a hierarchy of independent models and observational constraints. Important uncertainties, including the
possibility of significant further amplification of climate change due to carbon cycle feedbacks, are also considered. The
lower end of the warming range corresponds to the mean warming minus 40 percent, while the upper end of the range is
the mean warming plus 60 percent. The range of global warming by 2100 is 1.1 to 6.4 oC.

© CSIRO 2008 Climate data for hydrologic scenario modelling across the Murray-Darling Basin ▪ 15
Equivalent global warming values for 2030 are not provided by the IPCC (2007). The values required for this project and
for broader Australian projections have been derived in a way that is consistent with the approach used by IPCC (2007)
for 2100. The result is three predictions of the temperature change by ~2030 relative to ~1990: a low global warming of
0.45oC (low end of SRES B1), medium global warming of 1.03oC (average of the low and high global warming
scenarios), and high global warming of 1.60oC (high end of SRES A1T). These values are taken from Table 4.3 of the
CSIRO and Australian Bureau of Meteorology (2007) study.
4.3 Change in climate variables per degree global warming
Global warming will lead to changes in regional climate. GCMs are the best tools available for simulating global and
regional climate systems. There have been rapid improvements in climate modelling over the last few decades and the
results from GCMs have been compared to a wealth of observational data. However, although GCMs have reasonable
skill in simulating past climate and therefore providing some confidence in their use for climate projections, the range of
future climate predictions from different GCMs is often large.
To account for the uncertainty in GCM simulation of future climate across the MDB, archived results from 15 of the
23 IPCC AR4 GCMs are used in this project. The GCM data are obtained from the Program for Climate Model Diagnosis
and Intercomparison (PCMDI) website (http://www-pcmdi.llnl.gov). This project uses data from only 15 of the 23 GCMs
because Scenario C future climate series were required to run the hydrological models in June 2007, and at that time
only 15 GCMs were analysed and readily available. These 15 GCMs also have readily available daily rainfall data. In
comparison, the CSIRO and Bureau of Meteorology (2007) climate change projections for Australia released in October
2007 used data from all 23 GCMs. The CSIRO and Bureau of Meteorology study also used weights to favour the use of
GCMs that best reproduce the observed historical climate (rainfall, temperature and sea level pressure) across Australia.
The weights in the CSIRO and Bureau of Meteorology study vary from 0.3 to 0.7, with the weights of the 15 GCMs used
in this project all being above 0.5.
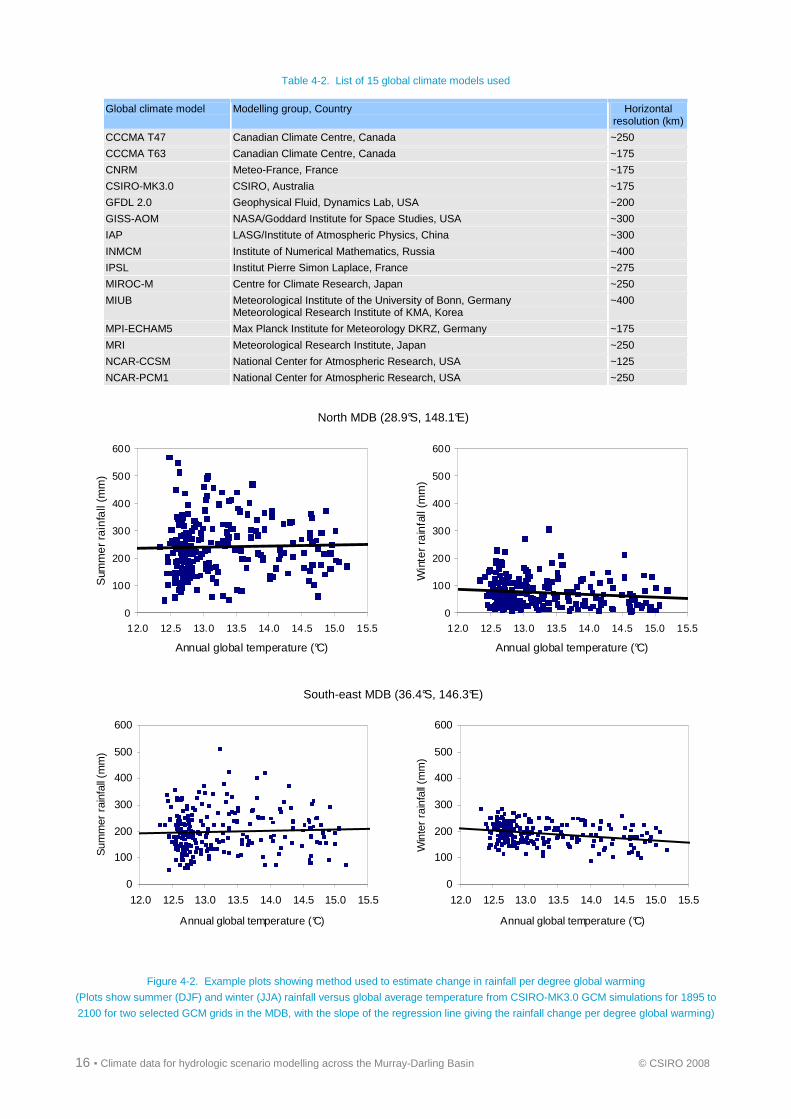
The 15 GCMs used are listed in Table 4-2. Monthly rainfall and other climate data are available for these GCMs for the
period 1870 to 2100. For each GCM, and for each season and each GCM grid point, the simulated rainfall (or other
climate variable) is plotted against simulated global average temperature. A linear regression is fitted through the data
points and the slope of the linear regression gives the change in rainfall (or other climate variable) per degree of global
warming (see Figure 4-2). The absolute change in the climate variable per degree of global warming is converted to a
percent change per degree global warming relative to the model baseline climate of 1975 to 2005 (except in the case of
temperature where the absolute value is used). In particular, the percent change is used for rainfall to reduce the effect of
errors in the baseline climate on the magnitude of the simulated change (Whetton et al., 2005). One of the advantages of
this method is that it decouples the model’s response from the particular emission scenario used in the simulation, and
the resultant change per degree global warming can be rescaled by the global warming values for any scenario.
Combinations of results from many runs for the same GCM are used (generally all A1B simulations for rainfall and
temperature, and a combination of A1B and A2 runs for the other climate variables) to estimate the change in the climate
variable per degree global warming. Relative humidity and incoming solar radiation data are not available for seven
GCMs and are instead obtained from another GCM which matches the change in temperature most closely for each of
these seven GCMs.
16 ▪ Climate data for hydrologic scenario modelling across the Murray-Darling Basin © CSIRO 2008
Table 4-2. List of 15 global climate models used
Global climate model Modelling group, Country Horizontal resolution (km)
CCCMA T47 Canadian Climate Centre, Canada ~250
CCCMA T63 Canadian Climate Centre, Canada ~175
CNRM Meteo-France, France ~175
CSIRO-MK3.0 CSIRO, Australia ~175
GFDL 2.0 Geophysical Fluid, Dynamics Lab, USA ~200
GISS-AOM NASA/Goddard Institute for Space Studies, USA ~300
IAP LASG/Institute of Atmospheric Physics, China ~300
INMCM Institute of Numerical Mathematics, Russia ~400
IPSL Institut Pierre Simon Laplace, France ~275
MIROC-M Centre for Climate Research, Japan ~250
MIUB Meteorological Institute of the University of Bonn, Germany Meteorological Research Institute of KMA, Korea
~400
MPI-ECHAM5 Max Planck Institute for Meteorology DKRZ, Germany ~175
MRI Meteorological Research Institute, Japan ~250
NCAR-CCSM National Center for Atmospheric Research, USA ~125
NCAR-PCM1 National Center for Atmospheric Research, USA ~250
North MDB (28.9°S, 148.1°E)
0
100
200
300
400
500
600
12.0 12.5 13.0 13.5 14.0 14.5 15.0 15.5
Annual global temperature (°C)
Sum
me
r rai
nfa
ll (m
m)
0
100
200
300
400
500
600
12.0 12.5 13.0 13.5 14.0 14.5 15.0 15.5
Annual global temperature (°C)
Win
ter
rain
fall
(mm
)
South-east MDB (36.4°S, 146.3°E)
0
100
200
300
400
500
600
12.0 12.5 13.0 13.5 14.0 14.5 15.0 15.5
Annual global temperature (°C)
Sum
mer
rai
nfal
l (m
m)
0
100
200
300
400
500
600
12.0 12.5 13.0 13.5 14.0 14.5 15.0 15.5
Annual global temperature (°C)
Win
ter
rain
fall
(mm
)
Figure 4-2. Example plots showing method used to estimate change in rainfall per degree global warming
(Plots show summer (DJF) and winter (JJA) rainfall versus global average temperature from CSIRO-MK3.0 GCM simulations for 1895 to
2100 for two selected GCM grids in the MDB, with the slope of the regression line giving the rainfall change per degree global warming)

© CSIRO 2008 Climate data for hydrologic scenario modelling across the Murray-Darling Basin ▪ 17
4.4 Climate change projections for ~2030
The percent changes in the climate variables per degree global warming for each of the four seasons for the 15 GCMs
from Section 4.3 are multiplied by the change in temperature for each of the three global warming scenarios in Section
4.2 to obtain the 45 sets of ‘seasonal scaling’ factors. The seasonal scaling factors are then used to scale the historical
daily climate data from 1895 to 2006 to obtain the 45 future climate variants, each with 112 years of daily climate data.
The climate inputs required to run the rainfall-runoff model are daily rainfall and areal potential evapotranspiration
(APET). The climate data are also used for the river system and groundwater recharge modelling. Rainfall is the main
driver of runoff, with a 1 percent change in mean annual rainfall generally amplified to a 2 to 3.5 percent change in mean
annual runoff. A 1 percent increase in mean annual APET generally leads to a 0.5 to 0.8 percent decrease in mean
annual runoff (Chiew, 2006b; Jones et al., 2006). These are very general rules of thumb, and the daily future climate
series obtained here are used in the rainfall-runoff modelling to provide more accurate results (see Chiew et al., 2008).
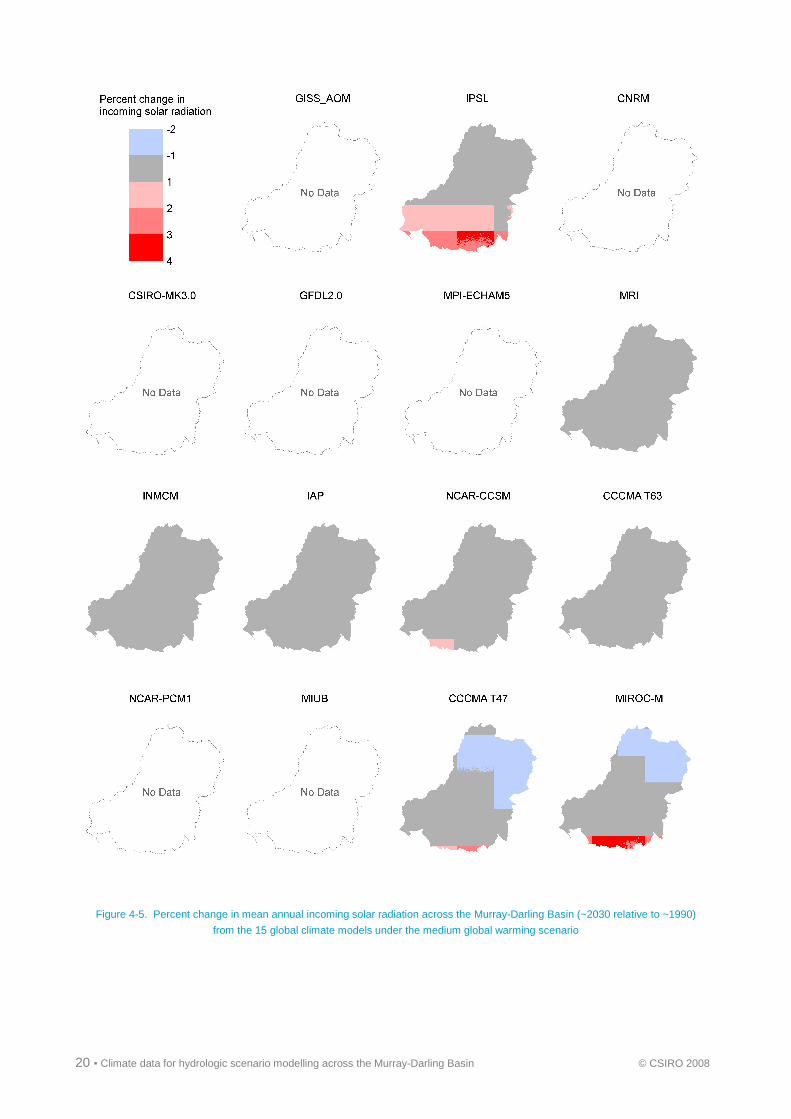
Figures 4-3, 4-4, 4-5 and 4-6 show the percent change in mean annual temperature, relative humidity, incoming solar
radiation and APET, respectively, for ~2030 relative to ~1990 from the 15 GCMs for the medium global warming
scenario. There is much better agreement in the future temperature projections from the 15 GCMs compared to the
rainfall projections. The projections for the medium global warming scenario generally show a temperature increase of
0.6 to 1.5 oC, with the northern MDB showing greater warming. The GCMs indicate that the change in relative humidity
by ~2030 relative to ~1990 is generally less than 3 percent and that the change in incoming solar radiation is generally
less than 1 percent.
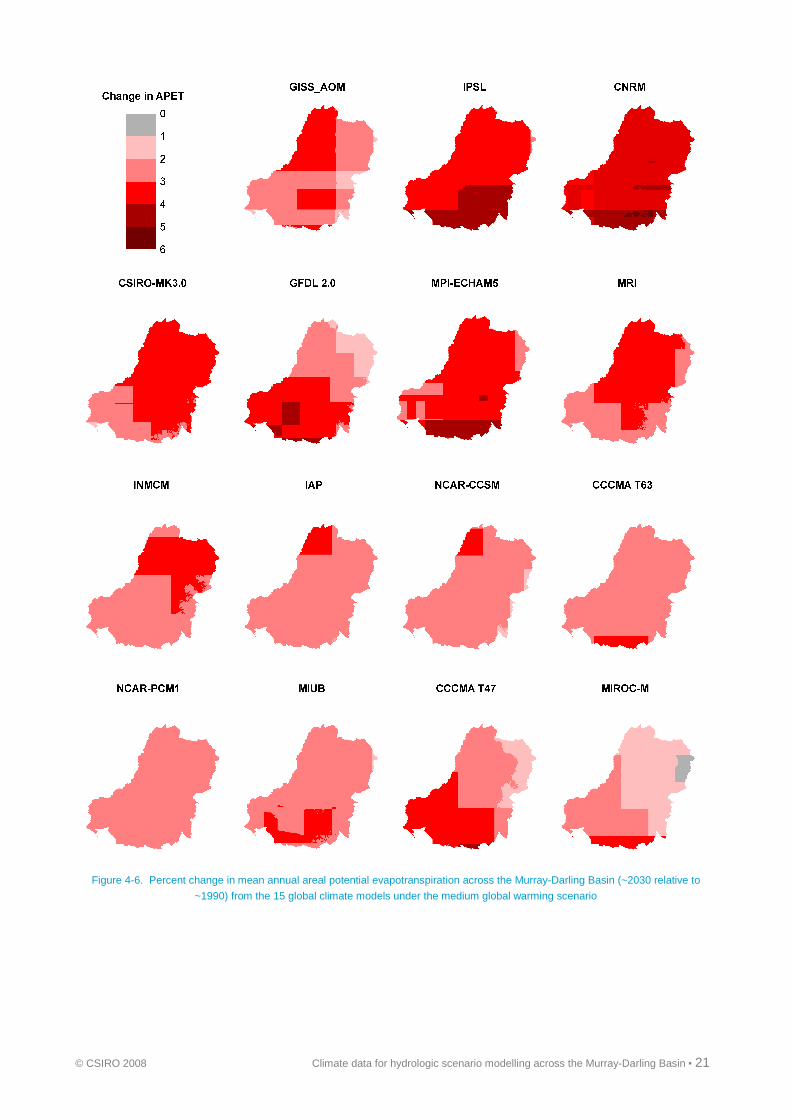
The temperature, relative humidity and incoming solar radiation are not used directly for the rainfall-runoff modelling, but
are used to calculate the APET series required to run the rainfall-runoff model. In the analyses here, the daily historical
temperature series from 1895 to 2006 is first increased by the temperature change in Figure 4-3 and the relative humidity
and incoming solar radiation are scaled by the changes in Figures 4-4 and 4-5, respectively, to generate 112 years of
future (~2030) daily climate series. The future climate series is then used to calculate the future APET series using the
evapotranspiration algorithms described in Section 2.3. The results indicate that the mean annual APET in ~2030 relative
to ~1990 for the medium global warming scenario will increase by 2 to 4 percent (Figure 4-6).

18 ▪ Climate data for hydrologic scenario modelling across the Murray-Darling Basin © CSIRO 2008
Figure 4-3. Percent change in mean annual temperature across the Murray-Darling Basin (~2030 relative to ~1990)
from the 15 global climate models under the medium global warming scenario

© CSIRO 2008 Climate data for hydrologic scenario modelling across the Murray-Darling Basin ▪ 19
Figure 4-4. Percent change in mean annual relative humidity across the Murray-Darling Basin (~2030 relative to ~1990)
from the 15 global climate models under the medium global warming scenario
20 ▪ Climate data for hydrologic scenario modelling across the Murray-Darling Basin © CSIRO 2008
Figure 4-5. Percent change in mean annual incoming solar radiation across the Murray-Darling Basin (~2030 relative to ~1990)
from the 15 global climate models under the medium global warming scenario
© CSIRO 2008 Climate data for hydrologic scenario modelling across the Murray-Darling Basin ▪ 21
Figure 4-6. Percent change in mean annual areal potential evapotranspiration across the Murray-Darling Basin (~2030 relative to
~1990) from the 15 global climate models under the medium global warming scenario
22 ▪ Climate data for hydrologic scenario modelling across the Murray-Darling Basin © CSIRO 2008
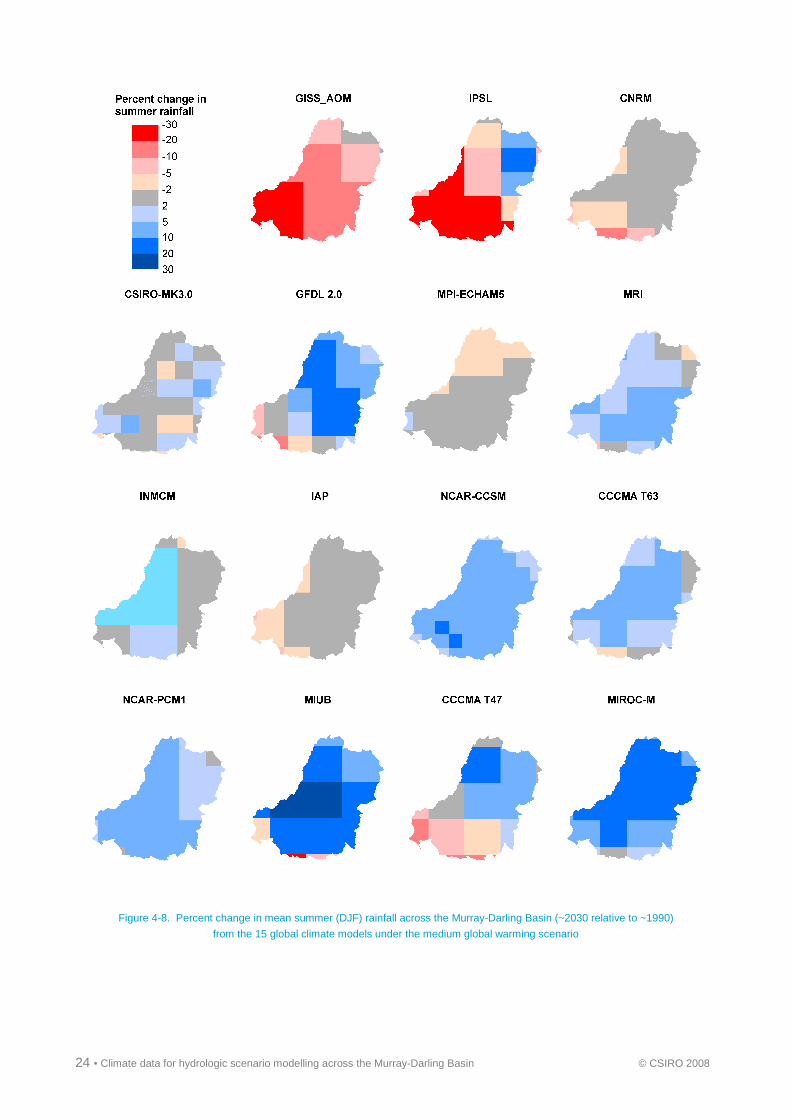
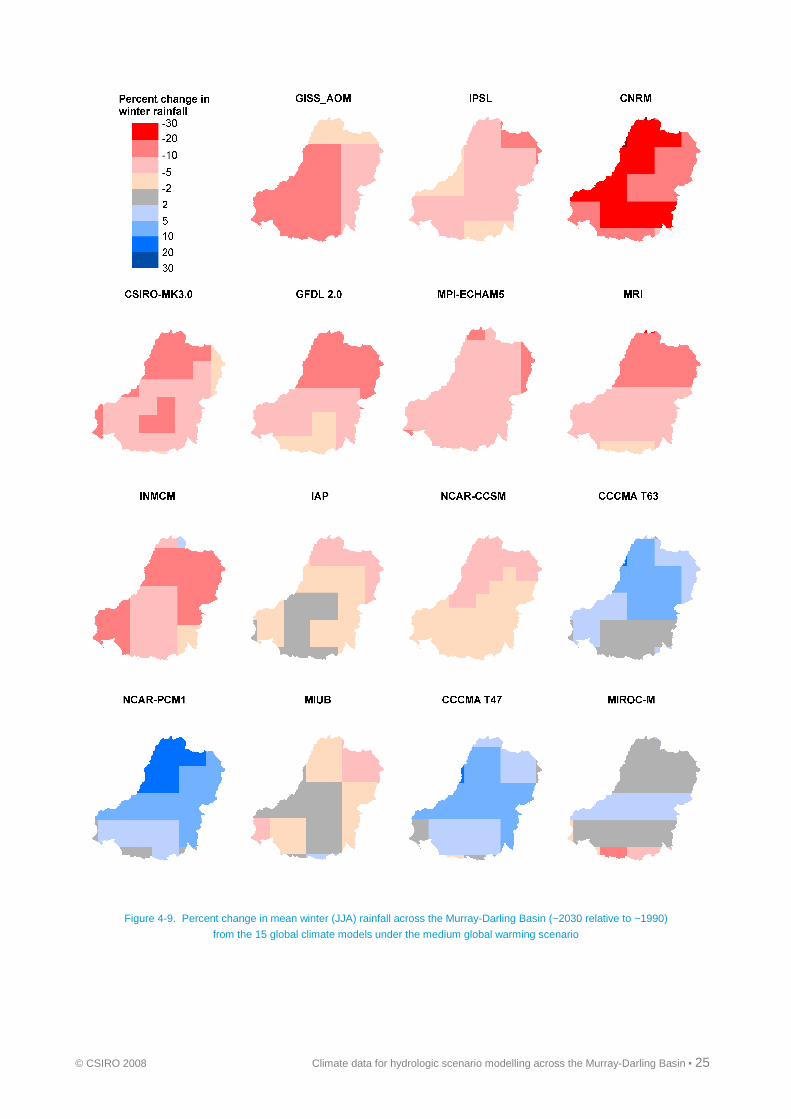
Figures 4-7, 4-8 and 4-9 show the percent change in mean annual, summer, and winter rainfall, respectively, for ~2030
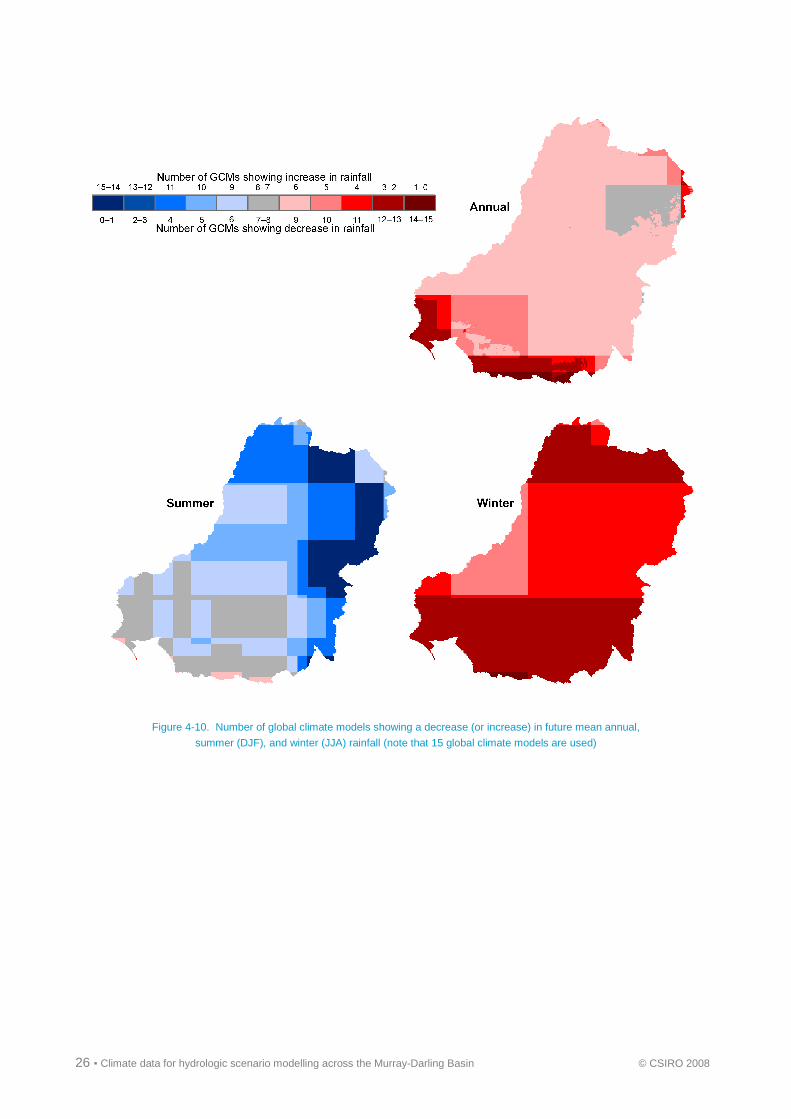
relative to ~1990 from the 15 GCMs for the medium global warming scenario. Figure 4-10 shows the number of GCMs
that indicate a decrease in mean annual, summer, and winter rainfall. The results indicate that the potential changes in
rainfall as a result of global warming can be very significant. However, there are considerable differences in the rainfall
projections between GCMs, although the majority of GCMs shows a decrease in future mean annual rainfall. In the
southern MDB, two-thirds to three-quarters of the GCMs show a decrease in mean annual rainfall. In the middle and
northern parts of the MDB, one-half to two-thirds of the GCMs show a decrease in mean annual rainfall (Figures 4-7 and
4-10).
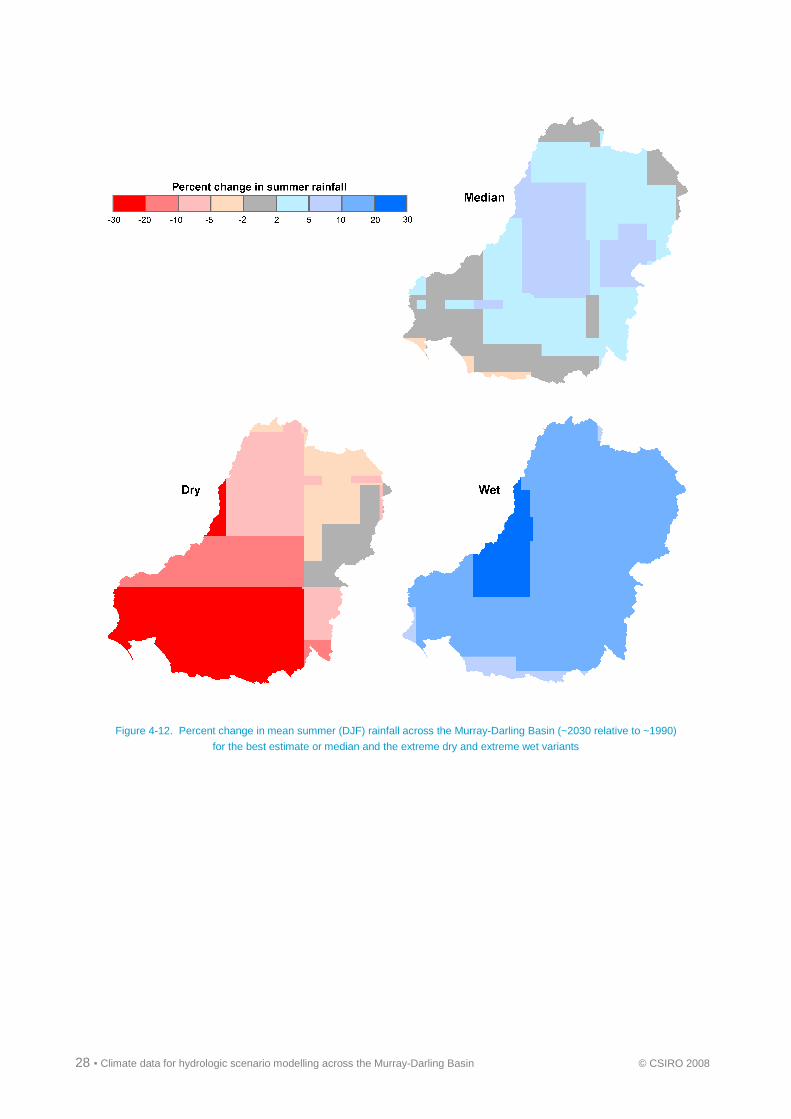
The majority of the GCMs indicate that future summer rainfall in the northern half of the MDB will increase, while similar
numbers of GCMs show decreases and increases in summer rainfall in the southern half of the MDB (Figures 4-8 and
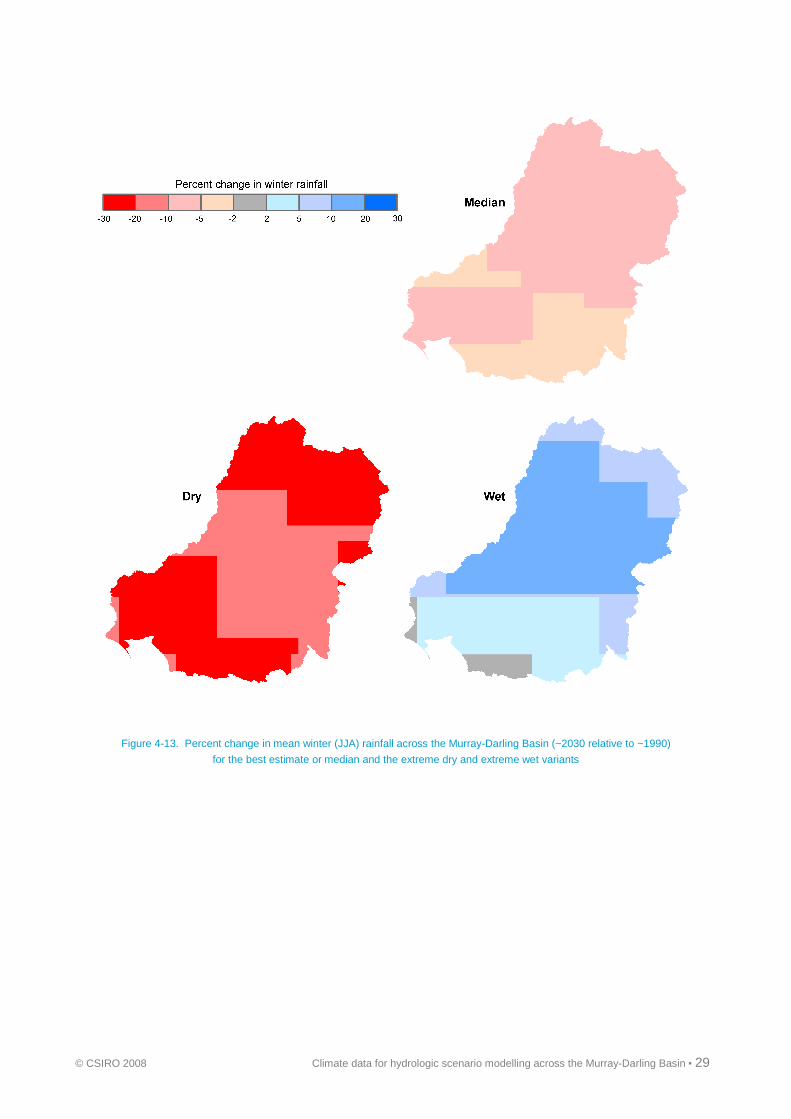
4-10). The GCM projections indicate that future winter rainfall is likely to be lower across the MDB, with almost all the
GCMs showing less future winter rainfall in the southern half of the MDB, and more than two-thirds of the GCMs showing
less winter rainfall in the northern half of the MDB (Figures 4-9 and 4-10).
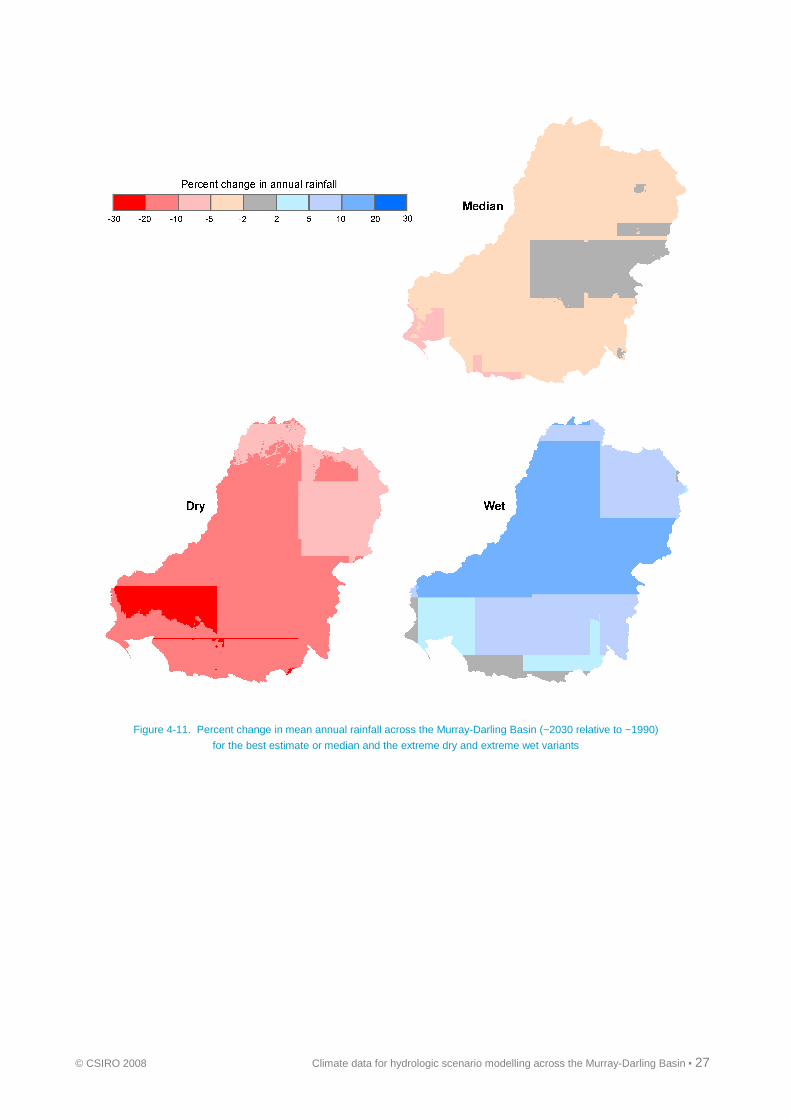
As the seasonal scaling factors for the 45 future climate variants are obtained by multiplying the percent changes per
degree global warming obtained from the 15 GCMs by the change in temperature for low, medium and high global
warming, the driest and wettest variant will come from the high global warming scenario. The best estimate or median of
the change in mean annual, summer, and winter rainfall and the extreme range of changes for the 0.05o by 0.05o grids
across the MDB are shown in Figures 4-11, 4-12 and 4-13, respectively. The best estimate or median is defined as the
median result from the 15 GCMs for the medium global warming scenario. The extreme dry estimate is defined as the
second driest result from the high global warming scenario. The extreme wet estimate is defined as the second wettest
result from the high global warming scenario. The second driest and second wettest results are used because they
represent about the 10th and 90th percentile results. It should also be noted that the plots show results at 0.05o grid cells,
which are different to those used for the whole-of-region river system modelling reported in the regional reports from the
Murray-Darling Basin Sustainable Yields Project. In the whole-of-region river system modelling, results from a single
GCM (for each of the extreme dry, median and extreme wet) is used for each region, based on modelled mean annual
runoff averaged over the region (see regional reports or Chiew et al., 2008).
The best estimate or median indicates that the future mean annual rainfall in the MDB in ~2030 relative to ~1990 will be
lower, by about 2 percent in the north to 5 percent in the south. Averaged across the MDB, the best estimate or median
is a 2.8 percent decrease in mean annual rainfall. There is considerable uncertainty in the projections, with the extreme
dry and extreme wet estimates in the northern half of the MDB ranging from a 10 to 15 percent decrease to a 10 to
15 percent increase in mean annual rainfall. In the southern half of the MDB, the extreme estimates range from a 15 to
20 percent decrease in mean annual rainfall to a 5 to 10 percent increase in mean annual rainfall. In the southernmost
MDB, the extreme estimates range from a decrease in mean annual rainfall of up to 20 percent to little change in mean
annual rainfall (Figure 4-11). Averaged across the MDB, the extreme estimates range from a 13 percent decrease to an
8 percent increase in mean annual rainfall.
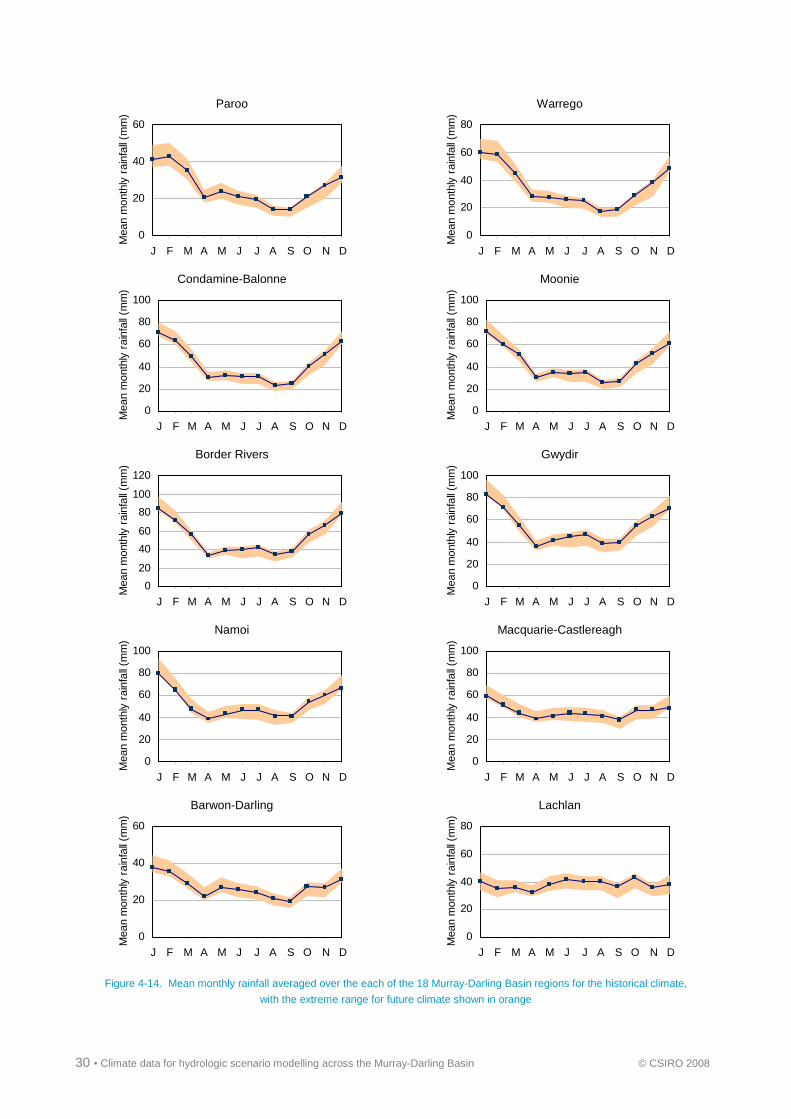
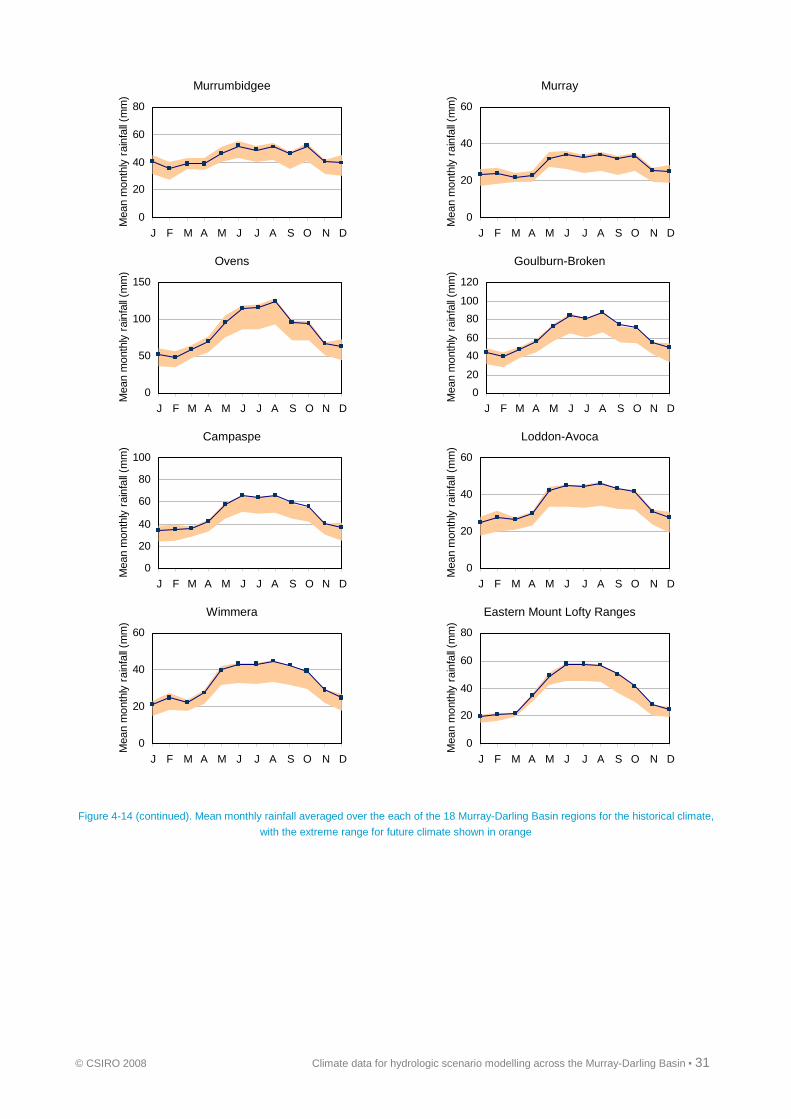
Figure 4-14 shows the mean monthly rainfall averaged over the 18 MDB regions defined for this project (see Figure 3-1
for the region locations), and the extreme range for the ~2030 climate. The extreme range is determined separately for
each month from the high global warming scenario, with the second driest and the second wettest monthly result defining
the lower bound and the upper bound, respectively.
In the northern regions, most of the rainfall occurs in the summer half of the year, and in the southernmost regions, most
of the rainfall occurs in the winter half of the year. The plots also highlight the considerable differences between GCM
projections, particularly in the northern regions. In the southernmost regions (Eastern Mount Lofty, Wimmera, Loddon-
Avoca, Campaspe, Goulburn-Broken and Ovens), all the GCMs predict a decrease in rainfall in the winter half of the year
when most of the rainfall and runoff occurs.

© CSIRO 2008 Climate data for hydrologic scenario modelling across the Murray-Darling Basin ▪ 23
Figure 4-7. Percent change in mean annual rainfall across the Murray-Darling Basin (~2030 relative to ~1990)
from the 15 global climate models under the medium global warming scenario
24 ▪ Climate data for hydrologic scenario modelling across the Murray-Darling Basin © CSIRO 2008
Figure 4-8. Percent change in mean summer (DJF) rainfall across the Murray-Darling Basin (~2030 relative to ~1990)
from the 15 global climate models under the medium global warming scenario
© CSIRO 2008 Climate data for hydrologic scenario modelling across the Murray-Darling Basin ▪ 25
Figure 4-9. Percent change in mean winter (JJA) rainfall across the Murray-Darling Basin (~2030 relative to ~1990)
from the 15 global climate models under the medium global warming scenario
26 ▪ Climate data for hydrologic scenario modelling across the Murray-Darling Basin © CSIRO 2008
Figure 4-10. Number of global climate models showing a decrease (or increase) in future mean annual,
summer (DJF), and winter (JJA) rainfall (note that 15 global climate models are used)
© CSIRO 2008 Climate data for hydrologic scenario modelling across the Murray-Darling Basin ▪ 27
Figure 4-11. Percent change in mean annual rainfall across the Murray-Darling Basin (~2030 relative to ~1990)
for the best estimate or median and the extreme dry and extreme wet variants
28 ▪ Climate data for hydrologic scenario modelling across the Murray-Darling Basin © CSIRO 2008
Figure 4-12. Percent change in mean summer (DJF) rainfall across the Murray-Darling Basin (~2030 relative to ~1990)
for the best estimate or median and the extreme dry and extreme wet variants
© CSIRO 2008 Climate data for hydrologic scenario modelling across the Murray-Darling Basin ▪ 29
Figure 4-13. Percent change in mean winter (JJA) rainfall across the Murray-Darling Basin (~2030 relative to ~1990)
for the best estimate or median and the extreme dry and extreme wet variants
30 ▪ Climate data for hydrologic scenario modelling across the Murray-Darling Basin © CSIRO 2008
Paroo Warrego
0
20
40
60
J F M A M J J A S O N D
Mea
n m
onth
ly r
ainf
all (
mm
)
0
20
40
60
80
J F M A M J J A S O N D
Mea
n m
onth
ly r
ainf
all (
mm
)
Condamine-Balonne Moonie
0
20
40
60
80
100
J F M A M J J A S O N D
Mea
n m
onth
ly r
ainf
all (
mm
)
0
20
40
60
80
100
J F M A M J J A S O N D
Mea
n m
onth
ly r
ainf
all (
mm
)
Border Rivers Gwydir
0
20
40
60
80
100
120
J F M A M J J A S O N D
Mea
n m
onth
ly r
ainf
all (
mm
)
0
20
40
60
80
100
J F M A M J J A S O N D
Mea
n m
onth
ly r
ainf
all (
mm
)
Namoi Macquarie-Castlereagh
0
20
40
60
80
100
J F M A M J J A S O N D
Mea
n m
onth
ly r
ainf
all (
mm
)
0
20
40
60
80
100
J F M A M J J A S O N D
Mea
n m
onth
ly r
ainf
all (
mm
)
Barwon-Darling Lachlan
0
20
40
60
J F M A M J J A S O N D
Mea
n m
onth
ly r
ainf
all (
mm
)
0
20
40
60
80
J F M A M J J A S O N D
Mea
n m
onth
ly r
ainf
all (
mm
)
Figure 4-14. Mean monthly rainfall averaged over the each of the 18 Murray-Darling Basin regions for the historical climate,
with the extreme range for future climate shown in orange
© CSIRO 2008 Climate data for hydrologic scenario modelling across the Murray-Darling Basin ▪ 31
Murrumbidgee Murray
0
20
40
60
80
J F M A M J J A S O N D
Mea
n m
onth
ly r
ainf
all (
mm
)
0
20
40
60
J F M A M J J A S O N D
Mea
n m
onth
ly r
ainf
all (
mm
)
Ovens Goulburn-Broken
0
50
100
150
J F M A M J J A S O N D
Mea
n m
onth
ly r
ainf
all (
mm
)
0
20
40
60
80
100
120
J F M A M J J A S O N D
Mea
n m
onth
ly r
ainf
all (
mm
)
Campaspe Loddon-Avoca
0
20
40
60
80
100
J F M A M J J A S O N D
Mea
n m
onth
ly r
ainf
all (
mm
)
0
20
40
60
J F M A M J J A S O N D
Mea
n m
onth
ly r
ainf
all (
mm
)
Wimmera Eastern Mount Lofty Ranges
0
20
40
60
J F M A M J J A S O N D
Mea
n m
onth
ly r
ainf
all (
mm
)
0
20
40
60
80
J F M A M J J A S O N D
Mea
n m
onth
ly r
ainf
all (
mm
)
Figure 4-14 (continued). Mean monthly rainfall averaged over the each of the 18 Murray-Darling Basin regions for the historical climate,
with the extreme range for future climate shown in orange
32 ▪ Climate data for hydrologic scenario modelling across the Murray-Darling Basin © CSIRO 2008
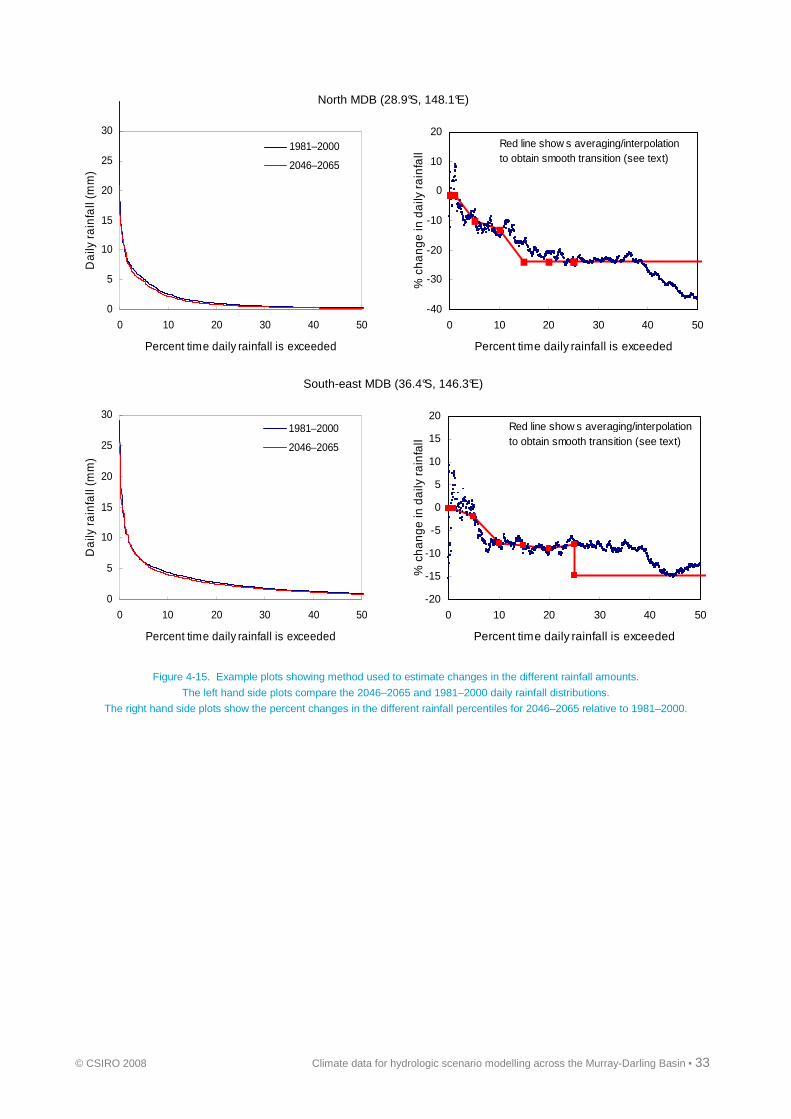
4.5 Change in future daily rainfall distribution
To account for changes in the future daily rainfall distribution, the different rainfall amounts are scaled differently. The
scaling factors for the different rainfall percentiles/amounts are determined by comparing daily rainfall simulations from
the 15 GCMs for a single SRES A1B run for two 20-year time slices, 2046 to 2065 and 1981 to 2000.
The method used is illustrated in Figure 4-15 using winter rainfall simulations from the CSIRO-MK3.0 GCM for two grid
cells, one in south-east MDB and one in northern MDB. The plots on the left compare the 2046 to 2065 and 1981 to 2000
daily rainfall distributions, and the plots on the right show all the percent changes in 2046 to 2065 rainfall relative to 1981
to 2000 rainfall at the same daily rainfall ranks/percentiles. To obtain a smooth transition in the ‘daily scaling’ factors, the
percent changes are estimated by averaging the rainfall amounts over percentile ranges: 1st percentile (all points smaller
than 2nd percentile), 5th percentile (all points between 2.5th and 7.5th percentiles), 10th percentile (all points between 7.5th
to 12.5th percentiles), and every five percentile range upwards to a highest category (see Figure 4-15), where all the
small rainfall amounts are considered together. The highest category bound is defined by the percentile at which the
observed rainfall is less than 1 mm, or the 30th percentile if the percentile at which the observed rainfall is less than 1 mm
is above the 30th percentile. Therefore, if the highest category bound is the 30th percentile, all rainfall amounts above the
30th percentile are lumped together and used to determine the single value of percent change in rainfall amounts above
the 30th percentile. The percent changes at the discrete percentile values are then interpolated to obtain the percent
changes for all the rainfall percentiles/ranks (see Figure 4-15).
Each of the four seasons is considered separately. As in the estimation of the seasonal scaling factors in Sections 4.3
and 4.4, the changes for the different rainfall percentiles are expressed as a percent change per degree global warming,
which are then multiplied by the change in temperature for each of the global warming scenarios for ~2030 relative to
~1990 to obtain changes for the different rainfall percentiles for the different global warming scenarios.
For each of the 15 GCMs and each of the three global warming scenarios, the above daily scaling factors are used to
scale the different daily rainfall amounts in the 1895 to 2006 daily rainfall series to obtain 112 years of daily rainfall series
for a ~2030 climate relative to a ~1990 climate. The entire series is then scaled, using a different constant factor for each
of the four seasons, to ensure that the mean rainfalls in the four seasons are the same as those in Section 4.4
determined using the seasonal scaling factors. This is because the seasonal scaling factors are determined using a large
number of data points from several ensemble runs from the archived GCM continuous monthly simulations over more
than 200 years, while the archived GCM daily simulations used to estimate the daily scaling factors are available only for
two time slices from limited modelling runs. In addition, because of the large spatial resolution of GCMs, the monthly
simulations are more realistic than the daily simulations.
Figure 4-16 shows the number of GCMs that indicate that the future extreme daily rainfall (1st percentile rainfall or rainfall
that is exceeded less than 1 percent of the time) will be more intense in summer and winter. Although more than three-
quarters of the GCMs show a reduction in mean winter rainfall in the southern half of the MDB (Figure 4-10), about one-
half of the GCMs indicate that the future extreme daily rainfall will be more intense (Figure 4-16).
© CSIRO 2008 Climate data for hydrologic scenario modelling across the Murray-Darling Basin ▪ 33
North MDB (28.9°S, 148.1°E)
0
5
10
15
20
25
30
0 10 20 30 40 50
Percent time daily rainfall is exceeded
Da
ily ra
infa
ll (m
m)
1981–2000
2046–2065
-40
-30
-20
-10
0
10
20
0 10 20 30 40 50
Percent time daily rainfall is exceeded
% c
han
ge
in d
aily
rain
fall
Red line show s averaging/interpolation to obtain smooth transition (see text)
South-east MDB (36.4°S, 146.3°E)
0
5
10
15
20
25
30
0 10 20 30 40 50
Percent time daily rainfall is exceeded
Da
ily r
ain
fall
(mm
)
1981–2000
2046–2065
-20
-15
-10
-5
0
5
10
15
20
0 10 20 30 40 50
Percent time daily rainfall is exceeded
% c
ha
nge
in d
aily
ra
infa
llRed line show s averaging/interpolation to obtain smooth transition (see text)
Figure 4-15. Example plots showing method used to estimate changes in the different rainfall amounts.
The left hand side plots compare the 2046–2065 and 1981–2000 daily rainfall distributions.
The right hand side plots show the percent changes in the different rainfall percentiles for 2046–2065 relative to 1981–2000.

34 ▪ Climate data for hydrologic scenario modelling across the Murray-Darling Basin © CSIRO 2008
Figure 4-16. Number of global climate models showing an increase (or decrease) in future extreme daily rainfall (1st percentile rainfall)
in summer (DJF) and winter (JJA) (note that all 15 global climate models are used)
© CSIRO 2008 Climate data for hydrologic scenario modelling across the Murray-Darling Basin ▪ 35
5 References
Chiew FHS (2006a) An overview of methods for estimating climate change impact on runoff. 30th Hydrology and Water Resources Symposium, Launceston, Dec 2006, CDROM.
Chiew FHS (2006b) Estimation of rainfall elasticity of streamflow in Australia. Hydrological Sciences Journal 51, 613-625.
Chiew FHS and Leahy C (2003) Comparison of evapotranspiration variables in Evapotranspiration Maps of Australia with commonly used evapotranspiration variables. Australian Journal of Water Resources 7, 1–11.
Chiew FHS, Vaze J, Viney NR, Jordan PW, Perraud J-M, Zhang L, Teng J, Young WJ, Penaarancibia J, Morden RA, Freebairn A, Austin J, Hill PI, Wiesenfeld CR and Murphy R (2008) Rainfall-runoff modelling across the Murray-Darling Basin. A report to the Australian government from the CSIRO Murray-Darling Basin Sustainable Yields Project. CSIRO, Australia.
CSIRO and Bureau of Meteorology (2007) Climate change in Australia. Technical report, www.climatechangeinaustralia.gov.au.
Frost AJ, Thyer M, Kuczera G and Srikanthan R (2007) A general Bayesian framework for calibrating and evaluating stochastic models of annual multi-site hydrological data. Journal of Hydrology, http://dx.doi.org/10.1016/j.jhydrol.2007.03.023.
Frost AJ, Chiew FHS, Vaze J, Davidson A, Teng J, Wang QJ and Podger GP (2008) Stochastic hydrological modelling for the Gwydir region and Goulburn Simulation Model region. A report to the Australian government from the CSIRO Murray-Darling Basin Sustainable Yields Project. CSIRO, Australia.
IPCC (2000) Special report on emission scenarios (SRES) Special Report of the Intergovernmental Panel on Climate Change (Editors: N Nakicenovic and R Swart), Cambridge University Press.
IPCC (2007) Climate Change 2007: The Physical Basis. Contributions of Working Group 1 to the Fourth Assessment Report of the Intergovernmental Panel on Climate Change. Cambridge University Press (www.ipcc.ch).
Jeffrey SJ, Carter JO, Moodie KB and Beswick AR (2001) Using spatial interpolation to construct a comprehensive archive of Australian climate data. Environmental Modelling and Software 16, 309–330.
Jones RN, Chiew FHS, Boughton WC and Zhang L (2006) Estimating the sensitivity of mean annual runoff to climate change using selected hydrological models. Advances in Water Resources 29, 1419–1429.
Maheepala S and Perera CJC (1996) Monthly hydrologic data generation by disaggregation. Journal of Hydrology 178, 277–291.
Morton FI (1983) Operational estimates of areal evapotranspiration and their significance to the science and practice of hydrology. Journal of Hydrology 66, 1–76.
Potter NJ, Chiew FHS, Frost AJ, Srikanthan R, McMahon T, Peel MC and Austin JM (2008) Characterisation of recent rainfall and runoff across the Murray-Darling Basin. A report to the Australian government from the CSIRO Murray-Darling Basin Sustainable Yields Project. CSIRO, Australia.
Whetton P, McInnes KL, Jones RJ, Hennessy KJ, Suppiah R, Page CM and Durack PJ (2005) Australian climate change projections for impact assessment and policy application: a review. CSIRO Marine and Atmospheric Research Paper 001, www.cmar.csiro.au/e-print/open/whettonph_2005a.pdf.
WMO (2006) WMO statement on the status of the global climate in 2006. World Meteorological Organisation.