technical report 1 - penn state college of engineering
TRANSCRIPT

Schenley Place Pittsburgh, Pa
Technical Report 1 Structural Concepts and Existing Conditions
Hali Voycik I Structural Option Professor M. Kevin Parfitt, PE October 5, 2009

Hali Voycik l Structural Option Schenley Place Office Building l Pittsburgh, PA Professor M. Kevin Parfitt, P.E. The Pennsylvania State University Technical Report 1 October 5, 2009
2 Technical Report 1
Table of Contents
Executive Summary .................................................................................................................... 3 Architectural Concepts .............................................................................................................. 4 Structural System Summary ...................................................................................................... 5 Foundation System Summary ........................................................................................... 5
Superstructure System Summary ..................................................................................... 6
Lateral Force Resisting Summary ..................................................................................... 8
Codes and Design Standards .................................................................................................. 10 Summary of Design Loads ....................................................................................................... 11 Load Summary .......................................................................................................................... 12
Wind Load Summary ....................................................................................................... 12
Seismic Load Summary .................................................................................................. 15
Snow Load Summary ...................................................................................................... 19
Overview ......................................................................................................................... 20
Appendices ................................................................................................................................ 21 Appendix A: Wind Load .................................................................................................. 21
Appendix B: Seismic Load ............................................................................................. 27
Appendix C: Snow Load ................................................................................................. 32
Appendix D: Spot Checks .............................................................................................. 35
Spot Check1: Typical composite floor slab ......................................................... 35
Spot Check 2: Gravity column (Column A.2) at the second floor ....................... 36
Spot Check 3: Composite Beam ........................................................................ 37

Hali Voycik l Structural Option Schenley Place Office Building l Pittsburgh, PA Professor M. Kevin Parfitt, P.E. The Pennsylvania State University Technical Report 1 October 5, 2009
3 Technical Report 1
Executive Summary
The following technical report describes the structural concepts and existing conditions of Schenley Place. The assumptions and simplifications necessary for the building’s analysis are acknowledged within the included summaries and calculations.
Schenley Place contains a total of seven levels of office space above grade and approximately three and a half levels of parking garage mostly below grade. The gravity system above grade is designed as a typical wide-flanged steel frame system, while the gravity system below grade is designed as a combination of cast-in-place concrete columns and load bearing walls. Due to the depth of competent bedrock, the deep foundation is designed as a combination of drilled cast-in-place caissons coupled with grade beams, and a perimeter caisson wall to resist underlying soils. The lateral force resisting system located at the building’s core is designed as both concentrically and eccentrically steel braced frames.
The snow, wind, and seismic analyses in this report were performed in accordance with the ASCE 7-05. The ASCE 7-05 is also the code used by the structural design professionals, Atlantic Engineering Services (AES), in the design of Schenley Place. Because AES failed to report the design base shear due to wind, a fair comparison of the 317 kips wind design base shear determined in the following report cannot be made. A seismic design base shear of 365 kips was reported by AES, while the following analysis reports a seismic design base shear of 645 kips. Because both this report and the AES used the ASCE 7-05, the apparent discrepancy of results must be attributable to some incongruence in applied variables: most likely the fundamental building period (T) or the effective seismic weight (w).
The following report includes spot checks for the composite metal deck floor slab on a typical level, as well as a wide-flange steel beam and column that are part of the typical steel frame. The spot checks performed accounted for gravity loads only. These spot checks conclude that the assumed design loads acting on the members were compiled in a comparable manner to AES. In accordance with these results, each component that AES designed is adequate. However, the large remaining strength capacities are attributable to lateral loads acting on the members subject to spot checking. This assumption will be further investigated in later reports, which will evaluate the effects of lateral loads on these structural members.

Hali Voycik l Structural Option Schenley Place Office Building l Pittsburgh, PA Professor M. Kevin Parfitt, P.E. The Pennsylvania State University Technical Report 1 October 5, 2009
4 Technical Report 1
Architectural Concepts
Schenley Place is a new office located at 4420 Bayard Street, in the heart of Oakland, an inner-city neighborhood of Pittsburgh, Pennsylvania. The building contains a total of 7 levels above grade and 3.5 levels of parking garage mostly below grade. On the fourth and remaining levels of the building’s north elevation, there is a substantial step-back in the building’s original footprint, dictated by the specialty zoning constraints placed upon the building site. The site is fully landscaped and contains a small pocket park along the building’s east elevation that is shared by the neighboring First Baptist Church of Pittsburgh.
Schenley Place has been designed to accommodate a variety of office type tenants. The first floor opens to a finished main building lobby, with remaining unfinished space available for tenant occupancy. The remaining floors have open, unfinished office space to accommodate tenants.
The exterior of Schenley Place is mainly brick and cast-stone veneer, architectural decisions driven by the design constraints based upon the location of the building site. The three-story façade, facing Bayard Street, is mainly Indiana limestone to mimic the neighboring First Baptist Church, whereas the seven-story façade, facing Ruskin Avenue, is primarily buff-colored brick to compliment Ruskin Hall, a dormitory belonging to the University of Pittsburgh. Found within the details of the building’s façade are punched aluminum windows, cast-stone cornices, sills, and headers, brick details, and aluminum curtain walls. Masonry parapets occur at the step-back on the fourth level and the roof level. The roof top penthouse is clad in metal panels and the HVAC units are disguised by metal screenwall.

Hali Voycik l Structural Option Schenley Place Office Building l Pittsburgh, PA Professor M. Kevin Parfitt, P.E. The Pennsylvania State University Technical Report 1 October 5, 2009
5 Technical Report 1
Structural System Summary
Foundation System Summary
The geotechnical engineering study for Schenley Place was completed by Construction Engineering Consultants, Inc. (CEC) on January 26, 2006. CEC reported competent bedrock at a depth of approximately forty-five feet. In addition, their report stated that the most economical deep foundation solution for Schenley Place included a system of cast-in-place drilled caissons, coupled with grade beams to support wall loads between caissons. Due to the below-grade excavation and the close proximity of neighboring structures, CEC also suggested a shoring system that would support overlying soils. As a result of CEC’s geotechnical study, the foundation of Schenley Place incorporates a cast-in-place perimeter caisson wall designed to act as the shoring system, and drilled cast-in-place caissons and grade beams designed to support wall loads.
FIGURE 1: Cast-in-place perimeter caisson wall (green), drilled, cast-in-place caissons (blue), and grade beams (red).

Hali Voycik l Structural Option Schenley Place Office Building l Pittsburgh, PA Professor M. Kevin Parfitt, P.E. The Pennsylvania State University Technical Report 1 October 5, 2009
6 Technical Report 1
The details of the cast-in-place perimeter caisson walls (e.g. reinforcing steel and the rock socket) will be designed by the perimeter caisson installer. The perimeter caisson walls terminate at the first floor and are tied to cap beams through the use of #6 dowels with standard 90º hooks. Each cap beam is 2’-0” in depth and varies in width according to the size of the perimeter caisson wall. The cast-in-place drilled caissons have a compressive strength of 4000 psi and are socketed at least three feet into sound bedrock as established by CEC’s geotechnical report. In addition, the drilled caissons are designed with an end bearing capacity of 25 tsf. As Figure 1 illustrates, the drilled caissons vary in diameter from 30 to 54 inches. At the first floor, the drilled caissons terminate and are tied to 24”by 24” caisson caps with #6 dowels embedded at least two feet into the drilled caisson. The grade beams have a compressive strength of 4000 psi and range from 24 to 36 inches in width and 36 to 44 inches in depth. Each grade beam has top and bottom reinforcement with bar schedules that vary according to the size of the beam. The slab on grade is 4000 psi in strength and reinforced with 2x2-W1.4xW1.4 welded wire fabric, with a minimum thickness of 4”.
Superstructure System Summary
The floor system of Schenley Place consists of both cast-in-place two-way concrete flat slab and cast-in-place concrete on composite steel deck. The floor system of the parking garage (the levels sub-grade) is designed as a two-way flat slab system. These slabs incorporate normal weight concrete with a 5000 psi compressive strength. Reinforcement that is primarily #5 and #7 top and bottom bars, is placed within a minimum slab thickness of 11”. Additional reinforcement is placed at the cast-in-place concrete walls where necessary. The typical office spaces (the floors above grade) are designed as 3 ½” normal weight cast-in-place concrete slab on 3”-20 gauge composite steel decking, supported by composite steel beams. This floor system also acts as the diaphragm, which assists in transferring lateral loads (i.e. wind and seismic) to the lateral force resisting system.
The below grade gravity system of Schenley Place is a combination of cast-in-place concrete columns and load bearing wall. The typical above grade gravity system is designed as a steel frame consisting of primarily W-shapes that vary in size. The normal weight concrete columns have a compressive strength of 7000 psi. These concrete columns (either 24”x28” or 18”x30” in size) typically span the height of the parking garage and are reinforced with both #9 and #11 bars. The normal weight, cast-in-place concrete load bearing walls have a compressive strength of 5000 psi and range from 8 to 12 inches in thickness. They are reinforced with #5 or #6 bars at 12 or 16 inches on center. Figure 1 (pictured above) illustrates the location of these components. Each concrete column corresponds with the intersection of column lines, while the load bearing walls correspond with the grade beams. Both the concrete columns and load-bearing walls help transfer the slab loadings to the foundation. The typical steel frame gravity system above grade consists of wide-flange steel shapes with yield strengths of
Hali Voycik l Structural Option Schenley Place Office Building l Pittsburgh, PA Professor M. Kevin Parfitt, P.E. The Pennsylvania State University Technical Report 1 October 5, 2009
7 Technical Report 1
50 ksi. Beams span the east-west direction at a maximum of 33’-0” while steel girders span the north-south direction at a maximum of 27’-0”. Columns span up to three stories before a splice is required; typical story heights are 13’-4”. Figure 2 (pictured below) illustrates the location of these components. Again, each steel column corresponds with the intersection of column lines, and the steel beams and girders span accordingly. The load path is the same of any typical steel frame gravity system: beam to girder to column to foundation.
The roof system at both the fourth level and main roof1 requires 1½”-20 gage wide-rib, galvanized steel roof decking, supported by steel beams. Where the main roof houses the rooftop mechanical units and penthouse, additional steel beams are designed to support the increased loads.
1 The “main roof” refers to the roof level above the seventh floor.

Hali Voycik l Structural Option Schenley Place Office Building l Pittsburgh, PA Professor M. Kevin Parfitt, P.E. The Pennsylvania State University Technical Report 1 October 5, 2009
8 Technical Report 1
Lateral Force Resisting System Summary
The lateral force resisiting system, located at the building’s core (Figure 2), is designed of both eccentrically and concentrically braced frames (Figure 3). Beginning on Garage Level 12, these frames continue to the main roof level. The eccentrically braced frames span the west-east direction at 30’-0”, along column line 4 and 5.1 between C and D. The concentrically braced frames span the north-south direction at 27’0”, along column line C and D between 4 and 5.1.
FIGURE 2: Location of lateral force resisting system. Concentrically braced frames (blue), and eccentrically braced frames (red).
2 Garage Level 1 refers to the elevation 9’-0” below the first floor (on-grade).

Hali Voycik l Structural Option Schenley Place Office Building l Pittsburgh, PA Professor M. Kevin Parfitt, P.E. The Pennsylvania State University Technical Report 1 October 5, 2009
9 Technical Report 1
The braces are designed as hollow steel shapes from HSS8x8x3/8 to HSS14x10x5/8 with yield strengths of 46 ksi. The composite steel deck system acts as the diaphragm, transferring the lateral loads acting on the exterior beams of the gravity system to columns that act as part of the gravity system as well as the lateral force resisting system. These columns, ranging from W14x311 at Garage Level 1 to W14x130 at roof level, then transfer the lateral load to the HSS-braces.
FIGURE 3: Eccentrically braced frame (left), concentrically braced frame (right).
Note that the steel systems have not been specifically detailed for seismic resistance.

Hali Voycik l Structural Option Schenley Place Office Building l Pittsburgh, PA Professor M. Kevin Parfitt, P.E. The Pennsylvania State University Technical Report 1 October 5, 2009
10 Technical Report 1
Codes and Design Standards
Relevant Codes
• International Building Code (IBC), 2006 (As amended by the city of Pittsburgh)
• Minimum Design Loads for Buildings and Other Structures (2005), American Society for Civil Engineers (ASCE 7-05)
• Building Code Requirements for Structural Concrete, American Concrete Institute (ACI 318-08)
• Specification for Structural Steel Buildings, American Institute of Steel Construction (AISC 360-05)
In the analysis of the original design, the same codes as provided above were used.
Material Strength Requirement Summary
Cast-in-place Concrete
Shallow foundations f’c = 3000 psiCaissons, grade beams, slabs on grade, and elevated floor slabs on deck f’c = 4000 psiWalls, beams, and formed elevated slabs f’c = 5000 psiColumns f’c = 7000 psi
Structural Steel
Structural W-shapes and channels Fy = 50 ksiSteel tubes (HSS shapes) Fy = 46 ksiAngles and plates Fy 36 ksi= ¾“ bolts ASTM A325Composite steel deck (a minimum of 3”-20 gage) Fy 3 ksi3Steel roof deck (a minimum of 1½”-20 gage) Fy 33 ks

Hali Voycik l Structural Option Schenley Place Office Building l Pittsburgh, PA Professor M. Kevin Parfitt, P.E. The Pennsylvania State University Technical Report 1 October 5, 2009
11 Technical Report 1
Summary of Design Loads
` Live Loads (LL)
Area AES Design Load (PSF) ASCE 7-05 Load (PSF) Design Load (PSF) Public areas 100 100 100
Office lobbies 100 100 100 Office (first floor) 80 50 80
Office corridors above first floor 80 80 80 Offices above first floor 60 50 60
Partitions 20 ≥ 15 20 Parking garage 40 40 40
Stairs 100 100 100 Roof 20 20 20
Dead Loads (DL) Material AES Design Load(PSF) ASCE 7-05 Load (PSF) Design Load (PSF)
3 1/2" n.w.c. slab on Unknown
Section 3.1.1
*63 3"-20 gauge composite steel deck
1 1/2" - 20 GA wide rib roof deck + MEP Unknown *10 3 5/8" masonry façade Unknown 34
**Superimposed Dead Loads (SDL) Area AES Design Load (PSF) ASCE 7-05 Load (PSF) Design Load (PSF) Floor Unknown Not given 10 Roof Unknown Not given 10
Snow Load (SL)
AES Design Load (PSF) ASCE 7-05 Load (PSF) Design Load (PSF)
24 22 24
*The composite steel floor deck and roof deck manufacturers were not cited within the bid building specifications for Schenley Place. In order to perform spot checks of these various gravity members, it was necessary to assume a manufacturer and deck type. These assumptions are as follows:
3 ½” n.w.c. slab on 3”-20 gauge composite steel floor decking: Vulcraft, 3 VLI20
1 ½“ – 20 gauge wide rib roof decking: Vulcraft, 1.5B20
**The superimposed dead loads for both the floor and roof take into account the weight of finishes and MEP equipment.

Hali Voycik l Structural Option Schenley Place Office Building l Pittsburgh, PA Professor M. Kevin Parfitt, P.E. The Pennsylvania State University Technical Report 1 October 5, 2009
12 Technical Report 1
Load Summary
Wind Load Summary
In the following wind analysis, wind loads were determined using ASCE 7-05, Chapter 6. This is the same code used by Atlantic Engineering Services (AES). Due to an overall building height of 104’-0”, which exceeds the 60’-0” maximum building height outlined in Section 6.4, Method 1 – Simplified Procedure, wind loads were determined through the use of Section 6.5: Method 2 – Analytical Procedure. Figure 4 is a summary of the data used in calculating the design wind pressures. Design wind pressures are summarized in Figures A.4 and A.5 of Appendix A: Wind Loads. The unique wind pressures on the parapets of the fourth roof and main roof were accounted for as well in the wind analysis. These design wind pressures were used to determine both the individual story forces as well as the story shears. In a later analysis, it may be necessary to analyze the effects of the wind on cladding and components, as well as potential roof up-lift.
At the time of design, the building was to be occupied by a single tenant who had intentions of using the building as a healthcare facility. Therefore, AES evaluated the wind loading using an Occupancy Category of III, which resulted in an Importance Factor, I of 1.15. To be consistent, an Importance Factor of 1.15 was maintained in the following wind analysis. This resulted in higher velocity pressures, and ultimately, higher design wind pressures. In the future, it may be valuable to reevaluate the wind loading with an Occupancy Category of II to optimize the design.
Both the north/south and west/east directions were evaluated. The resulting story forces and shears are summarized below (Figures 5 and 7). For detailed summaries of velocity pressure exposure coefficients, velocity pressures, design wind pressures, and an example story shear calculation, refer to Appendix A: Wind Load.
FIGURE 4: Data used to calculate wind loads V(mph) 90
Kd 0.85
I 1.15 Exposure B
Kzt 1.00
Enclosure Fully Enclosed
n1 1.44 (Rigid)
G 0.85
GCpn Windward 1.5 Leeward -1.0
Gcpi Enclosed Building 0.18 -0.18
Cp Windward 0.80 (All Values)
Leeward -0.47 (N/S Direction, L/B = 1.15) -0.50 (W/E Direction, L/B = 0.87)

Hali Voycik l Structural Option Schenley Place Office Building l Pittsburgh, PA Professor M. Kevin Parfitt, P.E. The Pennsylvania State University Technical Report 1 October 5, 2009
13 Technical Report 1
FIGURE 5: Story forces, shear, and moments due to wind (N/S direction)
Floor Height above Floor Force of total Story shear, Moment,
ground (ft) height (ft) pressure, F (k)
V (k) M (ft-k)
Roof 104.00 5.00 54.66 54.66 5684.64 7 90.33 13.67 39.19 93.85 3540.0327 6 77.00 13.33 37.76 131.61 2907.52 5 63.67 13.33 36.41 168.02 2318.2247 4 50.33 13.33 47.57 215.59 2394.1981 3 37.00 13.33 33.69 249.28 1246.53 2 23.67 13.33 32.59 281.87 771.4053 1 9.00 14.67 25.56 307.43 230.04
Garage Level 1 0.00 9.00 9.67 317.1 0
∑F= 317.1 ∑M= 19093 The obvious increase in force at the fourth floor in the north/south direction is due to the unique wind pressure on the building’s parapet. A windward force of 92.5 plf acts on the parapet located at and supported by the fourth floor. The main roof level sees the same unique parapet wind pressures. A windward force of 154 plf and a leeward force of 102.7 plf acts on the parapet located at the main roof level. Figure 6, a diagram of the windward and leeward pressures, better demonstrates the change in pressures as the height of the building increases, as well as the unique wind pressures acting on the building’s parapets.
FIGURE 6: Overall windward and leeward pressures (N/S direction)

Hali Voycik l Structural Option Schenley Place Office Building l Pittsburgh, PA Professor M. Kevin Parfitt, P.E. The Pennsylvania State University Technical Report 1 October 5, 2009
14 Technical Report 1
FIGURE 7: Story forces, shear, and moments due to wind (W/E direction)
Floor Height above Floor Force of total Story shear, Moment,
ground (ft) height (ft)
pressure, F (k)
V (k) M (ft-k)
Roof 104.00 5.00 43.12 43.12 4484.48 7 90.33 13.67 31.38 74.5 2834.5554 6 77.00 13.33 30.25 104.75 2329.25 5 63.67 13.33 29.17 133.92 1857.2539 4 50.33 13.33 42.49 176.41 2138.5217 3 37.00 13.33 39.92 216.33 1477.04 2 23.67 13.33 38.69 255.02 915.7923 1 9.00 14.67 30.42 285.44 273.78
Garage Level 1 0.00 9.00 11.51 296.95 0
∑F= 296.95 ∑M= 16311 The increase in forces at the fourth and main roof level in the west/east direction are due to the same unique wind pressures acting on the building’s parapets as mentioned above. The decreases in story forces at the fifth level and above are a result of the step-back that occurs at the fourth level. The step-back reduces the length of wall that the wind is acting upon in the west/east direction. Consequently, the magnitude of these story forces are reduced. Figure 8, a diagram of the windward and leeward pressures in the west/east direction, better demonstrates the change in pressures as the height of the building increases, as well as the unique wind pressures acting on the building’s parapets. To better understand the design wind pressures on the parapets, refer to Appendix A, Figure A.6.
FIGURE 8: Overall windward and leeward pressure (W/E direction)
Hali Voycik l Structural Option Schenley Place Office Building l Pittsburgh, PA Professor M. Kevin Parfitt, P.E. The Pennsylvania State University Technical Report 1 October 5, 2009
15 Technical Report 1
Seismic Load Summary.
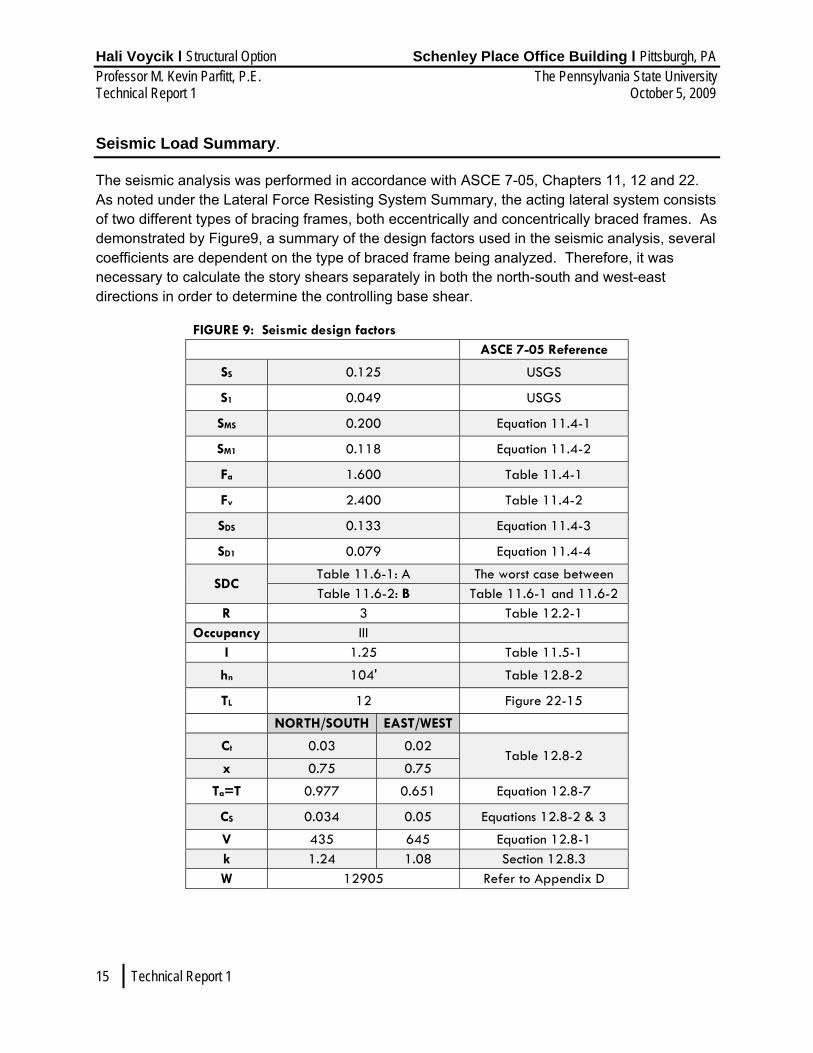
The seismic analysis was performed in accordance with ASCE 7-05, Chapters 11, 12 and 22. As noted under the Lateral Force Resisting System Summary, the acting lateral system consists of two different types of bracing frames, both eccentrically and concentrically braced frames. As demonstrated by Figure9, a summary of the design factors used in the seismic analysis, several coefficients are dependent on the type of braced frame being analyzed. Therefore, it was necessary to calculate the story shears separately in both the north-south and west-east directions in order to determine the controlling base shear.
FIGURE 9: Seismic design factors ASCE 7-05 Reference
SS 0.125 USGS
S1 0.049 USGS
SMS 0.200 Equation 11.4-1
SM1 0.118 Equation 11.4-2
Fa 1.600 Table 11.4-1
Fv 2.400 Table 11.4-2
SDS 0.133 Equation 11.4-3
SD1 0.079 Equation 11.4-4
SDC Table 11.6-1: A The worst case between Table 11.6-2: B Table 11.6-1 and 11.6-2
R 3 Table 12.2-1 Occupancy III
I 1.25 Table 11.5-1
hn 104' Table 12.8-2
TL 12 Figure 22-15
NORTH/SOUTH EAST/WEST
Ct 0.03 0.02 Table 12.8-2
x 0.75 0.75
Ta=T 0.977 0.651 Equation 12.8-7
CS 0.034 0.05 Equations 12.8-2 & 3
V 435 645 Equation 12.8-1 k 1.24 1.08 Section 12.8.3 W 12905 Refer to Appendix D
Hali Voycik l Structural Option Schenley Place Office Building l Pittsburgh, PA Professor M. Kevin Parfitt, P.E. The Pennsylvania State University Technical Report 1 October 5, 2009
16 Technical Report 1
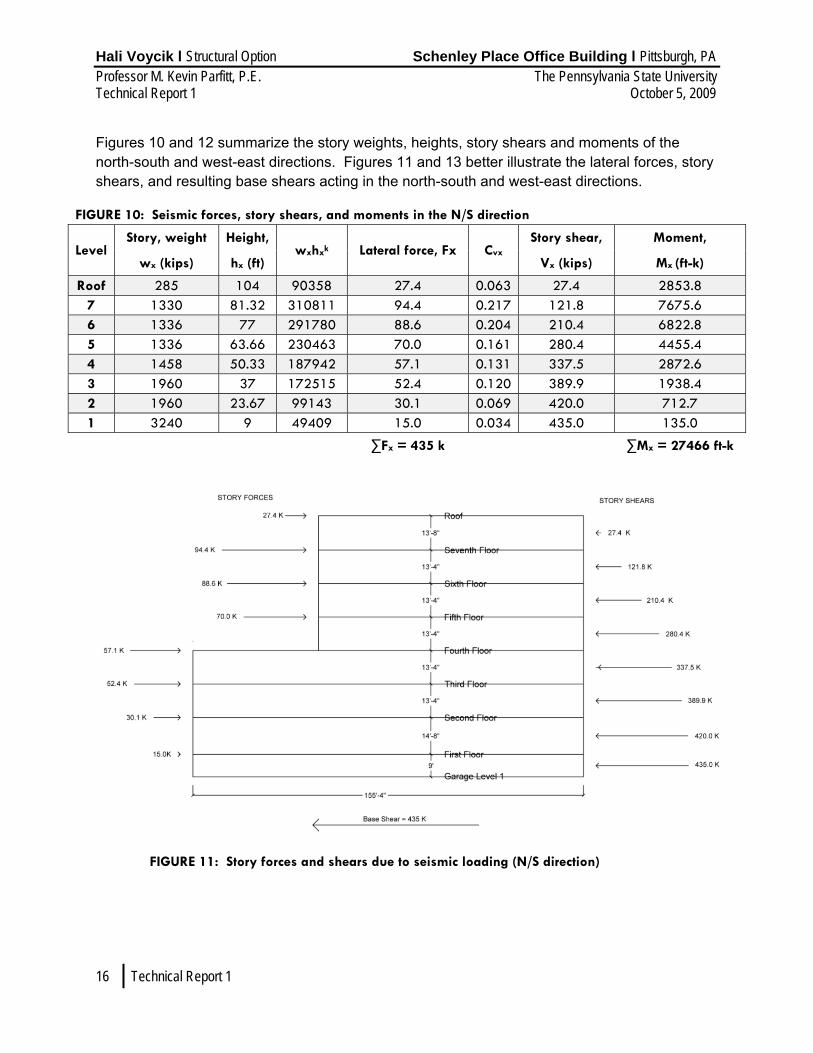
Figures 10 and 12 summarize the story weights, heights, story shears and moments of the north-south and west-east directions. Figures 11 and 13 better illustrate the lateral forces, story shears, and resulting base shears acting in the north-south and west-east directions.
FIGURE 10: Seismic forces, story shears, and moments in the N/S direction
Level Story, weight Height,
wxhxk Lateral force, Fx Cvx Story shear, Moment,
wx (kips) hx (ft) Vx (kips) Mx (ft-k)
Roof 285 104 90358 27.4 0.063 27.4 2853.8 7 1330 81.32 310811 94.4 0.217 121.8 7675.6 6 1336 77 291780 88.6 0.204 210.4 6822.8 5 1336 63.66 230463 70.0 0.161 280.4 4455.4 4 1458 50.33 187942 57.1 0.131 337.5 2872.6 3 1960 37 172515 52.4 0.120 389.9 1938.4 2 1960 23.67 99143 30.1 0.069 420.0 712.7 1 3240 9 49409 15.0 0.034 435.0 135.0
∑Fx = 435 k ∑Mx = 27466 ft-k
FIGURE 11: Story forces and shears due to seismic loading (N/S direction)

Hali Voycik l Structural Option Schenley Place Office Building l Pittsburgh, PA Professor M. Kevin Parfitt, P.E. The Pennsylvania State University Technical Report 1 October 5, 2009
17 Technical Report 1
FIGURE 12: Seismic forces, story shears, and moments in the E/W direction
Level Story weight, Height,
wxhxk Lateral force,
Cvx Story shear, Moment,
wx (kips) hx (ft) Fx Vx (kips) Mx (ft-k)
Roof 285 104 42977 36.8 0.057 36.8 3830.3 7 1330 81.32 153768 131.8 0.204 168.6 10715.7 6 1336 77 145618 124.8 0.193 293.4 9608.7 5 1336 63.66 118572 101.6 0.158 395.0 6468.6 4 1458 50.33 100399 86.0 0.133 481.0 4330.3 3 1960 37 96809 83.0 0.129 564.0 3069.5 2 1960 23.67 59757 51.2 0.079 615.2 1212.1 1 3240 9 34764 29.8 0.046 645.0 268.1
∑Fx = 645 k ∑Mx = 39503 ft-k
FIGURE 13: Story forces and shears due to seismic loading (W/E direction)
The analysis uncovered a design base shear of 435 kips in the north-south direction and a controlling design shear of 624 kips in the west-east direction. Atlantic Engineering Services (AES) reported a base shear of 365 kips.
The difference in the base shears reported by AES and the results of the contained analysis could be due to several factors. It is possible that AES may have had the ability to perform a more accurate analysis of the building, in which they may have been able to determine a more precise effective fundamental period, T, rather than use the approximate fundamental period, Ta, which was used this seismic analysis (Figure 9, T=Ta). In their favor, this could have

Hali Voycik l Structural Option Schenley Place Office Building l Pittsburgh, PA Professor M. Kevin Parfitt, P.E. The Pennsylvania State University Technical Report 1 October 5, 2009
18 Technical Report 1
resulted in a more flexible building system which would have ultimately resulted in a lower design shear value. Differences in effective seismic weight, w, could have also led to the difference between the design base shears reported. It is impossible to predict the method and values AES used in order to determine an effective seismic weight. The assumed dead loads that were used in this analysis can be found in Appendix B: Seismic Loads. Due to the topography of the site, the first floor is both on grade at the north elevation, and 9’-0” above grade at the south elevation. In order to simplify the calculations, the first floor weight was calculated as if it was entirely on grade. Only the columns whose base were at the first level, the brick façade, and the slab (which is normally left out of the weight if on grade) were included in the first floor story weight. Any elements below the first floor, which were primarily sub-grade, were ignored.
Upon comparison of the wind (317.1 kips, 19093 ft-kips) and seismic (645 kips 39503 ft-kips) design base shears and over-turning moments, it is evident that the seismic loading controls.

Hali Voycik l Structural Option Schenley Place Office Building l Pittsburgh, PA Professor M. Kevin Parfitt, P.E. The Pennsylvania State University Technical Report 1 October 5, 2009
19 Technical Report 1
Snow Load Summary
Snow loads were determined in accordance with ASCE 7-05, Chapter 7. Figure 14 is a summary of the design criteria and resulting design flat roof snow load. The worst-case snow drift load on the roof level parapet was also determined. The resulting drift surcharge load, pd is also summarized in Figure 14, and can conservatively be applied to the parapet on the fourth level as well.
At the time of design, the building was to be occupied by a single tenant who had intentions of using the building as a healthcare facility. Therefore, AES evaluated the snow loading using an Occupancy Category of III, which resulted in an Importance Factor, I of 1.1. To be consistent, an Importance Factor of 1.1 was maintained in the following snow load analysis. This resulted in a higher flat roof snow load. In the future, it may be valuable to reevaluate the snow loading with an Occupancy Category of II to optimize the design.
FIGURE 15: Configuration of snow drifts on parapets
Figure 15, as provided in ASCE 7-05, better illustrates the configuration of snow drifts and defines the coefficients as provided in Figure 14.
In conclusion, the analysis performed indicates that a flat roof snow load of 22 psf should be designed for at both the fourth and main roof levels. Because AES used of a base ground snow
FIGURE 14: Summary of snow load data
ASCE 7-05 Reference
pg 25 Figure 7-1
Ce
1.0
Table 7-2 Terrain Category B
Partially Exposed
Ct 1.0 Table 7-3
I 1.1 Table 7-4
pf 22 psf Equation 7-1
hd 2.58 ft
Section 7.7.1 hc 3.72 ft
w 10.32 ft
pd 44.51 psf

Hali Voycik l Structural Option Schenley Place Office Building l Pittsburgh, PA Professor M. Kevin Parfitt, P.E. The Pennsylvania State University Technical Report 1 October 5, 2009
20 Technical Report 1
load, pg of 30 psf, they reported a flat roof snow load of 24 psf. Though AES’s number is more conservative, the 22 psf flat roof snow load, as determined in this analysis, may be designed for. This number is based upon the lesser ground snow load of 25 psf as required by code (ASCE 7-05, Figure 7-1) An additional superimposed triangular surcharge snow drift load of 44.51 psf acts on the fourth level and roof level parapets. For more detailed information on the analysis of the flat roof and drift snow loads, refer to Appendix C: Snow Load.
Overview
In summary, the analysis conducted for wind, seismic, and snow was in accordance to ASCE 7-05. After comparing the controlling design base shears of both wind and seismic loadings, the results of the analysis performed suggest that the overall controlling base shear of 645 kips is due to seismic loads in the west-east direction. Though the design professionals of Atlantic Engineering Services computed a design base shear of 365 kips, various assumptions made while performing the analysis within this report could be the source of any discrepancies. In addition, a flat roof snow load of 22 psf should be accounted for in the gravity load design. AES computed a 24 psf flat roof snow load, based upon a 30 psf base ground snow load.

Hali Voycik l Structural Option Schenley Place Office Building l Pittsburgh, PA Professor M. Kevin Parfitt, P.E. The Pennsylvania State University Technical Report 1 October 5, 2009
21 Technical Report 1
Appendices
Appendix A: Wind Load
FIGURE A.1: Data used to calculate wind loads ASCE 7-05 Reference
V(mph) 90 Figure 6-1
Kd 0.85 Table 6-4
I 1.15 Table 6-1 Exposure B Section 6.5.6
Kzt 1.00 Section 6.5.7.1
Enclosure Fully Enclosed Section 6.5.9
n1 1.44 (Rigid) *Equation C6-19
G 0.85 Section 6.5.8.1
GCpn Windward 1.5
Section 6.5.12.2.4 Leeward -1.0
Gcpi Enclosed Building 0.18
Figure 6-5 -0.18
Cp Windward 0.80 (All Values)
Figure 6-6 Leeward
-0.47 (N/S Direction, L/B = 1.15) -0.50 (W/E Direction, L/B = 0.87)
*Equation C6-19:
fn1= where H = building height (ft)
fn1= 1.44 ≥ 1 Hz The building is rigid
Note: This expression over-estimates the frequency common in U.S. construction for smaller buildings less than 400 feet in height. This will result in conservative wind loadings.
Hali Voycik l Structural Option Schenley Place Office Building l Pittsburgh, PA Professor M. Kevin Parfitt, P.E. The Pennsylvania State University Technical Report 1 October 5, 2009
22 Technical Report 1
FIGURE A.2: Velocity pressure exposure coefficients Kz, Kh, and Kp Height above
Kz Kh Kp ground level, z (ft)
15 0.57 20 0.62 25 0.66 30 0.7 40 0.76 50 0.81 54 0.83 60 0.85 70 0.89 80 0.93 90 0.96
100 0.99 104 1.00 109 1.01
ASCE 7-05 Reference: Table 6-3
FIGURE A.3: Velocity pressure, qz, qh, and qp Height above
qz qh qp ground level, z (ft)
15 11.55 20 12.57 25 13.38 30 14.19 40 15.40 50 16.42 54 16.80 60 17.23 70 18.04 80 18.85 90 19.46
100 20.07 104 20.27 109 20.53
ASCE 7-05 Reference: Equation 6-15

Hali Voycik l Structural Option Schenley Place Office Building l Pittsburgh, PA Professor M. Kevin Parfitt, P.E. The Pennsylvania State University Technical Report 1 October 5, 2009
23 Technical Report 1
FIGURE A.4: Design wind pressures in the N/S direction
Location Height above q
(psf) External Pressure Internal Pressure
Net Pressure, p (psf)
ground level, z qGCp (psf) qh(GCpi) (psf) (+) GCpi (-) GCpi
Windward
104 20.27 13.78 3.65 10.13 17.43 100 20.07 13.65 3.65 10.00 17.29 90 19.46 13.23 3.65 9.58 16.88 80 18.85 12.82 3.65 9.17 16.47 70 18.04 12.27 3.65 8.62 15.92 60 17.23 11.72 3.65 8.07 15.36 50 16.42 11.16 3.65 7.52 14.81 40 15.40 10.48 3.65 6.83 14.12 30 14.19 9.65 3.65 6.00 13.30 25 13.38 9.10 3.65 5.45 12.75 20 12.57 8.55 3.65 4.90 12.19 15 11.55 7.86 3.65 4.21 11.50
Leeward All 20.27 -8.10 3.65 -11.75 -4.45
FIGURE A.5: Design wind pressures in W/E direction
Location Height above q (psf)
External Pressure Internal Pressure Net Pressure, p
(psf) ground level, z qGCp (psf) qh(GCpi) (psf) (+) GCpi (-) GCpi
Windward
104 20.27 13.78 3.65 10.13 17.43 100 20.07 13.65 3.65 10.00 17.29 90 19.46 13.23 3.65 9.58 16.88 80 18.85 12.82 3.65 9.17 16.47 70 18.04 12.27 3.65 8.62 15.92 60 17.23 11.72 3.65 8.07 15.36 50 16.42 11.16 3.65 7.52 14.81 40 15.40 10.48 3.65 6.83 14.12 30 14.19 9.65 3.65 6.00 13.30 25 13.38 9.10 3.65 5.45 12.75 20 12.57 8.55 3.65 4.90 12.19 15 11.55 7.86 3.65 4.21 11.50
Leeward All 20.27 -8.61 3.65 -12.26 -4.97

Hali Voycik l Structural Option Schenley Place Office Building l Pittsburgh, PA Professor M. Kevin Parfitt, P.E. The Pennsylvania State University Technical Report 1 October 5, 2009
24 Technical Report 1
FIGURE A.6: Design wind pressure on the parapets
Location Height above qp
(psf) Net Pressure, pp Height of Force on
ground level, z qGCpn (psf) parapet (ft) parapet (plf)
Windward 109 20.53 30.80 5.00 154.0 54 16.80 25.20 3.67 92.5
Leeward 109 20.53 -20.53 5.00 -102.7 54 16.8 -16.80 3.67 -61.66
FIGURE A.7: Story forces, shear, and moments due to wind (N/S direction)
Floor
Height above Floor Force of total
Story shear, Moment,
ground (ft) height (ft)
pressure, F (k)
V (k) M (ft-k)
Roof 104.00 5.00 54.66 54.66 5684.64 7 90.33 13.67 39.19 93.85 3540.0327 6 77.00 13.33 37.76 131.61 2907.52 5 63.67 13.33 36.41 168.02 2318.2247 4 50.33 13.33 47.57 215.59 2394.1981 3 37.00 13.33 33.69 249.28 1246.53 2 23.67 13.33 32.59 281.87 771.4053 1 9.00 14.67 25.56 307.43 230.04
Garage Level 1 0.00 9.00 9.67 317.1 0
∑F= 317.1 ∑M= 19093 FIGURE A.8: Overall windward and leeward pressures (N/S direction)

Hali Voycik l Structural Option Schenley Place Office Building l Pittsburgh, PA Professor M. Kevin Parfitt, P.E. The Pennsylvania State University Technical Report 1 October 5, 2009
25 Technical Report 1
FIGURE A.9: Story forces, shear, and moments due to wind (W/E direction)
Floor Height above Floor Force of total Story shear, Moment,
ground (ft) height (ft)
pressure, F (k)
V (k) M (ft-k)
Roof 104.00 5.00 43.12 43.12 4484.48 7 90.33 13.67 31.38 74.5 2834.5554 6 77.00 13.33 30.25 104.75 2329.25 5 63.67 13.33 29.17 133.92 1857.2539 4 50.33 13.33 42.49 176.41 2138.5217 3 37.00 13.33 39.92 216.33 1477.04 2 23.67 13.33 38.69 255.02 915.7923 1 9.00 14.67 30.42 285.44 273.78
Garage Level 1 0.00 9.00 11.51 296.95 0
∑F= 296.95 ∑M= 16311
FIGURE A.10: Overall windward and leeward pressures (W/E direction)

Hali Voycik l Structural Option Schenley Place Office Building l Pittsburgh, PA Professor M. Kevin Parfitt, P.E. The Pennsylvania State University Technical Report 1 October 5, 2009
26 Technical Report 1
Sample 3rd floor story force calculation (N/S Direction)
Windward 3rd floor story force:
9.67 10.48 3.67 11.16 134.67 19160 19.16
Leeward 3rd floor story force: 13.33 8.10 134.67 14540 14.54
rdTotal 3 floor story f
14.54
orce:
19.16 .

Hali Voycik l Structural Option Schenley Place Office Building l Pittsburgh, PA Professor M. Kevin Parfitt, P.E. The Pennsylvania State University Technical Report 1 October 5, 2009
27 Technical Report 1
Appendix B: Seismic Load
The following (Figure B.1) is a summary of the design data used when calculating the seismic loading, following the equivalent lateral force analysis procedure of the ASCE 7-05.
FIGURE B.1: Seismic design factors ASCE 7-05 Reference
SS 0.125 USGS
S1 0.049 USGS
SMS 0.200 Equation 11.4-1
SM1 0.118 Equation 11.4-2
Fa 1.600 Table 11.4-1
Fv 2.400 Table 11.4-2
SDS 0.133 Equation 11.4-3
SD1 0.079 Equation 11.4-4
SDC Table 11.6-1: A The worst case between Table 11.6-2: B Table 11.6-1 and 11.6-2
R 3 Table 12.2-1 Occupancy III
I 1.25 Table 11.5-1
hn 104' Table 12.8-2
TL 12 Figure 22-15
NORTH/SOUTH EAST/WEST
Ct 0.03 0.02 Table 12.8-2
x 0.75 0.75
Ta=T 0.977 0.651 Equation 12.8-7
CS 0.034 0.05 Equations 12.8-2 & 3
V 435 645 Equation 12.8-1 k 1.24 1.08 Section 12.8.3 W 12905 Refer to Appendix D

Hali Voycik l Structural Option Schenley Place Office Building l Pittsburgh, PA Professor M. Kevin Parfitt, P.E. The Pennsylvania State University Technical Report 1 October 5, 2009
28 Technical Report 1
Due to the size and detail of the charts used to calculate the effective seismic building weight, these have been omitted and a summary of assumed dead loads and total floor weights have been provided. Detailed effective seismic weight calculations can be presented at one’s request.
FIGURE B.3: Summary of story weights Level Weight (kips) Roof 285
7 1330 6 1336 5 1336 4 1458 3 1960 2 1960 1 3240
W= 12905
FIGURE B.2: Summary of loads used to calculate effective seismic weight, W Self-weights
Beams Sizes varied floor-to-floor Columns Sizes varied floor-to-floor
Composite decking
63 PSF
3 1/2" concrete & 3" 20-g steel deck
Applied to all levels, except the 1st level
1st floor slab 138 PSF
11" N.W.C. slab Applied to 1st level
Masonry curtain wall
34 PSF
3 5/8" typical brick curtain wall
Applied to all levels supporting façade Superimposed dead loads
Roof 10 PSF
Applied to low and high roofs
Floor
10 PSF Takes into account partitions,
finishes, and MEP Applied to all floors

Hali Voycik l Structural Option Schenley Place Office Building l Pittsburgh, PA Professor M. Kevin Parfitt, P.E. The Pennsylvania State University Technical Report 1 October 5, 2009
29 Technical Report 1
Example calculations of seismic forces, story shears, and moments in N/S direction on the 7th floor:
FIGURE B.4: Seismic forces, story shears, and moments in the N-S direction
Level Story weight Height,
wxhxk Lateral force, Fx Cvx Story shear, Moment,
wx (kips) hx (ft) Vx (kips) Mx (ft-k)
Roof 285 104 90358 27.4 0.063 27.4 2853.8 7 1330 81.32 310811 94.4 0.217 121.8 7675.6 6 1336 77 291780 88.6 0.204 210.4 6822.8 5 1336 63.66 230463 70.0 0.161 280.4 4455.4 4 1458 50.33 187942 57.1 0.131 337.5 2872.6 3 1960 37 172515 52.4 0.120 389.9 1938.4 2 1960 23.67 99143 30.1 0.069 420.0 712.7 1 3240 9 49409 15.0 0.034 435.0 135.0
12905 wihik= 1432420 ∑Fx = 435 k ∑Mx = 27466 ft-k
Story weightAs summarize
, wx: d in Figure B.3
Height, hx: As determined us
. ing construction documents)
Exponent related t struc
. . 0.75 0.5 0.977 .
o ture, k:
T can be found in Figure B.1 wxhx :
1330 81.32 .
k
Lateral force, Fx:
∑
3108111432420
435 . wihi
k can be found in Figure B.4 and V in Figure B.1
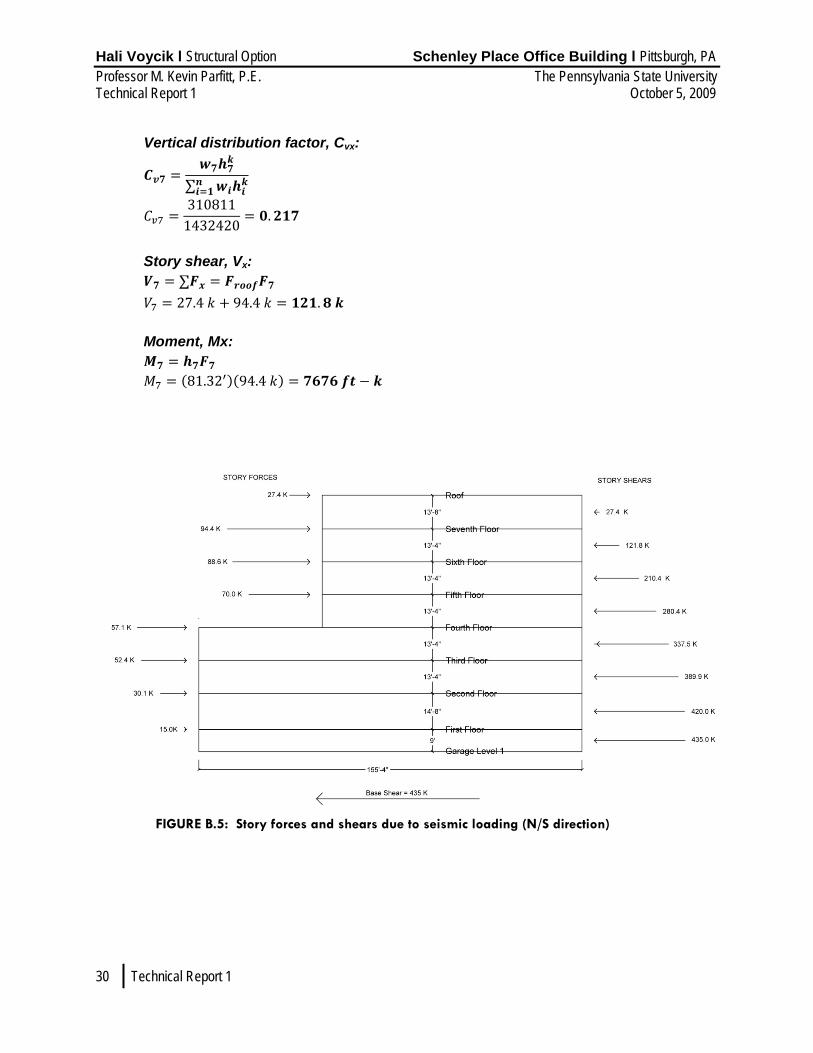
Hali Voycik l Structural Option Schenley Place Office Building l Pittsburgh, PA Professor M. Kevin Parfitt, P.E. The Pennsylvania State University Technical Report 1 October 5, 2009
30 Technical Report 1
V ic distriert al bution factor, Cvx:
∑
3108111432420
.
Story shear, V : x
∑ 27.4 94.4 .
oM ment, Mx:
81.32 94.4
FIGURE B.5: Story forces and shears due to seismic loading (N/S direction)

Hali Voycik l Structural Option Schenley Place Office Building l Pittsburgh, PA Professor M. Kevin Parfitt, P.E. The Pennsylvania State University Technical Report 1 October 5, 2009
31 Technical Report 1
FIGURE B.6: Seismic forces, story shears, and moments in the E/W direction
Level Story weight, Height,
wxhxk Lateral force,
Cvx Story shear, Moment,
wx (kips) hx (ft) Fx Vx (kips) Mx (ft-k)
Roof 285 104 42977 36.8 0.057 36.8 3830.3 7 1330 81.32 153768 131.8 0.204 168.6 10715.7 6 1336 77 145618 124.8 0.193 293.4 9608.7 5 1336 63.66 118572 101.6 0.158 395.0 6468.6 4 1458 50.33 100399 86.0 0.133 481.0 4330.3 3 1960 37 96809 83.0 0.129 564.0 3069.5 2 1960 23.67 59757 51.2 0.079 615.2 1212.1 1 3240 9 34764 29.8 0.046 645.0 268.1
∑Fx = 645 k ∑Mx = 39503 ft-k
FIGURE B.7: Story forces and shears due to seismic loading (W/E direction)

Hali Voycik l Structural Option Schenley Place Office Building l Pittsburgh, PA Professor M. Kevin Parfitt, P.E. The Pennsylvania State University Technical Report 1 October 5, 2009
32 Technical Report 1
Appendix C: Snow Load Flat roof snow loads
FIGURE C.1: Data used to calculate flat roof snow loads, pf ASCE 7-05 Reference
pg 25 Figure 7-1
Ce
1.0 Table 7-2 Terrain Category B
Partially Exposed
Ct 1.0 Table 7-3 I 1.1 Table 7-4 pf 22 psf Equation 7-1
Flat r of now loa s, po s d f (ASCE 7 -05 Reference: Section 7.3,
0.7 20 25 20 1.1
Equation 7-1)
0.7 1.0 1.0 1.122 19.25
Drift loads on roof parapet walls
FIGURE C.2: Data used to determine need for drift loads
ASCE 7-05 Reference pg 25 Figure 7-1
Ce 1.0
Table 7-2
Terrain Category B Partially Exposed
Ct 1.0 Table 7-3 I 1.1 Table 7-4 pf 22 psf Equation 7-1 Cs 1.0 Figure 7-2 ps 22 psf Equation 7-2
17.25 pcf Equation 7-3 hb 1.28 ft Section 7.1 hc 3.72 ft Section 7.1

Hali Voycik l Structural Option Schenley Place Office Building l Pittsburgh, PA Professor M. Kevin Parfitt, P.E. The Pennsylvania State University Technical Report 1 October 5, 2009
33 Technical Report 1
Drift loads on parapet walls to be calculated as outline in Section 7.7.1. Section 7.7.1 states: “If hc/hb is less than 0.2, drift loads are not required to be applied.
Sloped roof snow
loads, ps (ASCE 7 -05 Reference: Section 7.4, Equation 7-2)
1.0 22
Snow density, (ASCE 7 -05 Re
30
ference: Section 7.7.1, Equation 7-3) 0.13 14 30 0.13 25 14
. 30 Heig t ofh balanced snow load, hb (ASCE 7 -05 Reference: Section 7.1)
22
17.25
. ’
l r g
C a hei ht from
1.28
e top of hb to top of parapet, hc (ASCE 7 -05 Reference: Section 7.1) 5.005.00.
Drift oad ch
0.2
l eck:
3.721.28 2.91 0.2
Drift loads must be calculated

Hali Voycik l Structural Option Schenley Place Office Building l Pittsburgh, PA Professor M. Kevin Parfitt, P.E. The Pennsylvania State University Technical Report 1 October 5, 2009
34 Technical Report 1
Figure C.3: Snow Drift Load on Roof Parapet
ASCE 7-05 Reference
hd 2.58 ft
Section 7.7.1 hc 3.72 ft
w 10.32 ft
pd 44.51 psf
H ig t of drif s, h :
0.43
e h t d
10 1.5 0.75
Where, l = length of the roof upwind of p√105.33
u
0.43arapet = 105’-4”
√25 10 1.5 0.75 2.58
. :
.
4 4 2.58.
.
5
2.58 17.2.
Hali Voycik l Structural Option Schenley Place Office Building l Pittsburgh, PA Professor M. Kevin Parfitt, P.E. The Pennsylvania State University Technical Report 1 October 5, 2009
35 Technical Report 1
Appendix D: Spot Checks
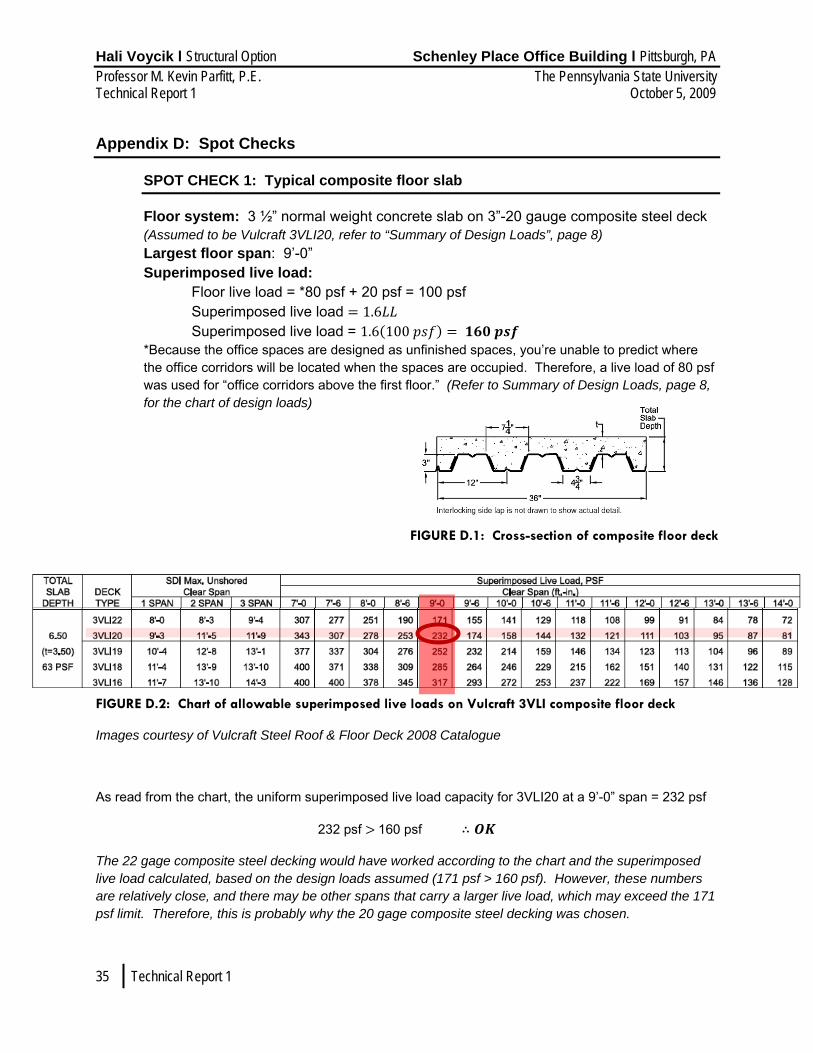
SPOT CHECK 1: Typical composite floor slab
Floor system: 3 ½” normal weight concrete slab on 3”-20 gauge composite steel deck (Assumed to be Vulcraft 3VLI20, refer to “Summary of Design Loads”, page 8) Largest floor span: 9’-0” Superimposed live load:
Floor live load = *80 psf + Superimposed live load
20 psf = 100 psf 1.6
Superimposed live load = 1.6 100 *Because the office spaces are designed as unfinished spaces, you’re unable to predict where the office corridors will be located when the spaces are occupied. Therefore, a live load of 80 psf was used for “office corridors above the first floor.” (Refer to Summary of Design Loads, page 8, for the chart of design loads)
FIGURE D.1: Cross-section of composite floor deck
FIGURE D.2: Chart of allowable superimposed live loads on Vulcraft 3VLI composite floor deck
Images courtesy of Vulcraft Steel Roof & Floor Deck 2008 Catalogue
As read from the chart, the uniform superimposed live load cap or 3VLI20 at a 9’-0” span = 232 psf acity f
232 psf 160 psf
The 22 gage composite steel decking would have worked according to the chart and the superimposed live load calculated, based on the design loads assumed (171 psf > 160 psf). However, these numbers are relatively close, and there may be other spans that carry a larger live load, which may exceed the 171 psf limit. Therefore, this is probably why the 20 gage composite steel decking was chosen.

Hali Voycik l Structural Option Schenley Place Office Building l Pittsburgh, PA Professor M. Kevin Parfitt, P.E. The Pennsylvania State University Technical Report 1 October 5, 2009
36 Technical Report 1
SPOT CHECK 2: Gravity column (Column A.2) at the second floor
Loads carried by Column A.2 on the second floor The loads used can be referenced on page 10 under "Summary of Design Loads" Design Notes:
Column A.2 Supports the fourth level roof and the third floor Column A.2: W10X45 Tributary Area = 182 (L = 20.415') x (W = 8.915') Height = 26.66'
Level DL (PSF) *DL (K) DL (PLF) *DL (K) LL (PSF) LL(K) LrL (PSF) LrL (K) SL (PSF) SL (K)
Roof: Fourth Floor 20 3.640 48 0.428 --- --- 20 3.640 24 4.368
Third Floor 73 13.286 42 0.374 80 14.560 --- --- --- ---
∑ (K) 16.926 0.802 14.560 3.640 4.368 *DL only includes beam self-weights, floor and roof systems, and superimposed loads.
Item DL (PSF) DL (K) DL (PLF) DL (K)
Load due to brick façade 34 18.505 --- ---
Column Self Weight --- --- 45 1.200
∑ (K) 18.505 1.200
DL LL LrL SL
TOTAL LOADS (K) 37.433 14.560 3.640 4.368
FIGURE D.3: Tributary area of Column A.2
Table 4-1: Available Strength in Axial Compression, kips
Fy =50 ksi,
K=1, φPn = 401 > 70.04 K = Pu L=13.33’ Because A.2 is an exterior column, the large
remaining capacity is likely due to the lateral loads column A.2 must also carry, but not accounted for within this spot check
Load Combinations (LRFD): Pu (K) 1.4D 52.41
1.2D + 1.6L + 0.5Lr 70.04
1.2D + 1.6Lr + 0.5L 58.02
1.2D + 0.5L + 0.5Lr 54.02 1.2D + 0.5L + 0.2S 53.07
(KL) φPn 12 410
13.33 401 13 384 rx/ry 2.15

Hali Voycik l Structural Option Schenley Place Office Building l Pittsburgh, PA Professor M. Kevin Parfitt, P.E. The Pennsylvania State University Technical Report 1 October 5, 2009
37 Technical Report 1
SPOT CHECK 3: Composite beam
Design notes: Floor system: 3 ½” normal weight concrete slab on 3”-20 gauge composite steel deck (Assumed to be Vulcraft 3VLI20, refer to “Summary of Design Loads”, page 8)
Deck is perpendicular to the beam Concrete slab: f’c = 4000 psi
Slab thickness: 3½“ Steel beam: W18x35 [16]
d = 17.7” tw = 0.30” bf = 6.0” tf = 0.425”
A992: Fy = 50 ksi Fu = 65 ksi
Tributary width: 9’-0” Span = 30’-0”
Steel bolts: ASTM 325 ¾” diameter Qn = 17.2 k/stud
FIGURE D.4: Tributary area of W18x35 D gn assu
esi mptions: (1) weak stud per rib
8
12
30 128
129 12
45" 54" " "
.
4 90 3 0.85
50 10.2
∑ 17.2 8 .
V’q controls Partially composite
FIGURE D.5: Cross-section of composite beam and slab

Hali Voycik l Structural Option Schenley Place Office Building l Pittsburgh, PA Professor M. Kevin Parfitt, P.E. The Pennsylvania State University Technical Report 1 October 5, 2009
38 Technical Report 1
Effective dep
.
th of concrete, a ∑
a137.6 k
0.85 4 ksi 90". " 3.0"
Area of steel in compression, As-c:
515 137.6 2 50
.
Location of PN , xA :
3.774 6.0" 0.425"0.30"
0.425" . "
FIGURE 5.6: Diagram of compressive and tensile forces
Nomial moment, Mn: .505"2
188.7 4
137.6 6.5"0.455"2
326.3 4.505"13.195"
2
.

Hali Voycik l Structural Option Schenley Place Office Building l Pittsburgh, PA Professor M. Kevin Parfitt, P.E. The Pennsylvania State University Technical Report 1 October 5, 2009
39 Technical Report 1
Design s load :
0.035 0.63 9 0.01 9 .
0.08 9 0.02 9 .
l uniform load, : Critica wu
. . 1.2 0.692 1.6 0.90 .
Critical design moment, Mu:
2.27 30
8. 3655
The large remaining available capacity is likely due to the lateral loads that were not accounted for in this spot check.
Verify that the deflections are acceptable:
Consider deflection during construction: Assume that the bare beam must support its own self-weight and the self-weight of the slab, as well as a 20 psf construction live load. First verify that he steel beam has th requiredloads:
t e strength to support these
0.035 0.063 9 .
. .
. .
1.2 0.602 1.6 0.18 .
1.01 30
8. 249

Hali Voycik l Structural Option Schenley Place Office Building l Pittsburgh, PA Professor M. Kevin Parfitt, P.E. The Pennsylvania State University Technical Report 1 October 5, 2009
40 Technical Report 1
Now check deflection during construction:
∆
∆5 0.782 30 1728
00 510384 290. "
30'x12360
1.0"
∆
Check live load deflection: When checking the live load deflection, use the service live load. IL as pulled from the A
∆
B w CI 318-08, Table 3-20
∆5 0.9 30 1728
384 00 1000290. "
30'x12360
1.0"
∆