technical paper what’s the score? - uv curingradtech.org/images/pdf_upload/whatsthescore.pdf ·...
TRANSCRIPT

44 RADTECH REPORT ISSUE 3 2012
Tech
nica
l Pap
er
What’s the Score?A Method for Quantitative Estimation of Energy Use and Emission Reductions for UV/EB CuringBy Ronald Golden, Ph.D. A number of case studies have
demonstrated that replacement
of thermally cured solvent
or waterborne inks, coatings and
adhesives with ultraviolet (UV)/
electron beam (EB) curing systems
can not only reduce uncontrolled
volatile organic compound (VOC)
release, but can also reduce energy
demand and greenhouse gas (GHG)
emissions by up to 90 percent.1-6
These results for individual industrial
applications provide a strong indication
that UV or EB technology should have
an impact on reducing energy use
and GHG emissions, but until now
no general methods for calculating
the quantitative significance of these
benefits have been proposed.
This paper outlines a method for
calculating a first-order estimate of
the relative energy requirements for
thermal and UV/EB-curing of inks,
coatings and adhesives from a limited
number of prior publications that
include quantitative data for side-by-
side comparison of each process.
Using this method, it is possible to
calculate a total annual “sustainability
scorecard” benefit of radiation curing
for reducing energy use and GHG
emissions. The same methodology
can be generally applied to individual
curing installations that wish to
estimate energy demand and GHG
emissions for their particular case.
Quantitative Comparison of Radiation and Thermal Curing
Two of the cited studies include
detailed quantitative data for side-
by-side comparison of the amount of
electrical and natural gas combustion
energy used by UV and thermal
curing in the same industrial process,
notably the “Coors” can coating study
published under a DOE/EPA jointly
funded NICE/3 Grant2 and an adhesive
“eco-efficiency” study published by
BASF authors.3 A previous publication4
analyzed the data from the BASF
case study to compare the normalized
energy demand to apply and cure
an adhesive on one square meter of
plastic film with thermal- and UV-
adhesive formulations. Another earlier
publication5 summarized energy and
emissions data from the “Coors” study.
That data can be combined with the
surface area of a typical 12-ounce
Table 1Energy demand in Btu/m2 to decorate metal cans (Calculated from Coors data)
W/B Thermal Curing + Incineration
UV Curing
Electricity 795.8 648.9
Natural Gas 2,452.6 0
Total Energy Demand 3,248.4 648.9
Electricity/Total Energy Usage Ratio*
24% 100%
*The average of these ratios will be used later to calculate comparative electrical and natural gas requirements and GHG emissions (Tables 7 and 9).
ISSUE 3 2012 RADTECH REPORT 45
Tech
nica
l Pap
er
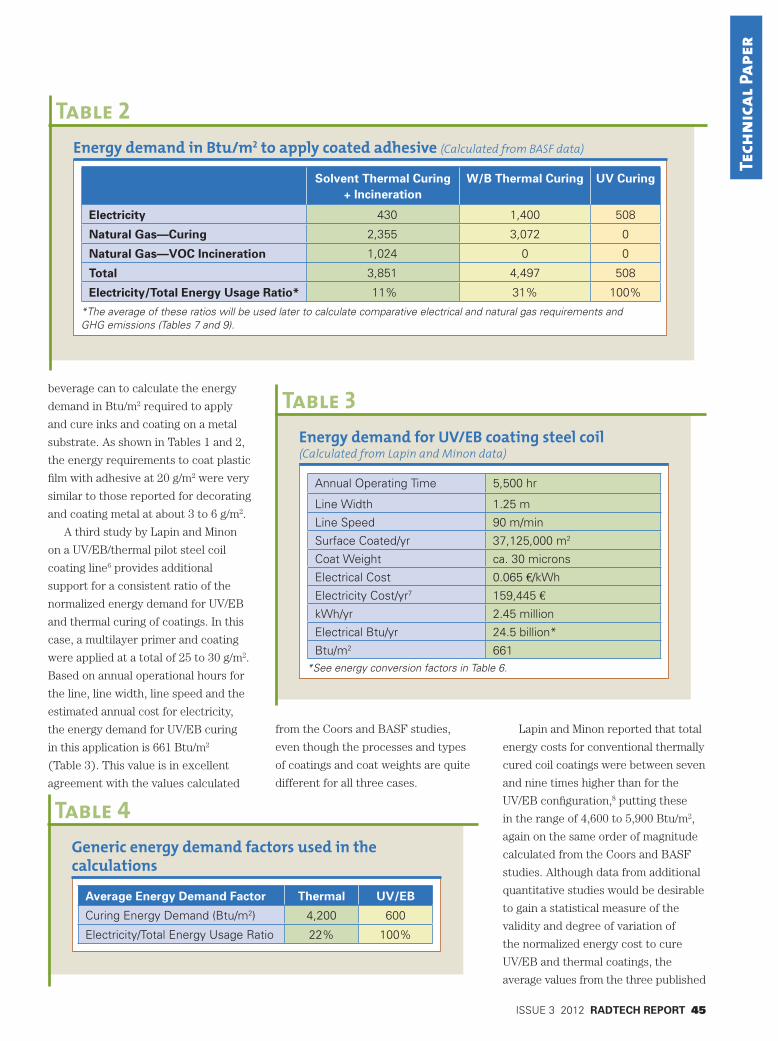
beverage can to calculate the energy
demand in Btu/m2 required to apply
and cure inks and coating on a metal
substrate. As shown in Tables 1 and 2,
the energy requirements to coat plastic
film with adhesive at 20 g/m2 were very
similar to those reported for decorating
and coating metal at about 3 to 6 g/m2.
A third study by Lapin and Minon
on a UV/EB/thermal pilot steel coil
coating line6 provides additional
support for a consistent ratio of the
normalized energy demand for UV/EB
and thermal curing of coatings. In this
case, a multilayer primer and coating
were applied at a total of 25 to 30 g/m2.
Based on annual operational hours for
the line, line width, line speed and the
estimated annual cost for electricity,
the energy demand for UV/EB curing
in this application is 661 Btu/m2
(Table 3). This value is in excellent
agreement with the values calculated
from the Coors and BASF studies,
even though the processes and types
of coatings and coat weights are quite
different for all three cases.
Lapin and Minon reported that total
energy costs for conventional thermally
cured coil coatings were between seven
and nine times higher than for the
UV/EB configuration,8 putting these
in the range of 4,600 to 5,900 Btu/m2,
again on the same order of magnitude
calculated from the Coors and BASF
studies. Although data from additional
quantitative studies would be desirable
to gain a statistical measure of the
validity and degree of variation of
the normalized energy cost to cure
UV/EB and thermal coatings, the
average values from the three published
Table 2Energy demand in Btu/m2 to apply coated adhesive (Calculated from BASF data)
Solvent Thermal Curing + Incineration
W/B Thermal Curing UV Curing
Electricity 430 1,400 508
Natural Gas—Curing 2,355 3,072 0
Natural Gas—VOC Incineration 1,024 0 0
Total 3,851 4,497 508
Electricity/Total Energy Usage Ratio* 11% 31% 100%
*The average of these ratios will be used later to calculate comparative electrical and natural gas requirements and GHG emissions (Tables 7 and 9).
Table 3Energy demand for UV/EB coating steel coil (Calculated from Lapin and Minon data)
Annual Operating Time 5,500 hr
Line Width 1.25 m
Line Speed 90 m/min
Surface Coated/yr 37,125,000 m2
Coat Weight ca. 30 microns
Electrical Cost 0.065 €/kWh
Electricity Cost/yr7 159,445 €
kWh/yr 2.45 million
Electrical Btu/yr 24.5 billion*
Btu/m2 661*See energy conversion factors in Table 6.
Table 4Generic energy demand factors used in the calculations
Average Energy Demand Factor Thermal UV/EB
Curing Energy Demand (Btu/m2) 4,200 600
Electricity/Total Energy Usage Ratio 22% 100%

46 RADTECH REPORT ISSUE 3 2012
Tech
nica
l Pap
er
quantitative studies provide at least
an order of magnitude basis for
comparison (Table 4).
North American UV/EB ScorecardRadTech regularly conducts a
survey of the total annual volume of
UV/EB-curing formulations sold in
North America. Table 5 shows how
the RadTech data can be combined
with typical applied film weights for
various applications to calculate the
total annual surface area coated by
UV/EB formulations.
This annual coated surface area
can be combined with the generic
demand energy factors in Table 4
and the natural gas consumption and
electrical generation factors in Table 6
to calculate an order of magnitude for
the annual energy savings achieved by
substituting UV/EB curing for thermal-
curing formulations that otherwise
would have been used (Table 7).
The breakdown for electrical MWh
and million cubic feet of natural gas
is based on the average of the
Electricity/Total Energy Usage Ratio
noted in Table 4.
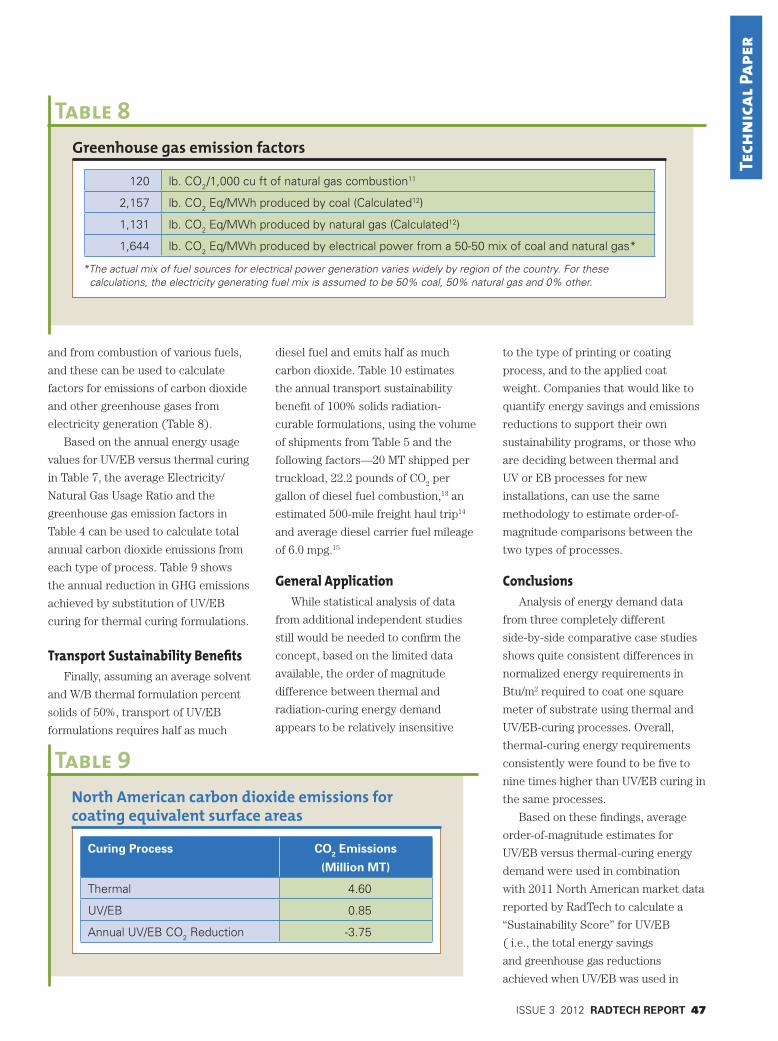
Greenhouse Gas EmissionsGovernment agencies publish data
on emissions from electricity generation
Table 5Annual surface area coated by UV/EB formulations
*Miscellaneous UV/EB curing formulation volume in 2011 that is difficult to treat using this simplified coating model is omitted, including optical fiber coating, printing plates, stereolithography/solid modeling, dental applications and medical apparatus.
Market Segment 2011 Volume
(1,000 M Tons)
Applied Coat Weight (g/m2)
Total Coated
Surface (Billion m2)
Graphic Arts 59,730 2-15 13.8
Wood Finishes 23,200 10-60 1.22
Plastic Coatings 9,600 10-20 0.62
Adhesives and Silicone Release Coatings 7,045 0.5 to 40 2.45
Metal Decorating and Coating 3,775 3-30 0.66
Electronics 4,040 25-50 0.14
Miscellaneous* Not Included Not Included
Total Used for Calculation 107,390 18.9
Table 6Energy conversion factors used in the calculations
1,024 Btu/cu ft of natural gas9
10,000 Benchmark Electrical Heat Rate in Btu/kWh10
Table 7North American annual energy usage for coating equivalent surface areas
Curing Process Million Btu Electrical
Million MWh
Billion Cubic Feet of Natural Gas
Thermal 7.94E+7 1.75 60
UV/EB 1.13E+7 1.13 0
Annual UV/EB Curing Energy Savings -6.81E+7 -0.62 -60
ISSUE 3 2012 RADTECH REPORT 47
Tech
nica
l Pap
er
and from combustion of various fuels,
and these can be used to calculate
factors for emissions of carbon dioxide
and other greenhouse gases from
electricity generation (Table 8).
Based on the annual energy usage
values for UV/EB versus thermal curing
in Table 7, the average Electricity/
Natural Gas Usage Ratio and the
greenhouse gas emission factors in
Table 4 can be used to calculate total
annual carbon dioxide emissions from
each type of process. Table 9 shows
the annual reduction in GHG emissions
achieved by substitution of UV/EB
curing for thermal curing formulations.
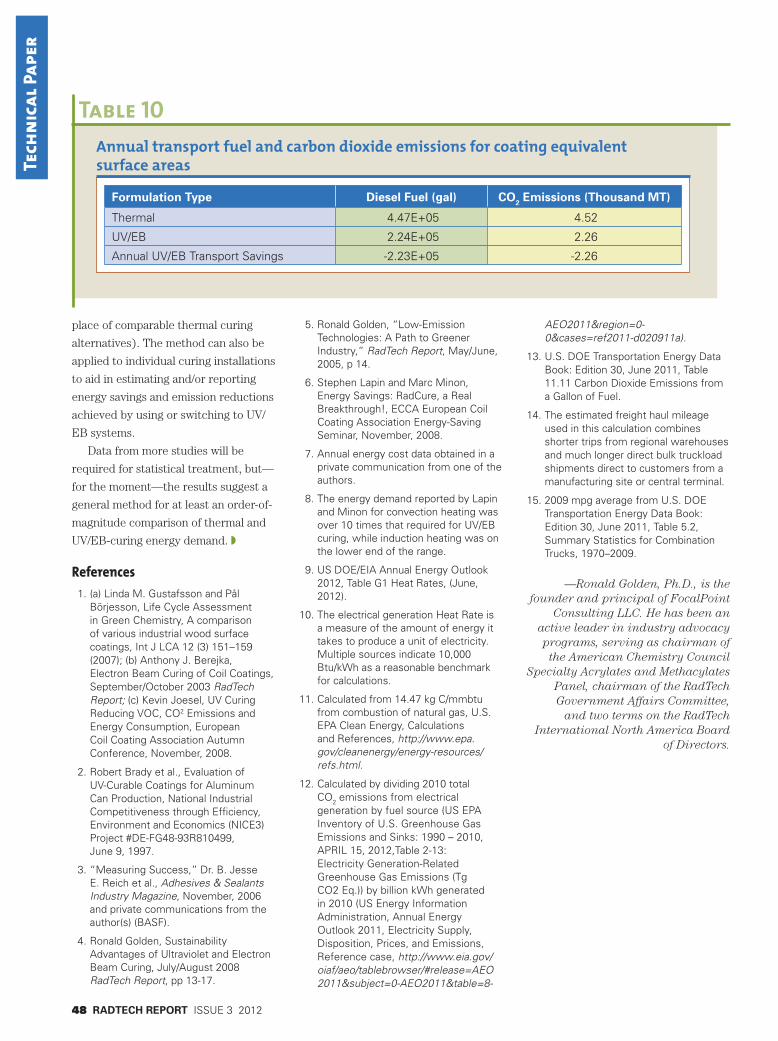
Transport Sustainability BenefitsFinally, assuming an average solvent
and W/B thermal formulation percent
solids of 50%, transport of UV/EB
formulations requires half as much
diesel fuel and emits half as much
carbon dioxide. Table 10 estimates
the annual transport sustainability
benefit of 100% solids radiation-
curable formulations, using the volume
of shipments from Table 5 and the
following factors—20 MT shipped per
truckload, 22.2 pounds of CO2 per
gallon of diesel fuel combustion,13 an
estimated 500-mile freight haul trip14
and average diesel carrier fuel mileage
of 6.0 mpg.15
General ApplicationWhile statistical analysis of data
from additional independent studies
still would be needed to confirm the
concept, based on the limited data
available, the order of magnitude
difference between thermal and
radiation-curing energy demand
appears to be relatively insensitive
to the type of printing or coating
process, and to the applied coat
weight. Companies that would like to
quantify energy savings and emissions
reductions to support their own
sustainability programs, or those who
are deciding between thermal and
UV or EB processes for new
installations, can use the same
methodology to estimate order-of-
magnitude comparisons between the
two types of processes.
ConclusionsAnalysis of energy demand data
from three completely different
side-by-side comparative case studies
shows quite consistent differences in
normalized energy requirements in
Btu/m2 required to coat one square
meter of substrate using thermal and
UV/EB-curing processes. Overall,
thermal-curing energy requirements
consistently were found to be five to
nine times higher than UV/EB curing in
the same processes.
Based on these findings, average
order-of-magnitude estimates for
UV/EB versus thermal-curing energy
demand were used in combination
with 2011 North American market data
reported by RadTech to calculate a
“Sustainability Score” for UV/EB
( i.e., the total energy savings
and greenhouse gas reductions
achieved when UV/EB was used in
Table 8Greenhouse gas emission factors
120 lb. CO2/1,000 cu ft of natural gas combustion11
2,157 lb. CO2 Eq/MWh produced by coal (Calculated12)
1,131 lb. CO2 Eq/MWh produced by natural gas (Calculated12)
1,644 lb. CO2 Eq/MWh produced by electrical power from a 50-50 mix of coal and natural gas*
*The actual mix of fuel sources for electrical power generation varies widely by region of the country. For these calculations, the electricity generating fuel mix is assumed to be 50% coal, 50% natural gas and 0% other.
Table 9North American carbon dioxide emissions for coating equivalent surface areas
Curing Process CO2 Emissions
(Million MT)
Thermal 4.60
UV/EB 0.85
Annual UV/EB CO2 Reduction -3.75
48 RADTECH REPORT ISSUE 3 2012
Tech
nica
l Pap
er
place of comparable thermal curing
alternatives). The method can also be
applied to individual curing installations
to aid in estimating and/or reporting
energy savings and emission reductions
achieved by using or switching to UV/
EB systems.
Data from more studies will be
required for statistical treatment, but—
for the moment—the results suggest a
general method for at least an order-of-
magnitude comparison of thermal and
UV/EB-curing energy demand. w
References 1. (a) Linda M. Gustafsson and Pål
Börjesson, Life Cycle Assessment in Green Chemistry, A comparison of various industrial wood surface coatings, Int J LCA 12 (3) 151–159 (2007); (b) Anthony J. Berejka, Electron Beam Curing of Coil Coatings, September/October 2003 RadTech Report; (c) Kevin Joesel, UV Curing Reducing VOC, CO2 Emissions and Energy Consumption, European Coil Coating Association Autumn Conference, November, 2008.
2. Robert Brady et al., Evaluation of UV-Curable Coatings for Aluminum Can Production, National Industrial Competitiveness through Efficiency, Environment and Economics (NICE3) Project #DE-FG48-93R810499, June 9, 1997.
3. “Measuring Success,” Dr. B. Jesse E. Reich et al., Adhesives & Sealants Industry Magazine, November, 2006 and private communications from the author(s) (BASF).
4. Ronald Golden, Sustainability Advantages of Ultraviolet and Electron Beam Curing, July/August 2008 RadTech Report, pp 13-17.
5. Ronald Golden, “Low-Emission Technologies: A Path to Greener Industry,” RadTech Report, May/June, 2005, p 14.
6. Stephen Lapin and Marc Minon, Energy Savings: RadCure, a Real Breakthrough!, ECCA European Coil Coating Association Energy-Saving Seminar, November, 2008.
7. Annual energy cost data obtained in a private communication from one of the authors.
8. The energy demand reported by Lapin and Minon for convection heating was over 10 times that required for UV/EB curing, while induction heating was on the lower end of the range.
9. US DOE/EIA Annual Energy Outlook 2012, Table G1 Heat Rates, (June, 2012).
10. The electrical generation Heat Rate is a measure of the amount of energy it takes to produce a unit of electricity. Multiple sources indicate 10,000 Btu/kWh as a reasonable benchmark for calculations.
11. Calculated from 14.47 kg C/mmbtu from combustion of natural gas, U.S. EPA Clean Energy, Calculations and References, http://www.epa.gov/cleanenergy/energy-resources/ refs.html.
12. Calculated by dividing 2010 total CO2 emissions from electrical generation by fuel source (US EPA Inventory of U.S. Greenhouse Gas Emissions and Sinks: 1990 – 2010, APRIL 15, 2012,Table 2-13: Electricity Generation-Related Greenhouse Gas Emissions (Tg CO2 Eq.)) by billion kWh generated in 2010 (US Energy Information Administration, Annual Energy Outlook 2011, Electricity Supply, Disposition, Prices, and Emissions, Reference case, http://www.eia.gov/oiaf/aeo/tablebrowser/#release=AEO2011&subject=0-AEO2011&table=8-
AEO2011®ion=0-0&cases=ref2011-d020911a).
13. U.S. DOE Transportation Energy Data Book: Edition 30, June 2011, Table 11.11 Carbon Dioxide Emissions from a Gallon of Fuel.
14. The estimated freight haul mileage used in this calculation combines shorter trips from regional warehouses and much longer direct bulk truckload shipments direct to customers from a manufacturing site or central terminal.
15. 2009 mpg average from U.S. DOE Transportation Energy Data Book: Edition 30, June 2011, Table 5.2, Summary Statistics for Combination Trucks, 1970–2009.
—Ronald Golden, Ph.D., is the founder and principal of FocalPoint
Consulting LLC. He has been an active leader in industry advocacy programs, serving as chairman of the American Chemistry Council
Specialty Acrylates and Methacylates Panel, chairman of the RadTech Government Affairs Committee,
and two terms on the RadTech International North America Board
of Directors.
Table 10Annual transport fuel and carbon dioxide emissions for coating equivalent surface areas
Formulation Type Diesel Fuel (gal) CO2 Emissions (Thousand MT)
Thermal 4.47E+05 4.52
UV/EB 2.24E+05 2.26
Annual UV/EB Transport Savings -2.23E+05 -2.26