technical paper by h.t. eid, t.d. stark and c.k. doerfler...
TRANSCRIPT

Technical Paper by H.T. Eid, T.D. Stark and C.K. Doerfler
EFFECT OF SHEAR DISPLACEMENT RATE ON
INTERNAL SHEAR STRENGTH OF A REINFORCED
GEOSYNTHETIC CLAY LINER
ABSTRACT: Torsional ring shear tests were performed to evaluate the effect of shear displacement rate on the internal shear strength of a needle-punched geosynthetic clay liner (GCL) under different normal stresses. The test results suggest that the internal shear strength of the needle-punched GCL depends on the following three factors: (i) resistance against reinforcement fibers pulling out and/or tearing; (ii) amount of positive pore-water pressure induced during shear; and (iii) bentonite water content at the time of shearing. The laboratory tests indicate that the net effect of these three factors result in the peak internal shear strength being less sensitive to shear displacement rate at normal stresses between 200 and 400 kPa than at normal stresses less than 200 kPa. Shear displacement rate appears to have little influence on the residual internal shear strength regardless of normal stress. The amount of shear displacement required to reach the peak and residual internal shear strengths is dependent on the shearing normal stress, shear displacement rate, and quantity of needie-punched fibers.
KEYWORDS: Geosynthetic clay liner, Normal stress, Strength, Shear rate.
AUTHORS: H.T. Eid, Assistant Professor, Civil Engineering Department, Zagazig University-Shobra Branch, Cairo, Egypt; T.D. Stark, Associate Professor, 2217 Newmark Civil Engineering Laboratory, University of Illinois, 205 N. Mathews Ave., Urbana, Illinois 61801, USA, Telephone: 11217-333-7394, Telefax: 1/217-333-9464. C.K. Doerfler, Graduate Research Assistant, b227 Newmark Civil Engineering Laboratory, University of Illinois, 205 N. Mathews Ave., Urbana, Illinois 61801, USA, Telephone: 1/217-244-9092, Telefax: 1/217-333-9464.
PUBLICATION: Geosynthetics International is published by the Industrial Fabrics Association International, 1801 County Road B West, Roseville, Minnesota 55113-4061, USA, Telephone: 1/651-222-2508, Telefax: 1/651-631-9334. Geosynthetics International is registered under ISSN 1072-6349.
DATES: Original manuscript received 18 December 1998, revised version received 12 March 1999, and accepted 7 June 1999. Discussion open until 1 January 2000.
REFERENCE: Eid, H.T., Stark, T.D. and Doerfler, c.K., 1999, "Effect of Shear Displacement Rate on Internal Shear Strength of a Reinforced Geosynthetic Clay Liner", Geosynthetics International, Vol. 6, No.3, 219-239.
GEOSYNTHETICS INTERNATIONAL • 1999, VOL. 6, NO.3 219

1
EID, STARK AND DOERFLER • Internal Shear Strength of a Reinforced Gel
INTRODUCTION
Since the mid-1980s, geosynthetic clay liners (GeLs) have been used as impervious barriers in composite liner and cover systems for waste containment facilities. Unreinforced GeLs consist of a thin layer (approximately 5 mm thick before hydration) of bentonite, bonded to a geomembrane, or sandwiched between two geotextiles. Hydrated bentonite exhibits extremely low shear strength and, thus, landfill liner and cover slopes constructed with an unreinforced GeL may be susceptible to static and seismic instability. As a result, the bentonite layer in a GeL can be reinforced by connecting the backing geotextiles with needle punching or stitch bonding to increase the internal shear strength of the GeL. The bentonite typically used in GeLs is Wyoming bentonite, which consists of 90 to 95% montmorillonite and 5 to 10% quartz and feldspar. Typical values of liquid limit and plasticity index are 600 to 650 and 560 to 610, respectively (Gleason et a1. 1997).
There are two possible failure modes for reinforced GeLs: (i) sliding at the interface between the top or bottom of the GeL and the adjacent material (termed interface failure); and (ii) sliding through the bentonite that is between the backing geotextiles (termed internal failure). Internal failure is usually a concern when a textured geomembrane is placed in contact with a GGL because shear stresses can be transmitted to the GeL, especially if a nonwoven geotextile is in contact with the geomembrane. The needle-punch or stitch-bond reinforcement is used to reduce the potential for failure through the bentonite and, thus, shifts the failure surface to an interface that exhibits a shear strength lower than the internal shear strength. (It will be shown in Section 3.4 that the internal failure surface usually corresponds to the upper geotextile-bentonite interface and not the mid-plane of the bentonite.) Some of the main questions in laboratory measurement of the internal shear strength of reinforced GeLs are shear displacement rate, shearing normal stress, and hydration procedure that should be used. The selection of the shear displacement rate has important implications for the cost and scheduling of commercial testing and, thus, the acceptance or marketability of GeLs.
The current paper concentrates on the effect of shear displacement rate on the internal shear strength of a hydrated needle-punched GeL under a range of normal stresses. Because the internal shear strength of a GeL is product and project specific, the discussion herein concentrates on illustrating the factors that affect the internal shear behavior of a needle-punched GeL rather than providing values for project-specific design.
2 BACKGROUND
2.1 Introduction
The American Society for Testing and Materials (ASTM) is developing a standard test method for GeL shear testing. In the interim, the ASTM D 5321 standard test method, which is for soil-geosynthetic and geosynthetic-geosynthetic interfaces, is being used for GeLs. ASTM D 5321 requires a shear displacement rate of 1.0 mm/minute; however, the limited data available on the effect of shear displacement rate on the measured internal shear strength of needle-punched GeLs suggests that shear displacement
GEOSYNTHETICS INTERNATIONAL· 1999. VOL. 6. NO.3 220

-----------------""
EID, STARK AND DOERFLER • Internal Shear Strength of a Reinforced Gel
rates slower than 1.0 mm/minute result in a lower measured shear strength (Stark and Eid 1996; Berard 1997; Fox et a1. 1998).
Stark and Eid (1996) used the modified Bromhead torsional ring shear tests to determine the effect of shear displacement rate on a needle-punched GeL hydrated and sheared at a normal stress of 17 kPa. The needle-punched GeL was manufactured by the National Seal Company and is named Bentofix Thermal-Lock. Stark and Eid (1996) concluded that the peak internal shear strength of a needle-punched GeL depends on two factors: (i) the resistance against pullout and/or tearing of the reinforcing fibers; and (ii) the shear strength of the bentonite. Stark and Eid (1996) explained that the change in the measured peak shear strength with shear displacement rate of a needlepunched GeL is a result of: (i) the increase in fiber strength and, thus, internal shear strength due to tearing of the reinforcing fibers instead of allowing a slow gradual pullout of the woven geotextile fibers; and (ii) the reduction in effective normal stress and, thus, internal shear strength due to the generation of positive, shear-induced pore-water pressure. These two factors were determined from comparisons between the shear behavior of the hydrated reinforced GeL with and without bentonite under different shear displacement rates. Stark and Eid (1996) found that the peak internal shear strength of the GeL without bentonite increases with increasing shear displacement rate. However, the peak internal shear strength of the GCL with bentonite starts decreasing at a shear displacement rate of approximately 1.5 mm/minute due to the increase in positive excess pore-water pressures in the bentonite. After shearing under a normal stress of 17 kPa, the bentonite is usually saturated and has a water content ranging from 140 to 160%; therefore, positive pore-water pressures can develop. Stark and Eid (1996) also conclude that the measured residual shear strength is insensitive to shear displacement rate at a normal stress of 17 kPa.
2.2 Previous Studies
Figure 1 shows typical test results presented by Berard (1997) using a 305 mm x 305 mm direct shear box and a needle-punched GeL that was hydrated and sheared at the same normal stress used by Stark and Eid (1996), i.e. 17 kPa. Naue Fasertechnik GmbH & Co. provided the Bentofix heat-burnished fiber, needle-punched GeL used in the Berard (1997) study. Normal stresses of 25,50, and 100 kPa were used in the study. It can be seen in Figure 1 that for shear displacement rates between 0.01 and 1.0 mm/minute, the peak internal shear strength increases with increasing shear rate. This increase in peak internal shear strength is more pronounced at higher normal stresses.
Figure 1 also presents data from Fox et a1. (1998) in which a 406 mm x 1067 mm direct shear box was used for GeL shear testing. The needle-punched GeL specimens were hydrated using a four-day, two-stage procedure. The first stage involved hydration for two days in a pan with tap water without a normal stress to achieve the estimated final water content. The second hydration stage involved placing the GCL in the shear machine and hydrating for two days at the shearing normal stress. The GeL used in this study is called Bentomat ST and was manufactured by Colloid Environmental Technologies Company (CETCO). It can be seen that the peak internal shear strength increases with increasing shear displacement rate between 0.01 and 10 mm/minute. The residual shear strength appears to be independent of the shear displacement rate magnitude.
GEOSYNTHETICS INTERNATIONAL • 1999, VOL. 6, NO.3 221

EIO, STARK AND DOERFLER • Internal Shear Strength of a Reinforced GeL
180
160 1Itl i
140 Shearing normal Peel
ro c.. 120 Reference stress (kPa)
strength (N/100 mm)
::::.. .r.- 1000> C (J).... (j) 80
Peak V V v Berard • 72.2 160
" (1997) 0 r-.--------• 25 71
"co (J)
.J::. (f) 60
I--i-I
~ ~I
~ f.--
j-Fox et al. (1998) • ...
50
100
71
71
40
20
- f
~ Interpol~t~ to shearing II normal stress:: 72.2 kPa
0 I Residual
IT J I II I)...
UUI II 0.001 0.01 0.1 10 100
Shear displacement rate (mm/minute)
Figure 1. Effect of shear displacement rate on measured needle-punched GeL specimen internal shear strength at different shearing normal stresses.
The data in the paper by Stark and Eid (1996) and Figure 1 suggest that shear displacement rate influences the measured peak internal shear strength of hydrated needlepunched GCLs. However, the available data was obtained at normal stresses equal to or less than 100 kPa and does not address normal stresses that correspond to landfill liner systems subjected to waste heights greater than approximately 9 m, i.e. a normal stress greater than 100 kPa. As a result, the effect of shear displacement rate on the measured internal shear strength of a hydrated, needle-punched GCL subjected to high normal stresses is the main focus of the current paper.
2.3 Effect of Needle Punching
The peel strength of a GCL is an indicator of the amount of needle punching and, thus, the internal shear strength of the GCL. The peel strength is the force necessary to separate or peel the two geotextiles of a 100 mm-wide GCL specimen. The peel tests are conducted using specimens at the as-received moisture content and in general accordance with ASTM D 4632 for grab strength of geotextiles. It can be seen from Figure 1 that the peel strength varies considerably from 71 to 160 N/lOO mm width for these two needle-punched GCLs. In addition, the peel strength of the needle-punched GCL varies from 27 (in the current study) to 71 N/100 mm (Berard 1997). For comparison purposes, typical material specifications for needle-punched GCLs recommend a peel strength of 65 N/100 mm (Colloid Environmental Technologies Company 1998).
222 GEOSYNTHETICS INTERNATIONAL. 1999, VOL. 6, NO.3

EID, STARK AND DOERFLER • Internal Shear Strength of a Reinforced Gel
The differences in peel strengths noted above are caused by differences in the needling boards. Needles are broken during the needling process and must be replaced periodically. The longer the service life of a needling board the more needles that are broken. In summary, the peel strength and, thus, internal shear strength varies with the magnitude of needling. As a result, the magnitude of needle punching can vary from roll to roll. Clearly, shear testing conducted for design purposes should utilize the GCL that will be delivered to a specific site or a representative sample. This can be checked using a peel test; if the peel strength is significantly greater than the specified values, e.g. 65 NIlOO mm, it may not be representative of field conditions and probably should not be shear tested.
The difference in the quantity of needle punching will significantly influence the internal shear test results. For example, Figure 1 shows peak shear strengths as a function of shear displacement rate at a normal stress of 72.2 kPa for both the Fox et a1. (1998) and Berard (1997) data sets. The peak shear strength relationship at a normal stress of 72.2 kPa for the Berard (1997) data was interpolated from the data corresponding to shearing normal stresses of 50 and 100 kPa. Comparing these peak strength relationships for the same shearing normal stress and noting the large difference in peel strengths between the data sets illustrates that differences in peel strength can translate to an increase in peak internal shear strength of approximately 100%. The increase shown in Figure 1 is even more impressive when the two different hydration procedures are considered. Berard (1997) hydrated the specimen at the shearing normal stress, while Fox et a1. (1998) hydrated the specimen primarily with no normal stress. Therefore, the hydration process used by Fox et a1. (1998) was more severe than Berard (1997) and it would be expected that the internal shear strengths measured by Fox et a1. (1998) would be lower than those measured by Berard (1997). However, the internal shear strengths measured by Fox et a1. (1998) were larger by approximately 100%. Therefore, increasing the quantity of needle punching can reduce the effects of hydration and increase the internal shear strength. It should be noted that the peel strength of 160 N/100 mm reported by Fox et a1. (1998) is significantly greater than the typical material specification of 65 N/100 mm.
3 TESTING PROGRAM
3.1 Material
The reinforced GCL used in the current study was manufactured by the National Seal Company and is referred to as Bentofix Thermal-Lock. The same GCL was used to develop the test results presented by Stark and Eid (1996), which will be used in Section 4.1 for comparison purposes. Three test specimens (100 mm x 200 mm) were used to estimate the peel strength, which ranged from 25 to 29 Nil 00 mm or an average of 27 N/lOOmm, using the test procedure described in Section 2.3.
3.2 Apparatus and Test Specimen
The internal shear strength of the reinforced GCL was measured using the modified Bromhead torsional ring shear apparatus described by Stark and Eid (1996) at shearing
GEOSYNTHETICS INTERNATIONAL • 1999, VOL. 6, NO.3 223

EIO, STARK AND DOERFLER • Internal Shear Strength of a Reinforced Gel
normal stresses less than 100 kPa. It will be shown in Section 3.2 that for shearing stresses greater than 100 kPa, the sample preparation procedure had to be modified to ensure failure through the reinforcing fibers instead of external failure at an interface with the GeL. The specimen container consists of a top platen, upper plastic ring, lower plastic ring, and bottom platen (Figure 2). To prepare the test specimen, the GeL was cut in a circle with a diameter of approximately 160 mm. A circular hole with a diameter of 40 mm was cut in the center of the circular specimen. The diameter of the GeL, not including the woven geotextile, was then reduced to 100 mm, which is the outside diameter of the ring shear specimen container. The woven geotextile, now extending beyond the edge of the nonwoven geotextile, was cut to yield eight extended wedges or flaps. In order to reduce bentonite loss during trimming, the edges of the GeL were moistened
Top platen
C---'
Screw fasteners ~ : 1
~ 1-=- 1 Upper
plastic ring
e J££i2h-- ' i"--=-=--];il;~~~= Woven geotextile ..... i~ d -=c:..-- I t . Reinforced
bentonite Nonwoven geotextile
Lower plastic ring
Bottom platen
Figure 2. Schematic of ring shear specimen container for GeL internal she~r strength testing.
GEOSYNTHETICS INTERNATIONAL • 1999, VOL. 6, NO. 3 224

EID, STARK AND DOERFLER • Internal Shear Strength of a Reinforced Gel
using a spray bottle. The upper plastic ring with inside and outside diameters of 40 and 100 mm, respectively, was then centered over the woven geotextile. The eight woven geotextile wedges were then folded over and adhered to the reverse side of the upper plastic ring using an adhesive. This reverse side of the plastic ring (with the specimen attached to it) was then glued to the top platen of the ring shear apparatus.
It should be noted that the woven geotexti1e overlying the annular specimen was not glued directly to the lower face of the upper plastic ring. This was done to prevent bonding the GCL reinforcing fibers and/or slit-film fibers of the woven geotextile to the upper plastic ring. This allowed the reinforcing and geotextile fibers to pullout if necessary. The upper plastic ring and the top platen were also connected through a tongue and groove joint to prevent shearing at the glue-geotextile interface. The nonwoven geotextile face of the specimen was glued to the lower plastic ring that attaches to the bottom platen of the ring shear apparatus via four screws.
The above design was successful for shearing the GCL at normal stresses less than 100 kPa (Stark and Eid 1996). For shearing at a normal stress of 100 kPa, a shear failure occurred at the glue-nonwoven geotextile interface at the lower platen before internal shearing took place within the GCL. This was caused by high shear stresses exceeding the shear strength of the glue-geotextile interface. This problem was overcome by increasing the area of nonwoven geotextile that was glued to the lower plastic ring and bottom platen. As seen in Figure 2, this was accomplished by extending the nonwoven geotextile to the edge of the bottom platen and securing it to the platen with glue. In addition, four screws were used to secure the nonwoven geotextile to the bottom platen. This modification increased the glue-nonwoven geotextile interface shear strength to a level that resisted the high shear stresses required to cause an internal failure at the high shearing normal stresses and rapid shear displacement rates. The testing program was successfully completed with the modified specimen preparation procedures.
3.3 Specimen Anisotropy
One possible limitation of using a ring shear device is specimen anisotropy. This limitation has not been found to be significant in testing needle-punched GCLs because most needle punching appears to be isotropic. In addition, the ring shear results are compared to at least one large-scale direct shear test performed in accordance with ASTM D 5321. For example, Stark and Eid (1996) show excellent agreement between peak internal shear strengths using the ring shear and large-scale direct shear (ASTM D 5321) tests. However, the large continuous shear displacement allowed in the ring shear device usually results in the ring shear apparatus yielding a lower shear strength at the end of the test than the large-scale direct shear apparatus.
3.4 Procedure
To address the effect of shear displacement rate and shearing normal stress, ring shear tests were conducted at normal stresses of 100, 200, and 400 kPa to simulate a landfill liner system under various loading conditions. In each test series, seven different specimens were sheared at displacement rates of 0.015,0.045,0.15,0.5, 1.5, 18.3, and 36.5 mm/minute. For each test, the specimen was hydrated under a normal st~ess of 17 kPa. Hydration usually required two weeks and was completed when the vertIcal
225.GEOSYNTHETICS INTERNATIONAL • 1999, VOL. 6, NO.3

-------
EID, STARK AND DOERFLER • Internal Shear Strength of a Reinforced Gel
deformation or swelling ceased. Hydration was assumed to be complete by the end of primary swelling as defined by ASTM D 4546. Hydration at a normal stress of 17 kPa allows for more bentonite hydration before shearing, which simulates a critical field condition with regard to slope stability. After hydration was complete, the specimen was loaded to the desired shearing normal stress in small increments to ensure little, if any, extrusion of bentonite. A new load increment was added to the specimen only after it completed primary consolidation induced by the previous load increment. A load increment ratio, i.e. the increase in normal stress divided by the existing normal stress, of 0.1 was used to increase the normal stress. This consolidation stage was completed in 3 to 13 days depending on the magnitude of the shearing normal stress and the amount of bentonite in the GCL when the sample was prepared. The variance in the amount of bentonite among GCL samples can be caused by bentonite moving within the GCL during transportation and handling. Care was taken to obtain GCL samples with similar quantities of bentonite so as to minimize the effect of bentonite variance on test results. Shearing of the specimen was conducted after consolidation at the shearing normal stress and was continued until the residual shear strength was reached. At that point, the test was stopped. Achievement of the residual strength condition was verified by plotting the data using the logarithm of horizontal displacement as suggested by La Gatta (1970). This plotting technique accentuates the slope of the shear stress-horizontal displacement relationship at large displacements, allowing the horizontal portion of the relationship to be clearly defined.
For all of the tests, the shear surface was located just below the woven geotextile at the top of the GCL. This was verified by visual inspection of each GeL specimen after the residual shear strength was reached. The internal failure was caused by the reinforcing fibers pulling out of the woven geotextile or tearing and, thus, separating the woven geotextile from the remainder of the GeL. Figure 3 shows a typical shear surface of a needle-punched GeL specimen after failure. It can be seen that the reinforcing fibers that separated from the woven geotextile, which is still attached to the top platen, are protruding from the slickensided bentonite surface in the bottom platen and oriented parallel to the direction of shear. Gilbert et a1. (1996) and Fox et a1. (1998) have also reported the location of the failure plane at the woven geotextile-bentonite interface.
4 RESULTS AND DISCUSSION
4.1 Shear Behavior and Shear Displacement to Failure
Figure 4 presents typical shear stress-displacement relationships for GeL specimens under normal stresses of 17, 100, 200, and 400 kPa and a shear displacement rate of 0.015 mm/minute. The peak shear strength of the GeL is reached after a shear displacement between 10 and 20 mm followed by a significant decrease until the specimen reaches the residual shear strength condition. Figure 5 shows the effect of normal stress on the amount of shear displacement required to reach the peak and residual shear strengths. Each data point in Figure 5 represents the average displacement for shear rates ranging from 0.015 to 36.5 mm/minute for a given shear normal stress.
The amount of displacement required to reach the peak shear strength increases slightly with increasing normal stress. This is probably caused by the decreased GeL
GEOSYNTHETICS INTERNATIONAL • 1999, VOL. 6, NO.3226

EID, STARK AND DOERFLER • Internal Shear Strength of a Reinforced Gel
Figure 3. Ring shear GeL specimen after internal shear strength testing.
thickness that occurs with increasing normal stress (Figure 5). During hydration at a normal stress of 17 kPa, the GCL specimen swells to a certain thickness. An effect of this swelling is that the reinforcing fibers in the GeL stretch and tensile stresses develop along the length of the fibers. After hydration is complete, the specimen is consolidated to the shearing normal stress. As mentioned previously, the specimens were loaded slow enough to minimize bentonite extrusion through the specimen circumferences during the consolidation process. The GCL thickness decreases due to consolidation, and the reinforcing fibers relax. As the shearing normal stress increases, the reduction in bentonite thickness increases and, therefore, the amount of relaxation increases. When the
GEOSYNTHETICS INTERNATIONAL • 1999. VOL. 6, NO. 3 227

EID, STARK AND DOERFLER • Internal Shear Strength of a Reinforced GeL
80 Rate of shear = 0.015 mm/minute
70 Hydration normal stress = 17 kPa
Normal stress during shear 60
• 17 kPa • 200 kPa • 100 kPa .. 400 kPa co a.. 50..:.:::-en en
Q) '- 40
+-' en ... ct! Q) ..c 30 (f)
20
After Stark and Eid (1996) 10
00 10 20 30 40 50 60 70 80 90 100
Shear displacement (mm)
Figure 4. Internal shear strength-displacement relationships for needle-punched GeL specimens at shearing nonna) stresses of 17,100,200, and 400 kPa.
100
-E 80E Residual-....... c Q)
E 60 Q) u ct! 0. (/) 40 "0 ... ct! Q) ..c 20 Peak (f) ii
°0 50 100 150 200 250 300 350 400 450
Shearing normal stress (kPa)
Figure 5. Effect of shearing normal stress on the shear displacement required to reach peak and residual internal shear strengths of needle-punched GeL specimens for displacement rates of 0.015 to 36.5 mm/minute.
228 GEOSYNTHETICS INTERNATIONAL • 1999. VOL. 6, NO.3

EID, STARK AND DOERFLER • Internal Shear Strength of a Reinforced GeL
specimen is sheared, the fibers must be pulled tightly before they can tear or be pulled from the woven geotextile. At normal stresses less than 100 kPa, a small shearing displacement, i.e. less than 14 mm, is required to reach the peak shear strength because the fibers are already tight or in tension. In contrast, the shear displacement needed before fiber damage occurs at high normal stresses, i.e. greater than 200 kPa, is greater because additional shear displacement is needed to re-tension the fibers.
Figure 5 also shows that the shear displacement required to reach the residual condition decreases with increasing shearing normal stress. The residual condition is reached when all of the reinforcement fibers are torn or pulled from the woven geotextile and oriented, along with the bentonite particles, parallel to the direction of shearing. Higher shearing normal stresses and the corresponding shear stresses facilitate the fiber and particle orientation process, which allows the GeL to reach the residual shear strength at a smaller shear displacement. Therefore, the shearing displacement required for the residual condition decreases as the shearing normal stress increases. It should be noted that the values in Figure 5 are to be considered approximate. This is caused by the dependency of the amount of displacement required to reach peak and residual shear strengths on the shear displacement rate. The values shown in Figure 5 are average values over the range of shear displacement rates, 0.015 to 36.5 mm/minute, used in the current study.
The displacements required to reach the peak internal shear strength shown in Figure 5 are similar to those reported by Gilbert et al. (1996). However, Fox et al. (1998) reported higher displacements required to reach peak and residual strength conditions. Fox et al. (1998) report that between 20 and 30 mm of shear displacement was required to reach the peak shear strength, while between 80 and 130 mm of displacement was required to reach a shear stress 10% greater than the residual shear strength. These differences may be caused by the difference in the test equipment, specimen size, and quantity of needle-punched fibers. In particular, the significantly greater peel strength (160 N/100 mm) reported by Fox et a1. (1998) indicates that more needle-punched fibers have to be tensioned or mobilized before the peak shear strength is achieved. Although Gilbert et al. (1996) did not report a peel strength value, it is anticipated that it was lower than 160 NIlOO mm because their peak internal shear strengths are two to three times lower than those reported by Fox et al. (1998) for similar shearing normal stresses. Therefore, the shear displacement required to reach the peak internal shear strength is lower for Gilbert et al. (1996) than Fox et al. (1998) and in agreement with the values reported herein.
Figure 5 also can be used to evaluate direct shear test results for design purposes. For example, the normal stress in a direct shear test, e.g. ASTM D 5321, can be used to estimate the displacement required to achieve a residual strength condition. If the direct shear test did not achieve the shear displacement estimated from Figure 5, the test may not have reached a true residual strength condition. This type of comparison might be useful for shear testing using a 0.3 m by 0.3 m direct shear box that is usually stopped before a true residual strength, i.e. a constant minimum strength, is obtained.
4.2 Effect of Shear Displacement Rate on Shear Displacement to Failure
Figure 6 shows the effect of shear displacement rate on the amount of shear displacement required to reach the peak and residual internal strengths. Each data point on Figure 6 is an average displacement for shearing normal stresses ranging from 17 to 400
GEOSYNTHETICS INTERNATIONAL • 1999, VOL. 6, NO.3 229

-_._-_._._.._----
EID, STARK AND DOERFLER • Internal Shear Strength of a Reinforced Gel
100 I
~-E E--
80
'--" --' ~f---f-
Residual
I---"; ~
c: (])
E 60 ~
I--4
~ ~ 4
(]) (J tll Q. w 40 "0 ' tll ~
I I
Q) .c r.J) 20 -.
~ • iii =
~
Peak J: ::I:
I I ::t: :I
1 8.01 0.1 1 10 100
Shearing displacement rate (mm/minute)
Figure 6. Effect of shear displacement rate on the shear displacement required to reach peak and residual internal shear strengths of needle-punched GeL specimens for shearing normal stresses of 17 to 400 kPa.
kPa at a given shear displacement rate. The amount of displacement required to reach the peak shear strength is relatively constant with respect to shear displacement rate. As discussed by Stark and Eid (1996), at low shear displacement rates the failure plane is formed as reinforcing threads gradually pull out of the woven geotextile. In contrast, at higher shear displacement rates, tearing of the reinforcing fibers leads to failure plane formation. It therefore appears that shear displacement rate and amount of displacement needed to reach the peak shear strength are independent of the mode of failure.
Figure 6 also shows that the displacement required to reach the residual shear strength increases with shear displacement rate. This is likely caused by the increase in positive shear-induced pore-water pressures with increasing shear displacement rate. This increase in pore-water pressure likely increases the amount of displacement required to reach the residual shear stress.
In summary, a shear displacement of 10 to 20 mm appears large enough to initiate tearing or pulling out of the reinforcing fibers from the woven geotextile, while between 50 and 90 mm of displacement is needed to reach a residual condition. Both of these values are dependent on the shearing normal stress, shear displacement rate, and the amount of needle-punching.
The small shear displacement needed to reach a peak strength condition, and the fact that it is dependent on the shearing normal stress and shear displacement rate, has important implications for the shear strength that should be used for the static and seismic design of GeL-lined slopes. In addition, the relatively small shear displacement needed for a reinforced GeL to reach the peak and residual shear strength compared to those
230 GEOSYNTHETICS INTERNATIONAL • 1999, VOL. 6, NO.3

EID, STARK AND DOERFLER • Internal Shear Strength of a Reinforced Gel
of municipal solid waste enhances the possibility of progressive failure in reinforced GCL slopes (Mitchell et al. 1995; Stark et al. 1998).
The shear displacement data in Figures 5 and 6 also can be used to assess the impact of earthquake-induced permanent deformation on the internal shear strength of a needle-punched GCL. The calculated permanent deformation and the average normal stress acting on the shear surface can be used to estimate whether or not a peak or residual internal shear strength will be mobilized. For example, if the average normal stress acting on the failure surface is 300 kPa, the approximate shear displacement required to reach the peak and residual internal shear strengths are 16 and 68 mm, respectively (Figure 5). If the calculated permanent deformation is 150 mm, a residual internal shear strength should be considered.
It should be noted that the displacement values in Figures 5 and 6 depend on the fixity of the geotextiles with respect to the testing apparatus. For the test procedure described herein, the entire nonwoven geotextile was fixed to the bottom platen and no distortion of the GCL occurred during shear. This includes no stretching of the nonwoven geotextile at the screw locations. The portion of the woven geotextile overlying the annular specimen was not rigidly attached to the upper ring and movement was allowed between the geotextile and the ring. As mentioned earlier, this was done to allow the needle-punched fibers to pullout if necessary. Caution should be used when using these values if conditions at the GCL interfaces with adjacent material in the field or laboratory are different than those described herein. However, it is anticipated that Figures 5 and 6 can be used to obtain a general estimate of the shear displacement required to reach peak and residual internal shear strengths of needle-punched GCLs.
4.3 Peak and Residual Failure Envelopes
Figure 7 shows peak and residual shear strength envelopes for the GCL sheared at a displacement rate of 0.015 mm/minute. It can be seen that the peak and residual failure envelopes are stress dependent. The nonlinearity of the failure envelopes is probably caused by the ability of high normal stresses to enhance the orientation of the bentonite particles and the reinforced fibers in a direction parallel to shear. Stark and Eid (1994, 1997) show that a similar mechanism causes the nonlinear shear strength behavior of
.c Hydration normal stress = 17 kPa Peak ..... C)
50 --JL---------;R~e=s~id:.u:a~I------c:::
~ ..... en ~
co Q) o~~~--~~~--~~~--~~~--~~~--~~~~
U) 350 400 450.c o 50 100 150 200 250 300
Consolidation and shearing normal stress (kPa)
Figure 7. Peak and residual shear strength failure envelopes for needle-punched GeL specimens (shear displacement rate = 0.015 mm/minute).
GEOSYNTHETICS INTERNATIONAL • 1999, VOL 6, NO.3 231

EID, STARK AND DOERFLER • Internal Shear Strength of a Reinforced Gel
cohesive soils. Figure 7 also shows that the peak failure envelope exhibits a shear strength intercept. This intercept is due to the fibers providing some shear strength even at zero shearing normal stress. It should be noted that the average residual friction angle for the needle-punched GeL, r, shown in Figure 7 is higher than the value of 2 0 reported for pure bentonite or montmorillonite (Mesri and Cepeda-Diaz 1986) for the same range of normal stress used in the ring shear testing. It is thought that this is caused by the tom GCL fibers being immersed in the hydrated bentonite and the bentonite not consisting of pure montmorillonite, both of which increase the residual friction angle of the mixture. It is also thought that the increase in the residual friction angle could be caused by the failure plane being located at the woven geotextile-bentonite interface and not entirely within bentonite as is the case for the Mesri and Cepeda-Diaz (1986) data. The residual friction angle of r measured herein is higher than the residual friction angle of 4 and 5° reported by Fox et al. (1998). The difference may be caused by differences in test procedure, test conditions, and GeL specimens.
4.4 Effect of Final Water Content
Figure 8 shows a decrease in the final water content of the GCL specimen with increasing shearing normal stress applied to the specimen. The water content decreases from an average of approximately 145 to less than 70% for normal stresses ranging from 17 to 400 kPa, respectively. The final water content values were measured immediately after the internal residual shear strength was reached and shearing of the specimen was stopped. The material directly on the shear plane and some material below the shear plane was sampled with a thin spatula and used to measure the final water content. Material from underneath the shear plane was included in the water content sample because the thickness of the bentonite after shearing was small. The water contents reported are, therefore, not those at the failure surface but represent an average water content for the GeL. Because the shear plane was located directly below the woven geotextile, removal of the top platen, which was still attached to the woven geotextile, provided easy access to the shear plane material (Figure 3). It is thought that the decrease in final water content with increasing shearing normal stress was caused by the increased consolidation and, therefore, decreased water content that occurred at higher shearing normal stresses. Comparing Figures 7 and 8, it is anticipated that the high water content values at low normal stresses affected the measured value of peak and residual internal shear strength of needle-punched GeL and contributed to the nonlinearity in the failure envelopes. This is caused by the high water content reducing the bentonite shear strength and/or facilitating pulling out of the reinforcing fibers from the woven geotextile.
Fox et al. (1998) showed that reinforcement type does not affect the measured residual shear strength of needle-punched or stitch-bonded GCLs. As a result, the relationship shown in Figure 8 can be useful in estimating the true residual shear strength as a function of normal stress or water content for design purposes. In addition, Figure 8 can be used to estimate the hydrated water content as a function of normal stress. This may be beneficial in determining if complete hydration occurred in the laboratory testing procedure or forensic investigations. The peak shear strength data was not included in Figure 8 because water content samples could not be taken at the peak strength condition during the test, different peak strengths are mobilized for each type of GeL reinforcement, and the amount of needle punching varied. Figure 8 should be used in field
GEOSYNTHETICS INTERNATIONAL • 1999, VOL. 6, NO.3 232

------
70
EID, STARK AND DOERFLER • Internal Shear Strength of a Reinforced Gel
160 80
150 Each point is an average of seven tests 140
60130
iF 120 - 50 g?...... coc DlQ) 110 ....... enc ....o -40 co() 100 ::J co-::::l'"
90 '5? 30 ~
80 -2070
60 10
50 Hydration normal stress = 17 kPa
o40 o 100 200 300 400 500
Shearing normal stress (kPa)
Figure 8. Water contents after shearing and measured residual internal shear strength of needle-punched GeL specimens for displacement rates of 0.015 to 36.5 mm/minute.
situations where the stress history is similar to the laboratory testing of the current study because the final GeL water content is dependent on stress history,
4.5 Effect of Shear Displacement Rate on Peak Internal Shear Strength
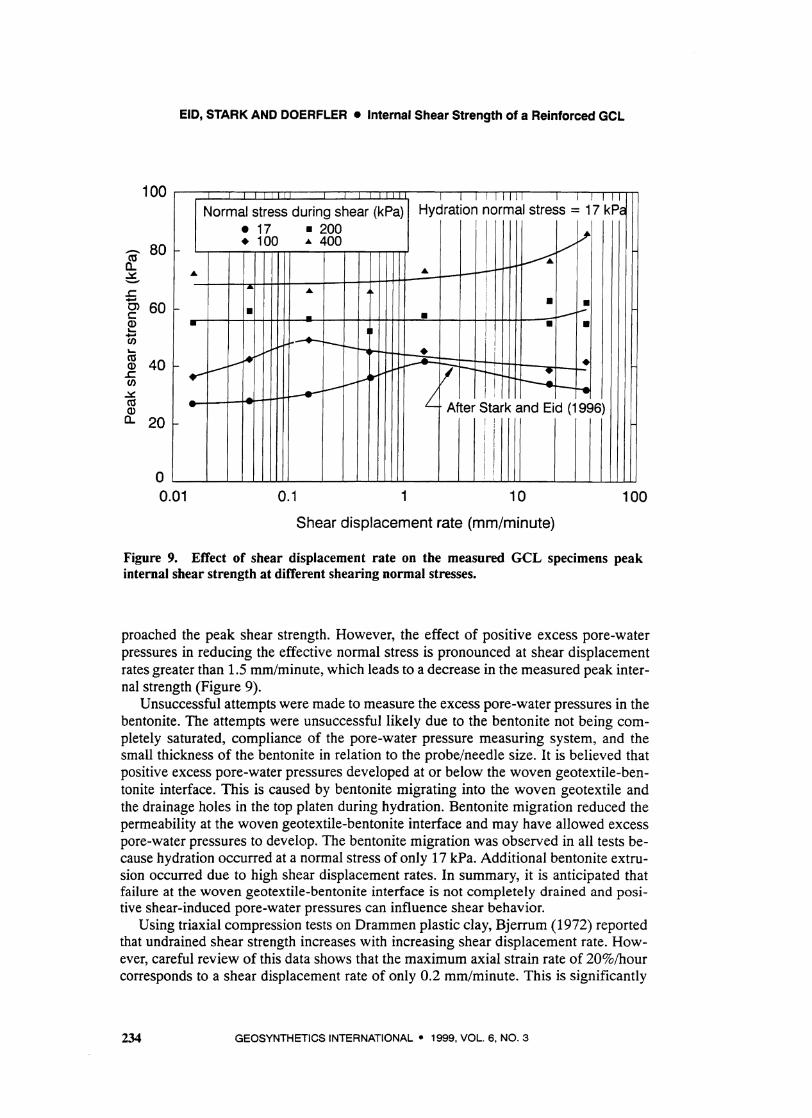
Figure 9 presents the peak internal shear strength of GeL specimens tested at shear displacement rates ranging from 0.015 to 36.5 mm/minute and shearing normal stresses ranging from 17 to 400 kPa. Stark and Eid (1996) discussed the GeL behavior at a shearing normal stress of 17 kPa. They concluded that for shear displacement rates less than 0.04 mm/minute, the internal peak shear strength is approximately constant. For shear rates greater than 0.04 mm/minute, the measured peak internal shear strength increases due to the rapid tearing or pulling-out of the reinforcement fibers. The rapid tearing of the reinforcement fibers was noticed by a tearing noise as the GeL ap-
GEOSYNTHETICS INTERNATIONAL • 1999, VOL. 6, NO.3 233
EID, STARK AND DOERFLER • Internal Shear Strength of a Reinforced Gel
100 I I I I I I III I I I I I I
Normal stress during shear (kP a) Hydration normal stress = 17 kP~ • 17 • 200 • 100 A 400 ~
80 V- ~ ~ AA.::t:. 1-1 I
.s= i ..... I -c: 0> 60
1-
• A
• I , •--:.-•
Q).... • • •..... !en ,.... .........----..
cu • Q) 40 r- I--
~.. I • .s= • en ...- ..- ,......A .... 7r--r-~ r---.... .::t:. II ... cu L Q) - ---v
After Stark and Eid (1996) a.. I20
Io I 0.01 0.1 1 10 100
Shear displacement rate (mm/minute)
Figure 9. Effect of shear displacement rate on the measured GeL specimens peak internal shear strength at different shearing normal stresses.
proached the peak shear strength. However, the effect of positive excess pore-water pressures in reducing the effective normal stress is pronounced at shear displacement rates greater than 1.5 mm/minute, which leads to a decrease in the measured peak internal strength (Figure 9).
Unsuccessful attempts were made to measure the excess pore-water pressures in the bentonite. The attempts were unsuccessful likely due to the bentonite not being completely saturated, compliance of the pore-water pressure measuring system, and the small thickness of the bentonite in relation to the probe/needle size. It is believed that positive excess pore-water pressures developed at or below the woven geotextile-bentonite interface. This is caused by bentonite migrating into the woven geotextile and the drainage holes in the top platen during hydration. Bentonite migration reduced the permeability at the woven geotextile-bentonite interface and may have allowed excess pore-water pressures to develop. The bentonite migration was observed in all tests because hydration occurred at a normal stress of only 17 kPa. Additional bentonite extrusion occurred due to high shear displacement rates. In summary, it is anticipated that failure at the woven geotextile-bentonite interface is not completely drained and positive shear-induced pore-water pressures can influence shear behavior.
Using triaxial compression tests on Drammen plastic clay, Bjerrum (1972) reported that undrained shear strength increases with increasing shear displacement rate. However, careful review of this data shows that the maximum axial strain rate of 20%/hour corresponds to a shear displacement rate of only 0.2 mm/minute. This is significantly
234 GEOSYNTHETICS INTERNATIONAL • 1999. VOL. 6, NO.3

EID, STARK AND DOERFLER • Internal Shear Strength of a Reinforced Gel
lower than the displacement rates shown in Figure 9 and it is possible that the undrained shear strength of Drammen clay would decrease at higher shear displacement rates. In addition, the water content of the GCL bentonite at low shearing normal stresses was much higher than the water content of the Drammen clay. The average water content of the GeL sheared under a shearing normal stress of 17 kPa was 144% at the end of shearing, while the water content of the Drammen clay ranged between 50 and 60% (Terzaghi et al. 1996). This increase in water content may cause a relative increase in positive excess pore-water pressure and negate any effect of increasing shear rate on the undrained shear strength that was reported by Bjerrum (1972).
Figure 9 also shows that behavior at a shearing normal stress of 17 kPa differs from that at higher normal stresses. For a shearing normal stress of 100 kPa, it appears that the effect of positive excess pore-water pressure becomes greater than the effect of the rapid tearing or pulling-out of reinforcement at a shear displacement rate of approximately 0.15 mm/minute. This is probably caused by the increase in positive, shear-induced pore-water pressure with increasing normal stress. The increase in positive excess pore-water pressure with increasing normal stress was confirmed for normally consolidated clays by Mesri and Ali (1998) using triaxial compression tests on Boston blue clay specimens. This can be used to explain GCL behavior because both the GeL and Boston blue clay have soil on both sides of the failure plane. This occurred in the GeL because of bentonite migration.
Figure 9 also shows that the apex point that is present in the peak shear strength-shear displacement rate relationship for shearing at normal stresses of 17 and 100 kPa does not exist for shearing at normal stresses of 200 and 400 kPa. If the relationships were similar, regardless of shearing normal stress, the apex point for the shearing normal stresses of 200 and 400 kPa would occur between shear displacement rates of 0.015 and 0.1 mm/minute. Figure 9 shows that this is not the case. It is anticipated that a third mechanism, in addition to the rapid tearing and/or pulling-out of fibers and the excess pore-water pressures, starts to significantly affect the shear behavior at normal stresses of 200 and 400 kPa. This mechanism is the undrained frictional resistance of bentonite at a relatively low water content. A significant drop in water content of the bentonite occurs due to consolidation under high normal stresses. As a result, the bentonite starts to mobilize a greater undrained frictional resistance with increasing shear rate (Eid and Stark 1997). The undrained frictional resistance corresponds to the friction generated by clay particles sliding against each other at rapid displacement rates (Lemos et al. 1985). In addition, the decrease in water content causes a relative decrease in positive excess pore-water pressure in the bentonite. The effect of rapid tearing and/or pullingout of the fibers and the undrained shear strength and frictional resistance of bentonite in increasing the peak strength seem to counteract the effect of positive, shear-induced pore-water pressures in decreasing the peak strength. This continues until the effect of the increasing undrained shear strength of bentonite and rapid tearing of fibers dominates the behavior at a shear rate of approximately 15 and 1.0 mm/minute for normal stresses of 200 and 400 kPa, respectively (Figure 9).
In summary, it is suspected that the peak internal shear strength of this needlepunched GeL is dependent on shear displacement rate and normal stress. Three mechanisms appear to result in this complex shear behavior: (i) shear resistance provided by the reinforcing fibers increases as shearing rate increases because rapid shear rates tear the fibers as opposed to allowing a slow pullout of the fibers from the woven geotextile;
GEOSYNTHETICS INTERNATIONAL • 1999, VOL. 6, NO.3 235

EID, STARK AND DOERFLER • Internal Shear Strength of a Reinforced Gel
(ii) effective normal stress decreases as the shear rate increases due to the development of positive excess pore-water pressures; and (iii) undrained frictional resistance of bentonite increases with increasing shear displacement rate especially for shearing at high normal stresses and the corresponding lower water content of bentonite. The net result of these mechanisms makes the measured GCL peak internal shear strength at normal stresses ranging between 200 and 400 kPa less sensitive to shear displacement rate.
4.6 Effect of Shear Displacement Rate on Residual Internal Shear Strength
Figure 10 shows the effect of shear displacement rate and shearing normal stress on the internal residual shear strength of the reinforced GeL. For all of the shearing normal stresses, the residual shear strength appears to be independent of shear displacement rate. This is attributed to the reinforcing fibers being already torn or pulled out and, along with the hydrated bentonite particles, oriented parallel to the direction of shear. This condition appears to be unaffected by the shear rate or the normal stress level.
The results in Figures 9 and 10 can be used to suggest that laboratory shear tests be conducted at a slow shear displacement rate (i.e. less than 0.04 mm/minute) until the peak shear strength is achieved and the post-peak decrease in strength has initiated. This is usually completed after approximately 50 mm of shear displacement. At this point, the shear displacement rate could be increased until the residual or end of test shear strength is measured. This may accelerate commercial testing of GCLs and, thus, decrease testing costs. The resulting shear stress-displacement relationship may need to be smoothed for presentation purposes but the peak and residual internal shear strength values should be useful for plotting the peak and residual failure envelopes.
70 Normal stress during shear (kPa) Hydration normal stress = 17 kPa
60 • 17 • 200• 100 ... 400
50 ... ... .a.40 .a.
.a. .a.
30 • • • 20 • • • •• .... •
After Stark and Eid (1996) 10 • • 111111... I
~
I IIIII1 ..1o 0.01 0.1 1 10 100
Shear rate (mm/minute)
Figure 10. Effect of shear displacement rate on the measured GeL specimen internal residual shear strength at different shearing normal stresses.
GEOSYNTHETICS INTERNATIONAL • 1999, VOL. 6, NO.3 236

5
EIO, STARK AND DOERFLER • Internal Shear Strength of a Reinforced GeL
CONCLUSIONS
The purpose of the current study was to illustrate the effect of shear displacement rate on the internal shear behavior of a hydrated needle-punched GeL sheared at different normal stresses. Using a torsional ring shear apparatus, different specimens of the reinforced GeL were hydrated at a normal stress of 17 kPa and then consolidated and sheared internally at normal stresses of 17, 100,200, and 400 kPa with shear displacement rates ranging from 0.015 to 36.5 mm/minute. The following conclusions are based on the data and interpretations presented in this paper:
1. Peak internal shear strength is dependent on shear displacement rate and normal stress applied to the needle-punched GeL. It is hypothesized that three mechanisms cause this complex shear behavior: (i) shear resistance provided by the reinforcing fibers increases as the shearing rate increases because rapid shear rates tear the fibers as opposed to allowing a slow pullout of the fibers from the woven geotextile; (ii) effective normal stress decreases as shear rate increases due to the development of positive excess pore-water pressures; and (iii) undrained frictional resistance of bentonite increases with increasing shear rate especially for shearing at high normal stresses. The net effect of these mechanisms is that the measured GeL peak internal shear strength at normal stresses ranging between 200 and 400 kPa is less sensitive to shear displacement rate than internal shear strength at normal stresses less than 200 kPa. It is suspected that bentonite migration through the woven geotextile during hydration and shearing allows positive shear-induced pore-water pressures to develop in the failure zone.
2. The shear failure plane was located between the woven geotextile and the underlying bentonite filling. The internal failure was caused by tearing and/or pulling-out of the reinforcing fibers from the woven geotextile, thereby separating the woven geotextile from the remainder of the GeL. This finding is in agreement with the failure plane location reported by Gilbert et al. (1996) and Fox et al. (1998).
3. Shear displacement rate has little influence on the residual internal shear strength of this needle-punched GeL regardless of the shearing normal stress level. This is attributed to the reinforcing fibers being already tom and/or pulled-out and oriented along with the hydrated bentonite particles parallel to the direction of shear.
4. The amount of shear displacement required to achieve the internal peak and residual shear strength depends on the shearing normal stress and shear displacement rate. The shear displacement required to reach the peak internal shear strength increases with increasing shearing normal stress and is relatively constant with increasing shear displacement rate. The shear displacement required to reach the residual shear strength decreases with an increase in the shearing normal stress and increases with an increase in shear displacement rate.
S. The peak and residual internal shear strengths for the needle-punched GeL are stress dependent. This is due to the ability of high normal stresses to enhance orientation of the bentonite particles (Stark and Eid 1994, 1997) and the reinforcing fibers parallel to the direction of shear. Shear testing should be conducted on GeLs that exhibit a peel strength representative of field conditions, e.g. 65 N/IOO mm, otherwise the
GEOSYNTHETICS INTERNATIONAL. 1999. VOL. 6. NO.3 237

EID, STARK AND DOERFLER • Internal Shear Strength of a Reinforced Gel
testing will yield nonrepresentative values of peak internal shear strength and shear displacement required to reach a peak shear strength.
6. The final water content of the hydrated GeL decreases with increasing shearing normal stress. The final water content data presented herein may be used to indicate the shear displacement required to reach a residual strength condition and the value of residual internal shear strength for design purposes provided that the field stress history is similar to that experienced by the test specimen. It may also be used to estimate the hydrated water content as a function of normal stress.
ACKNOWLEDGMENTS
The authors acknowledge the excellent comments submitted by the reviewers. The second author acknowledges the financial support provided by the William J. and Elaine E Hall Scholar and University Scholar Awards. This support is gratefully acknowledged. The contents and views in this paper are the authors' and do not necessarily reflect those of any of the contributors.
REFERENCES
ASTM, D 4546, "Standard Test Method for One-Dimensional Swell or Settlement Potential ofCohesive Soif', American Society for Testing and Materials, West Conshohocken, Pennsylvania, USA.
ASTM, D 4632, "Standard Test Method for Grab Breaking Load and Elongation of Geotextiles", American Society for Testing and Materials, West Conshohocken, Pennsylvania, USA.
ASTM D 5321, "Standard Test Methodfor Determining the Coefficient ofSoil and Geosynthetic or Geosynthetic and Geosynthetic Friction by the Direct Shear Method", American Society for Testing and Materials, West Conshohocken, Pennsylvania, USA.
Berard, J.E, 1997, "Evaluation of Needle Punched Geosynthetic Clay Liners Internal Friction", Proceedings of Geosynthetics '97, IFAI, Vol. 1, Long Beach, California, USA, March 1997, pp. 351-362.
Bjerrum, L., 1972, "Embankments on Soft Ground", Proceedings ofthe Specialty Conference on Performance ofEarth and Earth-Supported Structures, ASCE, Vol. 2, Purdue University, Lafayette, Indiana, June 1972, pp. 1-54.
Colloid Environmental Technologies Company, 1998, "Bentomat ST Certified Properties", November, 2 p.
Eid, H.T. and Stark, T.D., 1997, "Shear Behavior of an Unreinforced Geosynthetic Clay Liner", Geosynthetics International, Vol. 4, No.6, pp. 645-659.
Fox, PJ., Rowland, M.G. and Scheithe, J.R., 1998, "Internal Shear Strength of Three Geosynthetic Clay Liners", Journal of Geotechnical and Geoenvironmental Engineering, Vol. 124, No. 10, pp. 933-944.
GEOSYNTHETICS INTERNATIONAL • 1999, VOL. 6, NO.3 238

EID, STARK AND DOERFLER • Internal Shear Strength of a Reinforced Gel
Gilbert, R.B., Fernandez, F. and Horsfield, D.W., 1996, "Shear Strength of a Reinforced Geosynthetic Clay Liner", Journal of Geotechnical and Geoenvironmental Engineering, Vol. 122, No.4, pp. 259-266.
Gleason, M.H., Daniel, D.E. and Eykholt, G.R., 1997, "Calcium and Sodium Bentonite for Hydraulic Containment Applications",lournal ofGeotechnical and Geoenvironmental Engineering, Vol. 123, No.5, pp. 438-445.
La Gatta, D.P., 1970, "Residual Strength of Clays and Clay-Shales by Rotation Shear Tests," Ph.D. thesis reprinted as Harvard Soil Mechanics Series, No. 86, Harvard University, Cambridge, Massachusetts, USA, 204 p.
Lemos, L.J., Skempton, A W. and Vaughan, P.R., 1985, "Earthquake Loading of Shear Surfaces in Slopes", Proceedings of the Eleventh International Conference on Soil Mechanics and Foundation Engineering, Balkema, Vol. 4, San Francisco, California, USA, August 1985, pp. 1955-1958.
Mesri, G. and Ali, S., 1998, "Undrained Shear Strength of a Glacial Clay Overconsolidated by Desiccation", accepted for publication in Geotechnique.
Mesri, G. and Cepeda-Diaz, AF., 1986, "Residual Shear Strength of Clays and Shales", Geotechnique, Vol. 36, No.2, pp. 269-274.
Mitchell, J .K., Bray, J.D. and Mitchell, R.A, 1995, "Material Interactions in Solid Waste Landfills", Proceedings ofGeoenvironmental 2000, ASCE Geotechnical Special Publication No. 46, Vol. 1, No.2, New Orleans, Louisiana, USA, February 1995, pp. 568-590.
Stark, T.D., Arellano, D., Evans, W.D., Wilson, V. and Gonda, J., 1998, "Unreinforced Geosynthetic Clay Liner Case History", Geosynthetics International, Vol. 5, No.5, pp.I-24.
Stark, T.D. and Eid, H.T., 1994, "Drained Residual Strength of Cohesive Soils", Journal ofGeotechnical Engineering, Vol. 120, No.5, pp. 856-871.
Stark, T.D. and Eid, H.T., 1996, "Shear Behavior of Reinforced Geosynthetic Clay Liners", Geosynthetics International, Vol. 3, No.6, pp. 771-786.
Stark, T.D. and Eid, H.T., 1997, "Slope Stability Analyses in Stiff Fissured Clays", Journal of Geotechnical and Geoenvironmental Engineering, Vol. 123, No.4, pp. 335-343.
Terzaghi, K., Peck, R.B. and Mesri, G., 1996, "Soil Mechanics in Engineering Practice", John Wiley and Sons, Inc., New York, New York, USA, 549 p.
GEOSYNTHETICS INTERNATIONAL • 1999, VOL. 6, NO.3 239