technical note estimating covid impact on poverty in
TRANSCRIPT
TECHNICAL NOTE
Estimating the Short-term Impact of the COVID-19 Pandemic on Poverty in Asia-Pacific LDCs by Yusuke Tateno and Zakaria Zoundi March 2021

2 Estimating the Short-term Impact of the COVID-19 Pandemic on Poverty in Asia-Pacific LDCs
Disclaimer: The designations employed and the presentation of the material in this policy brief do not imply the expression of any opinion whatsoever on the part of the Secretariat of the United Nations concerning the legal status of any country, territory, city or area, or of its authorities, or concerning the delimitation of its frontiers or boundaries. Where the designation “country or area” appears, it covers countries, territories, cities or areas. Bibliographical and other references have, wherever possible, been verified. The United Nations bears no responsibility for the availability or functioning of URLs. The opinions, figures and estimates set forth in this publication should not necessarily be considered as reflecting the views or carrying the endorsement of the United Nations. The mention of firm names and commercial products does not imply the endorsement of the United Nations.
This technical note was prepared as a background note for the Asia-Pacific Countries with Special Needs Development Report 2021: Strengthening the resilience of least developed countries in the wake of the coronavirus disease pandemic – Lessons for the next programme of action (Sales No. E.21.II.F.7). It benefited from comments by Arman Bidarbakht Nia, Andrzej Bolesta, Oliver Paddison, Naylin Oo and Zheng Jian.
For further information on this technical note, please address your enquiries to: Chief, Section on Countries in Special Situations Office of the Executive Secretary
Economic and Social Commission for Asia and the Pacific (ESCAP) Email: [email protected]
Photo credit: iStock 1081477328

3 Estimating the Short-term Impact of the COVID-19 Pandemic on Poverty in Asia-Pacific LDCs
Table of Contents
I. Introduction ............................................................................................................................. 4
II. Methodological approaches to measuring poverty ................................................................. 5
Poverty-growth elasticity (PE) ............................................................................................ 5
Neutral Distribution Growth (NDG) ..................................................................................... 5
Quantile Growth Contribution (QGC) ................................................................................. 6
III. Poverty and the pandemic: a review of global estimates ...................................................... 7
IV. An estimate for LDCs ........................................................................................................... 9
V. Results ................................................................................................................................ 11
VI. Discussion and conclusion ................................................................................................. 13
References .............................................................................................................................. 14
4 Estimating the Short-term Impact of the COVID-19 Pandemic on Poverty in Asia-Pacific LDCs
I. Introduction
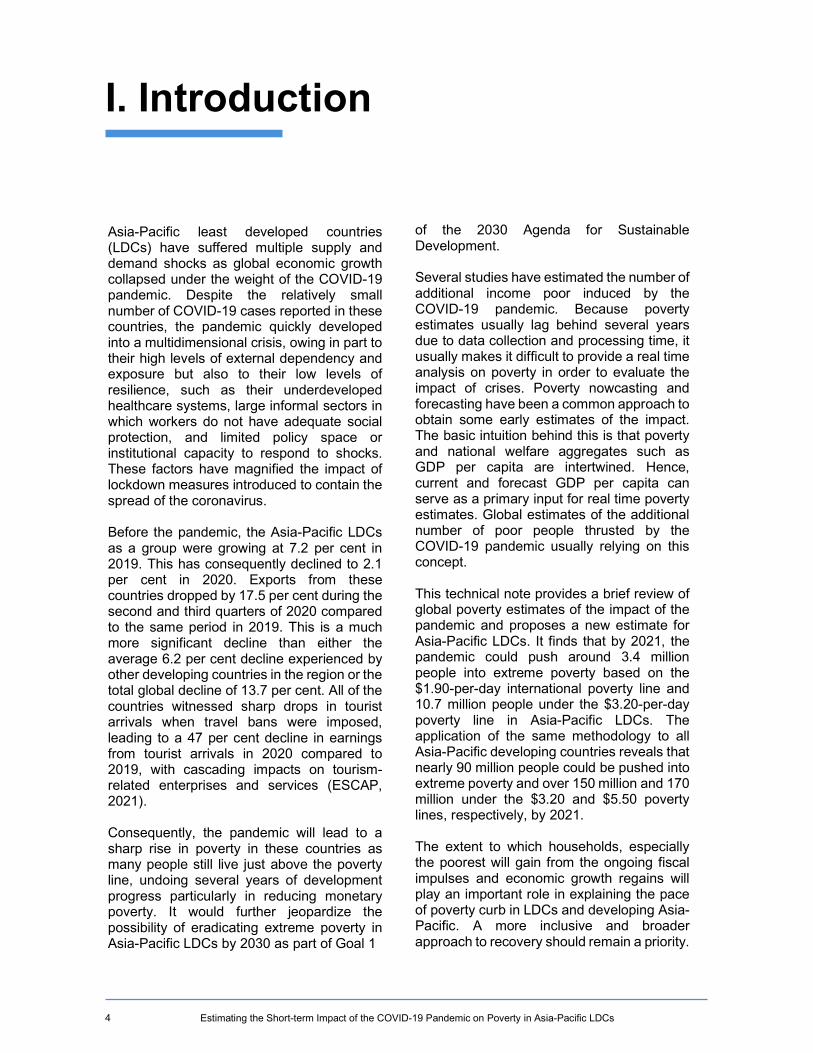
Asia-Pacific least developed countries (LDCs) have suffered multiple supply and demand shocks as global economic growth collapsed under the weight of the COVID-19 pandemic. Despite the relatively small number of COVID-19 cases reported in these countries, the pandemic quickly developed into a multidimensional crisis, owing in part to their high levels of external dependency and exposure but also to their low levels of resilience, such as their underdeveloped healthcare systems, large informal sectors in which workers do not have adequate social protection, and limited policy space or institutional capacity to respond to shocks. These factors have magnified the impact of lockdown measures introduced to contain the spread of the coronavirus. Before the pandemic, the Asia-Pacific LDCs as a group were growing at 7.2 per cent in 2019. This has consequently declined to 2.1 per cent in 2020. Exports from these countries dropped by 17.5 per cent during the second and third quarters of 2020 compared to the same period in 2019. This is a much more significant decline than either the average 6.2 per cent decline experienced by other developing countries in the region or the total global decline of 13.7 per cent. All of the countries witnessed sharp drops in tourist arrivals when travel bans were imposed, leading to a 47 per cent decline in earnings from tourist arrivals in 2020 compared to 2019, with cascading impacts on tourism-related enterprises and services (ESCAP, 2021). Consequently, the pandemic will lead to a sharp rise in poverty in these countries as many people still live just above the poverty line, undoing several years of development progress particularly in reducing monetary poverty. It would further jeopardize the possibility of eradicating extreme poverty in Asia-Pacific LDCs by 2030 as part of Goal 1
of the 2030 Agenda for Sustainable Development. Several studies have estimated the number of additional income poor induced by the COVID-19 pandemic. Because poverty estimates usually lag behind several years due to data collection and processing time, it usually makes it difficult to provide a real time analysis on poverty in order to evaluate the impact of crises. Poverty nowcasting and forecasting have been a common approach to obtain some early estimates of the impact. The basic intuition behind this is that poverty and national welfare aggregates such as GDP per capita are intertwined. Hence, current and forecast GDP per capita can serve as a primary input for real time poverty estimates. Global estimates of the additional number of poor people thrusted by the COVID-19 pandemic usually relying on this concept. This technical note provides a brief review of global poverty estimates of the impact of the pandemic and proposes a new estimate for Asia-Pacific LDCs. It finds that by 2021, the pandemic could push around 3.4 million people into extreme poverty based on the $1.90-per-day international poverty line and 10.7 million people under the $3.20-per-day poverty line in Asia-Pacific LDCs. The application of the same methodology to all Asia-Pacific developing countries reveals that nearly 90 million people could be pushed into extreme poverty and over 150 million and 170 million under the $3.20 and $5.50 poverty lines, respectively, by 2021. The extent to which households, especially the poorest will gain from the ongoing fiscal impulses and economic growth regains will play an important role in explaining the pace of poverty curb in LDCs and developing Asia-Pacific. A more inclusive and broader approach to recovery should remain a priority.

Estimating the Short-term Impact of the COVID-19 Pandemic on Poverty in Asia-Pacific LDCs 5
E st im at ing the Shor t- ter m Impact of the COVI D-19 Pandem ic on Pover ty in Asi a
1
II. Methodological approaches to measuring poverty
Three common methods are applied for real time poverty estimations (Caruso and others, 2017).
Poverty-growth elasticity (PE)
The PE method has often been used by the World Bank (2016) for forecasting poverty. Assuming a sequence in the nomenclature of periods (–2, –1, and 0)1, the basic concept about PE is to compute the elasticity of poverty to GDP per capita between periods -2 and -1 and use that elasticity to estimate poverty in current period 0. Let 𝑦 equal the total household per capita income in time t, and z the poverty line below which a household is considered poor. Poverty pov(𝑦 ) is a function of per capita income and is defined as the proportion of population with households’ income lower than z; 𝑔 is the GDP
per capita in time t; 𝑔[ ; ] is the real GDP per capita growth rate between t and t-1; and 𝜀[ ; ] is the GDP per capita growth elasticity of poverty between 𝑡 and 𝑡−1. Poverty in current moment 0 is estimated as follows:
𝑝𝑜𝑣(𝑦 ) = 𝑝𝑜𝑣(𝑦 ) ∗ 1 + 𝜀[ ; ] ∗ 𝑔[ ; ] (1)
𝜀[ ; ] is unknown because it uses the poverty information in current time 0. To obtain an approximation of 𝜀[ ; ], poverty elasticity is assumed unique and nonstochastic overtime for any poverty measures. This means that the elasticity between -1 and -2 can be used as an approximation for 𝜀[ ; ]. Equation (1) becomes:
𝑝𝑜𝑣(𝑦 ) = 𝑝𝑜𝑣(𝑦 ) ∗ 1 + 𝜀[ ; ] ∗ 𝑔[ ; ] (2)
1 As poverty data usually come with large gaps; the nomenclature of period here does not necessarily imply
Neutral Distribution Growth (NDG)
In the NDG approach, all households’ incomes are assumed to be identically affected by GDP per capita growth. However, as GDP per capita is derived from GDP, which encompasses more macroeconomic information unlike households’ income, there should be an adjustment factor — denoted as passthrough — between the two. If 𝜃 is the passthrough of GDP per capita to survey household income, the poverty estimates in current period 0 according to the NDG method is derived from:
𝑦 = 𝑦 1 + 𝜃 ∗ 𝑔[ ; ]
(3)
Where 𝑦 is household i’s income in current time
0 and 𝑝𝑜𝑣 𝑦 is the corresponding poverty rate.
One of the differences between PE and NDG is that the latter uses household level microdata —reflected in the subscript i — while the former uses aggregated GDP per capita and poverty indicators. The accuracy of poverty estimate using the NDG approach depends on the quality of GDP per capita estimate, the level of similarity of income growth across household (the more similar the more accurate is the poverty estimate), and the level of knowledge we have about the passthrough. A passthrough of 0.87 has been used by the World Bank (2015) in its global poverty estimate.
that -2, -1 and 0 are adjacent or subsequent. They are considered in a chronological order.
The accuracy of PE depends on that of GDP per capita and how similar are 𝜀[ ; ] and 𝜀[ ; ].

Estimating the Short-term Impact of the COVID-19 Pandemic on Poverty in Asia-Pacific LDCs
6 E st im at ing the Shor t- ter m Impact of the COVI D-19 Pandem ic on Pover ty in Asi a
1
Quantile Growth Contribution (QGC)
1 Footnote
The QGC assumes a heterogeneity of growth rate along household’s income distributions, unlike NDG. In the estimation procedure, households’ income is sorted and grouped into quantiles q. The method follows two steps. The first step is to estimate the total income of quantile q in current period 0. Given that households’ income is sorted and grouped into quantiles q, the total growth of the economy between periods t and t-1 obtained by summing the growth of all quantiles q.
ΔY[ ; ] = ∑ 𝑟[ ; ]
∗ 𝑌 (4)
Where 𝑌 is the total income of the economy; 𝑌
is total income of quantile q in time t; and 𝑟[ ; ] is the quantile q’s total income growth rate between t and t-1. Since the contribution of each quantile to total growth for the current period is unknown, it is assumed to be identical to the preceding period. In denoting 𝑆 as the contribution of quantile q
to total income growth, this means that 𝑆[ ; ]=
𝑆[ ; ]
The total income of quantile q in current period 0, 𝑌 can be specified as follows:
𝑌 = 𝑆[ ; ]
∗ ΔY[ ; ] + 𝑌 (5)
The second step is the estimation of the distribution of 𝑌 across households i belonging to quantile q. One way of achieving this is to assume that the amount of income received by every household is a function of their share in the total income within their quantile in period -1.
𝑦 = ∗ 𝑌 (6)
Replacing 𝑌 by its expression in (5)
𝑦 = 𝑆[ ; ]
∗ ΔY[ ; ] + 𝑌 (7)
If the growth rate 𝑟[ ; ] is the same for all
quantiles, ΔY[ ; ] in equation (7) can be simplified under the NDG hypothesis to 𝜃 ∗
𝑔[ ; ]
∗ 𝑌 ; in other words
𝑦 = 𝑆[ ; ]
∗ 𝜃 ∗ 𝑔[ ; ]
∗ 𝑌 + 𝑌
(8) Note that both NDG and QGC are similar methodologies, but under different assumptions: homogeneity versus heterogeneity of income growth across households, respectively.

Estimating the Short-term Impact of the COVID-19 Pandemic on Poverty in Asia-Pacific LDCs 7
E st im at ing the Shor t- ter m Impact of the COVI D-19 Pandem ic on Pover ty in Asi a
1
III. Poverty and the pandemic: a review of global estimates
The analysis of the impact of the pandemic on poverty has mostly been based on the concept of GDP passthrough to income as in the Neutral Distribution Growth (NDG) and Aguilar, Mahler, and Newhouse (2019). There have also been other variants and extensions
to improve the accuracy of estimates such as computational General Equilibrium Model (Laborde, Martin, and Vos, 2020) or Machine learning algorithms (Lakhner and others, 2020). Some of the global estimates are summarized in table 1.
Author(s) Sample Methodology Example of key findings
Sumner, Hoy Ortiz-Juarez (2020)
164 countries Neutral Distribution Growth (NDG) and a scenarios analysis: low, medium, and high global contractions of per capita income (5, 10, and 20 per cent respectively.). Estimation using PovcalNet.
5 per cent contraction in per capita incomes $1.90/day: 80 million more poor people $3.20/day: 130 million more poor $5.50/day: 124 million more poor 10 per cent contraction in per capita incomes $1.90/day :180 million more poor $3.20/day: 280 million more poor $5.5/day: 250 million more poor 20 per cent contraction in per capita incomes $1.90/day: 420 million more poor $3.20/day: 580 million more poor $5.50/day: 520 million more poor South Asia, $1.90/day line 5 per cent hit: 53 per cent more poor 10 per cent hit: 53 per cent more poor 20 per cent hit: 55 per cent more poor
Valensisi (2020) 164 countries Neutral Distribution Growth (NDG) Less than $1.90: 68 million more poor in 2020 alone, globally. East Asia and the Pacific $1.90/day: 4 per cent more poor $3.20/day: 19 per cent more poor $5.50: 42 per cent more poor
Laborde, Martin, Vos (2020)
140 regions/ countries 285,000 sample households. Sample includes 65 per cent of the world’s extreme poor.
MIRAGRODEP CEG model, POVANA household dataset and model. Scenario based.
World: 20 per cent or 148 million additional poor people, at $1.90 South Asia: 15 per cent or 42 million additional poor people at $1.90
Lakner and others (2020)
166 countries Estimation of the impact of Covid-19using household survey data and growth projections. Machine learning algorithms Modeling the impact of changes in the Gini index on poverty. Projection until 2030
The pandemic-induced global new poor is estimated to be between 119 million and 124 million in 2020. In 2021, the number of additional poor is set to rise to between 143 million and 163 million (preliminary update as of January 2021).
UNCTAD (2020)
47 least developed countries
Valensisi (2020) approach (see above) Global least developed countries: Additional 32 million people will be driven into absolute poverty in least developed countries
Table 1. Global estimates

Estimating the Short-term Impact of the COVID-19 Pandemic on Poverty in Asia-Pacific LDCs 8
E st im at ing the Shor t- ter m Impact of the COVI D-19 Pandem ic on Pover ty in Asi a
1
ADB (2020) 34 ADB developing countries
A combination of the Global Trade Analysis Project (GTAP) simulation and a scenario analysis.
Extreme poverty line ($1.90/day) - 5 per cent reduction in annual per capita
consumption expenditure: an additional 34 million poor
- 10 per cent: additional 78 million - 20 per cent: additional 185 million
For the GTAP long containment scenario, the number of poor will increase by about 56 million for the $1.90/day and 140 million for the $3.20/day.
Decerf and other (2020)
150 countries Lakner and others (2020)’ approach (see above). Different GDP data source, and usage of the World Bank's income class poverty thresholds rather than national poverty thresholds.
At least 68 million additional people thrust into poverty.
Pardee Center for International Futures and UNDP (2020)
186 countries Scenarios analysis using the International Futures tools developed by the Fredrick S. Pardee Center (University of Denver)
Baseline scenario - Additional 94 million poor in 2020. - Extreme poverty by 2030: 905 million
High damage scenario: - Additional 207 million people fall into poverty
in 2030 on top of those under the Baseline scenario
- Extreme poverty by 2030: more than 1 billion “Sustainable Development Goals push' scenario
- Targeted intervention would cut the number of people in extreme poverty by 146 million in 2030 relative to current COVID -19 trends and by 340 million by mid-century
United Nations (2021)
176 countries World Economic Forecasting Model of the United Nations
The total number of people living in poverty is expected to have increased by 131 million in 2020 alone
There is no doubt that poverty estimates have shed some light on policy interventions to decrease the impact of the pandemic. However, the large difference between estimates can raise some concerns as to how far one is getting from the “true” number of poor thrust into poverty. Some of the shortcomings of current estimates sometimes underscored by the authors and that could possibly give some answers include:
- A large number of assumptions - Consumption assumed to expand at the
same rate as GDP per capita - The transmission channel focuses only on
income. - The effects of economic contractions are
distribution neutral and do not consider important channels (example of inequality and employment) or regional context (such as least developed countries or emerging economies)
- The distribution of income across households is assumed to be homogeneous and unchanged
- No distinction is made between rural and urban poverty, yet the pandemic has proven to be more pronounced in urban settings.
- Policy interventions such as social protection and cash transfers adopted by most Governments are usually omitted
- An identical passthrough of GDP to households’ income of 0.87 can appear overestimated for regions with large informal sectors, high inequality (i.e., the wealthiest take the most advantage of GDP growth) or governance issues –– such as LDCs.
Although in practice considering all these factors can be challenging given the current data issues, efforts to incorporate them, to the extent possible can take us step ahead, towards less error margins of COVID-19- induced poverty estimates.

9 Estimating the Short-term Impact of the COVID-19 Pandemic on Poverty in Asia-Pacific LDCs
IV. An estimate for LDCs
Source: Authors’ estimation.
This note proposes a new estimate of poverty for Asia Pacific LDCs by revisiting some of the above shortcomings, bearing in mind that more improvements are required as data becomes available. Because estimating COVID-19-induced poverty requires an exploration of both breadth and depth of the data (the diversity of potential drivers and the heterogeneity of the sample, respectively), the proposed estimates are based on extended versions of QGC and NCG. The primary focus is QGC. As mentioned previously, QGC has the advantage of capturing the heterogeneity among households by assigning different growth rates along the income distribution. This concept of heterogeneity among households is important, particularly for LDCs, due to the high inequality in those countries; per capita GDP growth does not transmit to income at the same rate along income deciles. In Bangladesh, for example, poorest households benefit less from per capita growth compared to those belonging to the highest deciles (figure 1).
Figure 1 Estimated passthrough from per capita GDP growth to income growth by decile: Bangladesh
For countries for which income distribution data are available on PovcalNet (Bangladesh, Bhutan and Timor-Leste), an extension of QGC is used. For other countries (Kiribati, Lao PDR, Myanmar, Nepal, Solomon Islands, Tuvalu and Vanuatu), the estimation is based on an extension of NDG. An extrapolation is applied to obtain the estimate for the overall LDCs. The following modifications have been made:
- For the QGC approach, the rate of income
growth 𝑟[ ; ] is estimated at the decile
level to better capture the income growth dynamics of the poor, especially the first (lowest) decile. For all three countries for which the QCG approach was applied, the income growth of the first decile was lower than that of country average: the rate of income growth was 54 per cent, 94 per cent and 87 per cent of the country aggregates, respectively for Bangladesh, Bhutan and Timor-Leste. This approach covers 53 per cent of the aggregate population of the Asia-Pacific LDCs.
- For the NCG approach, the estimation of
households mean income follows equation (3). The estimation of poverty is then approximated as the cumulative distribution function of the lognormal distribution, evaluated at the appropriate poverty benchmarks ($1.90 and $3.20 a day) as in the ESCAP COVID-19 response model (ESCAP, 2020). Also, to allow for some distributional impact, inequality is treated as a function of employment and policy intervention, two important aspects of the pandemic. A 1 per cent increase in inequality and a 1.5 per cent increment in government fiscal interventions are assumed. The choice of 1.5 per cent is based on the fact that, while the actual policy interventions could have been higher than 1.5 per cent of GDP in most countries, the World Bank’s survey revealed that public social assistance has been poorly targeted in most countries (Sánchez-Páramo and Narayan, 2020), which means that many households received zero or a fraction of the stimulus.

10 Estimating the Short-term Impact of the COVID-19 Pandemic on Poverty in Asia-Pacific LDCs
- A passthrough of GDP to income was re-estimated for a restricted sample of Asia-Pacific LDCs, following the World Bank (2015) method. The estimated passthrough coefficient of 0.67 was much lower than the widely used coefficient of 0.87, but similar to the 0.65 used by Valensisi (2020) for the global LDCs. For the NDG approach, the coefficient of 0.67 is applied, while for the
QGC approach, the estimated rate of income growth for each decile is adjusted such that the passthrough of all deciles averages at 0.67.
- For both approaches, the GDP growth forecasts of IMF-WEO October 2020 are used.
11 Estimating the Short-term Impact of the COVID-19 Pandemic on Poverty in Asia-Pacific LDCs
V. Results
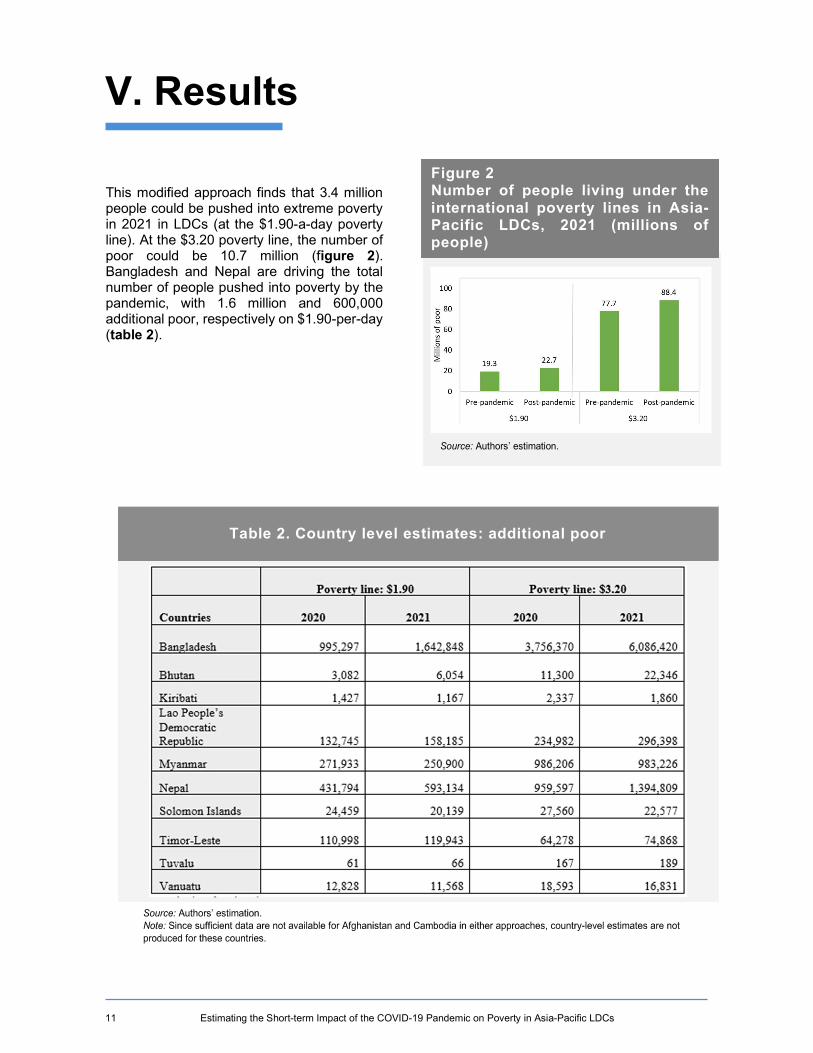
Table 2. Country level estimates: additional poor
Source: Authors’ estimation.
This modified approach finds that 3.4 million people could be pushed into extreme poverty in 2021 in LDCs (at the $1.90-a-day poverty line). At the $3.20 poverty line, the number of poor could be 10.7 million (figure 2). Bangladesh and Nepal are driving the total number of people pushed into poverty by the pandemic, with 1.6 million and 600,000 additional poor, respectively on $1.90-per-day (table 2).
Figure 2 Number of people living under the international poverty lines in Asia-Pacific LDCs, 2021 (millions of people)
12 Estimating the Short-term Impact of the COVID-19 Pandemic on Poverty in Asia-Pacific LDCs
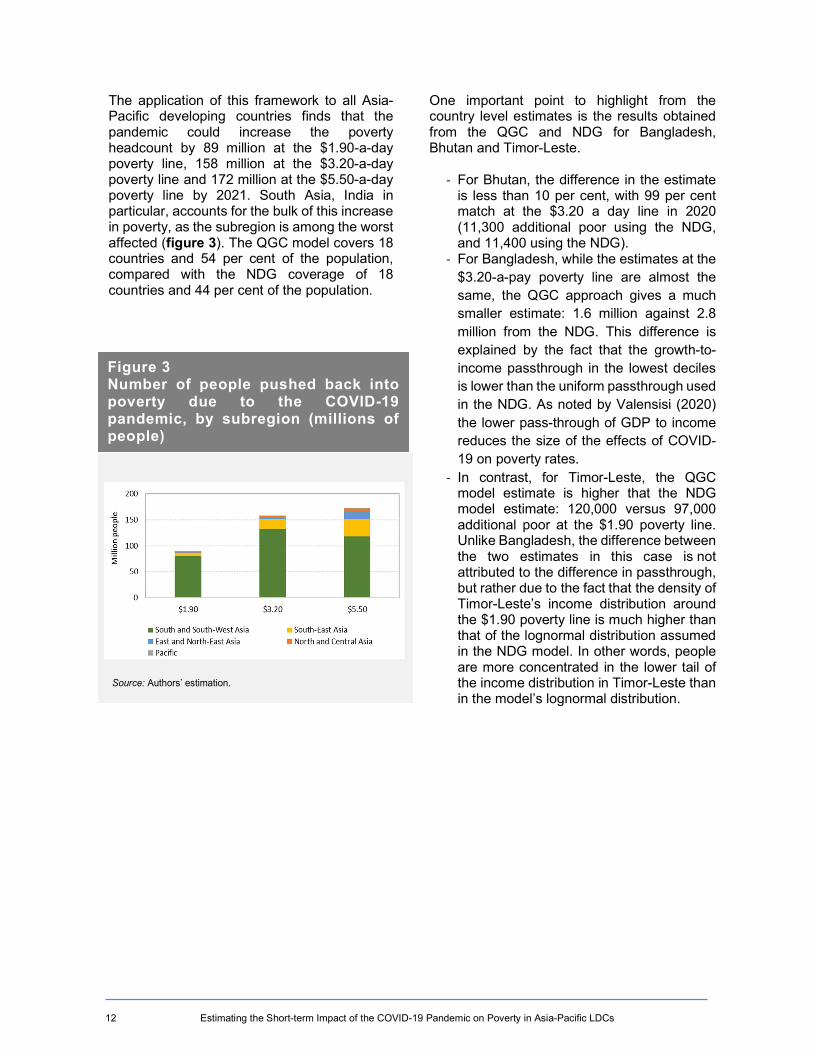
The application of this framework to all Asia-Pacific developing countries finds that the pandemic could increase the poverty headcount by 89 million at the $1.90-a-day poverty line, 158 million at the $3.20-a-day poverty line and 172 million at the $5.50-a-day poverty line by 2021. South Asia, India in particular, accounts for the bulk of this increase in poverty, as the subregion is among the worst affected (figure 3). The QGC model covers 18 countries and 54 per cent of the population, compared with the NDG coverage of 18 countries and 44 per cent of the population.
One important point to highlight from the country level estimates is the results obtained from the QGC and NDG for Bangladesh, Bhutan and Timor-Leste.
- For Bhutan, the difference in the estimate is less than 10 per cent, with 99 per cent match at the $3.20 a day line in 2020 (11,300 additional poor using the NDG, and 11,400 using the NDG).
- For Bangladesh, while the estimates at the $3.20-a-pay poverty line are almost the same, the QGC approach gives a much smaller estimate: 1.6 million against 2.8 million from the NDG. This difference is explained by the fact that the growth-to-income passthrough in the lowest deciles is lower than the uniform passthrough used in the NDG. As noted by Valensisi (2020) the lower pass-through of GDP to income reduces the size of the effects of COVID-19 on poverty rates.
- In contrast, for Timor-Leste, the QGC model estimate is higher that the NDG model estimate: 120,000 versus 97,000 additional poor at the $1.90 poverty line. Unlike Bangladesh, the difference between the two estimates in this case is not attributed to the difference in passthrough, but rather due to the fact that the density of Timor-Leste’s income distribution around the $1.90 poverty line is much higher than that of the lognormal distribution assumed in the NDG model. In other words, people are more concentrated in the lower tail of the income distribution in Timor-Leste than in the model’s lognormal distribution.
Figure 3 Number of people pushed back into poverty due to the COVID-19 pandemic, by subregion (millions of people)
Source: Authors’ estimation.

13 Estimating the Short-term Impact of the COVID-19 Pandemic on Poverty in Asia-Pacific LDCs
VI. Discussion and conclusion
The impact of the pandemic on poverty depends on a number of factors. Increasing inequality and further deceleration of economic growth can push more people into poverty. The pandemic is also challenging governments’ financial capacities –– which was already tight prior to the pandemic –– and as the number of infections rise and lockdown remain, support to the poor will become more difficult. The recent increase in the number of infections in Thailand, for instance, pushed many migrant workers to lose their job. The vast majority of these immigrants come from just three LDCs – Cambodia, Lao People's Democratic Republic and Myanmar. With no income and jobs, if the pandemic situation persists, it is more likely that these migrants will have to return home, which will lead to tighten the strains in their respective countries. Moreover, as the pandemic and lockdown are still prevalent in many parts of the world, it will take more time for labour market conditions to return to their pre-pandemic level. The impact of the pandemic on poverty may be more long-lasting in countries with high reliance on tourism such as Vanuatu. Resource-dependent countries such as Timor-Leste may face additional challenges to build back. On
the one hand, until a vaccine is well spread across the world and the lockdowns revoked and traffic back to normal, global demand for crude oil will remain low. Even if global trade normalizes, it is less likely that demand for crude oil will be revigorated, given the global shift to cleaner energies. This note finds that more than 1.6 million people will be pushed back into extreme poverty in Bangladesh by 2021. The number of additional poor will be higher if the pandemic lasts longer, since the country has a high population density, a large informal sector, and is facing difficulties applying the lockdown and social distancing measures. The recovery and poverty curb will need more than GDP growth. In LDCs for instance one-third of GDP growth is not transmitted to households. If the pandemic is to induce a rise in inequality, social policies would need to play a critical part in the overall recovery strategy in the region (see UNCTAD, 2020 for more details on recovery policies in global LDCs). Well-targeted policy interventions in favor of the poor and more employment opportunities will contribute to waning down the impacts of the crisis on poverty.

14 Estimating the Short-term Impact of the COVID-19 Pandemic on Poverty in Asia-Pacific LDCs
References Aguilar, R. Andres Castaneda, D.G. Mahler, and D. Newhouse (2019). Nowcasting global poverty. Paper presented at the
Special IARIW-World Bank Conference “New Approaches to Defining and Measuring Poverty in a Growing World”. Washington, D.C., 7-8 November. Available at https://unctad.org/system/files/official-document/ NowcastingGlobalPoverty.pdf
Asian Development Bank (ADB) (2020). An Updated Assessment of the Economic Impact of COVID-19. ADB Briefs, No. 133. Available at www.adb.org/sites/default/files/publication/604206/adb-brief-133-updated-economic-impact-covid-19.pdf.
Caruso, German and others (2017). But … what is the poverty rate today? Testing poverty nowcasting methods in Latin America and the Caribbean. Policy Research Working Paper, No. 8104. Washington, D.C.: World Bank. Available at http://documents.worldbank.org/curated/en/898691497881586394/pdf/WPS8104.pdf.
Decerf, Benoit, and others (2020). Lives and livelihoods estimates of the global mortality and poverty effects of the COVID-19 Pandemic. Policy Research Working Paper, No. 9277, Washington, D.C.: World Bank. Available at http://documents1.worldbank.org/curated/en/655511592232527722/pdf/Lives-and-Livelihoods-Estimates-of-the-Global-Mortality-and-Poverty-Effects-of-the-Covid-19-Pandemic.pdf.
Laborde, David, W.J. Martin, and R. Vos (2020). Estimating the Poverty Impact of COVID-19: The MIRAGRODEP and POVANA frameworks. International Food Policy Research Institute.
Lakner, Christoph, and others (2020). How much does reducing inequality matter for global poverty? Global Poverty Monitoring Technical Note, No. 13. Washington, D.C.: World Bank. Available at https://openknowledge.worldbank.org/bitstream/ handle/10986/33902/How-Much-Does-Reducing-Inequality-Matter-for-Global-Poverty.pdf?sequence=1&isAllowed=y.
Pardee Center for International Futures and United Nations Development Programme (UNDP) (2020). Impact of COVID-19 on the Sustainable Development Goals (SDGs) in a world reshaped by COVID-19. Available at https://sdgintegration.undp.org/sites/default/files/Impact_of_COVID-19_on_the_SDGs.pdf.
Sánchez-Páramo, Carolina, and A. Narayan (2020). Impact of COVID-19 on households: What do phone surveys tell us? Available at https://blogs.worldbank.org/voices/impact-covid-19-households-what-do-phone-surveys-tell-us.
Sumner, Andy, Chris Hoy, and Eduardo Ortiz-Juarez (2020). Estimates of the impact of COVID-19 on global poverty. WIDER Working Paper 2020/43. UNU-WIDER. Available at https://www.wider.unu.edu/publication/estimates-impact-covid-19-global-poverty.
United Nations, Department of Economic and Social Affairs (2021). World Economic Situation and Prospects 2021. Available at https://www.un.org/development/desa/dpad/wp-content/uploads/sites/45/WESP2021_FullReport.pdf.
United Nations Conference on Trade and Development (UNCTAD) (2020). The Least Developed Countries Report 2020 Productive Capacities for the New Decade. https://unctad.org/system/files/official-document/ldcr2020_en.pdf.
United Nations, Economic and Social Commission for Asia and the Pacific (ESCAP) (2020). Assessing the impact of COVID-19 in Asia and the Pacific and designing policy responses. Available at www.unescap.org/sites/default/files/Manual_ UNESCAP_Excel%20model%20to%20assess%20the%20impact%20of%20COVID-19%20and%20design%20policy%20 responses_.pdf.
Valensisi, Giovanni (2020). COVID-19 and global poverty: Are LDCs being left behind ? WIDER Working Paper, No. 2020/73. Tokyo: UNU-WIDER project on Academic Excellence. Available at www.wider.unu.edu/sites/default/files/ Publications/Working-paper/PDF/wp2020-73.pdf.
World Bank (2015). A Measured Approach to Ending Poverty and Boosting Shared Prosperity: Concepts, Data, and the Twin Goals. Washington, D.C. Available at https://openknowledge.worldbank.org/bitstream/handle/10986/ 20384/9781464803611.pdf.
__________ (2016). Global Monitoring Report 2015/2016: Development Goals in an Era of Demographic Change. Washington, D.C. Available at http://pubdocs.worldbank.org/en/503001444058224597/Global-Monitoring-Report-2015.pdf

Get connected. Follow us.
www.unescap.org
facebook.com/unescap
twitter.com/unescap
instagram.com/unitednationsescap
youtube.com/unescap
linkedin.com/company/united-nations-escap