technical memorandum - creeks of uc berkeley
TRANSCRIPT
Cardno ENTRIX 2300 Clayton Road Suite 200 Concord, CA 94520 USA Phone 925 935 9920 Toll-free 800 368 7511 Fax 925 935 5368 www.cardno.com www.cardnoentrix.com
Australia • Belgium • Canada • Ecuador • Indonesia • Kenya • New Zealand • Papua New Guinea Peru • United Arab Emirates • United Kingdom • United States • Operations in 70 countries
Technical Memorandum Date March 6, 2012
To: Mark Freiberg, Greg Haet UC Berkeley
From: Laura Riege, Ken Jenkins
RE: UC Berkeley Stanley Hall Diesel Spill - Natural Resource Damage Assessment December 2011 Water and Sediment Sampling Summary
1.0 Executive Summary On December 10, 2011an equipment failure on a diesel tank in the basement of Stanley Hall on the University of California, Berkeley campus resulted in spill of 1,650 gallons of diesel fuel. Clean-up crews recovered 799 gallons of diesel from the Stanley Hall basement. The spill released approximately 850 gallons of diesel to the environment through a culvert that discharges to the adjacent North Fork Strawberry Creek. Oil spill response teams recovered approximately 187 gallons of diesel from the creek and surrounding environment. Active clean-up efforts in Strawberry Creek were concluded successfully on January 13, 2012, with agency sign-off on the clean-up occurring on January 31, 2012.
As part of the Natural Resource Damage Assessment (NRDA), on December 22, 2011 Cardno ENTRIX conducted a one-day environmental survey to document water, sediment and soil hydrocarbon concentrations in the North Fork and the mainstem of Strawberry Creek on the UC Berkeley Campus and in Brickyard Cove where Strawberry Creek discharges into San Francisco Bay (Figures 1 & 2). The survey collected nine water samples, four creek-bed sediment samples, seven creek-bank and seven mudflat (soil/sediment) samples (Table 1). These included sediment and soil samples from a reference location 100-200 feet upstream of the culvert discharge (Source) location and a water sample from a reference location previously designated by the California Department of Fish and Game (CDFG).
Given the urban setting of the spill, measurable background levels may be present in Strawberry Creek and Brickyard Cove. Therefore, chemists inspected the laboratory results and FID-chromatograms from the analyses to determine the potential sources of any detected results. Volatile organic compounds (VOCs) were not detected in any water samples. Two water samples contained total petroleum hydrocarbons in the diesel range

2 March 6, 2012 UC Berkeley Stanley Hall Diesel Spill - Natural Resource Damage Assessment December 2011 Water and Sediment Sampling Summary
www.cardnoentrix.com
(TPH-DRO); one at the location adjacent to the Valley Life Sciences Building (VLSB; Figure 2) and one on campus immediately upstream of the Oxford Culvert (Figure 2). Review of the FID chromatograms indicated that the sample at the VLSB was not related to diesel hydrocarbons, whereas the sample at the Oxford Culvert appeared to have a possible weathered diesel contribution.
Only the soil sample, at the VLSB, contained a measurable concentration of VOCs. Diesel range and lubricating range TPHs were detected in all soil and sediment samples, although only the soil samples collected at the VLSB clearly exceeded background concentrations. This result is not surprising given the relatively lower gradient, higher sedimentation levels and high degree of overhanging grasses and vegetation at this location. Sediment/soil hydrocarbons in Brickyard Cove generally were consistent with urban background signals, with some locations showing a possible trace diesel contribution.
Strawberry Creek Park was not sampled during the December 22, 2011 survey, however, sheen and diesel odor continued to be observed into January 2012. As of January 23, 2012, following a significant storm event, no significant diesel odor or sheen were reported at any of the monitoring locations, including the UC Berkeley campus, Strawberry Creek Park, Allston Street, and at the Source area.
Recommendations include potential restoration projects for the UC Berkeley campus and in Strawberry Creek Park.
2.0 Methodology In order to characterize environmental conditions downstream of the spilled diesel fuel, Cardno ENTRIX collected soil, sediment and water samples from areas on the UC Berkeley Campus between the source area, near Stanley Hall, and the Oxford Culvert. Additional samples were collected around the creek discharge at Brickyard Cove in San Francisco Bay. In addition to collecting sediment, soil, and water samples, at each sampling location Cardno ENTRIX recorded GPS coordinates and took photographs and extensive field notes. The following sections provide details on the sampling methods used during the field work. The field team performed sample collection according to the UC Berkeley – Stanley Hall Diesel Spill; Natural Resources Damage Assessment Water and Sediment Sampling and Analysis Plan (Sampling Plan; Cardno ENTRIX 2011). The Sampling Plan outlined preliminary sample locations, Spill Response Standard Operating Procedures (SOPs), sampling and laboratory analysis methods and laboratory information. The Sampling Plan was shared with UC Berkeley, CDFG and the City of Berkeley and provided to the field staff prior to the sampling event.
2.1 Sample Locations Cardno ENTRIX collected samples from the locations described below. Sample locations are described first by sample name and then by geographic location. Figures 2 and 3 illustrate these locations in more detail.
1. Reference Samples- Upstream of the Source Area

3 March 6, 2012 UC Berkeley Stanley Hall Diesel Spill - Natural Resource Damage Assessment December 2011 Water and Sediment Sampling Summary
www.cardnoentrix.com
a. BK1-1 (New Reference location) - Reference sample location approximately 90 to100 feet upstream of the point where the concrete culvert source discharges into Strawberry Creek;
b. BK1-2- The location where the CDFG collected a reference sample immediately upstream of the spill site;
2. BK1-3 (outfall) - The source location (Source) at the culvert from Stanley Hall to Strawberry Creek;
3. BK1-4 - In the pool at the culvert entrance adjacent to the Valley Life Sciences Building (VLSB);
4. (BK1-5) - At the upstream end of the Oxford Culvert;
5. Brickyard Cove where Strawberry Creek discharges to San Francisco Bay.
a. BK1-9, BK1-12, BK1-13 - Behind the first boom;
b. BK1-14, BK1-15 - Midway between first and second booms; and
c. BK1-11, BK1-16, BK1-17 - Beyond the second boom. Previous CDFG reference sample was collected at BK1-17.
Table 1 summarizes in more detail, a description of the location, provides GPS coordinates, and a summary of observations.
2.2 Health and Safety Plan A site-specific Health and Safety Plan (HASP) was developed in accordance with the Occupational Safety and Health Administration (OSHA) guidelines set forth in Hazardous Waste Operations and Emergency Response (29 CFR 1910.120). All Cardno ENTRIX personnel reviewed and signed the HASP prior to performing work on the site. A copy of the HASP was present on-site at all times and kept in an easily accessed location. A tailgate safety meeting, which included the completion of a Job Safety Analysis (JSA), was performed in the morning before the start of work, when changing locations and when new personnel arrived at the site.
2.3 Sample Handling Procedures The field team implemented sample handling according to Spill Response SOPs provided to the field staff and reviewed prior to the sampling event.
In accordance with sample handing procedures outlined in SOPs, immediately following the collection of a sample, the sample container was capped and labeled to avoid confusing the sample with other previously collected samples. Using a waterproof marker, the label was completed to include the sampler's initials, location, and time that the sample was collected. All samples were placed in individual zip top bags, sealed, and stored in coolers on ice to maintain samples at 4oC prior to and during shipment to the analytical laboratory. A chain-of-custody manifest was completed on-site and accompanied the

4 March 6, 2012 UC Berkeley Stanley Hall Diesel Spill - Natural Resource Damage Assessment December 2011 Water and Sediment Sampling Summary
www.cardnoentrix.com
samples to Curtis and Tompkins Laboratories, a state-certified laboratory located in Berkeley, California. All samples were transferred to the laboratory at the end of the day on December 22, 2011.
2.4 Decontamination Decontamination procedures for field activities were outlined in the Spill Response SOPs and were also provided to the field staff and reviewed prior to the sampling event.
In compliance with the decontamination procedures outlined in the SOPs, tools used in soil sampling (slide hammer barrel shoe, head and barrel and trowel) were decontaminated between each sampling location. The tools were first cleaned with a non-phosphate detergent (Alconox) then rinsed with potable water and finally rinsed with laboratory supplied deionized water. Additionally the sampling tools were given a final rinse with laboratory supplied acetone and hexane to remove any residual petroleum hydrocarbons.
One “Equipment Blank” was collected as a Quality Assurance sample by pouring laboratory supplied deionized water over a cleaned slide hammer shoe, core barrel and head and collecting the effluent in laboratory supplied containers.
2.5 Sediment Sampling Sediment samples were collected from the middle of the creek channel using a 2-inch diameter slide hammer with a 12-inch long barrel, loaded with a lexan plastic sleeve. The core barrel was advanced to one (1) foot below the creek bed and then removed. Water was drained from the core barrel and the lexan sleeve was subsequently extracted and capped on both ends with Teflon sheets and plastic caps. The top and bottom of each sediment core was clearly labeled with a permanent marker. The slide hammer core barrel shoe and head were decontaminated between each sample location. The core barrel was decontaminated with a three stage wash between sample locations since it did not come in contact with sample materials. Two cores were collected at each sediment sampling location.
2.6 Soil Sidewall Sampling Soil samples were collected from the creek sidewall at the water line using a 2-inch diameter slide hammer with a 12-inch long barrel loaded with a lexan plastic sleeve. The core barrel was advanced one (1) foot horizontally into the creek sidewall then removed. The lexan plastic sleeve was extracted from the core barrel and capped on both ends with Teflon sheets and plastic caps. The top and bottom of each sediment core was clearly labeled with a permanent marker. The slide hammer core barrel shoe and head were decontaminated between each sample location. The core barrel was decontaminated with a three stage wash between sample locations because it did not come in contact with sample materials. Two cores were collected at each sediment sampling location.
Two duplicate samples were collected at sidewall locations as Quality Assurance samples.
2.7 Water Sampling Samples of water from the creek were collected from the middle of the water column at the midpoint of the channel at each location. Laboratory supplied containers were submerged below the water surface and

5 March 6, 2012 UC Berkeley Stanley Hall Diesel Spill - Natural Resource Damage Assessment December 2011 Water and Sediment Sampling Summary
www.cardnoentrix.com
the cap was removed, allowing the bottle to fill. Once the bottle was filled, it was capped and removed from the stream. Due to the need for sample preservation, samples to be analyzed for volatile organic compounds (VOCs) were collected by decanting creek water collected in a clean 1-liter amber bottle into 40 milliliter volatile organic analysis (VOA) containers which contained hydrochloric acid as a preservative.
One duplicate water sample was collected from Strawberry Creek as a Quality Assurance sample.
2.8 Chemical Analyses All samples were analyzed for the presence of diesel range total petroleum hydrocarbons TPH-D, C8-C40 n-alkanes and isoprenoids, and a standard list of aromatic volatile organic compounds (VOCs) that included benzene, toluene, ethylbenzene, and xylene (BTEX). Sediments were analyzed for total organic carbon (TOC). If a diesel signature was present in any of the samples, a second round of analysis related to diesel fingerprinting was proposed in the Sampling Plan to further determine if the product found in the samples is directly related to the subject spill
All water, soil, and sediment samples were analyzed for TPH –D by EPA method 8015B; VOC/ BTEX were analyzed by EPA method 8260B. Analysis of TOC was performed by SM 5310C.
3.0 Deviations from Sampling Plan This section summarizes instances where the field sampling effort deviated from the Sampling Plan.
3.1 Sample Location Deviations In the Source location (BK1-3), the water sample was collected just downstream of the Stanley Hall concrete culvert discharging into Strawberry Creek as specified in the sampling plan, however the channel bottom and sidewalls in this area were lined with concrete and riprap. The field team collected the sediment and sidewall samples and the nearest possible downstream location, approximately 60 feet south of the source area, just past the bridge that crosses the creek.
At BK1-5, the water, soil sidewall and sediment samples were collected approximately 100 feet upstream of where the creek enters the Oxford Culvert because the channel was concrete lined, the sides were reinforced with concrete and riprap and the creek did not contain enough sediment to sample or a deep enough stream to collect a mid-column water sample. The field team instead sampled from the nearest area with a natural creek bottom, deep enough to collect the water, soil and sediment sample.
3.2 Samples Not Collected 3.2.1 The field team was not able to collect samples identified in the Sampling Plan from Strawberry Creek Park or any daylight sections of Strawberry Creek between the UC Berkeley campus and Brickyard Cove due to limited daylight hours. Due to the inaccessibility of the area caused by the muddy environment, the field team was not able to collect a water sample from the creek path between the booms in Brickyard Cove (sample location BK1-10 as identified in the Sampling Plan) nor sediment samples from the creek bed in Brickyard Cove. The team collected a water sample at the mouth of the Strawberry Creek where
Soil, Sediment, Water

6 March 6, 2012 UC Berkeley Stanley Hall Diesel Spill - Natural Resource Damage Assessment December 2011 Water and Sediment Sampling Summary
www.cardnoentrix.com
the creek discharges to Brickyard Cove (BK1-9) and sediment samples along the banks of Brickyard Cove as specified in the Study Plan (Figure 3).
3.2.2 Cardno ENTRIX was not able to collect any samples of sheen in Strawberry Creek as part of this investigation due to equipment limitations. Sheen was observed in Strawberry Creek in all locations on the UC Berkeley Campus downstream of the source area. The field team did not observe sheen at the reference locations upstream of the source area. In Brickyard Cove there was no observed sheen in the creek, or in any of the soil or sediments.
Sheen Sampling
3.3 Sample Volume Limitations In order to obtain sufficient sample volume for the two-tiered analysis approach outlined in the Sampling Plan, Cardno ENTRIX collected two sediment and two soil cores from each sampling location listed in Table 1. The top one (1) centimeter (cm) of each core was composited for preliminary analysis and the remaining portion of the core archived for potential future analysis. Due to the rocky and porous nature of the substrate and the high degree of organic matter (e.g. root masses) the samples did not always contain sufficient material to perform the intended two-tiered analysis. A minimum of 50 grams (g) wet weight of sediment or soil was required to achieve target analytical detection limits for the Tier 1 hydrocarbon and TOC analysis. Analysis of TOC was conducted for 13 of the 19 sediment and soil samples collected (Table 2). TOC was not analyzed for 6 sediment samples (Table 2). In such instances, the portion of material allocated for TOC analysis was split proportionately and used for TPH and VOC analysis to ensure their adequate detection limits.
One objective of the analytical approach included in the Sampling Plan was to archive sediment/soil for Tier 2 analyses to provide a sample for diesel hydrocarbon fingerprinting, if necessary. Depending on the moisture level of the sediment/soil, approximately 35g wet weight is required to achieve typical detection limits in the Tier 2 analysis (acceptable detection limits can be achieved with less than 35g if the sediment contains a substantial diesel signature). Sediment sample availability for Tier 2 analyses were as follows: two (2) samples provided enough material for Tier 2 analysis (i.e. more than 35g); 11 samples provided less than 35g of sediment/soil, and six (6) samples did not provide any material for Tier 2 analysis (Table 2).
4.0 Results and Discussion Curtis and Tompkins Laboratory (Berkeley, CA) analyzed water samples and 1 cm surface sections of sediment and soil cores for TPH and VOCs to evaluate the magnitude and diesel signature of the potential contamination. The remaining sediment and soil cores have been archived (i.e. stored at -20° C) for potential further analysis.
Diesel oil has a distinctive total petroleum hydrocarbon signature that spans "low-boiling" range hydrocarbons in the range of C10 thru C24 alkanes. The diesel spill occurred in an urban environment that may contribute hydrocarbons from multiple biogenic and/or anthropogenic sources. Therefore, to fully evaluate the diesel range organics from the spill relative to the urban background, two TPH parameters were measured to characterize the general boiling range of the total petroleum hydrocarbon signature.

7 March 6, 2012 UC Berkeley Stanley Hall Diesel Spill - Natural Resource Damage Assessment December 2011 Water and Sediment Sampling Summary
www.cardnoentrix.com
TPH-DRO (C10-C24) captures the diesel range organics; while TPH-LOR (C24-C36) captures the heavier lubricating oil range of the total petroleum hydrocarbons. This report assesses the magnitude of VOCs, TPH-DRO, and TPH-LOR across the range of sampling locations (Tables 3 and 4, Figure 4). As a diagnostic indicator of potential diesel contamination, we calculated the ratio of TPH-DRO to TPH-LOR. A low ratio value suggests hydrocarbon contamination consistent with urban background conditions. A high ratio, on the other hand, suggests a potential contribution of diesel range organics to the TPH signal. We use this ratio as a first-level screening tool. We then confirmed the actual diesel range organic signature by visual inspection of the flame ionization detector (FID) chromatograms. It is important to note that TPH measurements are not chemical specific and provide a description of generalized hydrocarbon sources. Consequently, elevated diagnostic ratio values can be derived from non-diesel hydrocarbons that register in the same chromatographic TPH range. In this case, the chromatographic signature can provide evidence that the elevated diagnostic ratios are not due to a diesel source.
4.1 Reference conditions were measured by the environmental samples collected in the reference areas upstream of the spill location (Stations BK1-1 and BK1-2). Located upstream of the outfall location, it was unlikely that the reference locations were impacted by the diesel spill. In addition, the reference locations were similar in nature and close enough to the spill path to receive comparable contributions from the urban background sources. Therefore, the chromatograms and diagnostic ratio information from these reference samples were used to qualitatively and quantitatively differentiate a diesel contribution from background sources.
Reference Conditions
4.2 Diesel sheen or odors were not noticed in the two reference areas (BK1-1 and BK1-2) sampled upstream of the spill location. VOCs were not detected in water, sediment or soil samples collected at these locations. TPHs also were not detected in the reference water samples collected at these locations (Table 3). For this reason, it is not possible to calculate diagnostic ratios for water samples to compare against a reference index value.
Reference Samples
Sediment sample BK1-1-SD1 had a TPH-DRO concentration of 13 µg/Kg, and a TPH-LOR concentration of 100 µg/Kg. Soil sample BK1-1-SL1 had a TPH-DRO concentration of 22 µg/Kg, and a TPH-LOR concentration of 120 µg/Kg. The diagnostic ratio value was 0.13 for the sediment sample, and 0.18 for the soil sample. The TPH chromatograms were inspected, and indicated a hydrocarbon boiling range not related to diesel oil (Figures 5 and 6). The average diagnostic ratio value for these reference sediments served as the diagnostic ratio index to compare samples collected downstream of the Source in an effort to tease out urban background characteristics (Figure 4 - bottom). The urban background sources in these samples are characterized by a chromatographic TPH profile that peaks well beyond the boiling range of diesel range organics.
4.3 Sediment, soil, and water samples were collected as close as feasible to the outfall pipe at the Source location. Sheen was visible at this location during sampling and the field team noted a strong diesel odor at this location. However, VOCs were not detected in water, sediment or soil samples (Tables 3 and 4). TPHs were also not detected in the outfall water sample BK1-3-WA (Table 3). This result suggests that
Source Location Samples

8 March 6, 2012 UC Berkeley Stanley Hall Diesel Spill - Natural Resource Damage Assessment December 2011 Water and Sediment Sampling Summary
www.cardnoentrix.com
diesel related hydrocarbons were not at detectable concentrations in the water column below the diesel sheen film. In light of the visual confirmation of sheen at this location, sheen sample collection could have yielded chemical detections.
TPH-DRO and TPH-LOR were detected in all Source location/outfall sediment and soil samples (BK1-3-SD1, BK1-3-SL1, BK1-3-SL2; Figure 4 – top). The diagnostic ratio for the sediment sample was only slightly higher than the reference location (Table 4; Figure 4 - top). The diagnostic ratio for the soil samples collected in the left and right banks at the wetted perimeter were approximately three to four times higher than reference. Upon inspection of the diagnostic ratios (Figure 4 – bottom) and the FID chromatograms (Figures 7 and 8), it was evident that only the left bank sample BK1-3-SL1, and to a lesser extent the right bank sample BK1-3-SL2, displayed a diesel fingerprint. The FID chromatogram for the sediment sample was characteristic of the reference conditions (Figure 9).
4.4 Sediment, soil and water samples were collected adjacent to the VLSB above the culvert (BK1-4). Although sheen was visible in the pooled water present at the location, along with a slight diesel odor, VOCs were not detected in water samples (Table 1). As noted above, this result suggests that diesel related hydrocarbons were at undetectable concentrations in the water column below the diesel sheen. In light of the visual confirmation of sheen at this location, sheen sample collection could have yielded chemical detections. TPH-DRO was measured in the water sample BK1-4-WA1 at a low level (68 µg/L) however upon more detailed inspection of the FID chromatogram there was no evidence of any hydrocarbons measured for this sample (Figure 10). As noted above, TPH-DRO measurements do not necessarily indicate the contribution of diesel to the sample. In this case, the chromatographic signature provided evidence that the measured TPH-DRO concentration was not due to a diesel source.
Samples Collected Adjacent to the VLSB
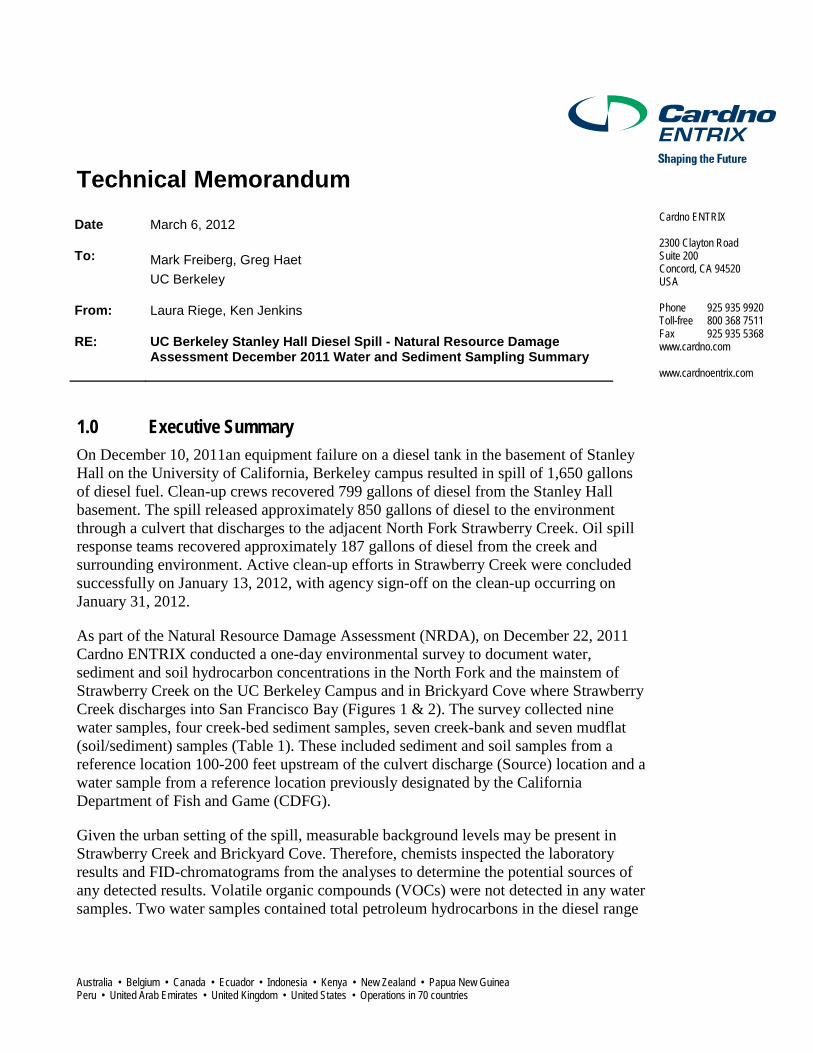
VOCs were detected in one soil bank sample from BK1-4-SL1 (Table 4; Figure 4 – top). This is the only sediment/soil sample in the survey with detectable levels of VOCs. TPH-DRO and TPH-LOR also were detected in all sediment and soil samples from this location (BK1-4-SD1, BK1-4-SL1, BK1-4-SL2; Table 4; Figure 4 – top). The diagnostic ratio for all three samples was much higher than the reference ratio with the highest value measured in the left bank sample, BK1-4-SL1. Upon inspection of the FID chromatograms (Figures 11-13) and diagnostic ratios (Figure 4 – bottom), it was evident that all non-water samples from this location displayed a diesel fingerprint. We recommend analyzing the deeper sections of the cores for these soil and sediment samples to determine if the diesel concentrations penetrate deeper than 1 cm. These data would be useful to understand the potential impact to the subsurface zone in this area.
4.5 Sediment, soil, and water samples were collected just upstream of the channel near Oxford Culvert. The field team observed a strong diesel odor at this location. VOCs were not detected in water, sediment or soil samples (Tables 3 and 4). TPH-DRO was detected in the water sample (BK1-5-WA; Table 3). The FID chromatogram of the water sample exhibited a slightly right skewed TPH signature possibly attributed to a lightly weathered diesel (Figure 14).
Samples Collected at the Channel Oxford Culvert

9 March 6, 2012 UC Berkeley Stanley Hall Diesel Spill - Natural Resource Damage Assessment December 2011 Water and Sediment Sampling Summary
www.cardnoentrix.com
TPH-DRO and TPH-LOR were detected in all sediment and soil samples (BK1-5-SD1, BK1-5-SL1, BK1-5-SL2; Table 4; Figure 4 – top). The sediment concentration of TPH-DRO was approximately two times the average value of the reference locations. Soil concentrations of the TPH-DRO were six and seven times higher than the average of the reference concentrations, and approximately 30 times less than concentrations measured at the VLSB site (BK1-4-SL1 and BK1-4-SL2; Table 4; Figure 4). Upon inspection of the FID chromatograms for the soils (Figures 15 and 16) and diagnostic ratios (Figure 4 – bottom), it was evident that the elevated diagnostic ratio values were not likely diesel related due to the heavier than diesel boiling range of the TPH signature. As noted above, the TPH signature gives a general indication of hydrocarbon characteristics. In this case, the chromatographic signature provided evidence that the elevated diagnostic ratios for these samples were not due to a diesel source. No diesel contribution is evident in the sediment sample BK1-5-SD1 (Figure 17).
4.6 The field team did not observe any sheen or diesel odor in any of the Brickyard Cove sampling locations (BK1-9, BK1-12 and BK1-13). VOCs were not detected in water or sediment/soil samples (Tables 3 and 4). TPH-DRO was not detected in the water sample BK1-9-WA (Table 3).
Samples Collected at the Brickyard Cove – Before the 1st Boom
TPH-DRO and TPH-LOR were detected in both sediment/ soil samples from this location (BK1-12-SL1, BK1-13-SL1; Table 4; Figure 4 – top). The diagnostic ratio for the left bank sample (BK1-12-SL1) was twice the level of the reference ratio. Upon inspection of the FID chromatogram for BK1-12-SL1, it was evident that there may be a trace level of diesel range organics in the sample. However, the potential diesel components are so low that they may not result in detectable signals in subsequent Tier 2 analyses (Figure 18). Upon inspection of the FID chromatogram for the right bank sample BK1-13-SL1, it was evident that the high TPH signature was not related to diesel range organics, but derived from the urban background (Figure 19). This is consistent with the diagnostic ratio for this sample which was nearly the same as the upstream reference location (Figure 4 – bottom).
4.7 Sediment samples were collected at the Brickyard Cove mudflat between the installed booms (Figure 3). As with all Brickyard Cove locations, the field team did not observe any sheen or diesel odor in this location. VOCs were not detected in the sediment samples (Table 4). TPH-DRO and TPH-LOR were detected in both samples from this location (BK1-14-SL1, BK1-15-SL1; Table 4; Figure 4 – top). The diagnostic ratio for the left bank sample (BK1-14-SL1) was approximately equal to the reference location, whereas the diagnostic ratio for the right bank sample (BK1-15-SL1) was twice the average value of the index ratio at the reference location. Upon inspection of the FID chromatogram for BK1-14-SL1, it was evident that, as seen with the reference locations, the TPH signature was high boiling, and not related to diesel range organics (Figure 20). Inspection of the FID chromatogram for BK1-15-SL1 showed that there may be a trace level of diesel range organics in the sample. However, the potential diesel components are so low in the sample that they may not result in detectable signals in Tier 2 analyses (Figure 21).
Samples Collected at the Brickyard Cove – Between Booms
4.8 Three (3) sediment and water samples were collected at the Brickyard Cove outside of the second boom (Figure 3). No sheen or diesel odor was evident in this location. VOCs were not detected in either water or sediment samples (Tables 3 and 4). TPH-DRO was not detected in the water sample (Table 3).
Samples Collected at the Brickyard Cove – Outside Boom 2

10 March 6, 2012 UC Berkeley Stanley Hall Diesel Spill - Natural Resource Damage Assessment December 2011 Water and Sediment Sampling Summary
www.cardnoentrix.com
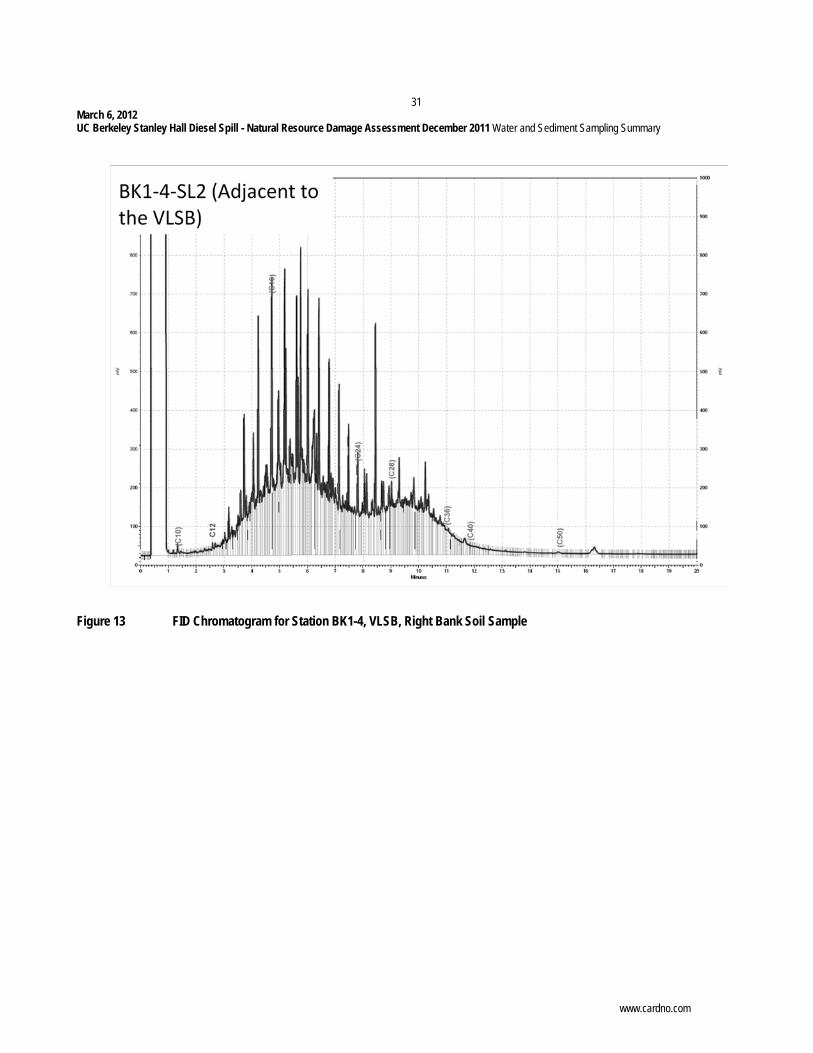
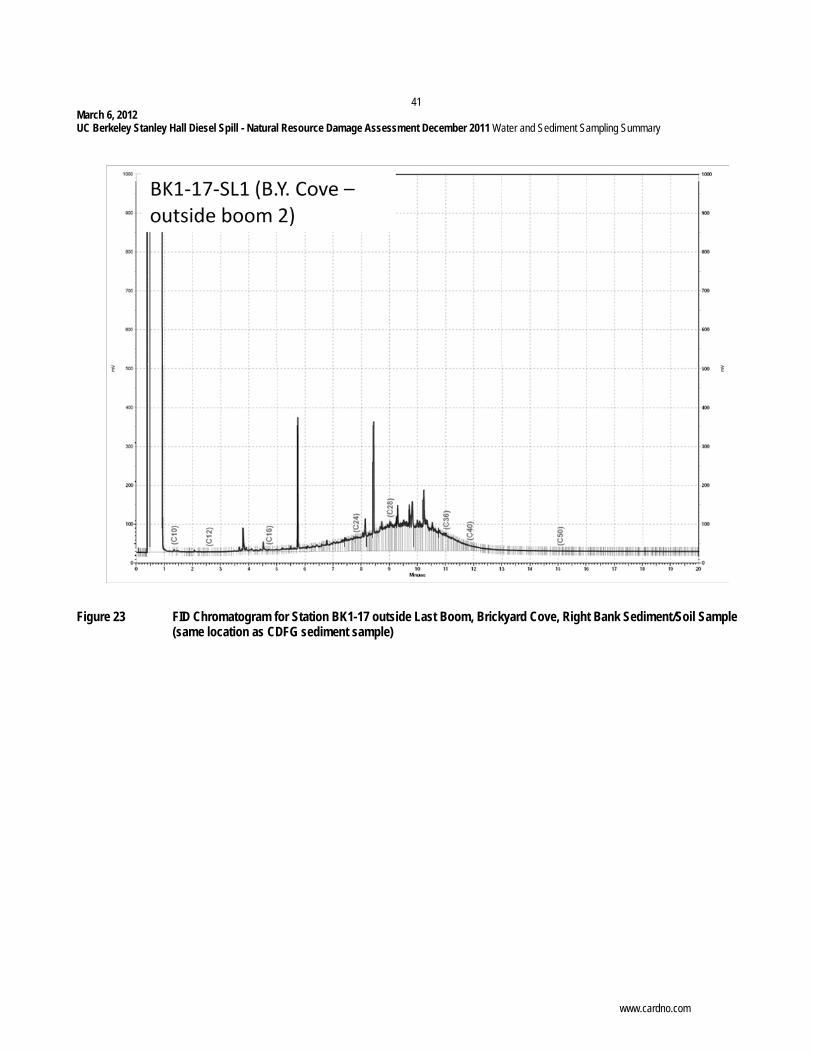
TPH-DRO and TPH-LOR were measured in both sediment samples from this location (BK1-16-SL1, BK1-17-SL1; Table 4; Figure 4 – top). Upon inspection of the FID chromatograms and diagnostic ratio values for both solid samples, it was evident that the respective TPH signatures were not related to diesel range organics, but derived from the urban background (Figures 22 and 23).
5.0 Conclusions Upon analysis of the collected samples by Tier 1 analysis, clear hydrocarbon source distinctions were made between samples that exhibited solely urban background signatures; samples that exhibited dominant urban background signatures, with trace contributions from diesel range organics or other unknown sources; samples that exhibited contributions from both the urban background and diesel range organics; and samples that exhibited dominant contributions from diesel range organics.
Conclusive diesel range organic signatures were evident in samples collected from three locations; the location adjacent to the VLSB (BK1-4), the soil samples from the Source location outfall (BK1-3), and the water sample collected upstream from the Oxford Culvert (BK1-5). Trace and inconclusive levels of diesel range organics were detected in samples from two locations; Brickyard Cove inside the first boom, and Brickyard Cove in-between the booms. Low levels of an unknown hydrocarbon source likely not related to diesel are present in the soil samples collected from the Channel Oxford Culvert.
The specific hydrocarbon source characterization results are listed below.
5.1 • VOCs not detected in any water sample
Water samples
• TPH-DRO was detected in two samples, BK1-4 and BK1-5. Based on the inspection of the FID chromatograms:
o BK1-4 (Adjacent to the VLSB) No hydrocarbon signal in the chromatogram o BK1-5 (Channel upstream of the Oxford Culvert) possible weathered diesel contribution
5.2 • VOCs detected in the VLSB left bank soil sample-BK1-4-SL1
Sediment and soil samples
• TPH-DRO and TPH-LOR were detected in all samples. Based on the inspection of the FID chromatograms:
o BK1-1 SD1 (New Reference location) urban background reference o BK1-1 SL1 (New Reference location) urban background reference o BK1-3 SD1 (Source) urban background signal observed o BK1-3 SL1 (Source) diesel contribution within range of urban background contribution o BK1-3 SL2 (Source) diesel contribution within range of urban background contribution o BK1-4 SD1 (Adjacent to the VLSB) diesel contribution approximately equal to urban
background contribution

11 March 6, 2012 UC Berkeley Stanley Hall Diesel Spill - Natural Resource Damage Assessment December 2011 Water and Sediment Sampling Summary
www.cardnoentrix.com
o BK1-4 SL1 (Adjacent to the VLSB) diesel contribution greater that urban background contribution
o BK1-4 SL2 (Adjacent to the VLSB) diesel contribution greater that urban background contribution
o BK1-5 SD1 (Channel Oxford Culvert) diagnostic ratio and signals consistent with urban background
o BK1-5 SL1 (Channel Oxford Culvert) urban background with other source contribution not likely to be diesel related.
o BK1-5 SL2 (Channel Oxford Culvert) urban background with other source contribution not likely to be diesel related.
o BK1-12 SL1 (Brickyard Cove – before 1st boom) urban background with possible trace level diesel contribution
o BK1-13 SL1 (Brickyard Cove – before 1st boom) elevated urban background o BK1-14 SL1 (Brickyard Cove – between booms) urban background o BK1-15 SL1 (Brickyard Cove – between booms) urban background with possible trace
level diesel contribution o BK1-16 SL1 (Brickyard Cove – outside boom 2) urban background signal o BK1-17 SL1 (Brickyard Cove – outside boom 2) urban background signal
6.0 Recommendations The Stanley Hall Diesel Spill was a relatively small spill and sampling twelve days after the spill confirmed the presence of diesel product at only a few locations. Sheen was not present in the reference locations, but was observed at all on-campus sampling locations downstream of the Source location during the December 22, 2011 survey. No sheen or diesel odor was observed in the Brickyard Cove sampling locations.
Strawberry Creek Park was not sampled during the December 22, 2011 survey; however, sheen and diesel odor continued to be observed into January 2012. As of January 23, 2012, recent storms contributed over three inches of rain and significant surface runoff to the creek system. Response Daily Update Reports beginning January 23, 2011 report that no significant odor or sheen have been observed at any of the observed locations, including the UC Berkeley campus, Strawberry Creek Park, Allston Street, and at the Source area. It is reasonable to assume that Strawberry Creek downstream of the UC Berkeley campus contained modest amounts of diesel, but the creek system is now largely flushed with the storms.
The Tier 1 analyses of the water, sediment and soil samples collected during the December 22, 2011 survey, as summarized in this report, provide sufficient chemical information to effectively screen the environmental samples for diesel range organic hydrocarbons. Results from Tier 1 analysis indicate that aside from the Source outfall location, the only diesel specific impact occurred at the sample location adjacent to the VLSB (BK1-4). This result is not surprising given the relatively lower gradient, higher sedimentation levels and high degree of overhanging grasses and vegetation at this location. We

12 March 6, 2012 UC Berkeley Stanley Hall Diesel Spill - Natural Resource Damage Assessment December 2011 Water and Sediment Sampling Summary
www.cardnoentrix.com
recommend analyzing the deeper sections of the soil and sediment cores collected to determine if the diesel concentrations penetrate deeper than 1 cm.
Tier 2 analyses generate chemical specific results that can be used to confirm or reject a diesel related source of an unknown sample when compared to the fingerprint of a representative diesel oil. Given the rocky and porous nature of the substrate and the high degree of organic matter contained in the soil and sediment samples, generally there was not enough soil or sediment material available to promote any sample for Tier 2 analyses. Nonetheless, the Tier-1 evaluation proved adequate to screen the environmental samples for diesel range organics. We do not recommend further Tier 2 analyses at this time.
Given this result and the reasonable assumption that the creek system was largely flushed by the recent storms, we do not recommend any further water, sediment or soil sampling. We suggest that the UC Berkeley work with the CDFG, the City of Berkeley and other Trustees to identify appropriately scaled restoration projects. UC Berkeley might consider a pair of restoration projects; one on campus and one in the City of Berkeley (e.g. at Strawberry Creek Park). Appropriate projects that would address the impacts of the spill include:
• Removal of non-native vegetation (which was noted during the Response phase to trap diesel product);
• Restoration of instream habitat by the removal of concrete slabs and improved rocky/gravel substrate (rocks, gravel and concrete slabs potentially created pockets of diesel product); and
• Creek side restoration to improve the aesthetics and function of the riparian corridor.
UC Berkeley, City of Berkeley and Regional Park District may have already compiled a list of potential restoration projects that would be suitably scaled to address the impacts of this spill.
7.0 References Cardno ENTRIX 2011. UC Berkeley – Stanley Hall Diesel Spill; Natural Resources Damage Assessment
Water and Sediment Sampling and Analysis Plan. Prepared for University of California, Berkeley. December 21, 2011.

Tables

13 March 6, 2012 UC Berkeley Stanley Hall Diesel Spill - Natural Resource Damage Assessment December 2011 Water and Sediment Sampling Summary
www.cardno.com
Table 1 Site and Sample Descriptions
Sample Number Date Sample
Time Sample Location (NAD 83) Sample
Type Site Description Comments Latitude Longitude
BK1-1-WA1 12/22/2011 1310 37.87297 122.26177 Water UC Berkeley Campus. New reference location established 90-100' upstream of source (60' direct line distance) in an instream area comparable to the spill location. “New Reference” location.
No sheen or diesel odor evident.
BK1-1-WA1FD 12/22/2011 1310 37.87297 122.26177 Water UC Berkeley Campus. 90-100' upstream of source (60' direct line
distance). Field duplicate.
BK1-1-SD1 12/22/2011 1425 37.87341 122.26151 Sediment UC Berkeley Campus. Sampler met with refusal at BK11. The sediment sample was collected approximately 200' upstream.
200' upstream of BK11WA1, pool habitat. Coordinates extracted from Google Earth.
BK1-1-SL1 12/22/2011 1427 37.87297 122.26177 Soil (Bank) UC Berkeley Campus. Left bank sample (looking downstream).
BK1-2-WA1 12/22/2011 1300 37.87278 122.26175 Water UC Berkeley Campus, location of CDFG reference sample site immediately upstream of the spill site. Pool just upstream of BK13. No sediment or bank soil samples were collected at this location. This duplicates the effort by CDFG at this location.
Sheen visible and strong diesel odor present.
BK1-3-WA1 12/22/2011 1255 37.87278 122.26175 Water UC Berkeley Campus. Source location. Outfall pipe by bridge. Vegetation at the site was recently trimmed (possibly before our arrival today).Water samples were collected moving upstream to BK1-1 to minimize disturbance of water samples.
A lot of sheen visible at the location. Strong diesel odor present.
BK1-3-SD1 12/22/2011 1405 37.87266 122.26184 Sediment UC Berkeley Campus. Substrate at BK1-3 is extremely rocky, so the sediment sample was collected as close as feasible, 60' downstream of the outfall pipe.
Riffle habitat. Coordinates extracted from Google Earth.
BK1-3-SL1 12/22/2011 1409 37.87266 122.26184 Soil (Bank) UC Berkeley Campus. Left bank sample. Same location as sediment samples.
BK1-3-SL2 12/22/2011 1418 37.87266 122.26184 Soil (Bank) UC Berkeley Campus. Right bank sample Same location as sediment samples.
BK1-4-WA1 12/22/2011 958 37.87219 122.26294 Water UC Berkeley Campus. Adjacent to the VLSB above a culvert. The channel has a natural bottom and is shaded by riparian trees.
Lots of sheen is visible in the pooled water present at the location, and there is a slight diesel odor.
BK1-4-SD1 12/22/2011 1030 37.87219 122.26294 Sediment UC Berkeley Campus VLSB.
BK1-4-SL1 12/22/2011 1043 37.87219 122.26294 Soil (Bank) UC Berkeley Campus VLSB. Left Bank of Site 4.
BK1-4-SL2 12/22/2011 1050 37.87219 122.26294 Soil (Bank) UC Berkeley Campus VLSB. Right Bank of Site 4.
BK1-5-WA1 12/22/2011 1145 37.87029 122.26532 Water UC Berkeley Campus. The channel at Oxford culvert is cement lined and therefore no soil or bank samples can be collected at the site. Samples were collected upstream in a more natural bottom area. Water sample collected at the concrete/natural bottom transition.
Strong diesel odor present
BK1-5-SD1 12/22/2011 1155 37.87052 122.26512 Sediment UC Berkeley Campus. Samples were collected upstream in a more natural bottom area

14 March 6, 2012 UC Berkeley Stanley Hall Diesel Spill - Natural Resource Damage Assessment December 2011 Water and Sediment Sampling Summary
www.cardno.com
Table 1 Site and Sample Descriptions
Sample Number Date Sample
Time Sample Location (NAD 83) Sample
Type Site Description Comments Latitude Longitude
BK1-5-SL1 12/22/2011 1210 37.87052 122.26512 Soil (Bank) UC Berkeley Campus. Samples were collected upstream in a more natural bottom area; left bank.
BK1-5-SL2 12/22/2011 1205 37.87052 122.26512 Soil (Bank) UC Berkeley Campus. Samples were collected upstream in a more natural bottom area; right bank.
BK1-9-WA1 12/22/2011 1610 37.86581 122.30669 Water Strawberry Creek discharge at Brickyard Cove. Mid-channel between sites 12 and 13. No sheen or diesel odor evident.
BK1-11-WA1 12/22/2011 1555 37.86506 122.3076 Water Brickyard Cove outside the last boom. No sheen or diesel odor evident. Coordinates extracted from Google Earth.
BK1-12-SL1 12/22/2011 1600 37.86581 122.30669 Soil (Bank) Brickyard Cove, inside boom, left bank of mudflat.
No sheen or diesel odor evident. All Brickyard Cove sediment/bank sites were within an area wetted by tidal influence. The area behind the first boom, we would consider mudflat/sediment. Where possible, horizontal cores were collected for the "Bank" of the tidal sites.
BK1-13-SL1 12/22/2011 1619 37.86581 122.30669 Soil (Bank) Brickyard Cove, inside boom. Immediately across from BK1-12, right bank of mudflat. No sheen or diesel odor evident.
BK1-14-SL1 12/22/2011 1712 37.86512 122.30646 Soil (Bank) Brickyard Cove, southeast side (left bank) of the mudflat, between the creek discharge and the furthest boom. No sheen or diesel odor evident.
BK11EB 12/22/2011 1733 37.86512 122.30646 Water Equipment Blank following sample collection at BK1-14.
BK1-15-SL1 12/22/2011 1635 37.86554 122.30778 Soil (Bank) Right bank of the mudflat between creek discharge and furthest boom. No sheen or diesel odor evident.
BK1-15-SL1FD 12/22/2011 1635 37.86554 122.30778 Soil (Bank) Field Duplicate Sample
BK1-16-SL1 12/22/2011 1655 37.8648 122.30737 Soil (Bank) Brickyard Cove, southeast side. Left bank of the mudflat downstream of creek discharge, outside the boom. No sheen or diesel odor evident.
BK1-16-SL1FD 12/22/2011 1655 37.8648 122.30737 Soil (Bank) Field Duplicate Sample
BK1-17-SL1 12/22/2011 1640 37.86536 122.30778 Soil (Bank) Right bank of mudflat downstream of creek discharge, outside boom. Previous CDFG reference sample was collected at this location. No sheen or diesel odor evident.
*Note: Except as noted, GPS coordinates were recorded on a Garmin Oregon 450 Unit. All samples were grab samples. Left/right bank are based looking downstream.

15 March 6, 2012 UC Berkeley Stanley Hall Diesel Spill - Natural Resource Damage Assessment December 2011 Water and Sediment Sampling Summary
www.cardno.com
Table 2 Analyses Completed and Remaining Sample for Tier 2 Analyses
Sample Number Sample Type
Tier 1 Analyses Completed Tier 2 Analyses
(red text = no TOC) (35g needed for analyses) BK1-1-EB Water TPH-d, VOC N/A
BK1-1-WA1 Water TPH-d, VOC N/A
BK1-1-WA1-FD Water TPH-d, VOC N/A
BK1-1-SD1 Sediment TPH-d, VOC, TOC Enough for Tier 2
BK1-1-SL1 Soil (Bank) TPH-d, VOC None Available
BK1-2-WA1 Water TPH-d, VOC N/A
BK1-3-WA1 Water TPH-d, VOC N/A
BK1-3-SD1 Sediment TPH-d, VOC, TOC Enough for Tier 2
BK1-3-SL1 Soil (Bank) TPH-d, VOC None Available
BK1-3-SL2 Soil (Bank) TPH-d, VOC, TOC Not enough to remaining to achieve ideal detection limits- 14.84g remaining
BK1-4-WA1 Water TPH-d, VOC N/A
BK1-4-SD1 Sediment TPH-d, VOC, TOC Not enough to remaining to achieve ideal detection limits- 17.18g remaining
BK1-4-SL1 Soil (Bank) TPH-d, VOC, TOC Not enough to remaining to achieve ideal detection limits- 6.61g remaining
BK1-4-SL2 Soil (Bank) TPH-d, VOC None Available
BK1-5-WA1 Water TPH-d, VOC N/A
BK1-5-SD1 Sediment TPH-d, VOC, TOC Not enough to remaining to achieve ideal detection limits- 24.46 g remaining
BK1-5-SL1 Soil (Bank) TPH-d, VOC None Available
BK1-5-SL2 Soil (Bank) TPH-d, VOC None Available
BK1-9-WA1 Water TPH-d, VOC N/A
BK1-11-WA1 Water TPH-d, VOC N/A
BK1-12-SL1 Soil (Bank) TPH-d, VOC None Available
BK1-13-SL1 Soil (Bank) TPH-d, VOC, TOC Not enough to remaining to achieve ideal detection limits- 8.12 g remaining
BK1-14-SL1 Soil (Bank) TPH-d, VOC, TOC Not enough to remaining to achieve ideal detection limits- 11.97g remaining
BK1-15-SL1 Soil (Bank) TPH-d, VOC, TOC Not enough to remaining to achieve ideal detection limits- 3.57g remaining
BK1-15-SL1-FD Soil (Bank) TPH-d, VOC, TOC Not enough to remaining to achieve ideal detection limits- 20.03g remaining
BK1-16-SL1 Soil (Bank) TPH-d, VOC, TOC Not enough to remaining to achieve ideal detection limits- 18.83g remaining

16 March 6, 2012 UC Berkeley Stanley Hall Diesel Spill - Natural Resource Damage Assessment December 2011 Water and Sediment Sampling Summary
www.cardno.com
Table 2 Analyses Completed and Remaining Sample for Tier 2 Analyses
Sample Number Sample Type
Tier 1 Analyses Completed Tier 2 Analyses
(red text = no TOC) (35g needed for analyses) BK1-16-SL1-FD Soil (Bank) TPH-d, VOC, TOC Not enough to remaining to achieve ideal detection limits- 14.84g remaining
BK1-17-SL1 Soil (Bank) TPH-d, VOC, TOC Not enough to remaining to achieve ideal detection limits- 9.18g remaining
Table 3 Water Chemistry Results Sample ID BK1-1-WA1 BK1-2-WA1 BK1-2-WA1-FD BK1-3-WA1 BK1-4-WA1 BK1-5-WA1 BK1-9-WA1 BK1-11-WA1 BK1-1-EB TRIP
Matrix Water Water Water Water Water Water Water Water Water Water TPH-DRO C10-C24 ND ND ND ND 68.0 1100.0 ND ND ND ND TPH-LOR C24-C36 ND ND ND ND ND ND ND ND ND ND 1,2,4-Trichlorobenzene ND ND ND ND ND ND ND ND ND ND 1,2,4-Trimethylbenzene ND ND ND ND ND ND ND ND ND ND 1,3,5-Trimethylbenzene ND ND ND ND ND ND ND ND ND ND Benzene ND ND ND ND ND ND ND ND ND ND Naphthalene ND ND ND ND ND ND ND ND ND ND Ethylbenzene ND ND ND ND ND ND ND ND ND ND Isopropylbenzene ND ND ND ND ND ND ND ND ND ND m,p-Xylenes ND ND ND ND ND ND ND ND ND ND n-Butylbenzene ND ND ND ND ND ND ND ND ND ND o-Xylene ND ND ND ND ND ND ND ND ND ND Para-Isopropyl Toluene ND ND ND ND ND ND ND ND ND ND Propylbenzene ND ND ND ND ND ND ND ND ND ND Sec-Butylbenzene ND ND ND ND ND ND ND ND ND ND Styrene ND ND ND ND ND ND ND ND ND ND Tert-Butylbenzene ND ND ND ND ND ND ND ND ND ND Toluene ND ND ND ND ND ND ND ND ND ND
Note: results reported in µg/L; ND=not detected

17 March 6, 2012 UC Berkeley Stanley Hall Diesel Spill - Natural Resource Damage Assessment December 2011 Water and Sediment Sampling Summary
www.cardno.com
Table 4 Soil and Sediment Chemistry Results
Sample ID
BK1-
1-SD
1
BK1-
1-SL
1
BK1-
3-SD
1
BK1-
3-SL
1
BK1-
3-SL
2
BK1-
4-SD
1
BK1-
4-SL
1
BK1-
4-SL
2
BK1-
5-SD
1
BK1-
12-S
L1
BK1-
13-S
L1
BK1-
14-S
L1
BK1-
15-S
L1
BK1-
15-S
L1-F
D
BK1-
16-S
L1
BK1-
16-S
L1-F
D
BK1-
17-S
L1
Matrix Sed. Soil Sed. Soil Soil Sed. Soil Soil Sed. Soil Soil Soil Soil Soil Soil Soil Soil
TOC (%) 0.18 N/A 0.3 N/A 1.6 0.35 2.6 N/A 0.2 N/A 9.4 0.31 1.8 1.6 0.51 0.58 1.4
TPH-DRO C10-C24 13 22 44 310 210 320 6200 840 14 430 1900 24 220 150 41 60 75
TPH-LOR C24-C36 100 120 230 520 500 270 1200 520 120 1500 11000 130 710 490 270 270 390
Diagnostic Ratio 0.13 0.18 0.19 0.60 0.42 1.18 5.1 1.6 0.12 0.29 0.17 0.18 0.31 0.31 0.15 0.22 0.19
1,2,4-Trichlorobenzene ND ND ND ND ND ND ND ND ND ND ND ND ND ND ND ND ND
1,2,4-Trimethylbenzene ND ND ND ND ND ND 12.0 ND ND ND ND ND ND ND ND ND ND
1,3,5-Trimethylbenzene ND ND ND ND ND ND 20.0 ND ND ND ND ND ND ND ND ND ND
Benzene ND ND ND ND ND ND ND ND ND ND ND ND ND ND ND ND ND
Naphthalene ND ND ND ND ND ND ND ND ND ND ND ND ND ND ND ND ND
Ethylbenzene ND ND ND ND ND ND ND ND ND ND ND ND ND ND ND ND ND
Isopropylbenzene ND ND ND ND ND ND ND ND ND ND ND ND ND ND ND ND ND
m,p-Xylenes ND ND ND ND ND ND ND ND ND ND ND ND ND ND ND ND ND
n-Butylbenzene ND ND ND ND ND ND 21.0 ND ND ND ND ND ND ND ND ND ND
o-Xylene ND ND ND ND ND ND ND ND ND ND ND ND ND ND ND ND ND
para-Isopropyl Toluene ND ND ND ND ND ND 9.4 ND ND ND ND ND ND ND ND ND ND
Propylbenzene ND ND ND ND ND ND ND ND ND ND ND ND ND ND ND ND ND
sec-Butylbenzene ND ND ND ND ND ND ND ND ND ND ND ND ND ND ND ND ND
Styrene ND ND ND ND ND ND ND ND ND ND ND ND ND ND ND ND ND
tert-Butylbenzene ND ND ND ND ND ND ND ND ND ND ND ND ND ND ND ND ND
Toluene ND ND ND ND ND ND ND ND ND ND ND ND ND ND ND ND ND Note: results reported in mg/Kg, Sed: sediment; ND=not detected; N/A= insufficient sample to complete the analysis.

Figures

19 March 6, 2012 UC Berkeley Stanley Hall Diesel Spill - Natural Resource Damage Assessment December 2011 Water and Sediment Sampling Summary
www.cardno.com
Figure 1 Map of Study Site

20 March 6, 2012 UC Berkeley Stanley Hall Diesel Spill - Natural Resource Damage Assessment December 2011 Water and Sediment Sampling Summary
www.cardno.com
Figure 2 Sampling Locations along Strawberry Creek on the UC Berkeley Campus

21 March 6, 2012 UC Berkeley Stanley Hall Diesel Spill - Natural Resource Damage Assessment December 2011 Water and Sediment Sampling Summary
www.cardno.com
Figure 3 Sampling Locations in Brickyard Cove

22 March 6, 2012 UC Berkeley Stanley Hall Diesel Spill - Natural Resource Damage Assessment December 2011 Water and Sediment Sampling Summary
www.cardno.com
Figure 4 Sediment and Soil TPH Concentrations and Diagnostic Ratio Values

23 March 6, 2012 UC Berkeley Stanley Hall Diesel Spill - Natural Resource Damage Assessment December 2011 Water and Sediment Sampling Summary
www.cardno.com
Figure 5 FID Chromatogram for Station BK1-1, “New Reference” Station, Left Bank Soil Sample

24 March 6, 2012 UC Berkeley Stanley Hall Diesel Spill - Natural Resource Damage Assessment December 2011 Water and Sediment Sampling Summary
www.cardno.com
Figure 6 FID Chromatogram for Station BK1-1, “New Reference” Station, Sediment Sample

25 March 6, 2012 UC Berkeley Stanley Hall Diesel Spill - Natural Resource Damage Assessment December 2011 Water and Sediment Sampling Summary
www.cardno.com
Figure 7 FID Chromatogram for Station BK1-3, Source/outfall Station, Left Bank Soil Sample

26 March 6, 2012 UC Berkeley Stanley Hall Diesel Spill - Natural Resource Damage Assessment December 2011 Water and Sediment Sampling Summary
www.cardno.com
Figure 8 FID Chromatogram for Station BK1-3, Source/outfall Station, Right Bank Soil Sample

27 March 6, 2012 UC Berkeley Stanley Hall Diesel Spill - Natural Resource Damage Assessment December 2011 Water and Sediment Sampling Summary
www.cardno.com
Figure 9 FID Chromatogram for Station BK1-3, Source/outfall Station, Sediment Sample

28 March 6, 2012 UC Berkeley Stanley Hall Diesel Spill - Natural Resource Damage Assessment December 2011 Water and Sediment Sampling Summary
www.cardno.com
Figure 10 FID Chromatogram for Station BK1-4, VLSB, Water Column Sample

29 March 6, 2012 UC Berkeley Stanley Hall Diesel Spill - Natural Resource Damage Assessment December 2011 Water and Sediment Sampling Summary
www.cardno.com
Figure 11 FID Chromatogram for Station BK1-4, VLSB, Left Bank Soil Sample

30 March 6, 2012 UC Berkeley Stanley Hall Diesel Spill - Natural Resource Damage Assessment December 2011 Water and Sediment Sampling Summary
www.cardno.com
Figure 12 FID Chromatogram for Station BK1-4, VLSB, Sediment Sample
31 March 6, 2012 UC Berkeley Stanley Hall Diesel Spill - Natural Resource Damage Assessment December 2011 Water and Sediment Sampling Summary
www.cardno.com
Figure 13 FID Chromatogram for Station BK1-4, VLSB, Right Bank Soil Sample

32 March 6, 2012 UC Berkeley Stanley Hall Diesel Spill - Natural Resource Damage Assessment December 2011 Water and Sediment Sampling Summary
www.cardno.com
Figure 14 FID Chromatogram for Station BK1-5, Oxford Culvert, Water Sample

33 March 6, 2012 UC Berkeley Stanley Hall Diesel Spill - Natural Resource Damage Assessment December 2011 Water and Sediment Sampling Summary
www.cardno.com
Figure 15 FID Chromatogram for Station BK1-5, Oxford Culvert, Left Bank Soil Sample

34 March 6, 2012 UC Berkeley Stanley Hall Diesel Spill - Natural Resource Damage Assessment December 2011 Water and Sediment Sampling Summary
www.cardno.com
Figure 16 FID Chromatogram for Station BK1-5, Oxford Culvert, Right Bank Soil Sample

35 March 6, 2012 UC Berkeley Stanley Hall Diesel Spill - Natural Resource Damage Assessment December 2011 Water and Sediment Sampling Summary
www.cardno.com
Figure 17 FID Chromatogram for Station BK1-5, Oxford Culvert, Sediment Sample

36 March 6, 2012 UC Berkeley Stanley Hall Diesel Spill - Natural Resource Damage Assessment December 2011 Water and Sediment Sampling Summary
www.cardno.com
Figure 18 FID Chromatogram for Station BK1-12, Brickyard Cove inside First Boom, Left Bank Sediment/Soil Sample

37 March 6, 2012 UC Berkeley Stanley Hall Diesel Spill - Natural Resource Damage Assessment December 2011 Water and Sediment Sampling Summary
www.cardno.com
Figure 19 FID Chromatogram for Station BK1-13, Brickyard Cove inside First Boom, Right Bank Sediment/Soil Sample

38 March 6, 2012 UC Berkeley Stanley Hall Diesel Spill - Natural Resource Damage Assessment December 2011 Water and Sediment Sampling Summary
www.cardno.com
Figure 20 FID Chromatogram for Station BK1-14, Brickyard Cove outside Boom 2, Left Bank Sediment/Soil Sample

39 March 6, 2012 UC Berkeley Stanley Hall Diesel Spill - Natural Resource Damage Assessment December 2011 Water and Sediment Sampling Summary
www.cardno.com
Figure 21 FID Chromatogram for Station BK1-15, Brickyard Cove in between Booms, Right Bank Sediment/Soil Sample

40 March 6, 2012 UC Berkeley Stanley Hall Diesel Spill - Natural Resource Damage Assessment December 2011 Water and Sediment Sampling Summary
www.cardno.com
Figure 22 FID Chromatogram for Station BK1-16 outside Last Boom, Brickyard Cove, Left Bank Sediment/Soil Sample
41 March 6, 2012 UC Berkeley Stanley Hall Diesel Spill - Natural Resource Damage Assessment December 2011 Water and Sediment Sampling Summary
www.cardno.com
Figure 23 FID Chromatogram for Station BK1-17 outside Last Boom, Brickyard Cove, Right Bank Sediment/Soil Sample
(same location as CDFG sediment sample)

Photos

43 March 6, 2012 UC Berkeley Stanley Hall Diesel Spill - Natural Resource Damage Assessment December 2011 Water and Sediment Sampling Summary
www.cardno.com
BK1-1 Sediment Sample Site
BK1-3 Water Sample Location at Outfall near Stanley Hall. BK 1-2 is Located Immediately Upstream.

44 March 6, 2012 UC Berkeley Stanley Hall Diesel Spill - Natural Resource Damage Assessment December 2011 Water and Sediment Sampling Summary
www.cardno.com
BK1-4 Water Sample Location near the Valley Life Sciences Building
BK1-5 Water Sample Location upstream of Oxford Culvert

45 March 6, 2012 UC Berkeley Stanley Hall Diesel Spill - Natural Resource Damage Assessment December 2011 Water and Sediment Sampling Summary
www.cardno.com
Looking from Left Bank of Brickyard Cove Toward Strawberry Creek Outflow (BK1-9)
BK 1-9 (Strawberry Creek Outlflow), BK1-10 (Sediment Sample Location in the Center of Channel), BK1-11 Right Bank Sediment Sample Location Across Channel, and BK1-12 Left Bank Sediment Sample Location.

46 March 6, 2012 UC Berkeley Stanley Hall Diesel Spill - Natural Resource Damage Assessment December 2011 Water and Sediment Sampling Summary
www.cardno.com
BK1-14 Bank Sediment Sample Location
Looking at BK1-15 from BK1-14, Inside the Boom.

47 March 6, 2012 UC Berkeley Stanley Hall Diesel Spill - Natural Resource Damage Assessment December 2011 Water and Sediment Sampling Summary
www.cardno.com
BK1-16 (Outside the Boom) Viewed from BK1-14 (Inside the Boom).
BK 1-17 Viewed from across Brickyard Cove at BK1-16