technical informationinfohouse.p2ric.org/ref/19/18812.pdf · learning from experiences with...
TRANSCRIPT

TECHNICALINFORMATION
n
Part of the Efficiency andAlternative Energy Program
Un élément du Programme del'efficacité énergétique et desénergies de remplacement

DISCLAIMER
Although every effort has been made to ensure the accuracy of all infor- mation contained in this document, the Department of Natural Resou~er is not responsible for the clccumcy of such information and does not assume any liability with respect to any damage or loss incurred as a result of the use made of the information contained here- in. This document is provided for information purposes only.
M27-Ol- 150E
u
0 u F4
L
w
w
z
TABLE OF CONTENTS
TECHNICAL BIBLIOGRAPHY
TECHNICAL FACT SHEETS
BUILDING SYSTEMS * The Air Barrier - One Of The Most Critical Elements
In The Building Envelope * Cogeneration Technology * Energy Management & Control Systems * Utility Rates & Billing Practices * Ventilation Systems
1 7
11 15 21
HEATING AND COOLING SYSTEMS
* Cooling Systems 25 * Heating Systems 31 - Heating, Ventilation &Air-Conditioning Systems 35 * Thermal Storage Technology 41 - Water Loop Heat Pump 45
MOTORS
* Adjustable Speed Drives * Energy-Effkient Motors
49 53
WINDOWS AND LIGHTING
* Advanced Windows 57 - Ballasts For Fluorescent Lamps 61 * Compact Fluorescent Lamps 65 * Exit Signs 69 . Fluorescent Lamps 73 * Fluorescent Reflector Fixtures 77 * High-Intensity Discharge Lamps 81 - Occupancy sensors 85
i

TECHNICAL BIBLIOGRAPHY
The following is a brief guide to obtaining information on energy efficiency technologies. It is listed alphabetically by topic. While not a complete bibliography, it
is designed to provide an introduction to the relevant technologies and to identify areas for further research. A list of useful organizations is also included.
BUILDING ENVELOPE Consiglio, G.C., et al. Roofs that Work (Documentation fiwn Building Science Insight‘89), Ottawa: Institute for Research in Construction, National Research Council of Canada,
1989.
National Research Council of Canada. Window Pelformance and New Technology (Proceedings of Building Science Insight ‘88). Ottawa: institute for Research in
Construction, National Research Council of Canada, 1988.
Quirouette, R.L., et al. An Air Barrier for the Building Envelope (Proceedings of
Building Science Insight ‘86). Ottawa: Institute for Research in Construction, National
Research Council of Canada. 1989.
Environment Canada, Code of Practice for the Reducrion of Chlorofluorocarbon
Emissions from Refrigeration ei Air-Conditioning Systems. Ottawa: Environment Canada, 199 1,
Fischer, S. “Energy Use Impact of CFC Alternatives,“. Enerw Enaineerine, vo1.88,no.3,
1991,pp.6-21.
Siebert, B. “Containing CFC Refrigerants the Conversion to New Refrigerants,“,
Energy Eneineering, vol. 88, no. 3, 1991, pp 28-33.
U.S. Environmental Protection Agency. EPA Guide to CFC Planning, Building
Operating Management [vol. 40, no. 7 1, Milwaukee: Trade Press Publishing Corp., July 1993.
American Society of Heating, Refrigerating and Air-Conditioning Engineers, Inc.
CFCs: Time of Transition, ASHRAE, 1989.
Snelson, K. CPC AIternativrs for Building Chiller Systems. Ottawa: Cold Regions
Laboratory, Institute for Mechanical Engineering, National Research Council of Canada, 1992.
TECHNICAL BIMKXXAPHY i
COCENERATION Ontario Ministry of Energy. Cogeneration Sourcebook (Prepared by McLaren Engineers Inc.), Toronto, 1988.
Jennekens, M. Learning from Experiences with Small-Scale Cogeneration (CADDET Analysis Series No. I), The Netherlands: Centre for Analysis and Dissemination of
Demonstrated Energy Technologies (CADDET), 1989.
Morofsky, E. Microcogeneration Assessment Guide for Federally-Owned Buildings,
Ottawa: Architectural and Engineering Services, Public Works Canada, 1993.
ELECTRIC MOTORS AND DRIVES Ryan, M.C. & Okrasa, R. Adjustable Speed Drive Reference Guide, 2nd Edition (Product
Knowledge Reference Guide Series). Toronto: Ontario Hydro, 1991.
Dederer, D.H., Motors Reference Guide, 2nd Edition (Product Knowledge Reference Guide Series), Toronto, Ontario, 1990: Ontario Hydro, 1990.
Nadel, S. et al. Energy-Efficient Motor Systems: A Handbook on Technology, Programs and Policy Opportunities, Washington: American Council for an Energy-Efficient
Economy, 199 1,
Jordan, 1-I. E. Energy Efficient Electric Motors and Their Application, Toronto: Van
Nostrand Reingold Company, 1983.
Snell, Robert L. “Specifying Efficient Motors for New and Retrofit Projects”, Enerw Eneineering, vol 87, no 4:23-29, 1990.
Persson, J. E., Investigating Adjustable Speed Drives in Commercial and Industrial
Applications (prepared by H.A. Simons for the Canadian Electrical Association), Project No. 131U293, 19X3.
Saskatchewan Research Council. Survey ofCommercial andIndustrial Adjustable Speed
Drive Owner Experience (Prepared for the Canadian Electrical Association), Project No. CEA8923U736,1991.
Lovins, A.B. The St&r of the Art: Drivepower, Snowmass. Colorado, 1989:
COMPETITEK/Rocky Mountain Institute.
ii TECHNICAL BIBXXXAPHY

ENERGY MANAGEMENT AND CONTROL SYSTEMS Made, G. Energy Management Control Systems Reference Guide, 2ndEdition (Product
Knowledge Reference Guide Series). Toronto: Ontario Hydra, 1989.
Piette, M. A. Learning from Experiences with Controls to Reduce Electrical Peak
Demands in Commercial Buildings. CADDET Analysis Series No. 7, 1991.
Di Giandomenico, R. & Carlson, R.A. Understanding Building Automation Systems,
R.S. Means Company, Inc., 1991.
Levenhagen, J.I., & Spethmann, D.H. HVAC Controls and Systems. McGraw-Hill.
Chan, K.M. Status Report on Intelligent Buildings. Canadian Automated Buildings Association Information Series No. 93/3, Ottawa 1993.
Issues related to Intelligent Buildings and Electrical Control Systems, Construction Specifier, vol. 46, no.1, January 1993.
Langley, B.C. Control Systemsfor Air Conditioning and Refrigeration. American Society of Heating, Refrigerating and Air-Conditioning Engineers, Inc., 1985 and DDC and
Building Automation Systems, ASHRAE Technical Data Bulletin, Vo1.5, No.5, 1989.
Sander, D. M. A Review of Energy Management and Control Systems Installations
(prepared for Public Works Canada by the Institute for Research in Construction, National Research Council of Canada), 19X7.
ENERGY MANAGEMENT & TECNNOLOOIES Ontario Hydra. Commercial Electric Energy Manual Fundamentals. Toronto,
Ontario, 1991.
Claman, V. flow to Reduce Your Energy Costs, 2nd Edition, Boston, Massachesetts:
Alberta Power Ltd., 199 1.
Ontario Hydra. Commercial Electric Energy Manual Applications. Toronto, Ontario, 1987.
Turner, W. C. Energy Management Handbook, 2nd Edition, Lilburn: Fairmont Press, Inc., 1993.
Thumann, A. & Mehta, D.P. Handbook of Energy Engineering, 2nd Edition, Lilburn:
Fairmont Press, Inc., 1991.
DC Hydra. Guides to Energy Management (GEM) Commercial Binder (containing
over 50 technical sheets on commercial applications including heating, insulation, lighting, motors and wiring, together with service and case histories of efficient energy
use). Vancouver: Power Smart Inc., 1993.
. . . TECHNICAL BIBlICGRAPHY III

Nadel, S. & G&r, H. Eficiency Standards for Lamps, Motors, Commercial HVAC
Equipment and Showerheads: Recommendations for State Action, Berkeley: American Council for an Energy Efficient Economy, 1991.
Energy, Mines and Resources Canada, Energy Management Series for Industry,
Commerce and Znstititiorrs (a series of 24 manuals of background theory, general
information on proven techniques and technologies and case studies available from CANMET), Ottawa: Minister of Supply and Services Canada, 1985.
Abel, E., et al. Learning ~from Experiences with Energy Eficient Retrofitting of Office
Buildings (CADDET Analyses Series No. 8). The Netherlands: Centre for Analysis and Dissemination of Demonstrated Energy Technologies (CADDET), 1992.
American Society of Heating, Refrigerating and Air-Conditioning Engineers, Inc. Energy E/ficient Design qf New Buildings Except New Low-Rise Residential Buildings,
.ASHRAE/IES Standard 90.1, 1989.
HEAT RECOVERY AND STORAGE SYSTEMS Ontario Hydro. Thermal Cool Storage Reference Guide, 2nd Edition. Product Knowledge Reference Guide Series, Toronto: Ontario Hydro, 1990.
Wendland, R. D. “Commercial Cool Storage,” Energy Engineerin& ~01.87, no.6: 18-22,
1990.
Wylie, D. “Evaluating and Selecting Thermal Energy Storage,” Enerw Engineering,
~01.87, no.6 1990: pp. 6-22.
Goldstick, R., Principles sf Waste Heat Recovery. Atlanta: Fairmont Press, 1986.
Ontario Hydro, Performance Optimization Field Handbook: Fan, Pump and Blower Systems. Be A Power Saver, 1992.
Piette, M.A., Learning from Experiences with Thermal Storage: Managing Electrical Loads in Buildings (CADDET Analyses Series No. 4), The Netherlands, 1990: Centre
for Analysis and Dissemination of Demonstrated Energy Technologies (CADDET), 1992.
HEAT PUMPS Canadian Electrical Association, Engineering Design and Installation of Ground Source Heat Pumps Volumes 1 and 2, CEA Project # CEA 827U675, 1990.
R&y, J. S., “Applications of Closed Loop Water Source Heat Pumps for Space Conditioning in Commercial Buildings,” Enerw Eruzineering, vol. 87, no. 5, 1990,
pp.6.11.
iV TECHNICAL BIL1lIoGRAPHY
HVAC American Society of Heating, Refrigerating and Air-Conditioning Engineers, Inc.,
1993 ASHRAE Handbook Fundamentals: ASHRAE, 1993.
American Society of Heating, Refrigerating and Air-Conditioning Engineers, Inc.,
1992 ASHRAE Handbook HVAC Systems and Equipment: ASHRAE, 1992.
American Society of Heating, Refrigerating and Air-Conditioning Engineers, Inc. 1991 ASHRAE Handbook HVACApplications: ASHRAE, 1991.
Vandini, M. “The HVAC System Choice With Cool Storage,” Enerw Eneineering, vol.
87, no. 6, 1990, pp. 34-45.
Hoshide, R. K. “New HVAC Technologies for Energy Efficiency,” Enerw Eneineering, Vo1.89, No.5, 1992, pp.23-37.
Newman, J. L., “HVAC System Performance and Indoor Air Quality,” Enerw Engineering, ~01.88, “0.3, 1991, pp. 61-79.
McQuiston, EC. & Parker, J.D. Heating, Ventilating and Air Conditioning, 3rd Edition.
John Wiley & Sons. 1988.
Sauer, H.J. & Howell, R.H., Principals of Heating, Ventilation and Air Conditioning.
American Society of Heating, Refrigerating and Air-Conditioning Engineers, Inc.,
1990.
Abel, E. et al. “Learning from Experiences with New Technologies for Heating and
Cooling Supply in Office Buildings”. CADDET An&es Series No. 3, The Netherlands: Centre for Analysis and Dissemination of Demonstrated Energy Technologies
(CADDET), 1990.
Houghton, D.J. et al, The State of the Art: Space Cooling and Air Handling, Snowmass, Colorado: COMPETITEK/Rocky Mountain Institute, 1992.
Illuminating Engineering Society of North America (IESNA). Lighting Handbook
Reference 6 Application 8th Edition. New York: IESNA, 1993.
Economopoulos, O., & Chan K. Lighting Reference Guide, 4th Edition, Product
Knowledge Reference Guide Series, Toronto: Ontario Hydra, 1990.
Aronsson, S. and Nilsson, I? Learning from Experiences with Energy Eficient Lighting in Commercial Buildings, CADDET Analyses Series No. 6, The Netherlands: Centre for
Analysis and Dissemination of Demonstrated Energy Technologies (CADDET), 1991.
TECHNICAL BIBUCXXAPHY V

Lindsey, J. “How to Evaluate Lighting Retrofit Options,” Enerev Eneineering, Vo1.89,
No.2, 1992, pp.36.50.
Thumann, A. Lighting .@ciency Applications, 2nd Edition, Lilburn: The Fairmont
Press, Inc., 1992.
Watson, L. Lightiing Design Handbook, New York, N.Y., 1991: McGraw-Hill, 1991.
National Lighting Product Information Program, Specifier Reports (reports on
electronic ballasts, specular reflectors, power reducing devices, compact fluorescent
lamps and occupancy sensors). Troy: Lighting Research Center, Rensselaer
Polytechnic Institute, 1993.
MacDonald, D.J. and R.E. Tourangeau, Identification of Fluorescent Lamp Ballasts
Containing PCBs. Revised, prepared for the Commercial Chemical Branch, Environment Canada, Ottawa: Mi,nistry of Supply and Services Canada, 1991.
Lovins, A.B. & Sardinsky, R.S. State of the Art Lighting, Snowmass: CompetiteklRocky
Mountain Institute, 1990.
ORGANIZATIONS
Canadian Automated Buildings Association (CABA) 1200 Montreal Road, Building M-20 Ottawa, Ontario KIA OR6 tel: (613) 990.7407 fax: (613) 954.5984
Canadian Earth Energy Association 2978 Barlow Cr., RR #l Dunrobin, Ontario KOA IT0 tel: (613) 832.1854 fax: (613) 832.3308
Ontario Hydro Product Information Technical Services and Development Department 700 University Ave., C25-D6 Toronto, Ontario M5G 1X6 tel: (416) 506.3467
Vi TECHNICAL BI6LICXXAPHY

Client Services Institute for Research in Construction National Research Council Ottawa, Ontario KIA OR6 tel: (613) 993-3774 fax: (613) 952.7671
Centre for Analysis and Dissemination of Demonstrated Energy Technologies (CADDET) Canada Industrial, Commercial and institutional Programs Natural Resources Canada 580 Booth Street, 18’h Floor Ottawa, Ontario KlA OE4 tel: (613) 996-8131 fax: (613) 952.8169
Power Smart Inc. 540-475 West Georgia Street Vancouver, B.C. V6B 4M9 tel: (604) 688-4637 fax: (604) 688.7342
American Society of Heating, Refrigerating and Air-Conditioning Engineers, Inc. 179 1 Tullie Circle NE. Atlanta, Ga. 30329.2305 U.S.A. tel: (404) 636.8400 fax: (404) 321.5478
Illuminating Engineering Society of North America (IESNA) 120 Wall Street, 17th Floor New York, NY 10005 U.S.A. tel: (212) 705.7925 fax: (212) 705.7641
Canadian Electrical Association Product Sales Department 1 Westmount Square Suite 1600 Montreal, Quebec H3Z 2P9 tel: (514) 937.6181, ext. 317 fax: (514) 937.6498
TECHNICAL BIBLICGRAPHY Vii
American Council for an Energy Efficient Economy 2140 Shattuck Anenue, Suite 202 Berkeley, CA 947042 U.S.A. te1: (510) 549.9914 fax: (510) 549-9984
National Lighting Product Information Program Publications Lighting Research Center Rensselaer Polytechnic Institute Troy, NY I2 180-3590 U.S.A. tel: (518) 276.8716 fax: (5 18) 276. 2999
Construction Specification Institute 1601 Madison Street Alexandria, VA 22314.1791 U.S.A. tel: (703)684-0300 fax: (703) 684.0465
Library and Documentation Services Division Policy, Planning and Services Branch Mineral and Energy Technology Sector Natural Resources Canada 562 Booth Street Ottawa, Ontario KlA OE4 tel: (613) 995.4059 fax: (613) 952.2587
COMPETITEK/Rocky Mountain Institute 1739 Snowmass Creek Road Snowmass. Colorado 81654.9199 U.S.A. tel: (303) 927.3128
fax: (303) 927-4178
Architectural and Engineering Services Documentation Centre Public Works Canada Sir Charles Tupper Building Ottawa, Ontario KlA OM2 tel: (613) 736.2146 fax: (613) 736.2826
. . . VIII TECHNICAL BMICGRAPHY

THE AIR BARRIER - ONFi OF THE MOST CRITICAL ELEMENTS IN THE BUILDING ENVELOPE
he wndows, doors, walls, and roof all make up the building envelope that separates the T. .’ mdoor environment from the outdoors. Although the building envelope serves many
purposes, one of its most important functions is to reduce the air leakage in the building. Air leakage not only has a large impact on the energy and maintenance costs in a building, but it can also affect the indoor air quality and the occupants’ thermal comfort.
This fact sheet outlines the importance of reducing the air leakage in a building. The general causes for air leakage in a building and the ways of reducing it are described. Although good initial design and construction of an air barrier are the best ways of ensuring low air leakage in a building, it is possible to improve the air barrier in existing buildings. Some methods for identifying air barrier problems are listed along with examples of some building envelope improvements.
WHY REDUCE THE AIR LEAKADE IN A BUILDIND?
The building envelope has many functions. It provides strength and rigidity while providing a barrier to tire, solar radiation, noise, heat transfer, water, vapor and air leakage. Reducing the air leakage is one of the most critical elements of a building envelope, since it affects:
W the energy costs to heat and cool the building;
n the costs of maintaining the building envelope;
W the indoor thermal comfort for occupants; and
n the indoor air quality.
Air leakage can have a large impact on the energy costs for both heating and cooling a building. In the winter, exfiltration (air leakage out of the building) is like throwing money right out of the building. The warm air lost to the outdoors must be replaced with cold air which has to be heated to room temperature. Assuming that the air has to be heated from 0°C to 2O”C, 24 kilowatts of power would be required for every 1000 litres per second (L/s) of air exfiltrated. Over four months, this 1000 L/s of air leakage would total approximately

70,000 kilowatt-hours of wasted energy, not including the additional energy required to humidify the cold, dry outdoor air. Similarly, in the summer air leakage increases cooling costs by increasing the energy required to cool and dehumidify the air being delivered to the building.
As will be described later, air leakage rates are often highest when the outdoor temperatures are coldest and the heating loads arc already at their highest. If the heating equipment is electrically powered, air leakage will push peak demands for electricity even higher. Electric utilities charge commercial customers heavily for peak electricity demands. A commercial customa will often have to pay for that peak electricity demand not only for that monthly bill, but for the next eleven months. (Refer to the fact sheet on “Utility Rates and Billing Practices” for il complete, explanation of electricity demand charges. 1
2. Maintenance Costs Air is capable of holding a great deal of moisture: one kilogram of air at 2 I “C and 40 per cent relative humidity contains over six grams of water. In the winter, when air leaks out through the building cnvelope, it cools down and is no longer able to hold all of this moisture. If the air cools down to O”C, the maximum amount of water it can hold is four grams for every kilogram of air. In other words, at least two grams of water must be left behind. If this water condenses in the building envelope, it may cause rotting, or meld and mildew growth Water damage will reduce the life of the building materials and result in higher maintenance costs. The best way to avoid water condensation in the building envelope is to reduce the air leakage.
3. Indoor Thermal Comfort In the winter, air leakage may cause cold drafts around the building perimeter. Consequently, occupants may turn up the thermostat, which may cause overheating
elsewhere in the building. As well, air leakage affects the indoor humidity. In the winter, the leakage of cold dry outdoor air reduces the indoor humidity, while in the summer the indoor humidity may be increased.
4. Indoor Air Qualify Contrary to popular belief, a leaky building does not always have good indoor air quality. In fact, air leakage can contribute to poor indoor air quality. Indoor air quality problems are the result of contaminant sources and/or poor ventilation; air leakage rates can contribute to both of these issues. As described earlier, air exfiltration may cause condensation in the walls which leads to mold and mildew growth. If the pressure across the building envelope changes, perhaps due to changes in the wind, air infiltration may draw the molds and mildew into the building, reducing the indoor air quality. As well, many buildings have parking garages attached at their lower levels where, as described later, air infiltration is most likely to occur in the winter. Air infiltration from parking garages can contribute to high levels of carbon dioxide, carbon monoxide and other contaminants. Aside from increasing the indoor air contaminants, air leakage reduces the effectiveness of the ventilation system which is supposed to deliver clean air to the occupants. The uncontrolled air movement caused by air leakage changes the air pressure distribution in the building. The ventilation system’s normal air flow patterns are impeded; thus, dean ventilation air may not reach all parts of the building as intended.
CAUSES OF AIR LEAKAGE In order for air to leak across a building envelope, two things are required: a pressure differential and an air leakage path. Just as heat flows from a high temperature to a low temperature, air flows from a high pressure to a low pressure, but there still has to be a path for the air to follow.
2 THE AIR BARRIER
Three main factors influence the pressure
differential across a building envelope: wind, the mechanical ventilation system and the “stack” effect.
a) Wind Wind induces positive pressure on the windward side of a building and negative pressure on the leeward side. Wind gusts can cause large fluctuations in the pressure difference across a building envelope.
b) Mechanical ventilation system The mechanical ventilation system consists of large supply and exhaust fans. If more air is brought into a building than exhausted, the interior of the building becomes pressurized.
c) Stack aikct In large buildings, the most dominant cause of pressure across the building envelope is the stack effect, whereby warm air being lighter than cold air, rises. In the winter, the warm air inside the building rises relative to the cold outdoor air and causes a positive pressure on the top floors of a building. As a result, warm indoor air exfiltrates from the top floors and cold outdoor air infiltrates on the lower floors. The stack effect is worse in the winter, when there is a large difference between the indoor and outdoor air temperatures, and in tall buildings. One can try to reduce the stack effect by sealing the vertical columns in a building, such as the service ducts for wiring and plumbing.
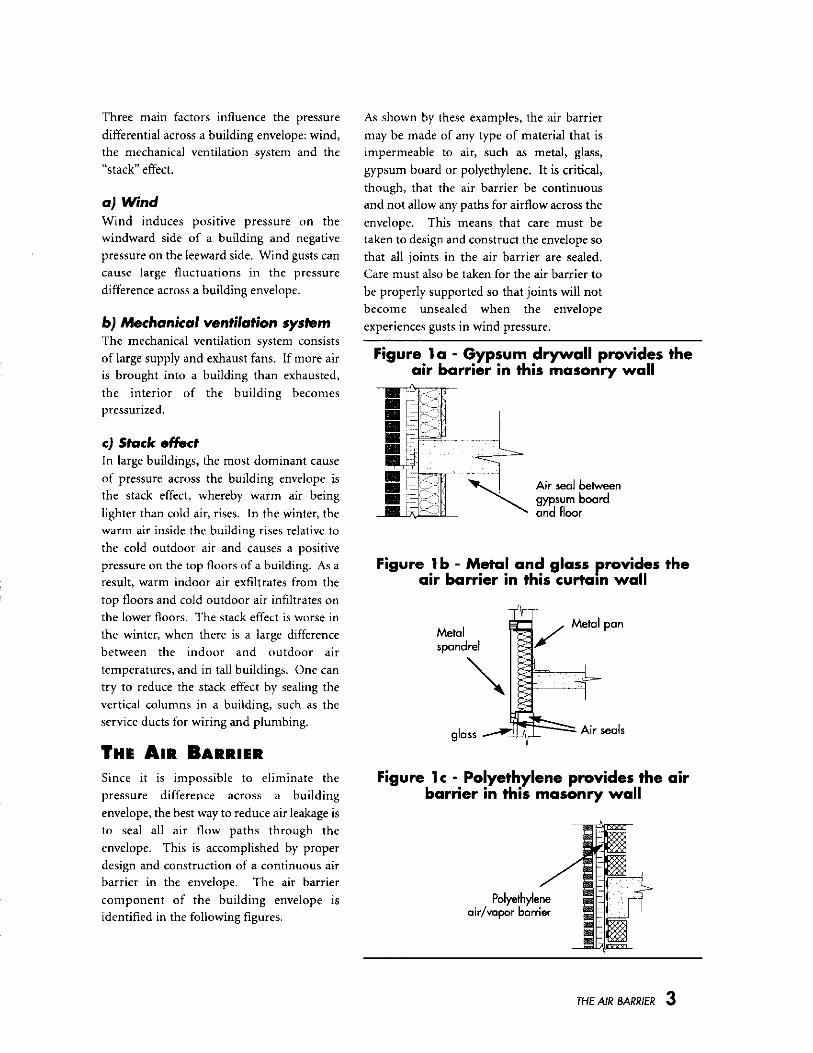
THE AIR BARRIER Since it is impossible to eliminate the pressure difference across a building envelope, the best way to reduce air leakage is to seal all air flow paths through the envelope. This is accomplished by proper design and construction of a continuous air barrier in the envelope. The air barrier component of the building envelope is identified in the following figures.
As shown by these examples, the air barrier may be made of any type of material that is impermeable to air, such as metal, glass,
gypsum board or polyethylene. It is critical, though, that the air barrier be continuous and not allow any paths for airflow across the envelope. This means that care must be taken to design and construct the envelope so that all joints in the air barrier are sealed. Care must also be taken for the air barrier to
be properly supported so that joints will not become unsealed when the envelope experiences gusts in wind pressure.
Figure la - Gypsum drywall provides the air barrier in this masonry wall
Figure 1 b - Metal and glass provides the air barrier in this curtam wall
Figure lc - Polyethylene provides the air barrier in this masonry wall
Polyethyle airlvapor barr
THE AIR BARRlER 3

ADDITION TO “AIR LEAKAOE MEASUREMENTS” SECTION The American Society of Heating, Refrigerating and Air-conditioning Engineers (ASHRAE) handbook classifies building envelopes as tight, average and leaky if air leakage values are 0.5, 1.5 and 3.0 L/s per square meter of exterior wall area at a 75 Pascal pressure differential respectively. In fact, buildings are often much leakier. A study conducted by the National Research Council (NRC) and Public Works and Government Services of Canada (PWCSC) in the seventies measured the air tightness of six Canadian federal office buildings. The buildings were less than ten years old at the time and were 10 to 26 storcys high, with precast concrete panels or metal panels. The buildings were pressurized “sing their supply air system with all of the rc+“rn and exhaust fans turnrd of. Air leakage rates of between 1.73 and 4.85 Llsim2 at 50 Pa were measured, which is about 2.25 and 6.31 L/s/m2 at 75 Pa. (Note: Air leakage rates are not always quoted for the same reference pressure. Be sure to compare measurements at the same pressure difference. As well, remember that the pressure difference actually experienced by the building envelope is continually varying and may be quite different from this reference pressure.)
AIR BARRIER IMPROVEMENTS There are many ways of analysing the air
leakage in a building aside from full building pressurization tests which can be quite expensive. Visual inspection, thermography, smoke pencil tests, partial pressurization tests and monitoring temperatures, humidity and pressures are just a few of the methods used by building envelope specialists to diagnose air leakage problems. Once the problem is understood, it is possible to determine the most appropriate building envelope improvement.
The following is a list of some upgrades that could reduce the air leakage in a building:
n Seal and caulk curtain wall joints;
H Seal and caulk windows and doors;
n Seal window/wall joints, door/wall joints, floor/wall joints, floor/ceiling joints and other joints:
n Seal pipe, duct and cable holes that are through the floors and exterior walls;
n Seal mechanical rooms in the penthouse, where the stack effect is strongest; and
n Redo the exterior cladding of the building.
Figure 2 - Air leakage test results before and after building envelope upgrades in the
NRCPWGSC study
Building
4 THE AIR BARRIER

Building upgrades can reduce the air leakage rates, even in older buildings. For example, five of the six buildings tested by NRC and PWGSC in the seventies underwent various building envelope upgrades. The air- tightness of the buildings were then re- measured in 1991 using the same test procedures. Four out of the five buildings were more airtight the fifth was unchanged and the building that had no envelope upgrades was much leakier.
CONCLUSIONS A good building envelope is critical for maintaining a comfortable work environment
in an energy-efficient manner. Although the building envelope has many functions, it is very important that it has a continuous air, barrier. Many effective methods exist for improving the air barrier even in older buildings.
For further information please contact:
Industrial, Commercial and Institutional Programs, Natural Resources Canada. 580 Booth Street, 18* Floor, Ottawa, Ontario KIA OE4, Fax: (613)947-4121
Changes in Air Leakage Levef.~ of SU Canadian Ofice Buildings, C.Y. Shaw, 1.T. Reardon and M.S. Cheung, ASHRAE Journal, Vol. 35, No. 2, February 1993, PP. 34.36.
Development of Derign Procedures and Guidelines for Reducing Electric Demand by Air Leakage Control in
High-Rise Reridentiai Buifdingr, Scanada Consultants Ltd. and CanAm Building envelope Specialists Inc. for Ontario Hydro and Canada Mortgage and Housing Curporation,August 1991.
Diagnosing Envelope Problems by Field Performance Motritwing, M.D. Lawton, Thermal Perfortnance of the Exterior Envelopes of Bulldings V. Proceedings of the ASHRAEiDOEiBTECC Conference, Clearwater Beach, Florida, December 1992.
Envelope Design Guidelines for Federal Office Buildings: Thermal integrity and Airtightness, A.K. Persily for
the General Services Administration and the U.S. Department of Commerce, National Institute for Standards and Technology, NISTIR 4821, March 1993.
The following organisations also have many excellent Publications on buiiding envelopes:
. Canada Mortgage and Housing Corporation
. Public Works and Government Services of Canada
. National Research Council
THE AIR BARRIER 5

k 0
z w u
0
u
I&
F4
w
COGENERATION TECHNOLOGY
ogeneration is the simultaneous production of electrical and thermal energy
from the same fuel source, making for a more efficient, and economical, USE of
resources than if both forms of energy were produced separately. Cogeneration offers an opportunity to control and reduce energy costs by investing in a highly
efficient power plant.
CO~ENERATION TECNNOLOGY - How IT WORKS The heart of the cogeneration system is the prime mover. The prime mover (a
reciprocating engine or gas turbine engine) consumes fuel which is converted into mechanical energy to drive an electric generator. Most prime movers are inherently
inefficient, since they are only able to convert about 30 per cent of the fuel energy
into useful mechanical energy. The remaining 70 per cent of the fuel energy is wasted as heat in the engine exhaust or through the walls of the prime mover. The
key to cogeneration is its ability to harness this otherwise wasted energy. By using
a heat-recovery system, such as an exhaust heat exchanger, steam or hot water can
be produced and used for other purposes such as space heating or additional power
generation. Included in any cogeneration package is a distribution network for the generated electricity and the steam or hot water. Also required is a control system
to monitor and regulate the whole package.
TYPES OF SYSTEMS
Cogeneration systems are generally characterized by their prime movers. The three
main types of systems applicable to federal facilities are:
n Steam Turbine systems use the energy in high-pressure steam to power a steam turbine, which in turn drives a generator. A high-pressure boiler is
used to generate steam. The turbine is similar to those used in thermal electric generating stations except that steam is allowed to exit the tur-
bine at a pressure high enough for use in space heating.

R Gas Turbine systems use a combus- tion turbine (similar to a jet engine)
to drive a generator. Thermal energy from the hot turbine gases can be
recovered in a heat recovery steam generator to produce steam. This is a
popular choice because natural gas is plentiful and relatively inexpensive.
n Reciprocating Engine systems use internal combustion piston engines
as the prime mover. The generator is
driven directly from the drive shaft
of the engine, and thermal energy
(of a lower temperature than from gas turbines) is recovered from the oil cooler, jacket cooling water and
exhaust gases. Reciprocating engines are generally more suited to produc-
ing hot water rather than steam.
g;ci;Et A C~OENERATI~N
Before adopting a cogeneration system, the candidate facility’s thermal and
electrical loads must be carefully analyzed. The wide range of available
systems allows some flexibility in matching outputs to existing thermal
and electrical loads. Systems are sized by the rated capacity of electrical power
production, yet may differ in the ratio of electricity to thermal energy they
produce (see below).
For example, steam turbines systems yield approximately two to three times
the thermal output of gas turbine units.
The flexibility in sizing offered by the
various options allows the designer to
select a system that operates utilizing the maximum amount of thermal energy.
Electricity Prime Mover Heat Rate (Rhr/kWh) Electrkal Output (kw) and Thermal Reciprocating Engines 10,000 - 25,000 10 - 3,000 Etlergy Gas Turbines 22,000 - 11,000 200 - 5,000
Steam Turbines 50,000 - 30,000 170 - 4,000
8 COGENERATION TECHNOLOGY

This is the single most important
operational objective and is based on the assumption that any excess electrical
capacity can be sold back to the utility, whereas excess thermal capacity must be
dumped and wasted (unless a nearby consumer for the thermal energy can be
found).
Other considerations in adopting, sizing,
and operating a cogeneration system include the following:
w The conventional cost of purchased power.
n The cost of utility-supplied supple-
mental, standby and maintenance power.
w The income from electricity to be sold back to the utility.
m The incremental cost of fuel, opera- tion and maintenance.
The cost of purchasing, installing
and commissioning the system
Administrative costs.
CASE STUDY The National Research Council is
currently in the process of procuring a gas turbine based cogeneration system
for their main campus in Ottawa. The
system, being built at a cost of $6.3 million, will produce up to 4 MW of
electricity and 22,000 pounds of steam per hour. The size of the system was
determined by the thermal (steam) requirements of the campus. Financial
savings of $1 million per year are expected.
TNE BENEFITS Clearly, the main benefit of cogeneration is that it offers the potential for achieving substantial
energy cost savings - from 33 per cent to 50 per cent. Cogeneration can also improve the reliability of electrical
energy supply in the form of standby
power. Potential revenues can be
realized from the sale of electricity to
utilities or from surplus steam and hot
water sold to neighbouring users. A
particularly attractive feature of gas turbine cogeneration installations is their “cleaner” emissions (reduction of
NO. and CO3 compared to the
standard fossil-fuel burning stations.
For further information please contact: Industrial, Commercial and Institutional programs, Natural Resources Canada, 5X0 Booth Street, 18” Floor, Ottawa, Ontario KIA OE4, Fax: (613) 947.4121
Reference
COGENEfWTlON TECHNOLOGY 9

0
z w H
u & w
ENERGY MANAGEMENT AND CONTROL SYSTEMS
E nergy Management and Control Systems (EMCS) are rapidly becoming the optimum choice for effective monitoring and control of energy consumption
within commercial buildings. Benefiting from rapid advances in electronic hardware and computer software, the EMCS are a leading candidate for saving
operating costs. EMCS reduce energy waste through automatic control of the building’s energy-using systems. The main trend is towards integrating the EMCS
with a fire/security system and elevator control system to obtain a truly “smart” building automation system.
EMCS COMPONENTS Physically, the EMCS is comprised of the following main building blocks:
n Sensors- sensors and transducers are electronic devices which convert a
parameter (physical measurement such as temperature or humidity) into
an electrical signal. In this form, it can easily be transmitted to a central
processing unit or computer.
n Control Actuators - are devices that can receive instructions from the main computer and adjust some piece of equipment. For example, it
could involve a device that switches a fan motor on and off, changes a damper position, turns lights on/off or adjusts a thermostat.
n Communication Links - signals or messages are exchanged between the
sensor and computer by hard wire, radio frequencies, powerline carrier or fibre optics. Each method of communication must be evaluated sepa-
rately, keeping in mind such things as equipment costs, labour costs for installation, reliability, etc. Communication technologies with high cap-
ital costs may pay for themselves with decreased installation and main@ nance costs.
Canad 11

Communications link
w Computer the central micro-
processor is the heart of the EMCS.
Its capabilities are extensive and are
continually advancing. The software
allows the following main functions
to be performed:
n Monitoring of parameters such
as temperature, humidity,
equipment status, air quality,
equipment health conditions,
and liquid levels or flow rates.
l Programming of equipment to
stop or start automatically as needed - the key is to determine
when and for how long the equipment can remain off with-
out adversely affecting occu-
pants or the building equipment
operations. This will vary for
each building and equipment
configuration.
w Intervention control allows the computer to override a local sys- tern that is performing below
optimum due to some fluctua-
tion or disturbance.
w Alarms can be triggered at pre-
determined levels to alert an
operator of a problem.
. Logging abilities are a critical capability of an EMCS system.
Historical status and perfor- mance of a building’s systems
can be obtained as well the para-
12 ENERGY MANAGEMENT AND CONTROL SYSTEMS

meters of an alarm condition. more easily maintained within a
The EMCS can also provide a preventive maintenance func-
tion whereby work orders, parts lists and maintenance proce-
dures can be printed out as required.
BENEFITS
w Minimires Energy Costs. An EMCS
can minimize and control the elec- trical demand within a building by shifting demand in relation to the
time-of-use energy rates, or by limit- ing or shaving peaks to reduce
demand charges. The two most common load control strategies are
demand limiting and duty cycling.
n With Demand Limiting, the EMCS is
programmed to monitor the electri- cal load and make sure it does not
exceed a predetermined level. This is achieved by having the EMCS shut
down nonessential equipment such as water pumps, ramp and space
heating, and any electrical load that
can be deferred.
n With Duty Cycling, the EMCS cycles
electrical mechanical equipment on and off to save energy while main-
taining comfort conditions. Since
many of a building’s systems are
designed to handle worst-case situa-
tions, the equipment can be turned
off intermittently during lower load
conditions. Some equipment, such
as electrical motors, may have a reduced life when cycled on and off
frequently.
n More Comfortable Environment.
Temperature and humidity can be
desired comfort range, due to more accurate sensors and precise control
zones.
w Reduction in the Number of Operation, Maintenance, and Security Stafi The centrally-based
EMCS can monitor and control the
HVAC, fire protection, security, lighting and elevator systems. It pro-
vides 24 hour observation and can alert an operator to any trouble or
problems.
n Reduction in Unscheduled Down Time. Sophisticated software
options schedule and flag mainte-
nance activities to prevent potential
problems.
w Serves as (1 Teaching Instrument for
building operators and property managers.
Experience with retrofitting of existing buildings shows that installation of a
new or upgrading of an existing EMCS
usually is a measure that offers one of the
shortest payback periods.
For commercial buildings of more than
10,000 square meters, the average cost of the EMCS ranges between $400 to $800 per input or output point. Energy
savings of 20% are typical and payback
periods range from 2 5 years.
An EMCS can be applied to almost all
new or existing commercial buildings for
automating functions previously perfor- med manually. Capital costs for retro-
fitting an EMCS are generally high due to restrictions imposed by existing
controls and HVAC equipment. The
ENERGY MANAGEMENT AND CONTROL SYSTEMS 13

modularity of new sophisticated systems
allows the user to expand the system as
needed. For example, the user could start
off with only HVAC controlling software
and add lighting control at a future date.
The cost of installation of an EMCS is largely based on the number of con- nected points specified (i.e., number of
sensors and actuators). Usually the
EMCS can be specified and installed on a
turnkey basis. The training of building operators is an important part of any
package.
For further information please contact: Industrial, Commercial and Institutional Programs, Natural Resources Canada, 580 Booth Street, 18’ Floor. Ottawa, Ontario KlA OE4, Fax: (613) 947.4121
14 ENERGY MANAGEMENT AND CONTROL SYSTEMS
c-l
0
H
k
F4
I4
z
UTILITY RATES AND BILLING PRACTICES
tlhty rates are the basis for the energy costs in a building. A good understanding of u ” their structure and application provides insight into the energy use and costs required to efficiently operate a facility. This fact sheet describes the various utility charges applicable to a commercial customer.
UTILITY RATES - How ARE THEY SET? Electric utilities have the most diverse rate structures. Commercial customers often have
numerous choices as to which rate structure they fall under. The diversity in rate structures reflect the cost for the utility to build power plants and distribution systems, maintain the system.* and generate the power.
Keeping this in mind, one can see that there are many factors influencing the type of rate structure selected by a utility. The rate structures can be used to influence energy usage patterns, such as offering lower rates at certain times of day. For the most part, utilities set the ratrs on a user-pay basis.
ELECTRIC UTILITY RATES Electric utilities have varied rate structures. A commercial customer can have numerous choices regarding rate structures, due to costs for building power plants and distribution systems, maintaining the systems and using fuel to generate the power.
Demand charge The sire of a power plant helps determine a utility’s costs and is determined by the maximum amount of power’ required at any given time. One can think of power as being like the speed of a car, while the power plant is like the engine of the car. In simplified terms, the bigger the car’s engine, the faster the car can travel; but, the bigger engine costs more.
The customer is charged for the maximum amount of power required during a particular billing period. This is known as a demand charge, or capacity charge, and is typically applied in dollars per kilowatt. (Electricity demand meters usually average the instantaneous power over periods of about fifteen minutes.)

The consumer is also charged for the total amount of energy consumed. While power is the rate at which work is done, energy consumption* is a measure of the amount of work done. Using the car analogy, just as power is like the speed of a car, energy consumption can be compared to the distance travelled by the car. The consumption charge, or energy charge, is typically applied in cents per kilowatt-hour.
I !&wan-hour (kwh) = 1 lalowan x i hour
Power factor adjushnent In addition to demand and consumption charges, commercial customers may be charged a very high penalty if their power factor* drops below a set amount, typically 90 per cent. The lower the power factor, the more power the utility has to generate, though no more demand may be registered on the dcmand meter. Electricity demand meters measure only the resistive power, the part that actually performs work; whereas the utility must deliver sufficient power to account for the total apparent power used by a customer. A special meter is required to measure the total apparent powcr, which is measured in kilovolt-amps.
The power factor penalty is typically applied by adjusting the demand charge to be based on a percentage of the peak kilovolt-amp reading, instead of on the peak demand. For
example, if a utility charges a penalty for a power factor below 90 per cent, the power factor adjustment would be made by
calculating the demand charge using 90 per cent of the peak kilovolt-amp reading, instead of using the peak demand reading.
In addition to the consumption, demand and power factor charges, a customer may be billed for other items such as equipment rentals, transformer charges or metering charges. As well, there is usually some minimum fee to cover administration costs and the costs of providing a distribution system year round, even though the customer may only use electricity for part of the year. Electricity is also subject to the Goods and Services Tax.
Sometimes the rate structure may be as simple as having a single rate for demand and one for consumption. This is known as a flat-rate structure. A more typical rate structure though is the declining block form in which the electricity demand and consumption in a billing period are broken down into blocks, with the lower blocks being charged at higher rates. Examples of a declining rate structure and an electricity bill are given below.
How TO REDUCE YOUR ELECTRICITY BILL
After understanding the different electricity charges, one realizes that there are several means of reducing one’s electricity bill, aside from reducing consumption, without reducing the services provided.
16 UTILITY RATES AND BllUNG PRACTICES
1. Avoid power factor penalties Avoid power factor penalties whenever possible. Whenever power is supplied to an inductive load (such as an electric motor, a transformer, or a fluorescent light) power factor is reduced. Capacitors may be installed to increase the power factor.
2. Reduce demand charges Depending on the type of electric equipment in the building, demand charges may be reduced by load shifting. Load shifting is a method of reducing peak demands by moving some of the electricity demand ahead or delaying it until after the normal peak.
3. Apply for a different rate structures Some utilities offer a variety of different rate structures for commercial customers. “Time-of-Use” rate may be suitable for facilities where much of the electricity is consumed during off-peak hours, since off-peak electrici? is charged at a lower rate. Some utilities also offer an interruptible service in which customers receive electricity at lower rates in return for allowing the utility to temporarily reduce or stop electricity delivery to their facility when the utility as a whale is experiencing peak power demands.
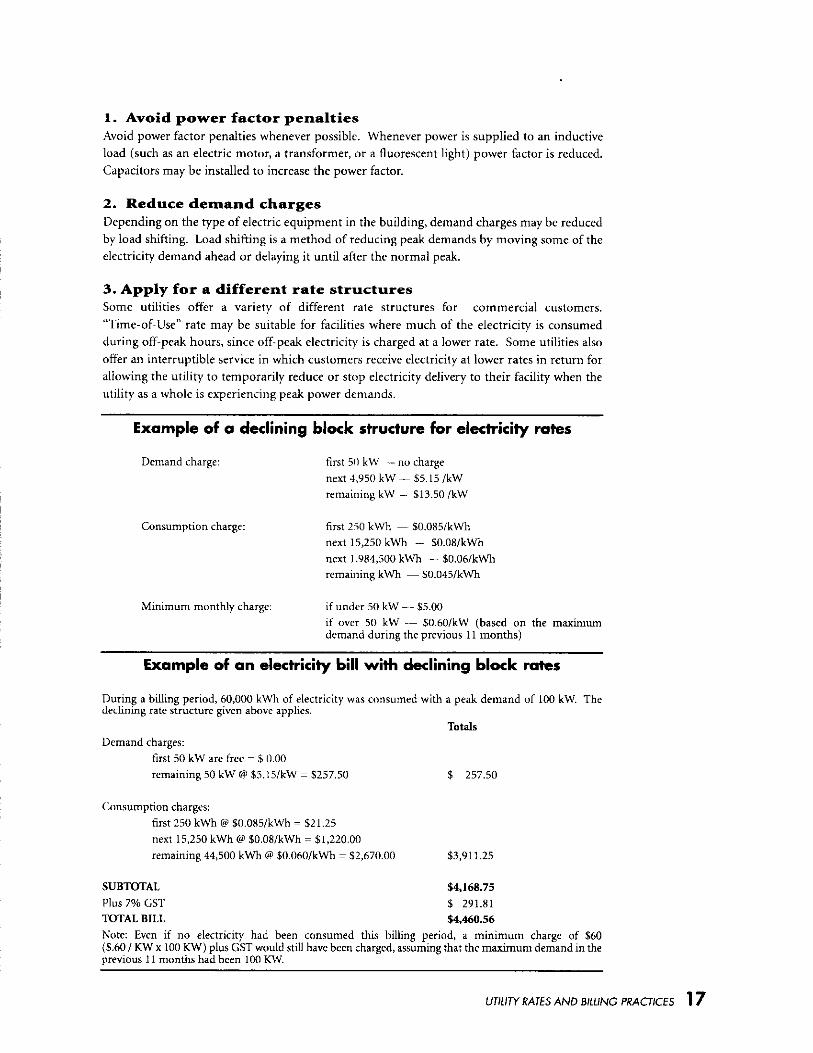
Example of a declining block structure for electricity rates
Demand charge: first 50 kW -no charge next 4,950 kW - 55.15 /kW remaining kW ~-. 513.50 /kW
Consumption charge: first 250 kWh ~~ 50.085ikWh next 15,250 kWh - $“.08/kWh next 1.984,500 kWb - %“.06/kWb remaining kWb ~ 50.045ikWh
Minimum monthly charge: if under 50 kW -~ $5.00 if over 50 kW ~~ 50.6OikW (based on the maximum demand during the previous 11 months)
Example of an electricity bill with declining block rates
During a billing period, 60,000 kWh of electricity was consumed with a peak demand of 100 kW. The declining rate structure given above applies.
TOtiS Demand charges:
first SO kW are free = $11.00 remaining 50 kW t? %S.I5/kW = 5257.50
Consumption charges: first 250 kWh @ $O.O85/kWb = 521.25
$ 257.50
next 15,250 kWh @ 50.08ikWb = 51,220.OO remaining 44,500 kWh 0 %O.OhO/kWb = 52,670.O” 53,911.25
SUBTOTAL 54J68.75 Plus 7% GSI 5 291.81 TOT&L BILL $4.460.56 Note: Even if no electricity had been consumed this billing period, a minimum charge of $60 ($60 / KW x 100 KW) plus GST would still have been charged, assuming that the maximum demand in the previous 11 months had been 100 KW
UTlllN RATES AND BlltlNG PRACTICES 17

.
@AS UTILITY RATES Gas rates are structured like the declining block rates often used for electricity. A customer’s gas consumption is broken down into blocks, with the lower blocks being charged higher rates per unit of gas. Twically gas charges are applied in dollars per cubic meter ($/m3) or dollars per gigajoule (GJ), where a gigajoule is the measure of the energy content of the fuel delivered. Examples of gas rates and a gas bill are shown below. The key to reducing your gas bill is to reduce your gas consumption.
1 gigajoule (GJ) = 109 joules
Example of gas rates
Consumption charge: first 6.0 GJ - $5.571 /GJ next 99.5 GJ - $4.891/GJ remaining GJ - $4.273/GJ
Minimum monthly charges: $15.00 monthly minimum plus GST
Example of a gas bill
During a billing period, a customer consumed 400 GJ of gas. The gas rates given above apply.
Totals Consumption charges:
first 6.0 GJ @ $5.571/GJ = $33.43 next 99.5 GJ @ $4.891/GJ = $486.65 remaining 294.5 GJ @ $4.273/GJ = $1258.40
SUBTOTAL $1,778.48 Plus 7% GST $ 124.49 TOTAL BILL $1,902.97
SWAM, OIL, DIISRL, WATER AND OTHER UTILITY hT8S The utility rates for other fuels and resources, such as steam, oil, diesel or water, are typically charged on the basis of bulk billing units, as shown in Table 1. Not all of these are metered. While steam or water is metered regularly for billing purposes, oil and diesel tanks are usually filled seasonally or at irregular intervals. When a fuel or resource is not regularly metered by the utility, manual maintenance of log books may be required for energy tracking purposes.
18 U77UTy RATES AND BILLING PRACTICES

Table 1 - Typical billing units for other fuels and resources
steam Oil Diesel Water
SI Units Imperial Units
$11000 kg $/IO00 pounds $/cubic meter $/gdlO” $/cubic meter UgdlO” $/cubic meter $/gdl0Il
ENERGY TRACKING USING UTILITY BILLING DATA Utility billing data may be used effectively to track energy use and monitor building energy performance. This may be done manually or through the use of computer software. In either cast, utility usage must be recorded and properly analysed. Analysis must account for billing period variations, as well as variations in weather. It must also be realized that building energy performance will vary, not only due to building system upgrades, but to other changes in the building, such as variations in floor space, equipment loads and schedules, and occupancy loads and schedules.
Many computer packages are available to account for the above variations, while automatically checking for “reasonable” data and verifying utility bill calculations. As well, most software programs include a comprehensive choice of analysis tools including histories, averaging, trend analysis, comparisons, graphing and other reporting capabilities.
“WTY RAE.5 AND BILLING PRACTICES 1 9

u
w
H
WI
F4
VENTILATION SYSTEMS
he purpose of a building’s ventilation system is to ensure good indoor air quality and T .’ to dlstrlbute heat or cold around the building. While a ventilation system can consume a large quantity of energy, if is possible to make the indoor environment a more comfortable and productive work place and to save energy and money at the same time - sometimes by making only minor adjustments or by following simple maintenance procedures to the system. The process of tuning up a building’s ventilation system is sometimes referred to as “recommissioning” the system. This fact sheet provides an overview of how a ventilation system works and some tips for reducing the energy it co”su”l~s.
It is important to note that there are three main types of ventilation air: outdoor air, return
air and supply air. In off& buildings, fresh outdoor air is brought into the building by large fans. Return air is air that has already been delivered to the building. Some return air is exhausted out of the building by another set of large fans or is mixed with outdoor air to produce supply air. The supply air is heated or cooled as necessary and delivered to the building. Fans and dampers control the mixing and distribution of the three types of ventilation air, while f3ters are used to clean the air.
Fiaure 1 - Fans and damoerr control the distribution of outdoor, ret&n and supply air
Damper %?” Damper
OLltdCOr / 8 air
-= rg 8 0 -
Heating
Supply fan coil
Damper wmmK Damper Exhaust air -
&j” -
Exhaust fan
Supply air
Return air
CanadS 21

It is very important that suffCent fresh air be brought into the building to ensure a healthy and productive work environment. Many building codes in Canada refer to the American Society of Heating Refrigeration and Air-conditioning Engineer’s ventilation standard, ASHRAE 69-1989, to define outdoor air requirements. ‘This standard requires at least 10 litres per second per person of outdoor air to be delivered in a normal office. In areas where more air contaminants are generated, higher
ventilation rates may be required and a local ventilation system is recommended.
ENERGY SAVING TIPS
n Air ducts should be insulated and repaired as required in order to reduce distribution losses; it’s not uncommon for as much as 10 to 20 per cent of the air moving through a duct to never make it to the designated outlet.
2. Adjusf he Controls Even without changing the ventilation equipment, energy savings can often be achieved by simply adjusting the control systems.
n During a building’s unoccupied hours, ventilation rates can be reduced. Fans
building prior to its normal hours of
can be put on timers or on an energy management control system to control
occupation.
their hours of operation. However, when setting timers, make sure to allow suffGent time for fans to ventilate the
3. Upgrade Equipment Energy savings can be achieved by making minor changes to equipment. when replacing equipment, consider high efficiency alternatives wherever possible.
There arc many ways to save energy in the
simply operating a system differently or
ventilation systems of a huilding. These
doing some minor maintenance, to more
range from the little to no-cost changes, like
complicated retrofits, such as upgrading pieces of equipment or redesigning a whole system. In either case, the results may be very cost effective and may provide the occupants with a more comfortable working environment. The following is a list of just a few energy saving tips fol- the ventilation system
1. Conduct Regular Maintenance Just like an automobile needs tuning, ventilation equipment requires regular
maintenance procedures to keep it operating as efficiently as possible.
H Filters should be changed and cleaned regularly. Not only will this improve air quality, but it will improve the &iciency of the fans which have to pull or push air through the filters.
W The dampers, which control the amount of outdoor air brought in and the mixing of the return and outdoor air, should be checked to ensure correct operation.
n Belt drives on the equipment should be adjusted and replaced as required.
n Use variable speed drives whenever possible. (Refer to the fact sheet called “Adjustable Speed Drives”.)
n Use ceiling fans where there are very high ceilings.
4. Modify the Systems Although more involved, modifying the systems can often result in substantial energy savings.
n The addition of heat recovery equipment to the ventilation system is becoming more cost- effective, as energy costs and the demand for higher ventilation rates increase. Heat recovery equipment, also known as energy recovery equipment, can save energy by using the heat or cold from the exhaust air to pretreat the incoming air, thereby

reducing the heating or cooling loads on the HVAC equipment. An air-to-air heat exchanger is used to transfer the heat from one air stream to another.
n With the advent of computer technology, energy management control systems are becoming more economical. (Refer to the fact sheet called “Energy Management and Control Systems”.)
CONCLUSIONS The ventilation system of a building can be adjusted and maintained to provide a
comfortable and healthy work environment in an energy-efficient manner. Building operators, property managers and tenants should all work together to improve the operation of ventilation systems. Building operators should receive regular training on “CW technologies and maintenance procedures; tenants should provide constructive feedback to the building maintenance staff; and property managers should stay informed of the issues so that they can make practical decisions regarding system upgrades.
VENTMATION SYSTEMS 23

* 0
z w H
0
H
IA
F4
L4
w
COOLING SYSTEMS
A.
coohng system must continually adjust the amount of heat removed from a building m response to ever-changing heat gains and losses. (Refer to the “Heating, Ventilation
and Air-conditioning’ fact sheet for more details on heat gains and losses in a building.) A cooling system can consume a large amount of energy in an office building. However, often with only minor adjustments or simple maintenance procedures made to the cooling system, it is possible to not only make the indoor environment a more comfortable and productive work place, but at the same time save energy and money. This process of tuning-up a building’s cooling system is sometimes referred to as “recommissioning” the system. This fact sheet provides an overview of the cooling equipment that may be found in an office building and some of the methods for reducing the energy consumed by the system.
COOLING EQUIPMENT The following equipment may be used to remove unwanted heat from a building: chillers, air conditioners, cooling towers, evaporative coolers or heat pumps. For information on heat pumps refer to the fact sheet on “Heating Systems”.
Figure 1 - Cooling equipment that OJXSIWSS on a va compression cycle consists of a refrigerant loop Hnt
.r an
evaporator, a compmssor, a condenser, and an expansion valve
Heat is honsferred to the condenser w&r to be exhausted from the buiding by o cooling
Condenser
Heat from the building is tmnsferred to the evaporator via the chilled water IoOp.
CanadZ 25

Chillers, air conditioners, roof top uds Cooling equipment, such as air conditioners, roof top units, and some types of chillers, works on what is known by mechanical engineers as a “vapour compression cycle’! For these types of equipment, a refrigerant flows around a loop with an evaporator, a compressor, a condenser and an expansion valve. Basically, evaporators and condensers are heat exchangers which transfer heat from one fluid to another. In an evaporator, the refrigerant gains heat from the building and changes from a liquid to a gas. The compressor then pumps the refrigerant to a higher temperature and pressure. The compressor may be electrically powered or driven by a gas-fired engine. In the condenser, heat is released from the refrigerant and the refrigerant condenses back into liquid form. Thr refrigerant then passes through an expansion valve where its prcssurc is reduced and the cycle begins again.
Figure 2 - A cooling tower exhausts the heat from the building
Worm humid air is exhausted.
Cold condenser water returns to building.
Worm condenser wok* is sprayed over fill.
C
Fan pulls air through.
Some types of chillers replace the compressor in the loop with an absorber and a generator. These are known as absorption chillers and they contain a secondary fluid, or absorbent, usually lithium bromide or ammonia, with water as the refrigerant. Absorption chillers use heat as the driving force for generating the cooling. Absorption chillers can be very cost effective when waste heat from the building’s electric generating system is used to power the chiller. This combined system is known as a cogeneration system. (Refer to the fact sheet on “Cogeneration technology’<)
Cooling Towers Cooling towers are located on the exterior of a building, usually on the roof, where the outdoor air helps the heat from the building to dissipate through evaporation. As we all have experienced when stepping out of an outdoor swimming pool, especially on a windy day, evaporating water provides cooling. Cooling towers use this same principle by creating a film or spray with the water to be cooled, and then use either a fan or natural wind currents to evaporate the water. The water then condenses and this cooler water is returned to the building. Cooling towers may be used to dissipate heat from the condenser of cooling equipment or may be run directly to dissipate heat from a chilled water loop.
Evaporative Coolers Evaporative coolers also use evaporation to provide cooling, but this time it’s the ventilation air that is cooled. With direct evaporative cooling, water is sprayed into the incoming outdoor air and as the water evaporates it cools the air. This cool air may be delivered to the building or additionally cooled by other means. With indirect evaporative cooling, a secondary air stream is cooled by direct evaporative cooling and this secondary air stream is used to cool the incoming outdoor air through an air-to-air heat exchanger. Either room exhaust air or
26 COOLING SYSTEMS

outdoor air may be used as the secondary air stream. When exhaust air is used as the secondary air stream, indirect evaporative cooling systems can be used to pretreat the incoming air even without the exhaust air being evaporatively cooled. As such, these systems can also double as heat recovery systems in winter.
Both the humidity and the temperature of the outdoor air are important factors in assessing whether evaporative cooling is economical for a particular climate. With direct evaporative cooling, the outdoor air must be very dry, since its humidity is increased with the evaporation process. The energy savings provided by the evaporative cooling system must be compared to the additional energy required by water pumps and fans.
ENERGY SAVING TIPS There are many ways to save energy with the cooling system of a building. These range hm the little- to no-cost changes, such as operating a system differently or doing some minor maintenance, to more complicated retrofits, such as upgrading pieces of equipment or redesigning the system. In either case, the results may be very cost effective and may provide the occupants with a more comfortable working environment. The following is a list of just a few energy saving tips for the cooling system:
I. Conduct rag&r maintenance lust like an automobile needs regular maintenance, there are many maintenance procedures that should bc conducted regularly on cooling equipment to keep it operating as efficiently as possible.
n Cooling coils should be cleaned regularly, removing any lint and dust build up, as should fans and their inlet SC*ee”S.
n Dampers, which control the amount of outdoor air brought in and the mixing
Figure 3 - Direct or evaporative cooling may be used to cool or precool air
Cwl air is delivered to build- ing or additionally co&d.
Cool air is delivered to building or additionally cc&d.
of return and outdoor air, should be checked to ensure that they are operating correctly.
n Belt drives on the equipment should be adjusted and replaced as required.
n Pipes and ducts should be insulated and repaired as required in order to reduce distribution losses - it’s not uncommon to lose as much as 10 to 20 per cent of the air moving through a duct prior to its reaching its destination.
2. Adjust the controls Even without changing the cooling equipment, energy savings can often be achieved by simply adjusting the control systems.
n Supply air and water temperatures should be adjusted so that fluid is not overcooled.
n During the cooling season, air and water temperatures should be allowed to increase when the building is unoccupied. Be sure to avoid peak demands for electricity when returning to the building’s normal temperatures.
n The chilled water temperature and the condenser water temperature should be
COOUNG SYSTEMS 27
n
optimized. Often energy savings can bc achieved by raising the chilled water temperature and lowering the condenser water temperature; but, this requires careful examination of the whole system.
Free-cooling should be used wherever possible; when the outdoor air is cool enough, use it as a cooling source. Free cooling can be done simply by pulling in outdoor air to be mixed with the return air to achieve the appropriate supply air temperature. This is known as a” economizer cycle. Another way of using free cooling is to use outdoor air for evaporative cooling, as described in the cooling equipment section.
3. Upgrade equipment Energy savings can also be achieved by making minor changes to equipment. When replacing eqlnpment, consider high efticiency equipment wherever possible.
. Use variable speed drives whenever possible. (Refer to the fact sheet called “Adjustable Speed Drives’:)
n Use ceiling fans where there are very high ceilings.
4. Moditj+ the Systems Although more involved, modifying the systems can often result in substantial energy savings.
n The addition of heat recovery equipment to the ventilation system is becoming more cost effective, as energy costs and the demand for higher ventilation rates increase. Heat recovery equipment, better referred to as energy recovery equipment, can save energy by pre-cooling incoming air with exhaust air. Heat recovery equipment will also save energy in the heating season by warming up incoming air with exhaust air.
With the advent of computer technology, energy management control systems are becoming more economical. (Refer to the fact sheet called “Energy Management and Control Systems”.)
As described in the cooling equipment section, sometimes a cooling tower alone can provide suI%cient cooling without the use of chillers. In order to do this, however, some changes may have to be made in the plumbing so that heat can be transferred directly from the chilled water to the cooling tower, through a heat exchanger.
Usually chillers operate much more efficiently at full load, than at part load. Hence, it is preferable to have multiple chillers rather than one large unit.
CONCLUSIONS The cooling system of a building can be adjusted and nlaintained to provide a comfortable and healthy work environment in an energy-efficient manner. Building operators, property managers and tenants should all work together to improve the operation of the cooling system. Building operators should receive regular training on
“eW technologies and maintenance procedures; tenants should provide
constructive feedback to building maintenance staff; and property managers should stay informed of the issues so that they can make practical decisions regarding system upgrades.
28 COOLING SYSTEMS

COOLING SYSTEM.5 29
u
w
H
w
HEATING SYSTEMS
heatmg system must continually adjust the amount of heat being delivered to a A :. buddmg m response to ever-changing heat gains and losses. (Refer to the “Heating,
Ventilation and Air-conditioning” fact sheet for more details on heat gains and losses in a building.) The heating system can consume a large amount of energy in an oftice building. With only minor adjustments or simple maintenance procedures, it is often possible to not only make the indoor environment a more comfortable and productive work place, but to also save energy and money. The process of tuning-up a building’s heating system is sometimes referred to as “recommissioning” the system.
This fact sheet provides an overview on the heating equipment that may be found in an office building and some of the methods for reducing the amount of energy consumed by the svstem.
Heat is delivered to a space in a building through a heat transfer medium, typically air and/or water. The amount of heat transferred is adjusted by varying the temperature
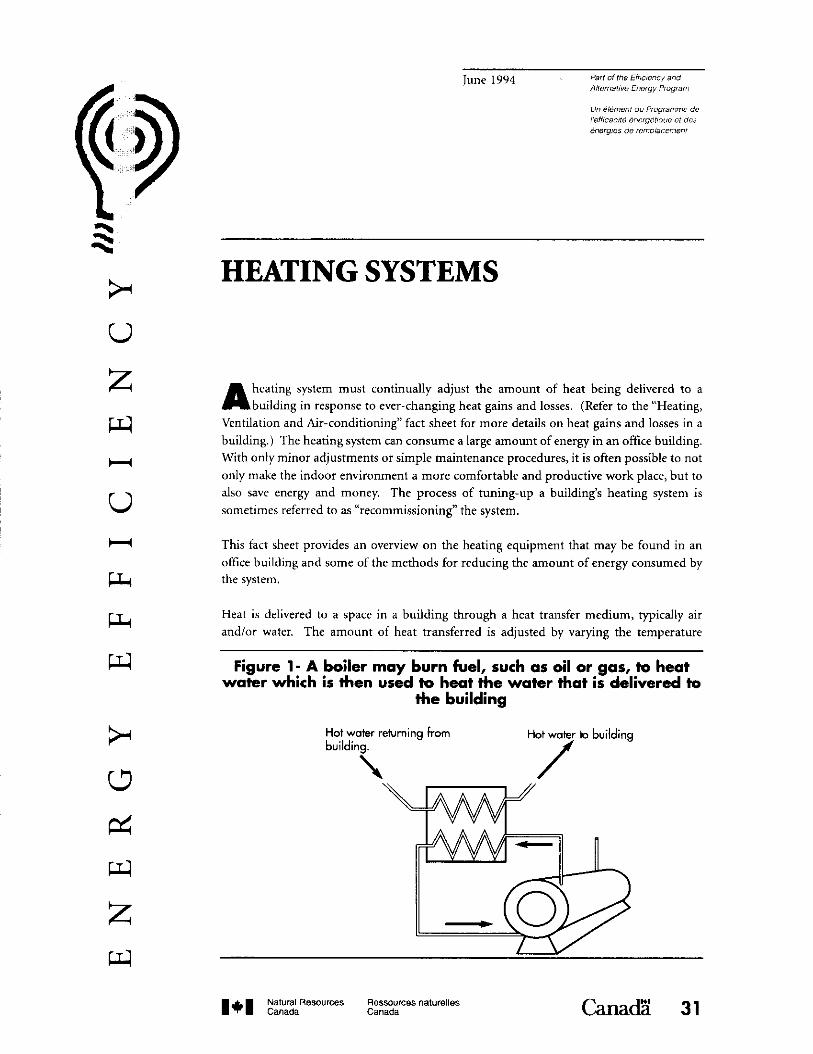
Figure l- A boiler may burn fuel, such as oil or gas, to heat water which is then used to heat the water that is delivered ta
the building
Hot water to building
/
Chad3 31

and/or the amount of water or air being delivered to the space. This is done by adjusting the equipment that generates the heat and/or the equipment that distributes the heat. When water is used to distribute heat, valves and pumps control the flow of the fluid along pipes. Heat may be delivered directly to the space through a radiation system, such as perimeter hot water radiation, or it may be used to warm up the air being delivered to the space. In the latter case, heat exchangers transfer energy from the water to the air.
HEATING EQUIPMENT In a typical office building, boilers, eiectric heating coils, or heat pumps are used to generate the heat.
BOilerI
Boilers burn a fuel, such as oil or gas, or use electric resistance coils to generate heat. The energy is transferred to either hot water or steam. The hot water or steam is then used to heat the air or water being delivered to the building with heat transfer equipment, such as water-to-air or water-to-water heat exchangers. A building may rely upon only
Figure 2 - A heat pump consists of a refrigerant loop with an evapomtor, a compressor, an ex
cp ansion valve and a
con enser.
Heat is honsl&red to the hot water delivered to the boiling
Heat is tronsferrea from CI low-grade heat source to the refrigemnt in the waporotor.
one boiler (although typically there is at least one other for back up) or several which operate in series or in parallel. Sometimes many boilers are contained in one building to provide hot water or steam to several buildings and this is known as a central heating plant.
Electric heafing coils Electric heating coils, such as baseboard heating or electric resistance coils within a ventilation system, arc often used in office buildings due to their low initial cost, ease of installation and ease of individual metering and billing. Although electric heating coils are 100 per cent efficient at the user’s end, energy is lost at the electricity generating station and in the distribution system-and the user is charged for this lost energy. As a result, this form of heating is typically very expensive and other forms of heating would be much more cost effective, except where fuels are relatively very expensive.
Heat pumps Heat pumps typically use electricity to upgrade energy from a source, such as the ground or waste heat from industrial
processes, to a temperature useful for heating a building. Heat pumps operate in the same manner as a refrigerator which uses electricity to pump heat from a cooler temperature to a warmer temperature - which is in the opposite direction from the way that heat would normally travel. Heat pumps are often reversible; that is, they can be used to pump heat into a building and then operated in reverse during the cooling season to pump heat out of the building.
A heat pump consists of a refrigerant which flows around a loop with an evaporator, a compressor, an expansion valve and a condenser. Basically, evaporators and condensers are heat exchangers which transfer heat from one fluid to another. In an evaporator, the refrigerant gains heat as it evaporates and becomes a gas. In a
32 HEATING SYSTEMS

compressor, electricity is typically used t” mechanically pump the refrigerant t” a higher temperature (and pressure), so that the heat will be give” off in the condenser. As heat is released in the condenser, the refrigerant reduces in temperature and condenses back into a liquid form. Then the refrigerant passes through an expansion valve which reduces the pressure and the cycle begins again.
As with boilers, heat pumps transfer the heat to either air or water, which is then distributed around the building. Heat pumps may be located and operated individually throughout the building or they may be connected to a comm”” water loop in series with other main sources of heating and of cooling. This latter configuration is known as a water-loop heat pump system and can be very effZent in buildings where some parts of the building may require cooling (such as the interior of the building
or the south side) while other parts (such as the perimeter “r the north side) rcquirc heating. (Refer to the “Water-loop Heat Pump” fact sheet for m”re details on this type of system.)
ENERGY SAVING TIPS There are many ways to save energy in the heating systems of a building. These range from little- to m-c”st changes, such as operating the system differently or doing some minor maintenance. to m”re complicated retrofits, such as upgrading pieces of equipment or wdesigning a whole system. In either case, the results may be very c”st effective and may provide the occupants with a mtrre comfortable working environment. The following is a list of just a few energy saving tips for heating systems:
1. Conduct regular maintenance Just like an automobile needs regular
maintenance, there are many maintenance procedures that should bc conducted regularly on heating equipment to keep it operating as efficiently as possible
n Heating coils should be cleaned regularly, removing any lint and dust build up.
n Dampers, which control the amount of outdoor air brought in and the mixing of the return and outdoor air, should be checked to ensure that they are operating correctly.
n Belt drives on equipment should be adjusted and replaced as required.
n Pipes and ducts should be insulated and repaired as rrquired, in order t” reduce distribution losses - it’s not uncommon to lose as much as 10 to 20 per cent of the air moving through a duct on the wav t” its destination.
2. Adiust the controls Even without changing the heating equipment, energy savings can often be achieved by simply adjusting the control systems.
n The supply air and water temperatures should be adjusted to reduce the likelihood of overheating the fluid.
w Air and water temperatures should also be reduced during the building’s unoccupied periods. Be sure to avoid peak demands for electricity when returning t” the building’s normal temperatures.
3. Upgmde equipment Energy savings can be achieved by making minor changes t” equipment. when replacing equipment, consider high efficiency equipment wherever possible.
n Use variable speed drives on pumps and fans wherever possible. (Refer to the fact sheet called “Adjustable Speed Drives”.)
W Use ceiling fans where there are very high ceilings.
HEATING SYSTEMS 33

4. Modify the Systems Although more involved, modifying the systems can often result in substantial energy savings.
n The addition of heat recovery equipment to the ventilation system is becoming more cost effective, as energy costs and the demand for higher ventilation rates increase. Heat recovery equipment can save energy by using heat from exhaust air to pre-treat incoming air, thereby reducing heating load. Heat recovery equipment will also save energy in the cooling season, by precooling incoming air with exhaust air.
n With the advent of computer technology, energy managrment control systems are becoming more economical. (Refer to the fact sheet called “Energy Management and Control Systems”.)
n Usually boilers operate much more efticientlyat full load, rather than at part load. Hence, it is preferable to have multiple boilers rather than one large one. As well, in some buildings the domestic hot water (DHW) is heated by the building’s main boiler(s). Although
this may be quite &cient during the heating season, it may mean that at other times of the year a large boiler has to be operated continuously and only at part-load. In this case it is probably more efficient to have a separate boiler for the DHW system so that the large boiler does not have to be operated during the cooling season.
CONCLUSIONS The heating system of a building can be adjusted and maintained to provide a comfortable and healthy work environment in an energy-efficient manner. Building operators, property managers and tenants should all work together to improve the operation of the heating system. Building operators should receive regular training on new technologies and maintenance procedures; tenants should provide constructive feedback to building maintenance staff; and property managers should stay informed of the issues so that they can make practical decisions regarding upgrades to the systems.
34 HEATlNG SYSTEMS

* 0
z w u
0
b-t
HEATING, VENTILATION, AND AIR-CONDITIONING SYSTEMS
T
he heatmg, ventllatlon and au condltlomng (HVAC) systems of a building consist of .‘. ” .- “’ many mter related electr~al and mechanical pieces of equipment working together to
control the temperature, humidity, and ventilation in the building. In Canada, HVAC systems generally consume about 60 per cent of the energy consumed by an office building. With only minor adjustments or simple maintenance procedures to the HVAC systems, it is possible to make the indoor environment a more comfortable and productive work place and also save energy and money. The process of tuning up a building’s HVAC systems is sometimes referred to as “recommissioning” the building.
In order to understand how this can be done, one must first understand how the heating, cooling and ventilation systems in a building work. This fact sheet provides an overview of how heat and moisture are lost and gained in a building; how the heating, cooling and ventilation equipment work; and some general methods for reducing the energy consumed by the HVAC systems.
HEAT GAINS AND LOSSES IN A BUILDING To control the temperature in a building, the heating and cooling systems must respond to the various heat gains and losses in a building, as shown in Figure 1.
Figure 1 - The heat gains and losses in a building
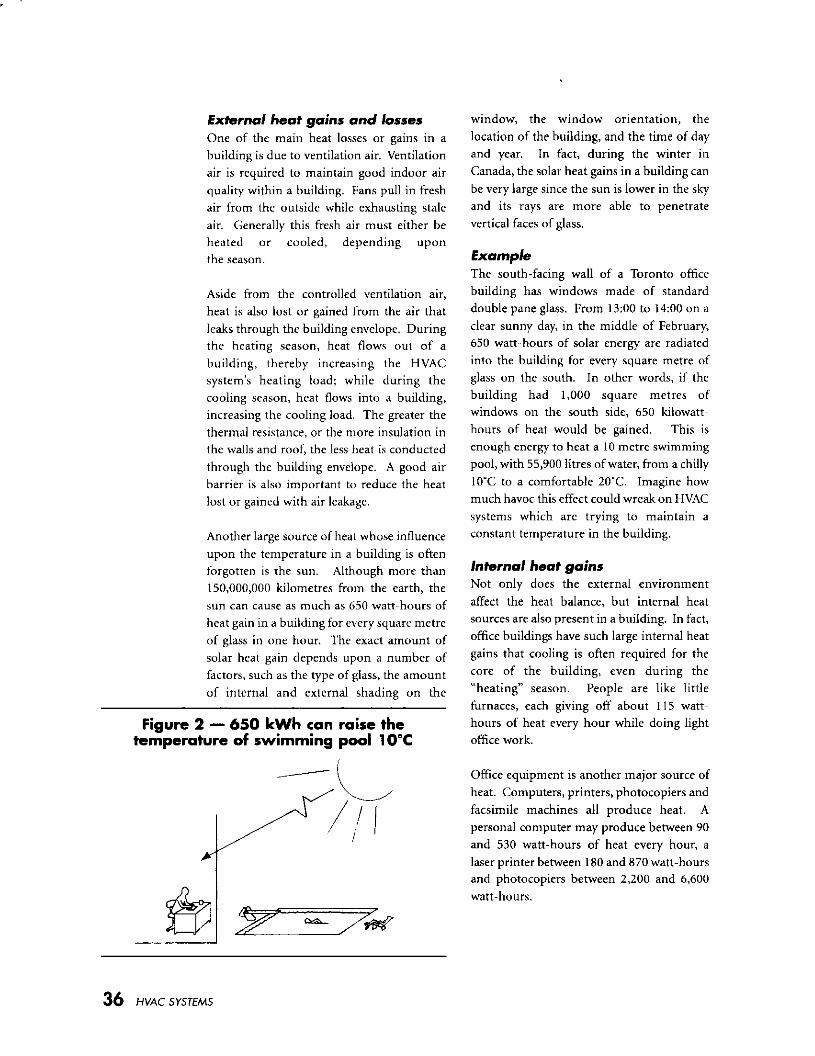
External heaf gains and losses One of the main heat losses or gains in a building is due to ventilation air. Ventilation air is required to maintain good indoor air quality within a building. Fans pull in fresh air from the outside while exhausting stale air. Generally this fresh air must either be heated or cooled, depending upon the season.
Aside from the controlled ventilation air, heat is also lost or gained from the air that leaks through the building envelope. During the hating season, heat flows out of a building, thereby increasing the HVAC system’s heating load; while during the cooling season, heat flows into a building, increasing the cooling load. The greater the thermal resistance, or the more insulation in the walls and roof, the less heat is conducted through the building envelope. A good air barrier is also important to reduce the heat lost or gained with air leakage.
Another large source of heat whose influence upon the temperature in a building is often forgotten is the sun. Although more than 150,000,OOO kilometres from the earth, the sun can cause as much as 650 watt-hours of heat gain in a building for every square metre of glass in one hour. The exact amount of solar heat gain depends upon a number of factors, such as the type of glass, the amount of internal and external shading on the
Figure 2 - 650 kWh can raise the temperature of swimming pool 10°C
/--(
A+ /iI i
window, the window orientation, the location of the building, and the time of day and year. In fact, during the winter in Canada, the solar heat gains in a building can be very large since the sun is lower in the sky and its rays are more able to penetrate vertical faces of glass.
Example The south-facing wall of a Toronto office building has windows made of standard double pane glass. From 13:00 to 14:00 on a clear sunny day, in the middle of February, 650 watt-hours of solar energy are radiated into the building for every square metre of glass on the south. In other words, if the building had 1,000 square metres of windows on the south side, 650 kilowatt- hours of heat would be gained. This is enough energy to heat a 10 metre swimming pool, with 55,900 litres of water, from a chilly IWC to a comfortable 20’C. Imagine how much havoc this effect could wreak on HVAC systems which are trying to maintain a constant temperature in the building.
Internal heat gains Not only does the external environment affect the heat balance, but internal heat sources are also present in a building. In fact, office buildings have such large internal heat gains that cooling is often required for the core of the building, even during the “heating” season. People are like little furnaces, each giving off about 115 watt- hours of heat every hour while doing light office work.
Oftice equipment is another major source of heat. Computers, printers, photocopiers and facsimile machines all produce heat. A personal computer may produce behveen 90 and 530 watt-hours of heat every hour, a laser printer between 180 and 870 watt-hours and photocopiers between 2,200 and 6,600 watt-hours.
36 HVAC SYSTEMS

Lighting is another internal heat source. Nearly 90 per cent of the energy consumed by an incandescent light is converted directly to heat, while even energy-efficient compact fluorescent lamps convert about 30 per cent of the energy that they consume directly to heat
MOISTURE GAINS AND LOSSES IN A BUILDINO The causes for moisture gains and losses in a building are much the same as for heat. The air brought into a building via the ventilation system or through air leakage not only affects heat gain or loss in the building, but also the level of humidity. During the heating season, cold air brought in is often very dry, since colder air cannot hold as much moisture. The air may require humidification to maintain a comfortable and healthy relative humidity - ideally between 40 and 60 per cent. During the cooling season, air brought into the building is often very humid and can make warm air temperatures feel even hotter. People and plants also contribute to the humidity level in a building.
EQUIPMENT The HVAC system must continually adjust the amount of heat being delivered to or removed from the building in response to the ever changing heat sources and losses described above. The heat is delivered to, or removed from, a particular space in the building through a heat transfer medium, typically air and/or water. ‘The amount of heat transferred is adjusted by varying the temperature and/or the amount of water or air being delivered to the space. This is done by adjusting the equipment that generates or dissipates the heat and/or the equipment that distributes the heat, such as fans, pumps, and V&3.
In a typical oftice building, boilers, electric heating coils or heat pumps are used to generate heat; while chillers, air conditioners, cooling towers, evaporative coolers or heat pumps are used to remove unwanted heat.
Figure 3 - Internal heat gains in an office building
115wh. lamps ir’converted to heat
Heat is usually distributed around the building in either air or water. Air can be humidified by spraying water or steam into it. Cooling equipment can remove humidity from the air by reducing its temperature to the point where the water will condense and can then be drained off. Other devices may also be used to remove moisture from the air through the use of absorbent materials, also known as desiccants. Desiccants may be in a solid or liquid form. (The silica gel powder which comes in little packets with electronic equipment is an example of a desiccant.)
Whether air or water is used to deliver (or remove) heat to a space, a ventilation system is required to provide fresh air throughout the building in order to ensure good indoor air quality. Many building codes in Canada reference the American Society of Heating Refrigeration and Air-conditioning Engineers’ ventilation standard, ASHRAE 69.1989, as the ventilation standard. This standard requires that at least 10 Litres of outdoor air per second per person be delivered in a normal office. In areas where more air contaminants are generated, higher ventilation rates may be required and a local ventilation system is recommended. Fans and dampers control the mixing and the distribution of the ventilation air in the air ducts and filters are used to clean the air.
HVAC SYSTEMS 37

When water is involved in the distribution of heat around a building, valves and pumps are used to control the flow of fluid along pipes. Heat or cold may be delivered directly to the space with water through a radiation system, such as perimeter hot water radiation, or it may be used to treat air being delivered to the space. In either case, heat exchangers may be used to transfer the energy from one fluid to another.
ENERGY SAVING TIPS There are many cost effective ways to reduce the amount of energy used by the HVAC systems of a building and to provide the occupants with a more comfortable working environment. These range from little- to no- cost changes, such as operating a system differently or doing some minor maintenance, to more complicated retrofits
such as upgrading equipment or redesigning . a whole system. It is important to note that the best way to save energy with HVAC systems is to first reduce the need for them: that is, reduce all unnecessary heat gains and losses in a building.
W Improve the building envelope. In office buildings this can be done by improving the air barrier by sealing windows and wall joints or by replacing the windows with new window systems which have special coatings to reduce unwanted solar gains. For more information refer to the fact sheets on:
. “The air barrier - one of the most critical elements in the builing envelope” and
. “Advanced windows”
n Replace the lighting with more energy efficient lighting systems. Many people might argue that reducing the heat gains from the lighting systems is ineffective since it will increase the heating costs. The fact is, although lights are not a very efficient way of heating a building; not to mention the fact that they rely on electricity which is typically much more
expensive than the fuel used by the heating equipment. As well, reducing the summer cooling loads usually outweighs the increase in the winter heating loads since the cooling equipment is typically electrically powered and can cause the very expensive high peak demands for electricity. For more information, refer to the fact sheets on:
* “Fluorescent lamps’:
* “Compact fluorescent lamps’:
* “Ballasts for fluorescent lamps’:
* “Occupancy sensors’:
. “High intensity discharge lamps’:
* “Exit signs”,
. “Fluorescent reflector furtures” and
* “Utility rates and billing practices’:
Replace the office equipment with more energy efficient equipment. The same arguments hold as for why it is worthwhile to have energy effZent lighting systems. Remember that office equipment is often left on throughout the whole day, even when it is not being used; that means that most office equipment will operate for fifty two weeks a year at nine hours every week day which works out to more than 2,300 hours a year. That means that reducing the power consumed by office equipment by one kilowatt may result in up to 2,300 kWh of electricity savings not to mention savings in electricity demand.
38 HVAC SYSTEMS

w Improve the HVAC systems. There are many ways to improve the HVAC systems in a building starting with simple maintenance proccdurcs. For m”re information, refer to the fact sheets on:
* “Heating systems’:
* “Ventilation systems’:
* “Cooling systems’:
* “Cogenerafion technology”,
. “Thermal storage technology’:
. “Water loop heat pump’;
* “Energy management and control systems’:
* “Energy efficient motors” and
* “Adjustable speed drives’:
CONCLUSIONS After implementing changes to a building, or whenever there are significant changes to the
heat gains and losses in a building such as occupancy changes, it is important to note that the HVAC equipment should be adjusted accordingly. For example, the flow rates of the air and water being distributed around the building should bc balanced and adjusted.
Although heating, ventilating and air conditioning systems are complicated, inter- related systems, they can be adjusted and maintained in such a manner as to provide a comfortable and healthy work environment in an cnergyeffkient manner. Building operators, property managers and tenants should all work together to improve the operation of the HVAC systems. Building operators should receive regular training on new HVAC technologies and maintenance procedures; tenants should provide constructive feedback to building maintenance staff; and property managers should stay informed of the issues so that they can make practical decisions regarding HVAC system upgrades.
WAC SYSTEMS 39

* 0 z P4 u
0
H
THERMAL STORAGE TECHNOLOGY
A ir conditioning loads are the fastest growing sources of electrical usage in North America. The cooling equipment greatly increases the burden on the
power distribution systems of all electrical utilities, and the peak loads caused by air-conditioning equipment naturally occurs during the daylight period. In order
to deter the heavy loads placed on their systems, many utilities have implemented time-of-use rates, which have either lower or no demand charges and reduced
energy charges during off-peak periods.
Thermal cool storage offers the only viable method of taking advantage of time-of-use rates by storing inexpensive off-peak (nighttime) electricity so it can
be used for peak period cooling. By using stored thermal capacity to provide
a cooling supplement during peak times of the day, electrical demand charges can be limited by the customer and a relatively flat electrical use profile may
be achieved.
TNE LOAD PROFILE The main key to understanding and applying Thermal Storage ideas to any facility
is the Load Profile. The Load Profile is achieved by plotting cooling electric loads against time. In most federal buildings, the electricity consumption
starts off low during the unoccupied early morning hours and builds to a
maximum around midday. As the early evening approaches, the consumption
declines back down (see Figure). The “hump” on the graph occurs during the
utility’s peak billing period and can be reduced by a number of different storage techniques. Each varies in the amount of peak demand that it displaces, which is a
function of the energy amount that can be stored.
w Chad% 41

n Full Storage systems store the entire
on-peak cooling requirement during off-peak hours. The capacity
required for a full storage system is relatively large because sufficient
thermal energy must be stored to
supply the normal cooling load. These storage systems work well in
retrofit applications as they can be
designed to avoid the cost of addi- tional chiller capacity.
n Partial Storage techniques involve storing enough thermal energy to
displace only part of the facility’s cooling load. The cooling load is sat-
isfied using both the stored energy
and existing cooling equipment.
Partial storage is considered a good
choice because it requires smaller
chilling storage equipment than
full storage. The two most common
techniques are Demand Limited and Load Levelling partial storage.
n Demand Limited Partial Storage is applicable for holding a facili-
ty’s maximum electrical daytime demand to a predetermined level. Normally this level of peak
demand is set by non-cooling
loads.
w Load Levelling Partial Storage technique levels the cooling electrical demand when cooling
over a specified “design day’: It only supplies part of a facility’s
cooling load from storage. With this technique, the least amount
of thermal storage capacity is
used and is the least expensive to
install.
. I
42 THERMAL STORAGE TECHNOLOGY

12 2 4 6 8 10 12 2 4 6 8 10 12 Nmn
Time of day
Peak cooling demand is shified to off-peak periods to take advantage of cheaper electricity rates
NW p=k limit
THERMAL COOL STORAGE pcolgLOOY - How IT
Since it is very difficult and expensive to store electricity, the cheap off-peak
electricity must be used to cool a substance which can then be stored until
it is used for peak daytime use. Currently
most building cooling is generated by
a device called a chiller. A chiller is a
packaged refrigeration device specifically designed to produce cold water or brine
and has electric motors which consume a lot of electricity. Energy is saved by
putting the chiller to work cooling water or making ice when rates are lower.
Then, instead of having the chiller operate during the peak charge periods,
it is turned off and the stored ice or water is circulated to cool the building.
w Water Storage - Currently, the best storage medium is water. Water is
the most practical because of its low
cost, high thermal storage capacity, non-toxicity, long life and ease of
handling.
H Ice Storage - Ice storage systems are
popular in retrofit applications where space may be limited, since
they can store approximately 10 times more cooling energy per unit volume than chilled water. In many
cases, a full storage ice system can
easily be designed to meet the full
cooling load requirements during
the facility’s peak hour.
Other storage materials are also
available; but, toxicity, cost, heat storage capacity, and media degradation must be
carefully examined.
THERMAL STORAGE TECHNOLOGY 43

COLD AIR DISTRIBUTION A major benefit of implementing
thermal cool storage is the ability to
operate at lower water temperatures, which in turn produces lower supply air
temperatures in the air handling systems. (Physically the cool liquid from the
storage tanks is pumped to the air-
handling duct area where it passes through many coils. Fans blow air which
is cooled as it passes over the coils). Thermal storage produces supply air at 7-C instead of the usual 13’C. Cooler air
is denser and occupies less volume. Since lower air volumes are required, fan
energy is also reduced. A second benefit
is greater dehumidification of the supply
air. With lower humidity, the rooms can
be kept slightly warmer than normal in
summer while remaining comfortable.
The mechanical systems that distribute cold air at 7O C are less expensive than
conventional systems because smaller
capacity units are required. Practically all
cost benefits result from space, structural
and electrical cost savings. Specifically,
these are floor-to-floor height reductions,
less mechanical room space, small duct risers and smaller electrical wiring. For
areas that need increased cooling loads, the use of cold air distribution handles
more cool air without installing new duct work and/or fans. The use of cold air
distribution technology allows many projects to become competitive on first
cost when compared to non-storage air conditioning.
Thermal storage will increase operating flexibility for equipment with greater
load capacity for shorter operating periods.
EXAMPLE A 26.storey office tower in downtown
Ottawa was recently retrofitted with an ice-based thermal storage system. The
1.2 million square foot building had its peak load reduced by 479 kW. This
resulted in over $44,000 in annual savings.
For further information please contact: Industrial, Commercial and Institutional Programs, Natural Resources Canada, 580 Booth Street, 18” Floor, Ottawa, Ontario KlA OE4, Fax: (613) 947-4121
44 THERMAL STORAGE TECHNOLOGY

H
0
H
F4
L
w
u d w
z
WATER LOOP HEAT PUMP
F or heating and cooling, the water-loop heat pump (WLHP) system provides simplicity, eficiency and flexibility. Besides being able to heat or cool the
building environment, a WLHP can save energy by transferring or balancing heat from building areas requiring cooling to areas requiring heating, at the same time.
Most office buildings are character&d by two distinct areas with considerably
different load conditions - the core (interior) zone and the periphery (perimeter) zone. The core zone, at the centre of the building, is not affected by sun position or
weather, except where there is exposed roof at the top floor. The peripheral zone (extending between 3.7 to 4.6m inward from the exterior wall around the building
perimeter) experiences wide variations in space conditions due to changing sun
position, weather, internal heat gains (heat generated by office equipment, lights
and people) and heat losses.
During seasonal transitions from spring to summer and autumn to winter, one side
of the building may require cooling due to solar heat gains, while heating is required at another due to low outside temperature. In winter, heating is required
in peripheral areas to offset heat losses through the building envelope. This is particularly critical at night when there are virtually no internal heat gains (light,
people, equipment), no external heat gains (solar), and outside temperatures are
lower. Core cooling is often required year-round during occupied hours to offset
the constant and fairly uniform heat gain.
A conventional air-conditioning system requires operation of independent sources for heating and cooling throughout the year. Thus, heat-and cold-producing
systems are at odds, wasting an unknown amount of energy annually. WLHP systems combat this wasteful simultaneous heating and cooling by
optimizing the transfer of heat within the building.
w
Chad?! 45

/ieat rejected ta the hop on he sunny side of the building con be
used for heating on the other side of the building.
WATER LOOP HEAT PUMP po~N~LocY - How IT
A heat pump is a device that can both heat and cool by using a reversible
refrigeration cycle. The water source heat pump can absorb heat from circulating
water and transfer it to an air stream that is used for space heating purposes. When
reversed, it can cool an air stream used
for cooling and transfer the absorbed heat energy into circulating water.
Physically a year-round heating and cooling system consists of a series of
individual water source heat pumps
connected by a pipe loop network. The water circulating in the pipe loop is
maintained between approximately 15-C
and 35X During the winter months,
when additional heat is required, a loop
heater (a gas-fired boiler or electric
element heaters) will “kick in” to add heat to the water loop. Likewise during the
summer (or when there is excessive internal heat gain), the unwanted
additional heat in the water loop is
dissipated into the atmosphere through a
cooling tower (also known as a heat
rejector).
The water in the pipe loop serves
as both a heat sink (absorbs heat) and
a heat source (gives off heat). An indi-
vidual heat pump can absorb heat from
the loop or reject heat back into the loop
at any time. The occupants may select
heating or cooling in their zone without affecting other areas in the building any
time of the year. In multiple-unit installations, under conditions when
some heat pumps operate in the cooling
46 WATER LOOP HEAT PUMP

mode while others operate in the heating
mode, controls are necessary so that the loop water temperatures remain between
prescribed limits.
BENEFITS n Saves Energy - Permits the opportu-
nity for energy conservation by recovering heat from interior zones
and/or waste heat, and by storing
excess heat from daytime cooling for nighttime heating.
n Retrofit Opportunities Bulky air
ducts or noisy air conditioners can be simply replaced by one pipe loop running throughout the building.
n Lower Installarion/Maintenance
Cost+ In new buildings, labour and construction material costs are
reduced because most of the systems are factory-packaged. Bulky and
costly insulation is not required because the water in the loop
remains near room temperature.
The total life cycle cost of this system
often compares favourably to central
systems when considering relative
installed cost, operating costs and
system life. Units also have a longer expected life than air-cooled heat pumps.
n Increased Comfort Noise levels are
lower than air-cooled systems
because condenser fans are elimi-
nated.
m Flexible Operation/Expansion
Should a unit fail, the entire system is not shut down. For future building
changes, larger sized units can be installed easily to handle increased
heating and cooling requirements
Heat is supplied to he water /cop by the boiler and absorbed by the
heat pumps to provide space heating.
Boiler
Any time at least one-third of fhe units ore cooling, enough heat is
rejected to the /cop to provide all the heat requirements of the perimeter, e”en in winter
WATER LOOP HEAT PUMP 47
without costly alterations. Units are
not exposed to outdoor weather, which allows installation on the sea-
coast and in other corrosive atmospheres.
n Heat Storage Capability .- A water source heat pump system has the capability to be easily modified to
“store” heat for later use. By adding
a water storage tank into the loop,
excess unwanted heat generated dur- ing the day can be used to heat the
water in the storage tank for use at
night, during the weekend or in the morning to return the building to normal operating temperatures. The
water in the storage tank can be
heated further through electric
heaters, which can take advantage of
utility off-peak rates. This reduces
the peak electrical demand experi-
enced during the day. For cooling purposes, the water may be cooled through the heat rejector and stored
for times of high daytime cooling demand.
operating hours, high lighting require-
ments and low window-to-wall area ratio are conditions favouring the selection of
a heat pump. Also, buildings requiring individual metering of heating and
cooling will benefit. The system flexibi- lity allows units to be upgraded or down-sized to accommodate changing
tenant requirements.
EXAMPLE
CANDIDATE BUILDINGS Heat pumps should be considered whenever a building needs both heating and cooling. Depending on the building
layout, the installed cost of a WLHP with
one unit per zone is likely to be lower
than a system with one central heat
pump serving a whole building. Long
Water loop heat pumps were the system
of choice for a heating and cooling retrofit of an oftice building in down- town Toronto. The eleven storey building
had a gross floor area of 70,000 square
feet and was built in 1952. In 1985, the
outdated and unreliable HVAC system
was upgraded. The original heating and cooling system consisted of perimeter
fan coil units supplemented by a central fresh air system. Cooling was provided
by central reciprocating chiller which had a history of frequent failure. Heating
was provided via steam which was purchased from an outside source. The
new system consists of 135 inter-
connected perimeter heat pump units averaging 3/4 ton in size and 18 interior
units of three and a half tons each that are hidden in closets. The heat pump total energy costs following the retrofit
averaged less than $1.30 per square
foot - a savings of more than $10,000
annually.
For further information please contact: Industrial, Commercial and Institutional Programs, Natural Resources Canada, 580 Booth Street, IS* Floor, Ottawa, Ontario KlA OE4, Fax: (613) 947.4121

H
0 u
k u d w z w
AD JUSTABLE SPEED DRIVES
A pproximately 50 per cent of the electricity used in commercial buildings is consumed by electric motors. Energy reduction strategies for motors can be
placed in three general categories:
n Reduction in motor electricity consumption by decreasing the load. In many existing buildings, there has been considerable over-design in air
and water flow systems. By t-e-evaluating and trimming the flow rates being produced by pumps and fans, the power drawn by the motor is
reduced by approximately the cube of the flow rate.
n Reduction in hours of operation. Energy consumption can be decreased
by careful review of the required hours of equipment operation along with the installation of energy management control systems which can
automatically shut off fans and pumps when they are not needed.
w Application of new or improved technologies such as high effXency
motors and adjustable speed drives (ASD).
ASDs are used in applications where the speed of the motor driven equipment needs to vary instead of operating at a constant speed all day. They are employed
in order to match the motor output speed and device requirements. Mechanical
drives are one type of ASD, but they suffer from lower &ciency, a smaller speed
control range, bulky size and higher maintenance requirements.
The remainder of this fact sheet will concentrate on electronically based ASDs
which are often referred to as adjustable frequency drives or variable frequency inverters. They are essentially devices which control the speed and torque of AC
electric motors. This is done by passing the input power through a black box, which varies the input frequency and the speed of the motor. The output of the ASD can
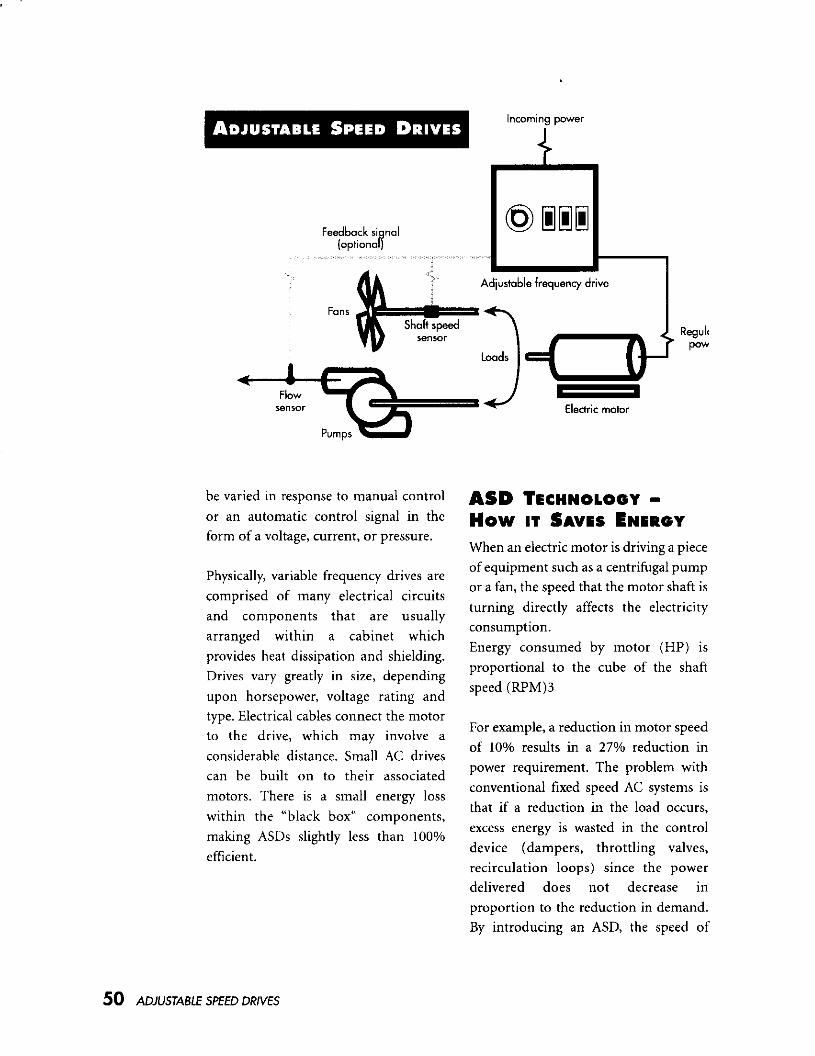
Electric nwtor
be varied in response to manual control
or an automatic control signal in the form of a voltage, current, or pressure.
Physically, variable frequency drives are
comprised of many electrical circuits
and components that are usually
arranged within a cabinet which
provides heat dissipation and shielding. Drives vary greatly in size, depending
upon horsepower, voltage rating and type. Electrical cables connect the motor to the drive, which may involve a
considerable distance. Small AC drives can be built on to their associated
motors. There is a small energy loss
within the “black box” components,
making ASDs slightly less than 100%
efficient.
ASD TECHNOLOOY - How IT SAVES ENERGY When an electric motor is driving a piece of equipment such as a centrifugal pump or a fan, the speed that the motor shaft is
turning directly affects the electricity consumption.
Energy consumed by motor (HP) is
proportional to the cube of the shaft
speed (RPM)3
For example, a reduction in motor speed
of 10% results in a 27% reduction in
power requirement. The problem with
conventional fixed speed AC systems is
that if a reduction in the load occurs,
excess energy is wasted in the control
device (dampers, throttling valves,
recirculation loops) since the power delivered does not decrease in
proportion to the reduction in demand. By introducing an ASD, the speed of
50 ADJUSTABLE SPEED DRIVES

Speed - Power Relationship
0x Es/- 20% 40% 60% 80% 1ws Speed
loads can be adjusted so that overall energy and peak power savings can be
achieved.
ASD APPLICATIONS AND ECONOMICS The majority of ASDs operate on
variable air volume fan systems. They are also used with fluid pumping
applications and air-conditioning chillers. This makes them suitable for
both new and retrofit installations.
Typical savings for commercial buildings are about 60% of the constant speed
motor energy consumption.
ASDs are presently available from many
manufacturers in sizes ranging from 1 to
1500 horsepower. The design of an ASD
is site specific, so the equipment must be
chosen to suit the particular application.
The cost of an ASD varies depending on
the size of motor controlled. For motors of less than 5 HP, prices range from
about $600 to $2500 per HP. For very large motors ( IO0 to 300 HP) the cost is
reduced to a few hundred dollars per HP.
The cost of an ASD is typically paid back in 5-10 years and can be paid back sooner when applicable utility incentives
are used. For applications above 50 HP, installation costs are usually comparable
to the total capital cost for the drive. Mow this power rating, installation
costs may be as much as double the drive cost.
Other advantages of an ASD over mechanical, hydraulic and fixed speed
drives are:
w wider speed, torque and pow ranges
n shorter response times
W equipment life improvement
n reduction in vibration and noise
lW&
n reduced maintenance and downtime
There may be savings in terms of both
energy consumed and peak demand
charge. The extent of these savings depends on the local utility’s rate
schedule. Care must be taken to consider
both energy and demand savings-often
economic calculations are made using
the average cost of energy resulting in
significantly overstated saving estimates.
ADJUSTABLE SPEED DRIVES 5 1

The demand charge forms the
other element of electrical power cost. It compensates the utility for the peak
current it must deliver during the
month. The most significant factor
affecting the demand charge is the maximum load incurred by the customer. Since the load, which varies
with the cube of speed, can be adjusted
by ASDs, significant demand charge savings are achievable.
For further information please contact: Industrial, Commercial and Institutional Programs, Natural Resources Canada, 580 Booth Street, IS* Floor, Ottawa, Ontario KlA OE4, Fax: (613) 947-4121
52 ADJUSTABLE SPEED DRIVES

z Gl
, , 0
k
ENERGY EFFICIENT MOTORS
A n electric motor is a device that converts electrical energy into mechanical energy. Approximately 50% of the electricity used in commercial buildings is
used by electric motors. Their primary uses are for refrigeration, air-handling and
elevator equipment. The cost of electricity to run a motor for one year is often
many times the purchase price, meaning small improvements in motor efkiciency
can yield significant savings. Distribution of
There are many types of motors. The main classifications are Commercial Electricity UK
Alternating Current (AC) Motors, Direct Current (DC) Motors and Universal Motors. For commercial HVAC
equipment, motors are commonly powered by AC. DC motors
are used in applications where precise speed control is required.
ENERGY EFFICIENT MOTOR TECHNOLOGY - HOW IT SAVES ENERGY
Electric motors are generally efficient, but with rising power
costs the demand for even more efficient models has led to the development of the High Efficiency Motor. The effkiency of a 5.8%
motor is the ratio of its mechanical output to electrical input.
Power input to the motor is either transferred to the shaft as power output or is lost
as heat through the body of the motor. By using better grades of materials and
improved designs these losses have been reduced. A high efficiency motor produces
the same mechanical output power using less electrical input power than a
standard motor
Cana& 53
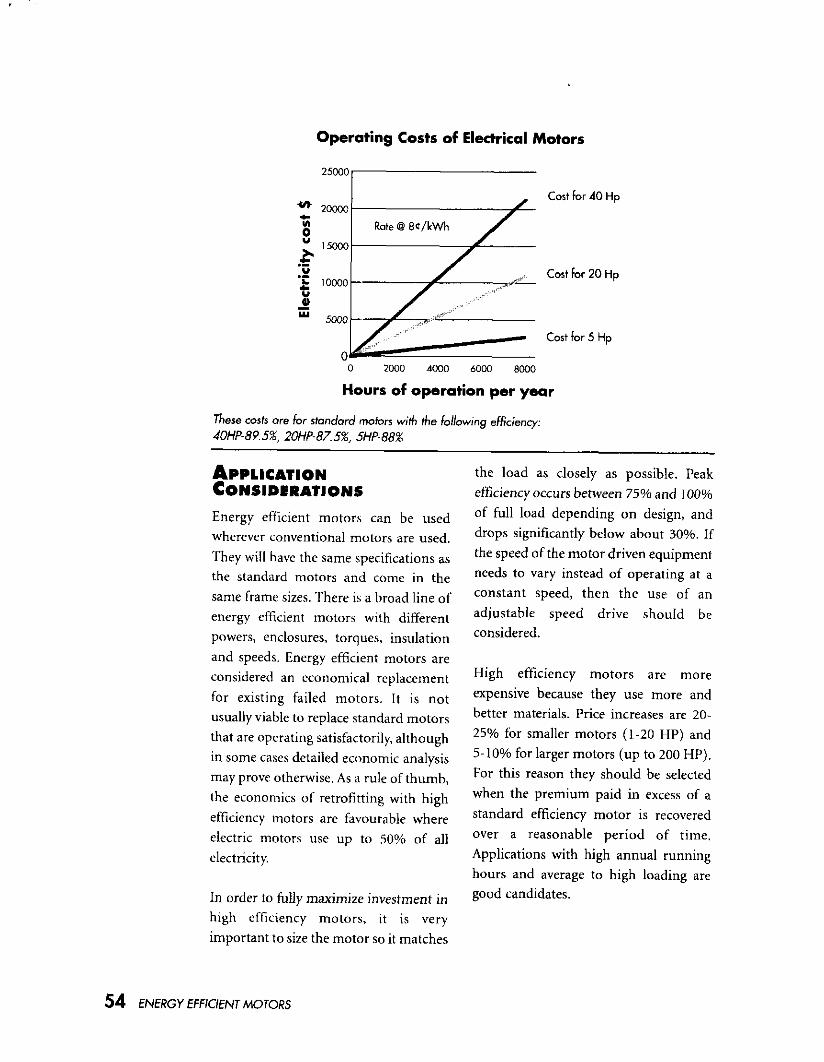
Operating Costs of Electrical Motors
Cost for 40 Hp
Cost for 20 Hp
Cost for 5 Hp
0 moo 4coo bow 8000
Hours of operation per year
These costs are for standard motors with he following efficiency 4Oh'P-89.5%, 2OHP-87.5%, 5HP-88%
APPLICATION CONSIDERATIONS Energy efficient motors can be used wherever conventional motors are used.
They will have the same specifications as the standard motors and come in the
same frame sizes. There is a broad line of
energy efficient motors with different
powers, enclosures, torques, insulation
and speeds. Energy efficient motors are considered an economical replacement
for existing failed motors. It is not usually viable to replace standard motors
that are operating satisfactorily, although in some cases detailed economic analysis
may prove otherwise. As a rule of thumb,
the economics of retrofitting with high
efficiency motors are favourable where electric motors use up to 50% of all
electricitv.
In order to fully maximize investment in high efficiency motors, it is very
important to size the motor so it matches
the load as closely as possible. Peak
effkiency occurs between 75% and 100%
of full load depending on design, and drops significantly below about 30%. If
the speed of the motor driven equipment
needs to vary instead of operating at a constant speed, then the use of an
adjustable speed drive should be
considered.
High efficiency motors are more
expensive because they use more and better materials. Price increases are 20.
25% for smaller motors (l-20 HP) and
5.10% for larger motors (up to 200 HP).
For this reason they should be selected when the premium paid in excess of a
standard effLiency motor is recovered
over a reasonable period of time.
Applications with high annual running hours and average to high loading are
good candidates.
54 ENERGY EFFICIENT MOTORS
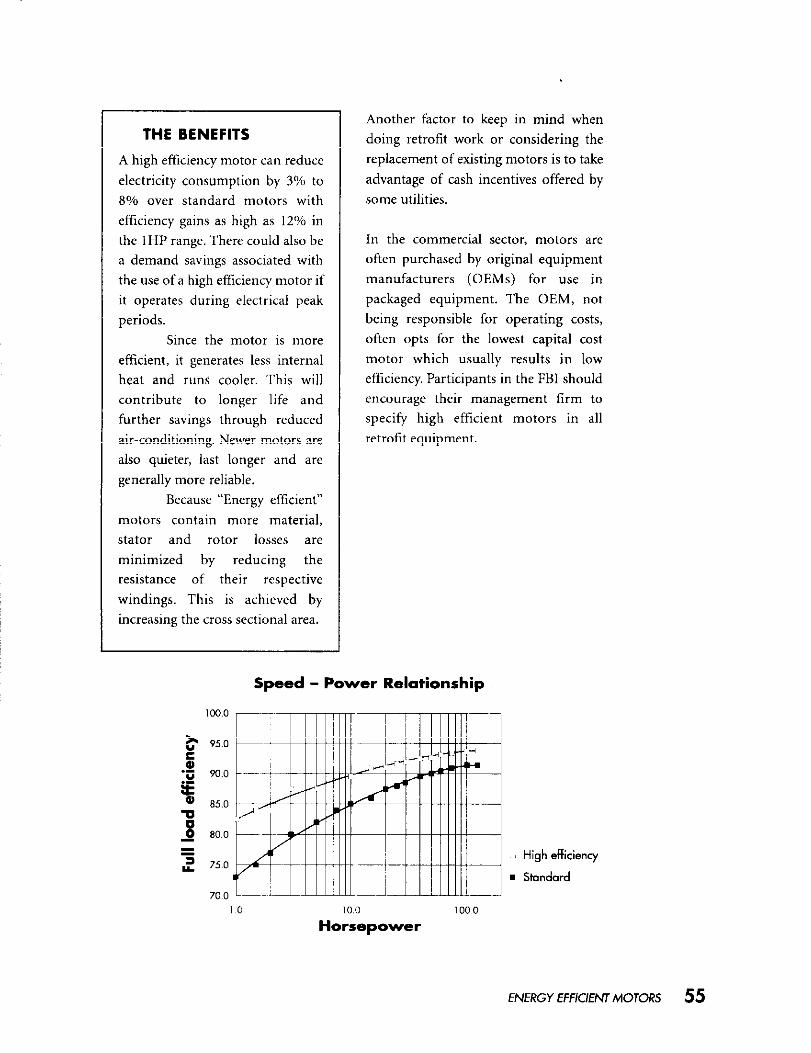
THE BENEFITS
A high &ciency motor can reduce
electricity consumption by 3% to
8% over standard motors with
efficiency gains as high as 12% in the IHP range. There could also be a demand savings associated with
the use of a high effZzncy motor if
it operates during electrical peak periods.
Since the motor is more
efficient, it generates less internal heat and runs cooler. This will
contribute to longer life and further savings through reduced
air-conditioning. Newer motors are
also quieter, last longer and are
generally more reliable. Because “Energy efficient”
motors contain more material, stator and rotor losses are
minimized by reducing the resistance of their respective
windings. This is achieved by increasing the cross sectional area.
Another factor to keep in mind when
doing retrofit work or considering the replacement of existing motors is to take
advantage of cash incentives offered by some utilities.
In the commercial sector, motors are often purchased by original equipment manufacturers (OEMs) for USE in
packaged equipment. The OEM, not
being responsible for operating costs, often opts for the lowest capital cost
motor which usually results in low
efficiency. Participants in the FBI should encourage their management firm to specify high efficient motors in all
retrofit equipment.
Speed - Power Relationship
10,c 100~0 Horsepower
High efficiency
Standard
ENERGY EFFICIENTMOTORS 55

EXAMPLE
Replace a 25 HP fan motor with a high
efficient unit. The fan operates 16 hours
per day, or 5480 hours per year and the average electrical energy cost is $0.06 per
kWh.
Standard Motor = 85% efficient
High Efficiency Motor = 90% eff%ient
Incremental Cost = $305
Energy Savings = $427 per year Payback period = 9 months
Cumulative Annual Savings
Year
For further information please contact: Industrial, Commercial and Institutional Programs, Natural Resources Canada, 580 Booth Street, 18’ Floor, Ottawa, Ontario KlA OE4, Fax: (613) 947.4121
56 ENERGY EFFICIENT MOTORS

u
0
u
* u d
ADVANCED WINDOWS
W indows play an important role in achieving a high quality indoor environment. Like any part of the building envelope, a window is a filter of
conditions between the inside and the outside environments. Windows have long
been a weak point in the building envelope and are only now benefiting from
significant improvements in energy-efficiency, comfort, and durability.
Heat losses through windows represent a major load for both heating and cooling systems. Window manufacturers are exploring and introducing radical
improvements to performance while preserving the daylighting benefits.
The main improvements achieved with high performance or advanced windows
are the increase resistance to heat flow and the attendant increase in the indoor surface temperature of glazing and frame. The first improvement reduces both
heating and cooling costs, while the latter increases thermal comfort conditions
and allows for higher indoor humidity without condensation.
Advanced windows offer clear opportunities: reduced heating equipment sizing; reduced heating and cooling energy; design flexibility in utilizing large areas of
windows in any direction; improved indoor thermal comfort; and the conservation
of resources.
ADVANCED WINDOW TECNNOLOOY - How IT WORKS Advances in physics and engineering sciences have resulted in many improvements in window design, performance, and construction. The use of low emissivity
coatings on glass or thin plastic film, gases other than air in the cavity between the glass sheets, and evacuated sealed units has resulted in high quality performance

windows. Window frames and spacers
are not limited to conventional mate- rials. Vinyl, polyurethane, fibreglass and
silicone are now being used for more durable, stronger and better perfor-
mance windows.
COMPONENTS OF ADVANCED WINDOWS The three major components that make up a window are glazing, frames, and
spacers.
Glazing
The glazing is the transparent part of the
window. Any building with existing
single-glazed windows should retrofit
with more energy-efficient windows immediately. The glass itself adds
practically no thermal resistance to the window as a whole. A simple way to
improve glazing performance is to retrofit with new windows that have
additional panes of glass and air spaces.
Thermal break
58 ADVANCED WINDOWS
The addition of a second pane, and the
creation of an air gap between the panes, reduces the conduction and convection
of heat through the glazing unit. Additional glazing increases the unit’s
thermal resistance. However, this rule
shows a diminishing return on
increasing the number of glazings. The
reason for diminishing reduction of
energy loss is that radiation heat loss dominates when more than two panes of
glass are used. Multiple glazings are used
when there is a condensation problem in high humidity areas.
Low-Emissivity Coating Emissiv-
ity is the ability of a surface to radi- ate heat. Low-E coatings reduce the
emissivity of the glass surface, keep-
ing heat in during the cold winter
months, and holding cool air dur-
ing hot summers. They also control
glare by blocking most incoming solar energy and cutting out 99% of
the sun’s damaging ultraviolet radi- ation. They reduce up to 65% of the
radiant heat loss, and also reflect
60%.80% of solar energy.
Window Film -Window tilm is the
general term used to describe a family of high-tech fdm products.
It is applied to the interior surface
of a window, thereby reducing solar
heat gain and heat loss through the
window glass. The reflective prop-
erty of window film is attributable to a thin layer of metal particles
sandwiched between plastic layers. It reduces heat gain and contributes
to the aesthetics of a building’s

exterior. A window film can elimi-
nate as much as 79% of the solar heat gain and cooling energy loss
that would normally be experi-
enced using clear glass. Window
film also reduces glare from the sun and the transmission of ultra-violet radiation through the glazing.
n Gas-Filled Widows The reduc-
tion of heat transfer by radiation in
low-E windows has focused atten- tion on ways of further reducing convection and conductive heat
loss. Air, compared to other gases is
a good conductor of heat. By
replacing the air between the panes with a heavier gas having lower
thermally conductivity, conductive
heat loss is reduced.
Frames The second major component of a window is the frame. The frame
performs the following functions:
n Holds the window in place
n Allows glazings to open and close
n Interfaces the glazings with the wall
HEAT TRANSFER MECNANISMS Convection: The transfer of heat that occurs
when a moving gas (like air) or liquid (like water) comes into contact with a surface of a
different temperature. For example, hot and cold air are in constant contact with both
sides of the window resulting in convective
heat transfer.
Conduction: The transfer of heat that occurs by direct contact of materials of different
temperatures. The metal frame of a window conducts heat since each end is subjected to different temperature environments. That is
why interior surfaces of metal window frames are very cold in the winter months.
Energy efficient window frames get around electro-magnetic waves. Radiation is unique
this problem by introducing a thermal break since it is the only form of heat transfer that
or discontinuity in the metal frame. The gap does not require an intermediate material.
is replaced by a better insulating material, Radiation can travel equally well through air
such as plastic, which reduces the conductive or a vacuum. For windows, new coating
heat losses. technologies can help to maximize the
radiation energy received from sunlight in
Radiation: The transmission of heat by the winter and minim& it during the
summer.
ADVANCED WINDOWS 59

The important selection criteria for
window frames are:
. Thermal integrity
n infiltration rate
n Aesthetics
m Cost
Window Spacers All advanced windows have some type of
spacer that maintains the separation
between the two (or more) panes of glass.
The spacer must be strong enough to hold
the window apart and provide high
thermal resistance.
Operable Windows Operable windows, incorporating
advanced window technology, can provide
individual control to supplement or
modify the operation of the conventional
mechanical heating, cooling and
ventilation systems. The lower
maintenance and operating costs of these
advanced operable windows are more than
offset by their increased capital cost of
15%. Opening the windows in the Spring
and Autumn seasons to forestall the use of
air conditioning systems can increase the
human comfort level. The maximum
building height for the use of operable
windows is eight storeys. The increased
quality in hardware and seals will tend to
increase the energy efficiency of operable
windows to more closely match that of
sealed windows
BENEFITS
Reduction of annual space heating
and cooling costs - savings range
from 14% to 24% and depend on
building location and window type.
Elimination of cold spots - decreases
condensation problems and avoids
use of warm air distribution through
perimeter heating systems. Centrally
located distribution systems are more
effective and economical.
Reduction in maintenance costs due
to greater emphasis on quality assur-
ance by window manufacturers.
COST ANALYSIS
Like many energy efficiency measures,
windows also show diminishing cost
returns with increasingly sophisticated
technology. The selection of a proper
window for a medium sized or large
building should be assessed on the basis of
life-cycle costing and the simple payback
period. The potential energy and power
reductions achieved through the use of
advanced windows should be weighted
against the incremental costs and any
efficiency incentives.
For further information please contact: Industrial, Commercial and Institutional Programs, Natural Resources Canada, 580 Booth Street, 18” Floor, Ottawa, Ontario KIA OE4, Fax: (613) 947.4121
References
60 ADVANCED WINDOWS

June 1994 *
Un .4l&nment du P~ogmvne de l’efficacitel Gnerg&ique et des &wgws de remplacement
BALLASTS FOR FLUORESCENT LAMPS
T he ballast is a critical element of a fluorescent lighting system that controls the power delivered to the lamps. New teclmology allows ballasts to be more efficient, last longer,
have lower maintenance costs, provide better quality light with less noise and give off less heat.
BALLAST TECHNOLOGY - How IT WORKS A ballast controls the voltage required to start up a lamp and the current required to operate the lamp. A ballast serves as a transformer, increasing or decreasing the voltage supplied to the lamp, as required. In so doing, the ballast itself consumes energy, from 6 to 14 Watts. As a result, when lighting levels are reduced by disconnecting lamps, it is also important to disconnect the ballasts, as they will continue to consume energy when powered on, even without any light bulbs. Figure 1 shows the general functions of a ballast.
Figure 1 - The functions of a ballast
AC to DC j-Q&StM Dcto Fluolrrcont
r&n H’qh Cumnt 0 F-i-w
COllWOl bmps
AC SPP~
There are two basic types of ballasts: electromagnetic, also known as magnetic ballasts (which may be standard or energy efficient) and electronic ballasts. Typically, standard electromagnetic ballasts are used with fluorescent lamps, but the new energy-efficient magnetic ballasts and electronic ballasts are becoming more popular.
n Magnetic ballasts, or core-coil ballasts, consist of a centre core made of layers of steel surrounded by copper or aluminum coils. The copper coils within the energy-efficient magnetic ballasts are designed for greater surface contact, the core is made of higher quality materials.
n Electronic ballast, or solid-state ballasts, use electronic components and are capable of operating lamps at much higher frequencies -- about 20,000-40,000 Hertz (Hz), rather than the 60 Hz used by the magnetic ballasts. At higher fre- quencies, fluorescent lamps can operate lo-15 per cent more efficiently. The electronic ballasts also have fewer ballast losses*.
+ Ballast loss is the amount of energy a ballast loses in the form of heat, vibration and c-t leakage when operating a fluorescent lamp.
Natural Resources B+D Canada
Ressourcf~ natumlles Canada caJmcE 61

Table 1 provides o comparison of the power consumed by different ballast-lamp systems. The values given ore the approximate values for CI single ballast operating hvo T12-40W lamps. Actual values will vary slightly depending on the specific ballast and lamp. Energy-efficient magnetic ballasts use approximately 10 per cent less energy than the standard magnetic ballasts, whereas electronic ballasts use approximately 25 per cent less energy.
Table 1 - Power consumption of ballast-lamp systems (Watts)
Ballast Type
Lamp Type
T12-40W
Standard Energy-efficient Electronic magnetic magnetic
96 W 88 W 73 w
ADVANTAGES OF TNE NEW 0ALLAST TECNNOLOOY
The new energy-e&ient magnetic ballasts and electronic ballasts offer several advantages over the standard magnetic ballasts.
Reduced Electricity Costs The new ballast technology is more energy- efficient and provides the same. or a greater, amount of light while reducing the cost of electricity. When energy-efticicnt ballasts are used, electricity demand and consumption are reduced for two reasons. First, the lighting system itself uses less energy. Second, the air conditioning system uses less energy, due to cooling load reductions, since the energy~efficient ballasts produce less heat. (Heating requirements may also increase slightly, but it is better to heat a building with a boiler than with an electric ballast.
Less Noise Electronic ballasts emit little or no humming sound.
Fluorescent lamps give off light when a phosphor coating on the inside of the tube is activated. (Refer to the “Fluorescent Lamps” fact sheet.) When operated with electronic
ballasts, the phosphor coating in the lamp
never deactivates, due to the higher frequencies of operation. Thus, flickering and the eye fatigue associated with it are reduced with the new electronic ballasts.
longer Life The life time of a standard ballast operating at 90°C is typically about 12 years, depending on its operating temperature. The higher the operating temperature, the shorter the life of the ballast. If the operating temperature of the ballast is 1O’C higher than 90°C, the life time would be shortened by about 50 per cent; while if the operating temperature is 10°C lower, the life time would be approximately doubled. Energy-efficient ballasts operate at cooler temperatures; nearly doubling their life expectations.
BALLAST REPLACEMENT When ballast failures are frequent or a set of ballasts is approaching the end of its life expectancy, ballast replacement is
recommended. To minimize labour costs, ballast replacement should be conducted on a grouped basis. Energy-effZent ballasts should always be considered when ballasts are being replaced or lighting systems are being retrofitted.
There are many factors to consider when selecting a ballast. A ballast must match the
voltage of the electricity supplied, as well as
62 BALLASTS FOR FLUORESCENT LAMPS
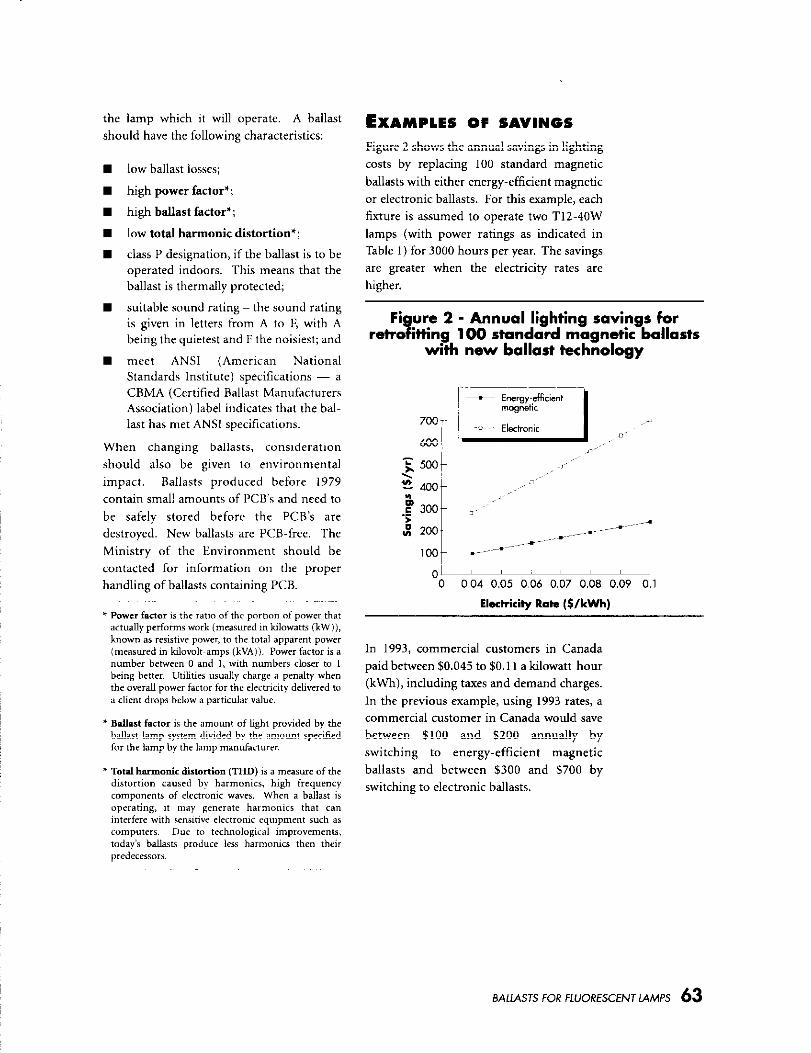
the lamp which it will operate. A ballast should have the following characteristics:
low ballast losses;
high power factor*;
high ballast factor’;
low total harmonic distortion*:
class P designation, if the ballast is to br operated indoors. This means that the ballast is thermally protected;
suitable sound rating the sound rating is given in letters from A to F, with A being the quietest and F the noisiest; and
meet ANSI (American National Standards Institute) specifications - a CBMA (Certitied Ballast Manufacturers Association) label indicates that the balL last has met ANSI specificatinns.
When changing ballasts, consideration should also be given to environmental impact. Ballasts produced before 1979 contain small amounts of PCB‘s and need to be safely stored beforu the PCB’s are destroyed. New ballasts are PCB-free. The Ministry of the Environment should be contacted for information on the proper handling of ballasts containing PCB.
EXAMPLES OF SAVINGS Figure 2 shows the annual savings in lighting costs by replacing 100 standard magnetic
ballasts with either energy-efficient magnetic or electronic ballasts. For this example, each fixture is assumed to operate two T1,2-40W lamps (with power ratings as indicated in Table 1) for 3000 hours per year. The savings are greater when the electricity rates are higher.
Fi ure 2 - Annual lighting savings for retro ltting 100 standard magnetic ballasts 7.
with new ballast technology
OL 0 0.04 0.05 0.06 0.07 0.08 0.09 0.1
Electricity Rah ($/kWh)
In 1993, commercial customers in Canada paid between $0.045 to $0.11 a kilowatt-hour (kWh), including taxes and demand charges. In the previous example, using 1993 rates, a commercial customer in Canada would save between $100 and $200 annually by switching to energy-efficient magnetic ballasts and between $300 and $700 by switching to electronic ballasts.
BALLASTS FOR FLUORESCENT LAMPS 63
CONCLUSIONS To properly evaluate different ballast-light systems, the life-cycle cost should be
calculated for the various options. Life-cycle cost would include the capital and installations costs, as well as operating and maintenance costs, taking into account any financial incentives offered by the local utilities. Such an analysis should also include savings due to a reduction in air conditioning load.
For further information please contact:
Industrial, Commercial and Institutional Programs, Natural Resources Canada, 580 Booth Street, 18’ Floor, Ottawa, Ontario KlA OE4, Fax: (613) 947-4121
64 BALLASTS FOR FLUORESCENT LAMPS

t-4
0
u
z
COMPACT FLUORESCENT LAMPS
ompact fluorescent lamps are an energy-efficient, long-lasting substitute for common C, mcandescent lamps. Their excellent quality of light output and their wide variety of available sizes, shapes, and wattage make them ideal candidates in retrofit situations.
Although fluorescent lamps have dominated the commercial building sector, their large physical size (long tubes and ballasts) makes them impractical in areas where incandescent bulbs have been used. In the early 198Os, new technical advances “shrank” the fluorescent lamp and opened up a huge new market.
COMPACT FLUORESCENT TECNNOLOGY - How IT WORKS As with a standard fluorescent lamp, a compact fluorescent lamp consists of a sealed glass tube coated on the inside with phosphor or fluorescent powder and filled with a mixture of low pressure gas (such as argon or neon) and mercury vapour. Electrodes are placed at each end of the tube. (Refer to the “Fluorescent Lamp” fact sheet for more information on fluorescent lamps in general.) Unlike the standard fluorescent lamp, a compact fluorescent’s glass tube is bent so that the electrodes are at one end of the lamp.
Compact fluorescent lamps operate in the same manner as full-sized tubes. When a specified voltage is applied to the lamp, electrons flow from the electrode at one end of the tube to the electrode at the other end. When the electrons collide with the mercury atoms, energy is absorbed and then released by the mercury atoms. The released energy strikes the phosphor coating and is converted into heat and visible light.
Compact fluorescent lamps consist of small diameter tubes: T4s have l/2” diameter tubes and T5s have 5/8” diameter tubes (the number after the letter ‘T’ represents the diameter of the tube in eighths of an inch). A smaller tube diameter allows the use of thicker, more economical phosphor coatings in compact fluorescent lamps, thus increasing the light output.
Common shapes encountered today are single- and double-folded U-shaped tubes, known as twin and quad tubes, respectively. Some of the new lamps even have triple-folded tubes.

Figure 1 - Some common compact fluorescent lamps
Compact fluorescent lamps may also be globe-shaped or include reflectors.
Every fluorescenr lamp requires a ballast to start the lamp and regulate the voltage during operation. (Refer to the “Ballasts for Fluorescent Lamps” fact sheet.) Sometimes the ballast is part of the compact fluorescent lamp itself.
. Integrated compact fluoreSCPnt lamps
contain a built-in ballast and tit directly into almost any standard incandescent lamp socket. When replacing the lamps, the entire unit must be replaced.
n Modular compact fl~orescenf lamps do
not include a ballast and must be plugged into a specially designed ballast and socket. Modular lamps plug into adapters which contain the ballast and screw into incandescent lamp sockets.
ADVANTAOES OF THE TECNNOLOOY Reduced Energy Cosb Compact fluorescent lamps reduce energy costs in two ways:
1. Direct savings in electricity. Both electricity demand and consumption charges may be reduced by “sing compact fluorescent lamps. They have higher efficacies* - that is, they emit between three and four times more light than incandescent lamps. (Ranging from 25 and 85 Im/W; as opposed to 8 and 20.1
2. Indirect savings from reduced air conditioning load due to lower internal heat gains in the building. Compact fluorescent lamps COnYert approximately 70 per cent or more of the energy they consume to light, with less than 30 per cent going to heat. Incandescent lamps convert only 10 per cent of energy to light, with 90 per cent going toward heat. (Heating loads may also increase, but this is not usually a major concern in commercial buildings where there are large internal heat gains and cooling loads arc more of a concern.)
Reduced Maintenance Costs A compact fluorescent lamp has a lifespan about 10 times longer than a standard incandescent lamp. Compact fluorescent lamps are rated for between 10,000 and 20,000 hours of operation, while incandescent lamps compare at between 750 and 2,000 hours. Longer lives mean fewer lamp replacements and lower maintenance costs.
Good Colour Compact fluorescent lamps have high colour rendering indices* (CRIs), with CR& in the eighties.
* E&acy is a meaSwement of the efhienq of a lamp. ,t is the amount of visible tight output by a lamp divided by the power input and is measured in lumens per watt (ImlWj.
66 COMPACl -FLUORESCENT LAMPS

APPLICATIONS Compact fluorescent lamps come in sizes from 5 to 30 W and can replace 25 to 150 W incandescent lamps for many commercial building uses. They may be used in wall and ceiling mounted futures, exit and directional signs, floodlights, display lighting, or task lighting. Compact fluorescent lamps are suitable wherever precise beam control is not required, although there arc some newer models which can be suitable for these applications. Several factors should be taken into account when considering compact fluorescent lamps.
Fixtures Compact fluorescent lamps are best suited to open fixtures. Some fixtures, which were designed for the smaller incandescent lamps, may not be large enough for the fluorescent lamp and ballast.
Operating )empemtums As well, fluorescent lamps should not be used in fixtures that will trap heat. Fluorescent lamps are very sensitive to their operating temperatures. Warm temperatures reduce the light output and operating the lamps much below room temperature will also affect their operation and should be avoided. In general, fluorescent lamps are not suited for outdoor use.
Hard-wire ballast In some applications, users may wish to hard-wire the ballast into the fixture to prevent the compact fluorescent lamps from being replaced with incandescent lamps.
EXAMPLE OF SAVINGS One hundred 40 W (.04 kW) incandescent lamps that operate for 4000 hours a year are
replaced with compact fluorescent lamps which consume 10 W (.Ol kW) each, including the ballast.
The following equation is used to determine the annual energy savings for the new lighting system. Note that the units for the energy savings per fixture are in kilowatts (kW) to correspond to the electricity rate which is typically given in dollars per kilowatt-hour (kWh).
Annual Number Energy Hours of Energy
Savings = of Fixtures x Savings per x Operation
Fixture Wyearl
(hours) WI
Figure 2 shows the amount of savings in lighting energy costs which can be achieved by replacing incandescent lamps with compact fluorescent lamps in the example above. The amount of savings depends on the electricity rate; the higher the rate, the greater the savings. In 1993, commercial customers in Canada were paying between $0.045 to $0.11 per kilowatt-hour (kWh) of electricity, including taxes and demand charges. In other words, depending on the electricity rate, retrofitting to compact fluorescent lamps for this particular example would provide between $550 and $1,300 of savings per year.
Table 1 compares the capital costs, including installation costs, for compact fluorescent systems and incandescent lamps. Since compact fluorescent lamps last ten times as long as incandescent lamps, ten incandescent bulbs would be required for every fluorescent bulb a total of one thousand incandescant bulbs for the 100 fixtures being retrofitted.
Electricity Rate
’ Wkwhl
COMPACT FLUORESCENT LAMPS 67

Table 1 - Capital costs far compact fluorescent lamps and incandescent lamps
Wattage Lamp Cost Installation Total Cost Total Cost
(WI ($/lamp) cost r;j,lam; G/n lovl ($/lamp) am
Compact low $20.00 $1 .oo $21 .oo $2,100/100 fluorescent (id. ballast) l0lllp
Incandescent 40 w $0.50 $1 .oo $1.50 $1,500/l 000 lamps
Figure 2 - Annual lighting energy savings and simple payback for replacing one
hundred 40 W incandescent lamps with 10 W compact fluorescent lamps
0.6 i P 2
0.4 .E In
0.2
lo.0 .04 0.05 .06 .07 .08 .09 .lO .ll .12
Ekhkhy Rata (S/km)
In this example, the compact fluorescent lamps cost $600 more than the incandescent lamps, including installation costs. The simple payback would be calculated as follows:
Simple Poybock = Extra Capttol Cost + Annual Energy Swings
As shown in Figure 2, the payback period varies from six months to one year, based an 1993 electricity rates in Canada. It must be
realized that simple payback calculations should only be used to estimate the potential for savings. A complete analysis would also consider interest rates, as well as the savings due to reduced air conditioning load and any financial incentives that may be offered by local utility.
68 COMPACT FLUORESCENT LAMPS

EXITS SIGNS
ncandescent lamps are the most common light source found in exit signs. With a short bulb life and 8760 hours of operation a year, the maintenance and energy
costs associated with keeping these lights on are significant.
INCANDESCENT SIGNS Incandescent signs usually contain two 15 to 25 watt bulbs and consume approximately 30 to SO watts of power. The capital cost varies from $30 to $130 for
lamp and fixture, due to product options such as vandal proofing, internal battery and aesthetic features. The lighting of each letter in the sign tends to be uneven and bulb
life is short generally I 6 months.
t 1 I 1
kondescent lamps
Cana& 69

Hardware lamp
Retrot% Lamp
fluorescent lamp
Adapter to draw electricity
from existing lamp socket
Y-l- Ballast
I Compact
fluorescent lamp
Other more energy &Gent lamps are available to replace incandescent lamps
in exit signs. These include:
COMPACT FLUORESCENT SIONS These are currently the most popular replacement. Existing exit signs can easily
be retrofitted with compact fluorescents if there is suftXent space inside the sign
to accommodate the lamp and ballast.
Kits are available for hard wire
replacements or a screw-in adapter and
lamp could be used.
New exit lamps designed especially for
compact fluorescent are also on the
market. Compact fluorescent lamps of 5,
7 and 9 watts provide lighting levels similar to incandescent lamps of 25, 40
and 60 watts respectively. They are more expensive than incandescent 5120 to
$300 for lamp and fixture - and the
70 EXIT SIGNS

lighting of each letter is not uniform. Lamp life is generally 1 2 years
(depending on the type of lamp used).
They consume approximately 12 to 20 watts of power.
LED AND MINIATURE INCANDESCENT SIONS
These signs are generally quite expensive ($90 to $150). The LED (light emitting
diode) sign contains LEDs in plastic
tubes which actually form the letters. The Miniature Incandescent Sign
contains bulbs in plastic, with a black and red face which form the letters.
Both the LED and Miniature signs use
plastic as the medium to transmit the light. They require less depth than
incandescent and compact fluorescent signs. They provide a more uniform
illumination of letters, are aesthetically pleasing and consume approximately 2 to
IO watts of power. LED signs are still considered a new, emerging technology
and are not commonly used in today’s
market.
TRITIUM GAS SIGNS The illumination principle of a tritium gas sign is similar to that of a television.
Radioactive tritium gas undergoes beta decay, releasing an electron which strikes
a phosphor-coated tube, shaped into the
word EXIT. A modern tritium exit sign uses 25 Curies (about 2.5 m&grams of
tritium in the gaseous form) and does
not consume electricity. It has a high initial cost but requires very little maintenance. Although lamp life is 10 to
20 years, tritium gas signs are not yet widely used because of their high
purchase price. The capital cost for a
lamp and fixture is approximately $325.
When old tritium gas signs are being replaced with new signs, it is
recommended they be returned to the manufacturer who will dispose of the
radioactive components free of charge.
# of Lamps Per Sign
Total Power Consumed
Energy Cost Per Year
Energy Cost (over 25 years)
Rated Lamp Life (hrsl
Bulb Changes (over 25 years)
tamp Replacement Cost Per Year
tamp Replacement Cost
(over 25 years)
Net Savings Per Year Simple Payback Period
Conversion Cost (includes ;nskr/lation)
Incondouent light Emitting Compact lamps Diode FlUOr.s~mlt
2 1
50 watts 4.5 watts 10 welts
$35.04 $3.15 $7
$876 $79 $175
2,000 2 19,000 10,000
220 0 22
$17.50 $0 $15
$436 $0 $374
$49 $31 1.9 years 1 year
- $95.00 $31 .oo
EXlr SIGNS 71

LIFE CYCLE COMPARISONS In the table above, the life cycle costs of
energy efficient exit signs are shown in
comparison to a standard incandescent sign. Operating time is 8760 hours a year
and the electrical rate is assumed to be 8QlkWh. Note that these costs do not
include labour savings or rebates.
BENEFITS Converting from incandescent to energy
effxient exit signs will result in the
following benefits:
n Reduced Electricity Costs - Direct savings of up to 80% because the
lights use less energy.
w Reduced Maintenance Costs - A longer lamp life means fewer
replacements.
n Reduced Air-Conditioning Loads and Operating Costs - When light is
emitted, heat is generated. With an energy efficient lighting system,
more energy is converted to light
and less to heat.
For further information please contact: Industrial, Commercial and Institutional Programs, Natural Resources Canada, 5X0 Booth Street, 18” Floor, Ottawa, Ontario KlA OE4, Fax: (613) 947.4121
72 EXIT SIGNS
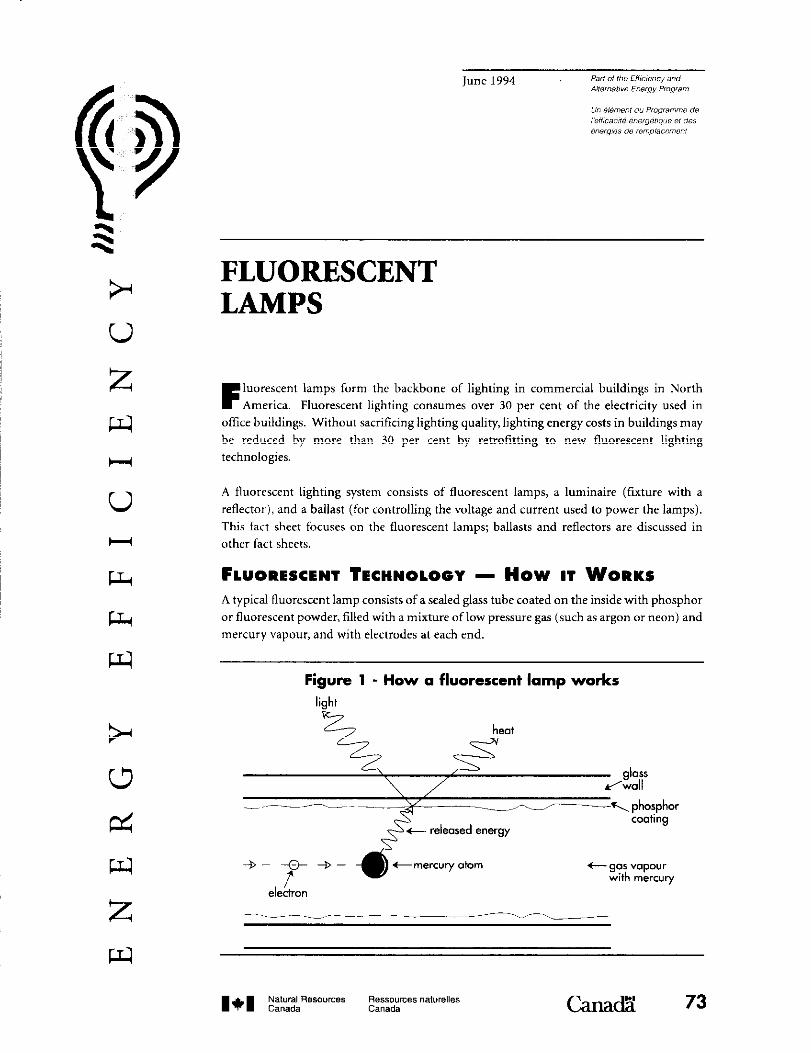
k 0
z w c-l
0
u
w
FLUORESCENT LAMPS
F
luorescent lamps form the backbone of lighting in commercial buildings in North Amerlca . . Fluorescent lighting consumes over 30 per cent of the electricity used in
office buildings. Without sacrificing lighting quality, lighting energy costs in buildings may be reduced by more than 30 per cent by retrofitting to new fluorescent lighting technologies.
A fluorescent lighting system consists of fluorescent lamps, a luminaire (future with a reflector), and a ballast (for controlling the voltage and current used to power the lamps). This fact sheet focuses on the fluorescent lamps; ballasts and reflectors are discussed in other fact sheets.
FLUORESCENT TECHNOLOGY - How IT WORKS A typical fluorescent lamp consists of a sealed glass tube coated on the inside with phosphor or fluorescent powder, filled with a mixture of low pressure gas (such as argon or neon) and mercury vapour, and with elrctrodes at each end.
Figure 1 - How a fluorescent lamp works
light
heat
t gas vapour with mercury
Chad?! 73

When a specified voltage is applied to the lamp, electrons flow from the electrode at one end ta the electrode at the other end. When the electrons collide with the mercury atoms, energy is absorbed and then released. The released energy strikes the phosphor coating and is converted into heat and visible light.
ADVANTAGES OF TNE NEW FLUORESCENT TECNNOLOGY
Today’s new fluorescent lamps have a higher efficacyX which means that more light is output for the same power input.
W Krypton gas in the tubes allows the lamps to opcratc at lower voltages.
n Rare earth phosphors arc used in combination with conventional phosphors in a tw-coat process, resulting in the production of more light and less heat.
Thus, not only are energy costs reduced
directly for the lighting, but indirectly for cooling loads, since the building’s internal heat gains are reduced. (Heating loads may also increase, but it is better to heat a building with a boiler than with an electric light.
Better quality of light The new fluorescent lamps also have a higher colour rendering index (CRI)*. In the past, fluorescent tubes had relatively low CRls, typically between 50 and 70. Now with the
new phosphor coatings, CRIs of over 80 are attainable. Triphosphor T8 lamps, for example, offer CRIs of 75 to 86. ‘The new
fluorescent lamps also come in a variety of colour temperatures*.
Greater lumen maintenance Though not all of the new fluorescents last as long as the standard F40s which have a rated life’ of 20,000 hours, some have a greater
lumen maintenance. This means that the quantity of light output is maintained for a longer percentage of the lamp’s rated life. When designing any lighting system, the fact that lumens decrease over time must be considered.
* Efficacy is a measurement of the efficiency da lamp. ,t is the amOult of visible fight output by a lamp divided by the power “put and is measured in lumens per watt (l”,,W).
Many years ago, when electricity cost less than one sixth of what it does today, it was considered more cost
effective to leave fluorescent lights on all the time. Since turning o fluorescent lamp on and off reduces its
lifetime, it was believed that the extra energy cost for operating the lamps when they were not needed was worth the increase in the lifetime of the Iompr. Now with the higher cost of electricity ond longer losting
lamps, it is better to turn off fluorescent lights when they ore not needed, even for short periods of time.
Question: Should I turn off fluorescent lamps for a short period of time?
74 FWORESCENT LAMP.5

FACTORS TO CONSIDER WNEN SELECTINO FLUORESCENT LAMPS
Diffennt sizes and shapes Aside from the differences in lumen output, efficacy, CRJ and colour temperaturr, other factors need to be considered when selecting a fluorescent lamp. Fluorescent lamps come in different shapes and sizes:
They may be circular, U-shaped, tubular (linear) or compact (Compact fluorescent lamps are discussed in more detail in another fact sheet.);
Sizes range from as little as 4 Watts (W) to larger than 200 W;
Diameters may be as small as 518 of an inch or larger than 2 inches; and
Tubular lamps may be anywhere from 6 to 96 inches long.
Different end connections As well, fluorescent lamps have different end connections, or bases, depending upon the type of circuit in which they are used. Preheat or rapid start lamps have two
electrical contacts at each end. These lamps take a few seconds after being turned on to warm up. Slimline or instant-start lamps have only one electrical contact at each end and, as the name indicates, start up instantaneously.
Table 1 - Some typical fluorescent lamp codes
Code Meaning
Tll Tubular lamp with CI tube diameter of n eighths of on inch
Fn Fluorescent lamp where n refers to either the wattage or the length of the tube in inches.
cw Cool white colour
ww Warm white colour
Temperature limitations Most fluorescent lamps need to be operated at room temperature.
Manufoiurors’ product code The manufacturers’ product code provides information as to the wattage, the size and the shape of the lamp, and sometimes the colour of the light source, though not all manufacturers use the same conventions. Refer to Table I for some of the typical lamp codes.
T8-32W LAMP The 1’8.32W lamp is a very popular replacement for the standard four foot long F40 (T12-40W) often found in office buildings. When switching from T12s to TRs. the ballasts have to be replaced. The lamp manufacturer should be consulted when selecting the ballast to ensure that the components are compatible. When electronic ballasts are used, TES use 30 per cent less energy than T12s operating with standard magnetic ballasts.
In Table 2, three different lighting systems arc compared. All three types of lamps have rated lives of about 20,000 hours. It is interesting to note that although the energy used by the T12-34W system is less than the F40 system, the efficacy of the system is about the same since less light is produced. The TlZ-34W lamps, as with other “reduced- wattage” lamps, were developed to reduce energy consumption in locations which were originally designed with too much lighting. No ballast replacements are required when switching from F4Os to the 34 W system.
FLUORESCENT LAMPS 75

Table 2 - Comparison of different lighting systems
T12-40W (F40) T12.34W T8-32W
8allast POVW
WI
tight output
iId Efficacy
h/W) Energy cost per fixture* ($/fixture/yr]
Energy cost per area**
(WQ/yrJ
magnetic magnetic electronic
96 79 65
6050 5060 5820
63 64 90
$ 17.30 $ 14.20 $11.70
$ A.65 $ 3.85 $ 3.15
CONCLUSIONS Adopting new fluorescent lamp technology Upgrades should ensure adequate light levels involves more than just replacing existing and glare control as well as the compatibility lamps with new ones. Many factors should of all the components in the system. Life- be considered, such as the lumens required, cycle costing, which includes the capital and the efticacy. the impact on the cooling loads, installation costs as well as the operating and and the colour temperature and the CR1 of maintenance costs, should be used to the light. compare the various options.
76 FLUORESCENT LAMPS
u
w
c-l
F4
F4
w
u d w
FLUORESCENT REFLECTOR FIXTURES
R eflectors are mirror-like devices that can be mounted inside existing fluorescent futures to direct light out of the ftiure more efficiently.
By using reflectors, up to half of the lamps in each fixture can be removed, yielding
up to 50% energy savings while reducing light levels only 25-40%.
FLUORESCENT REFLECTOR TECHNOLOOY - How IT WORKS The interior surface of a typical fluorescent fixture has a simple shape with a white enamel paint coating. Inside these futures, the light undergoes multiple diffuse
reflections and loses intensity before leaving the fixture. In contrast, the complex
shape and high reflectance of a custom-designed retrofit reflector causes more light
to be directed out of the fixture onto the task, allowing fewer lamps and ballasts to
be used in a fluorescent lighting system. The amount of light reflected and its
directional behaviour depend upon two characteristics of the reflector material:
specular reflectance and total reflectance.
A material with high specular reflectance has a mirror-like finish. A material with
high total reflectance minim&s the amount of light absorbed by the surface upon
reflection. Properly-designed reflectors redirect the produced light out of the
tixtures with a minimum of reflection. The highest performing reflectors also have
high total reflectance, meaning that during these limited reflections, only a
minimum amount of light is absorbed by the material.
CanadZ 77

The three types of reflector on the
market are:
ADVANTAOES n Reduced Energy Costs - Direct sav-
ings because fewer lamps and ballasts
are used.
n Reduced Maintenance Costs Fewer lamp and ballast replacements are
required.
m Reduced Air Conditioning Load/
Costs - With fewer lamps and bal-
lasts giving off heat, reduced cooling
costs can add up to 20% of the sav-
ings in lighting energy costs.
w Extended Ballast and Lamp Life Operating temperatures are reduced
since half the number of lamps are
used.
Polished Andonized Aluminum these reflectors have a reflectivity of
89.91%. This technology is general-
ly the least expensive and has a life
expectancy of about 20 years.
Silver Film - this type of reflector contains a thin film of silver that is
laminated to an aluminium sub-
strate. Reflectivity ranges between 94
and 97% and the life expectancy is between 10 and 15 years.
Dielectric Coating these reflectors have a dielectric film (consisting of
vaporized metals and inorganic dielectric materials) which is vacu-
um deposited onto anodized alu-
minium. Reflectivity is 95% and the
life expectancy about 25 years.
n Uniform Appearance and Reduced Glare - Retrofit reflectors produce uniform brightness and create the
image of a lamp in place of the
removed lamp. This allows for delamping without impairing furture
aesthetics. The reflector concentrates
the light downward, producing the
positive effect of decreasing glare at
higher viewing angles. This reduces
glare and improves visual comfort
within the work environment.
78 FLUORESCEM REFLECTOR FIXTURES

APPLICATIONS Retrofit reflectors are most commonly
used in conjunction with selective
delamping. By removing two lamps from
a typical four-lamp iixture and installing a
reflector, energy use can be reduced by 50% while light output decreases by 25 to
40%.
This reduction in light output may be
appropriate in spaces that are commonly
overlit, based on levels recommended by the Illuminating Engineering Society. In
other cases, the reflector can be supplemented with higher output lamps (using a higher output T-10 could
recover a third of this lighting loss)
and/or improved lenses to recover much
of the reduction in light output.
Depending on positioning, the remain-
ing lamps and their sockets may need to be relocated within the f&u-e to
maximize efficiency and improve appea-
rance. In addition, unused ballasts
should be disconnected as they continue to draw some power after
delamping.
Where existing light levels are too low, custom-designed retrofit reflectors can
increase average light levels by 15% or more, depending on the condition of the
existing enamel surface. Additional
lighting benefits can occur by cleaning the lamps when the reflectors are
installed. This simple task alone will
boost light output by 5% 20%. Reflectors can also be used with new energy-efficient furtures to give ultra-
high efficiency lighting
Fixture cost depends on type, size and
design of the reflector. The average
installed cost of a 2’ x 4’ recessed ah- minium reflector is $50. The average
installed cost of a 2’ x 4’ recessed silver film reflector is $55.
Refkbr mdfication

EXAMPLE A building has 500 fluorescent fixtures,
each with four 40.watt lamps. These
fixtures can be equipped with reflectors
allowing 2 lamps and one ballast to be
removed from each fxture.
Existing system - 192 watt fluorescent fixture with 4 40-w&t lamps
Rep/ace with - 96 watt Specular Reflector - remove 2 lamps and 1 ballast
Waik sod - 96
% Energy savings - 50
savings per fixtwe - Wattage of existing fixture (watts) 192.
Wattage of removed lamps (watts) 80+
Wattage of ballast (watts) 16
Energy savings (watts) 96
Simple payback - Capital cost to install refiectors $29,000
Annual energy savings $11,520
Simple payback 2.5 years
For further information please contact: Industrial, Commercial and Institutional Programs, Natural Resources Canada, 580 Booth Street, 18’ Floor, Ottawa, Ontario KlA OE4, Fax: (613) 947.4121
80 FLUORESCEM REFLECTOR FIXTURES

HIGH-INTENSITY DISCHARGE LAMPS
T he high-intensity discharge (HID) family of lamps are among the most energy efficient
light sources available. There are several areas in which incandescent and fluorescent
lamps are not the optimum lighting choice. HID lamps offer excellent optical control, very
high lumen (lots of light), high efficacy, long life, economical operation and rugged
construction, Their bright light makes them better suited for area lighting than task
lighting, and they are particularly good for warehouses, outdoor areas and security. Recent
advances in the technology have made them attractive for commercial applications such as
malls. off&s and recreational facilities.
HID lamps are most economical in applications where they operate for extended periods.
Their long life makes them ideal for locations where replacement is difficult and they save
money in maintenance costs since replacement is less frequent. Their compact size also
allows for easier cleaning and less dirt accumulation. Since they require a warm-up period
and take time to relight after a power interruption, HID lamps should only be used where
such a delay will not cause problems. They are similar to fluorescent lamps in that they
require a ballast for starting.
HID TECHNOLOOY - How IT WORKS Lie fluorescent lamps, HID lamps are considered “discharge” light sources because they
produce light by passing an electric current through a vapour. In fluorescent lamps,
however, the light is produced by the phosphor coating on the tube walls. In HID lamps, the
light is produced by the electric arc itself. The arc discharge also operates at higher pressures
and temperatures than in fluorescent lamps thus the name high intensity discharge.
When a HID lamp is turned on, a small electric arc forms between the starting electrode and
the closest main electrode. This changes the starting gas and metal particles into electrically
charged ions. When there are enough ions (in other words, when the pressure builds to a
Canad 81

certain level), the main arc strikes between the
two main electrodes. The main arc radiates
the intense visible light which we see. The
time delay as the pressure builds in the arc
tube represents the warm-up period
characteristic of all HID lamps. Similarly, a
HID lamp cannot restart until the lamp cools.
In dealing with all lighting technologies, two
important parameters are used to measure
the quality and e&iency of light sources:
Colour Rendering Index (CRI) and Efficacy.
CR1 indicates the effect of a light source on
the colour appearance of objects. The CR1
has a value between 0 and 100 and CRls in
the range of 75 100 are considered
excellent, while CRIs from 60 to 75 are
considered good. Efficacy is a measure of the
efficiency of a light source and is defined as
the ratio of the light output (lumens) to the
energy input (watts). HID lamps have the
highest efficacy values of all lighting
technologies.
THE HID FAMILY High Pressure Sodium Lamps are the most
efficient and economical of the HID family.
They produce a “golden-white” light and are
available in clear, diffuse-coated and
improved colour variations. The clear and
diffuse-coated lamps have a CRI of
approximately 32. The improved colour
lamps yield a higher CRI value of 70 but have
a lower lamp life and reduced efficacy
because they operate at increased pressure.
The range of efficacies for high pressure
sodium lamps is 50 to 140 lumens/watt, and
lamp life is typically 24,000 hours. HPS
lamps have the shortest warm up and restrike
times of all the HID sources requiring only 3
minutes to start and I minute to restrike. The
82 HIGH IMENSIN DISCHARGE LAMPS

availability of 35 to 50 watt HPS lamps
provide a superior alternative to the popular
150 watt incandescent PAR downlighting
system. They are four times more efficient
and can last up to six times longer. Being a
point source they offer good optical control
and can be used for highlighting. They tend
to be used in applications where colour is of
less importance. Clear lamps are used in
street lighting, floodlighting and industrial
applications. Coated lamps are used in area/
floodlighting, security lighting, industrial
and commercial indoor lighting and parking
lot applications.
Metal Halide Lamps are the most efficient
“white light” source, with an efficacy of
about 50 to 110 lumens/watt, and also come
in clear and phosphor-coated varieties. The
clear lamps produce a slightly bluish-white
colour at a CR1 of approximately 65. The
phosphor-coated lamps produce a warmer
light with a CR1 of about 70. Lamps can last
as long as 20,000 hours. Common
applications include area lighting, parking
lot lighting, security lighting and building
floodlighting. They can also be used for
landscape lighting, sign lighting and walkway
lighting. Because mercury vapour and metal
halide lamps operate under high pressure
and very high temperaturr, the correct
fixtures must be used at all times.
Mercury Vapour Lamps were the first type of
HID lamp invented. They are available in two
variations: clear and phosphor-coated. The
clear mercury vapour lamps give off a bluish-
white light and have a poor CR1 of about 22.
The phosphor-coated type produce better
colour rendition with a CR1 of 50. In terms
of efticacy, with a range of 20 to 85
lumens/watt, mercury vapour lamps are the
heat rhidd
HIGH INlENSlTy DISCHARGE LAMPS 83

least efficient HID lamp and rank in between
incandescent and fluorescent. Lamp life can
be up t” 24,000 hours. Used primarily in
retail, industrial interior and street lighting
applications, these lamps are currently being
phased “ut in favour of the more efficient
HID lamps such as high prcssurc sodium and
metal halide.
Low Pressure Sodium Lamps, while not true
HID lamps, arc the most efficient light
source currently available, with efficacies
ranging from IO0 t” more than 220 lumens
per watt. LPS lamps also differ from other
HID sources in that their light source is
linear (tube) rather than a point source. This
makes it more appropriate where there is a
low mounting height and the need for diffuse
light. Lamps last an average of 18,000 hours.
LPS lamps can be relit in less than one
minute, suffer no loss of light output “ver
their life, and can operate in very cold
temperatures. They produce yellow
monochromatic light, and make everything
appear either yellow or muddy in colour.
Colour rendition produced is so low that a
CR1 value has not been assigned, and use of
these lamps is restricted to road lighting,
security lighting, area floodlighting and
warehousing applications where colour
rendering is not important.
Comparison Mercury vopur lamps
table between petal halide lamps different HID High pressure sodium lamps Fixtures tow pressure sodium lamps
Rated Avemge Life Sizes Efficacy
(hours) fwd (lumens/watt]
24,000+ 40-l ,250 1 O-63
1 o,oco-20,000 32.1,500 50-l 10
24,000 35.1,000 50-140
14,000-l 8,Oco 18-180 1 oo-220+
EXAMPLE Consider the following replacement examples. Assume 4,000 hours of operation per year and an electricity rate of WkWh.
Replace existing 500 watt Incandescent lamp with 100 watt High-Pressure Sodium lamp plus 35 watt ballast.
Watts saved = 365 % Energy savings = 73 Annual savings per fvaure = $116.80
Replace 2 x 400 watt Mercury Vapour lamps plus 80 watt ballast with 400 watt High-Pressure Sodium lamp plus 75 watt ballast.
Watts saved = 405 % Energy savings = 46
Annual savings per fixture = $129.60
For further information please contact: Industrial, Commercial and Institutional Programs, Natural Resources Canada, 580 Booth Street, IS” Floor, Ottawa, Ontario KIA OE4, Fax: (613) 947-4121
References

H
0
H
F4
F4
w
z w
OCCUPANCY SENSORS
ccupancy sensors, commonly used as motion detectors for security systems, are now O- bang used with lighting control systems to save electricity. By activating the lighting system only when human motion is detected, these automated control devices lower energy costs by reducing the time a lighting system operates. They also offer additional convenience by eliminating the need for manual operation of the lighting system.
SENSOR TECHNOLOGY - How IT WORKS An occupancy sensor detects and responds to motion through the use of a motion sensor and an automatic switching device. The majority have either infrared or ultrasonic motion sensors which may be equipped with an override switch*, a signal sensitivi~ adjustment and a time d&f adjustment.
n Infrared motion detectors respond to heat. They sense changes in patterns of heat radiated by objects that are warmer than their surroundings, such as a person waking across a room. They are passive devices that only receive a signal from within a particular line of sight.
n Ultrasonic motion detectors sense motion with ultrasound. These are active devices since they send out an inaudible tone, which is capable of bouncing off walls and around corners. The returning tone is compared with the tone originally sent out, and any change in the tone’s frequency indicates motion in the controlled space.
n Some occupanq sensors rely on both infrared and ultrasonic signals to turn lights on. In these sensors, usually only one signal is required to maintain the lights on.
Occupancy sensor lighting control systems are available in two different configurations: a wall-switch oa:upancy xnmr and a ceiling- DT wall-mounted unit.
Cana& 85

Wcdl-Switch Occupancy Sensors Wall-switch occupancy sensors replace existing wall-switches and do not require new wiring. They usually rely on infrared motion sensors which have limited fields of view and typically cover up to 50 square meters (500 square feet) of floor area. As a result, wall-switch units are best suited to small enclosed spaces, such as small classrooms. meeting rooms, storage rooms, dressing rooms, computer rooms, individual offices and small lobbies.
Ceiling- and Wall-Mounted Units A ceiling- or wall-mounted system consists of a remote motion sensor connected by low- voltage control wires to the automatic switching devices controlling the power supplied 10 the lights. These systems may contain infrared or ultrasonic motion sensors mounted on the wall or ceiling to optimize the field of view. The sensors typically cover up to 225 square meters (2,250 square feet) of floor area and are best suited to large open areas such as large classrooms, partitioned office space, gymnasiums. warehouses, banquet rooms, corridors, cafeterias and lobbies.
ADVANTAOES OF THE TECNNOLOOY Savings in electricity cash Occupancy lighting control systems may provide significant savings in energy costs. About 40 per cent of the electricity used in commercial buildings is tbr lighting and sometimes as much as 50 per cent of it is used to light unoccupied space. By turning off lights when they are not needed, occupancy sensors provide savings in two WC?Y%
m Direct savings due to reduction in electricity demand and consumption for the lighting system itself.
n Indirect savings from reducing air conditioning load. Since the lighting system operates for fewer hours, a
building’s internal heat gains are reduced and its cooling load decreased. (Heating loads may also increase, but it is better to heat a building with a boiler than an electric light).
RETROFIT CONSIDERATIONS To properly evaluate and adapt an occupancy sensor control system to an existing lighting system, several issues should be considered. Selecting an occupancy lighting control system depends on such factors as the dimensions of the controlled space, the occupancy load in the space, and the lighting load.
1. Potential for reduced lighting load The potential for reduced lighting load determines whether an occupancy- controlled lighting system is viable. The greater the lighting load being controlled, the more cost effective the installation of these controls becomes.
Similarly, the longer the amount of time that the lights are normally left on when not required, as measured by the control credit*, the greater the opportunity for savings. If continuous illumination is required, or the space is not vacant for periods longer than 15 minutes at any one time, occupancy sensors may not be justifiable in terms of energy
2. Type of lighting
Fluorescent and incandescent lamps On/off occupancy sensor systems work best with fluorescent or incandescent lighting
86 OCCUPANCY SENSORS

systems. Although people sometimes worry that switching a fluorescent lamp on and off will decrease its life, this is not really a concern. Although switching a fluorescent lamp off for short periods of time may reduce the number of hours that the lamp will burn, the extra energy cost for operating the light is more significant than the loss in burning hours, especially now with the rising costs of electricity and longer lasting lamps. In some cases, operating the lights for short periods of time may in fact increase the effective life of the lamp.
Example A standard fluorescent (F40) lamp operating for three hours at a time and burning for 3,500 hours per year will have an effective life of 5.7 years. If the same lamp were operated for only 30 minutes at a time for a total of 1,750 hours per year, it would have an effective life of eight years. In this case, leaving the light on for only short periods of time may have decreased the lamp’s Q@J number of burnina hours, but its effective life was increased due to fewer hours of operation per year.
High intensity discharge (HID) Occupancy sensors are not as suitable for high intensity discharge (HID) lighting, such as metal halide, mercury vapour and high pressure sodium lamps. In particular, HID lamps should not be turned off unless the shut off period is longer than 30 minutes. Rather than completely turning off the lamp when the space is unoccupied, the HID lamp’s special ballasts operate the lamp at a reduced light output (about 35 per cent of the power) and instantly turn on the lamp when the sensor indicates occupancy.
3. Selection and placement When selecting the type and number of occupancy sensors to install, be sure to consider not only the amount of area covered by the motion sensor, but also the shape of the area, be they circular, elliptical, fan
shaped or rectangular. Ceiling height also
affects the number of sensors required for ceiling-mounted systems. As the ceiling height increases, fewer sensors are required.
False triggering is another factor to consider when selecting a sensor and determining its placement. Infrared sensors may be triggered by a mirrored image, heat vents, baseboard heaters or daylight. Ultrasonic sensors may be triggered accidentally by building vibration or other non-human sources of motion. Usually the sensor’s sensitivity can be adjusted to reduce or eliminate false triggering. Another solution is to use sensors that combine both infrared and ultrasound for sensing motion. Manufacturers provide installation instructions on how to avoid false triggering.
EXAMPLE OF SAVINOS A building has 30 small offices with three fluorescent fxturrs per office and open office space with 910 fluorescent furtures. The
lighting systems normally operate 4000 hours a year. It was determined that 30 wall switch units are required for the individual of&es and 100 ceiling-mounted sensors are required for the open off& space. Each fixture contains two standard TIZ-40 W (F40) fluorescent lamps with a standard ballast and consumes 96 Watts (or ,096 kW). A control credit of 35 per cent is assumed for the wall switch units and 30 per cent for the ceiling-mounted systems.
Figure 1 shows the amount of savings which can be achieved by installing occupancy sensors in this building. The following equation was used to determine the annual energy savings for the lighting system.
Annual = Control x Number x Kilowatts x Hours x Electricity Energy Credit of Per of Rote Swings WI Fixtures Fixture Operation [S/kWhl
weor IkW) (bouts)
OCCUPANCY SENSORS 87

Figure 1 - Annual Li and Simple Pa J
hting Energy savings ack far installing
occupancy sensors in the example
14ooor T7
The higher the electricity rate, the greater the savings. In 1993, commercial customers in Canada were paying between $0.045 to $0.1 I per kilowatt-hour (kWh) of electricity, including taxes and demand charges. In other words, in this example, occupancy sensors would provide between 55,000 and $12,000 of savings per year.
Ii the wall-switch units cost $110 each and the ceiling-mounted sensors cost $270 each, the capital cost would be $30,300 and the simple payback would be calculated as follows:
Simple Payback = Capital Cost Annual Energy
(year4 I$) + Savings
WY*)
As shown in Figure I, the simple payback period varies from 2 to 6 years, depending on the electricity rate. It must be realized that simple payback calculations should only be used to estimate the potential for savings. To properly evaluate systems, a complete liie- cycle analysis should be conducted which would include the capital costs, operating and maintenance costs (including savings due to a reduction in the air conditioning load) and interest rates, as well as any financial incentives offered by local utilities,
88 OCCUPANCY SENSORS

T E C H N I C A L F A C T S H E E T S
R E A D E R S ’ S U R V E YYour opinions matter to us. To help us ensure that there series of factsheets meet your needs, we would
appreciate if you could take a few minutes to answer this questionnaire. Please return it by fax at
(613) 947-4121.
1 Which topics do you usually focus on when reading the factsheets?• Building Systems • Heating and Cooling Systems• Motors • Windows and Lighting
2 Are the factsheets useful to you? • Yes • No
W h y ?
3 Please rate the factsheets on the following characteristics:Exce l l en t Good Fair Comments
Easy to understand • • •
Length • • •
Format or organization • • •
Photos/graphics • • •Timeliness • • •
6 Do you prefer to receive information from the Industrial, Commercial and Institutional Programs by:• Newsletter • Fax Bulletin • Newspaper articles • Disk• Publications • Advertisements • Internet • CD-Rom• Other
6 Which of the following energy efficiency topics interest you the most:• Financing • Allies Network • Training• Technical Information • Employees & Tenants Package • Human Resources• Energy Efficiency Planning • Energy Performance Contracting • Other
6 Please give us any other comments you may have about this series of factsheets.
Thank you for your assistance!
Do you wish to be added or removed from our mailing list? Have you changed your address? If so,please provide us with the following information:• Please add my name to your mailing list.• Please delete my name from your mailing list • Please add my colleague to your mailing listName Name
T i t l e
Address Address
Organization Organization
Industry I n d u s t r y