technical appendix appendix a - caltrans - california ... · a-i appendix table of contents...
TRANSCRIPT

2018 CALIFORNIA STATE RAIL PLAN
Technical Appendix
Appendix A
October 2017

A-ii

A-i
Appendix Table of Contents Appendix A.2 Existing Rail System ............................................................................................................................ 1
Existing and Proposed Passenger Rail Lines, Corridors, and Services .......................................... 1
Intercity Passenger Rail Services ................................................................................................. 1
Commuter Rail ................................................................................................................................... 9
All COASTER Passenger Intermodal Facilities...................................................................... 12
Existing Passenger Rail Performance ...................................................................................... 15
California’s Freight Railroad System ....................................................................................... 22
Rail Line Abandonments ............................................................................................................. 22
Major Rail Projects Funded under Section 130 .................................................................. 24
Trends and Forecasts ................................................................................................................................... 26
Highway Congestion Analysis ................................................................................................... 26
Freight Demand and Growth ..................................................................................................... 32
California Rail Funding ................................................................................................................................ 34
State Funding .................................................................................................................................. 34
Appendix A.6 Proposed Passenger Improvements and Investments ................................................... 35
Overview of Capital Cost Methodology ............................................................................................... 35
Definitions ......................................................................................................................................... 35
Introduction...................................................................................................................................... 36
Purpose .............................................................................................................................................. 36
Estimate Methodology and Criteria ....................................................................................................... 37
Estimate Methodology ................................................................................................................. 37
Estimate Criteria .............................................................................................................................. 38
Emissions Inventory Analysis Supporting Information ................................................................... 43
2010 and 2040 Freight Locomotive Emissions Analysis .................................................. 43
2010 and 2040 Passenger Locomotive Emissions Analysis ............................................ 43
2010 and 2040 On-Road Vehicle Emissions Analysis ....................................................... 44
2020 and 2025 Emissions ............................................................................................................ 44
Economic Benefits ......................................................................................................................................... 58
2027 and 2040 Capital Projects Details ................................................................................................ 61
Appendix A.7 Public Outreach and Stakeholder Involvement Details ..................................................... 68
Freight Meetings ........................................................................................................................................... 68
Network Integration Strategic Service Planning (NI SSP) Agency Meetings .......................... 69
Advocacy Meetings ...................................................................................................................................... 70
Native American Tribes that Received Consultation ....................................................................... 71
Public Survey Results ................................................................................................................................... 71
Survey Results .................................................................................................................................. 72
Detailed Responses ....................................................................................................................... 72
A-ii
Respondent Demographics ........................................................................................................ 78
Conclusion ........................................................................................................................................ 78
2018 California State Rail Plan
Appendix A.2
Existing Rail System
October 2017
A-1
Appendix A.2
Existing Rail System
Existing and Proposed Passenger Rail Lines, Corridors, and Services
Intercity Passenger Rail Services
State-Supported Routes – Detail
Amtrak Thruway Bus Network
An extensive network of dedicated Amtrak Thruway buses supports intercity passenger rail by
providing dedicated connecting service to markets without direct passenger rail service. Amtrak
Thruway buses offer connections between the Pacific Surfliner in the south and the San Joaquin
and Capitol Corridor routes in the north, providing access to dozens of communities between.
Additional bus routes serve destinations from McKinleyville and Redding in the north, to
Coachella Valley and San Diego in the south, and Reno and Las Vegas in the east. Amtrak
Thruway buses provide connections to many popular destinations in California, including
Yosemite National Park, Napa Valley, Palm Springs, Lake Tahoe, and the Monterey Bay. Amtrak
Thruway bus service is extended only to passengers who transfer directly to/from either State-
supported or Amtrak long-distance rail routes.
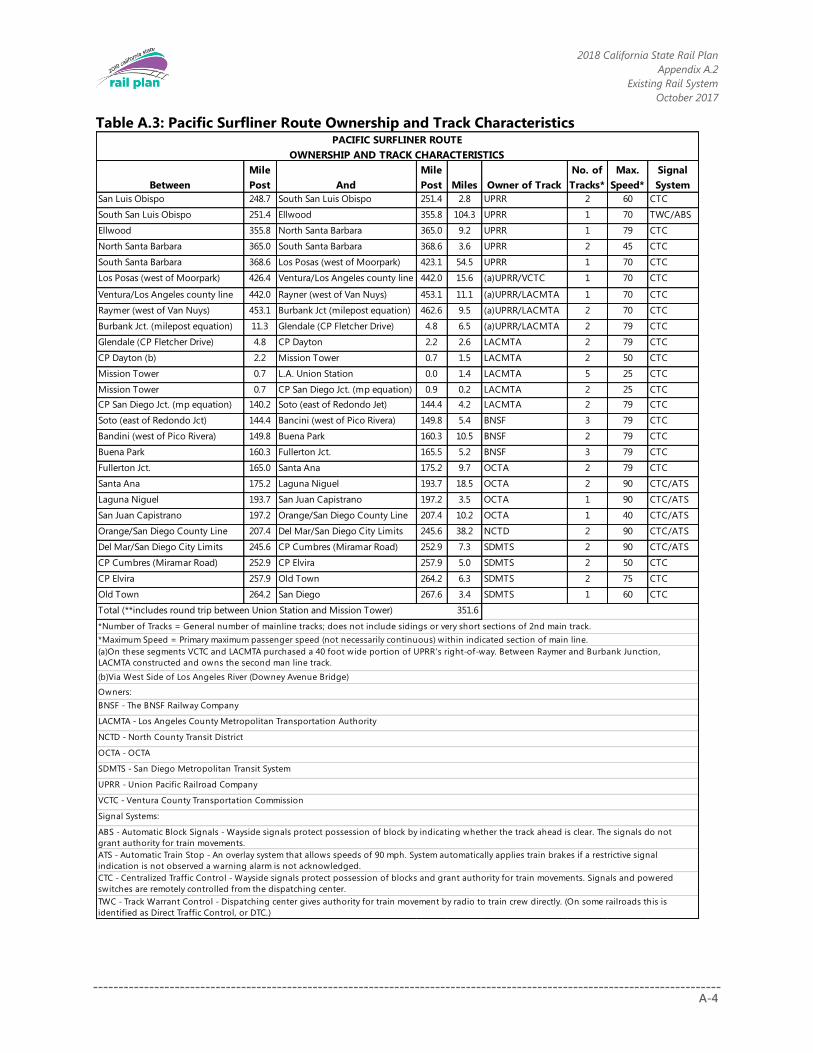
Ownership and Track Characteristics1
The ownership and track characteristics are shown in Table A.1 for the San Joaquin route;
Table A.2 for the Capitol Corridor route; and Table A.3 for the Pacific Surfliner route.
1 Caltrans, 2013 California State Rail Plan, 2013.
Notes: SJJPA provided updated information for the San Joaquin since the 2013 Rail Plan. LOSSAN
confirmed that the information on the Pacific Surfliner from the 2013 Rail Plan is still current.

2018 California State Rail Plan
Appendix A.2
Existing Rail System
October 2017
A-2
Table A.1: San Joaquin Route Ownership and Track Characteristics
Between
Mile
Post And
Mile
Post Miles Owner of Track
No. of
Tracks*
Max.
Speed*
Signal
System
Oakland Jack London Square 7.0 Oakland 10th St 4.2 2.8 UPRR 2 50 CTC
Oakland 10th St 2.2 Martinez 31.6 29.4 UPRR 2 79 CTC
Martinez 31.6 Port Chicago 40.8 6.1 UPRR 1 79 CTC
Port Chicago 1163.5 Sacramento 1121.1 42.4 BNSF 1-2 79 CTC
Sacramento 89.1 Elvas 91.7 2.6 UPRR 2 35 CTC
Elvas 38.9 Stockton 84.1 45.2 UPRR 1 60 CTC
Stockton 1121.1 Bakersfield 886.9 234.2 BNSF 1 79 CTC
CTC - Centralized Traffic Control - Wayside signals protect possession of blocks and grant authority for train movements. Signals and powered
switches are remotely controlled from the dispatching center.
UPRR - Union Pacific Railroad Company
Signal Systems:
Owners:
BNSF - The BNSF Railway Company
SAN JOAQUINS ROUTE
OWNERSHIP AND TRACK CHARACTERISTICS
Total 362.7
*Number of Tracks = General number of mainline tracks; does not include sidings or very short sections of 2nd main track.
*Maximum Speed = Primary maximum passenger speed (not necessarily continuous) within indicated section of main line.

2018 California State Rail Plan
Appendix A.2
Existing Rail System
October 2017
A-3
Table A.2: Capitol Corridor Route Ownership and Track Characteristics
Between
Mile
Post And
Mile
Post Miles Owner of Track
No. of
Tracks*
Max.
Speed*
Signal
System
Auburn 124.3 Rocklin 110.5 13.8 UPRR 1 50 ABS/CTC
Rocklin 110.5 Roseville 106.4 4.1 UPRR 2 40 CTC
Roseville 106.4 Elvas 91.8 14.6 UPRR 2 79 CTC
Elvas 91.8 Sacramento 88.9 2.9 UPRR 2 35 CTC
Sacramento 88.9 Sacramento River 88.5 0.4 UPRR 2 20 CTC
Sacramento River 88.5 Davis 75.4 13.1 UPRR 2 79 CTC
Davis 75.4 Martinez 31.7 43.7 UPRR 2 79 CTC
Martinez 31.7 Oakland 10th St 4.2 29.5 UPRR 2 79 CTC
Oakland 10th St 4.2 Oakland Jack London Square 7.0 2.8 UPRR 2 50 CTC
Oakland Jack London Square 7.0 North Elmhurst 13.5 6.5 UPRR 2 79 CTC
North Elmhurst 13.5 Niles Junction 29.7 16.2 UPRR 1 79 CTC
Niles Junction 29.7 Newark 31.0 5.2 UPRR 2 79 CTC
Newark 31.0 Santa Clara 44.7 13.7 UPRR 1 70 CTC
Santa Clara 44.7 San Jose 47.5 2.8 PCJPB 3 40 CTC
CTC - Centralized Traffic Control - Wayside signals protect possession of blocks and grant authority for train movements. Signals and powered
switches are remotely controlled from the dispatching center.
Signal Systems:
ABS - Automatic Block Signals - Wayside signals protect possession of block by indicating whether the track ahead is clear. The signals do not
grant authority for train movements.
Owners:
BNSF - The BNSF Railway Company
PCJPB - Peninsula Corridor Joint Powers Board
CAPITOL CORRIDOR ROUTE
OWNERSHIP AND TRACK CHARACTERISTICS
Total (**includes rand trip between Union Station and Mission Tower) 169.3
*Number of Tracks = General number of mainline tracks; does not include sidings or very short sections of 2nd main track.
*Maximum Speed = Primary maximum passenger speed (not necessarily continuous) within indicated section of main line.
2018 California State Rail Plan
Appendix A.2
Existing Rail System
October 2017
A-4
Table A.3: Pacific Surfliner Route Ownership and Track Characteristics
Between
Mile
Post And
Mile
Post Miles Owner of Track
No. of
Tracks*
Max.
Speed*
Signal
System
San Luis Obispo 248.7 South San Luis Obispo 251.4 2.8 UPRR 2 60 CTC
South San Luis Obispo 251.4 Ellwood 355.8 104.3 UPRR 1 70 TWC/ABS
Ellwood 355.8 North Santa Barbara 365.0 9.2 UPRR 1 79 CTC
North Santa Barbara 365.0 South Santa Barbara 368.6 3.6 UPRR 2 45 CTC
South Santa Barbara 368.6 Los Posas (west of Moorpark) 423.1 54.5 UPRR 1 70 CTC
Los Posas (west of Moorpark) 426.4 Ventura/Los Angeles county line 442.0 15.6 (a)UPRR/VCTC 1 70 CTC
Ventura/Los Angeles county line 442.0 Rayner (west of Van Nuys) 453.1 11.1 (a)UPRR/LACMTA 1 70 CTC
Raymer (west of Van Nuys) 453.1 Burbank Jct (milepost equation) 462.6 9.5 (a)UPRR/LACMTA 2 70 CTC
Burbank Jct. (milepost equation) 11.3 Glendale (CP Fletcher Drive) 4.8 6.5 (a)UPRR/LACMTA 2 79 CTC
Glendale (CP Fletcher Drive) 4.8 CP Dayton 2.2 2.6 LACMTA 2 79 CTC
CP Dayton (b) 2.2 Mission Tower 0.7 1.5 LACMTA 2 50 CTC
Mission Tower 0.7 L.A. Union Station 0.0 1.4 LACMTA 5 25 CTC
Mission Tower 0.7 CP San Diego Jct. (mp equation) 0.9 0.2 LACMTA 2 25 CTC
CP San Diego Jct. (mp equation) 140.2 Soto (east of Redondo Jet) 144.4 4.2 LACMTA 2 79 CTC
Soto (east of Redondo Jct) 144.4 Bancini (west of Pico Rivera) 149.8 5.4 BNSF 3 79 CTC
Bandini (west of Pico Rivera) 149.8 Buena Park 160.3 10.5 BNSF 2 79 CTC
Buena Park 160.3 Fullerton Jct. 165.5 5.2 BNSF 3 79 CTC
Fullerton Jct. 165.0 Santa Ana 175.2 9.7 OCTA 2 79 CTC
Santa Ana 175.2 Laguna Niguel 193.7 18.5 OCTA 2 90 CTC/ATS
Laguna Niguel 193.7 San Juan Capistrano 197.2 3.5 OCTA 1 90 CTC/ATS
San Juan Capistrano 197.2 Orange/San Diego County Line 207.4 10.2 OCTA 1 40 CTC/ATS
Orange/San Diego County Line 207.4 Del Mar/San Diego City Limits 245.6 38.2 NCTD 2 90 CTC/ATS
Del Mar/San Diego City Limits 245.6 CP Cumbres (Miramar Road) 252.9 7.3 SDMTS 2 90 CTC/ATS
CP Cumbres (Miramar Road) 252.9 CP Elvira 257.9 5.0 SDMTS 2 50 CTC
CP Elvira 257.9 Old Town 264.2 6.3 SDMTS 2 75 CTC
Old Town 264.2 San Diego 267.6 3.4 SDMTS 1 60 CTC
Owners:
PACIFIC SURFLINER ROUTE
OWNERSHIP AND TRACK CHARACTERISTICS
Total (**includes round trip between Union Station and Mission Tower) 351.6
*Number of Tracks = General number of mainline tracks; does not include sidings or very short sections of 2nd main track.
TWC - Track Warrant Control - Dispatching center gives authority for train movement by radio to train crew directly. (On some railroads this is
identified as Direct Traffic Control, or DTC.)
ATS - Automatic Train Stop - An overlay system that allows speeds of 90 mph. System automatically applies train brakes if a restrictive signal
indication is not observed a warning alarm is not acknowledged.
CTC - Centralized Traffic Control - Wayside signals protect possession of blocks and grant authority for train movements. Signals and powered
switches are remotely controlled from the dispatching center.
UPRR - Union Pacific Railroad Company
VCTC - Ventura County Transportation Commission
Signal Systems:
ABS - Automatic Block Signals - Wayside signals protect possession of block by indicating whether the track ahead is clear. The signals do not
grant authority for train movements.
BNSF - The BNSF Railway Company
LACMTA - Los Angeles County Metropolitan Transportation Authority
NCTD - North County Transit District
OCTA - OCTA
SDMTS - San Diego Metropolitan Transit System
*Maximum Speed = Primary maximum passenger speed (not necessarily continuous) within indicated section of main line.
(a)On these segments VCTC and LACMTA purchased a 40 foot wide portion of UPRR's right-of-way. Between Raymer and Burbank Junction,
LACMTA constructed and owns the second man line track.
(b)Via West Side of Los Angeles River (Downey Avenue Bridge)

2018 California State Rail Plan
Appendix A.2
Existing Rail System
October 2017
A-5
Amtrak Thruway Bus Maps
Maps of the Amtrak Thruway Bus routes are shown on Exhibit A.1 for Southern California;
Exhibit A.2 for Central California; and Exhibit A.3 for Northern California.
Exhibit A.1: Amtrak Thruway Bus Service (Southern California)

2018 California State Rail Plan
Appendix A.2
Existing Rail System
October 2017
A-6
Exhibit A.2: Amtrak Thruway Bus Service (Central California)

2018 California State Rail Plan
Appendix A.2
Existing Rail System
October 2017
A-7
Exhibit A.3: Amtrak Thruway Bus Service (Northern California)
2018 California State Rail Plan
Appendix A.2
Existing Rail System
October 2017
A-8
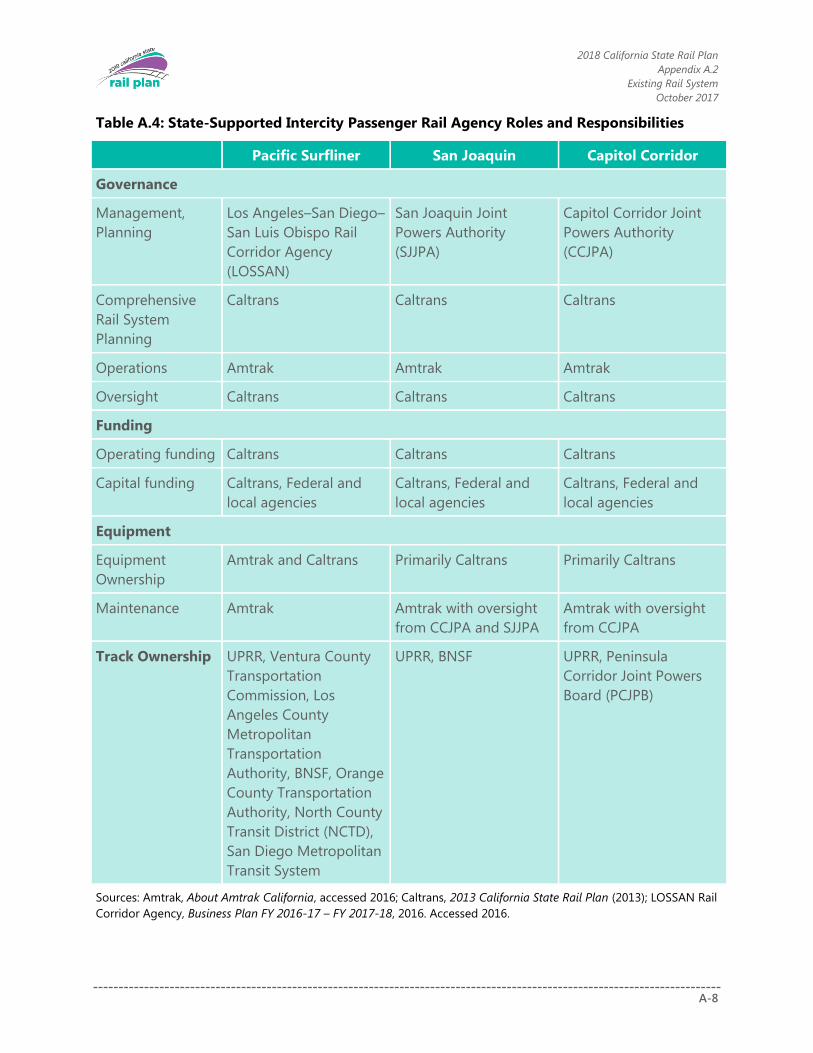
Table A.4: State-Supported Intercity Passenger Rail Agency Roles and Responsibilities
Pacific Surfliner San Joaquin Capitol Corridor
Governance
Management,
Planning
Los Angeles–San Diego–
San Luis Obispo Rail
Corridor Agency
(LOSSAN)
San Joaquin Joint
Powers Authority
(SJJPA)
Capitol Corridor Joint
Powers Authority
(CCJPA)
Comprehensive
Rail System
Planning
Caltrans Caltrans Caltrans
Operations Amtrak Amtrak Amtrak
Oversight Caltrans Caltrans Caltrans
Funding
Operating funding Caltrans Caltrans Caltrans
Capital funding Caltrans, Federal and
local agencies
Caltrans, Federal and
local agencies
Caltrans, Federal and
local agencies
Equipment
Equipment
Ownership
Amtrak and Caltrans Primarily Caltrans Primarily Caltrans
Maintenance Amtrak Amtrak with oversight
from CCJPA and SJJPA
Amtrak with oversight
from CCJPA
Track Ownership UPRR, Ventura County
Transportation
Commission, Los
Angeles County
Metropolitan
Transportation
Authority, BNSF, Orange
County Transportation
Authority, North County
Transit District (NCTD),
San Diego Metropolitan
Transit System
UPRR, BNSF UPRR, Peninsula
Corridor Joint Powers
Board (PCJPB)
Sources: Amtrak, About Amtrak California, accessed 2016; Caltrans, 2013 California State Rail Plan (2013); LOSSAN Rail
Corridor Agency, Business Plan FY 2016-17 – FY 2017-18, 2016. Accessed 2016.
2018 California State Rail Plan
Appendix A.2
Existing Rail System
October 2017
A-9
Commuter Rail
Connecting Services
Caltrain
Caltrain has a direct connection with other major public transportation operators on its route at
various multimodal facilities. These operators include San Francisco Municipal Transportation
Agency (Muni) light rail and buses, BART, SamTrans, Santa Clara VTA light rail and buses,
Alameda-Contra Costa Transit District (AC Transit), the Dumbarton Express bus, and ACE
(commuter service from Stockton to San Jose). ACE shares a terminal with Caltrain at San Jose
Diridon Station.
Caltrain connects directly with the intercity Capitol Corridor and Amtrak’s long-distance Coast
Starlight at the San Jose Diridon Station. Amtrak San Joaquin and Capitol Corridor route feeder
bus stops are located at the Caltrain station in San Francisco. Local transit services link many
Caltrain stations to key city destinations and employment centers. For example, the San Jose
Diridon station is served by multiple Santa Clara VTA bus lines, along with Monterey–Salinas
Transit buses and Highway 17 Express bus service to Santa Cruz. In addition, a variety of shuttles
connect Caltrain stations to major employment sites on the San Francisco Peninsula. Some
shuttles are partially sponsored by Caltrain, and are free and open to the public; while others are
privately operated.
ACE
Bus and rail transit connections and dedicated shuttles are an integral part of the ACE system,
providing a seamless commuting link between stations and workplaces. All stations have some
form of connecting transit. In addition, four stations have direct connections to rail services. The
Stockton station has connections to San Joaquin trains. At the Great America station,
connections can be made with Santa Clara VTA light rail and buses (approximately 750 feet east
of the station) and the Capitol Corridor. At Santa Clara, connections can be made with Caltrain
and the Capitol Corridor; and at San Jose, connections can be made with Caltrain, the Capitol
Corridor, the Amtrak Coast Starlight, and Santa Clara VTA light rail and buses.
Metrolink
Each county has a transit plan to ensure integration of Metrolink service with other transit
systems and transportation modes. The Metrolink fare is designed to provide a free transfer,
either from feeder bus or to local transit at the destination station. Metrolink passengers can
connect with Amtrak trains at Anaheim, Burbank Bob Hope Airport, Camarillo, Chatsworth,
Fullerton, Glendale, Irvine, Moorpark, Oceanside, Oxnard, San Clemente Pier, San Juan
Capistrano, Santa Ana, Simi Valley, and Van Nuys. Metrolink passengers can connect to the
2018 California State Rail Plan
Appendix A.2
Existing Rail System
October 2017
A-10
Metro Red Line/Purple Line subway and the Metro Gold Line light rail at Los Angeles Union
Station (LAUS), to the Metro Green Line at Norwalk (via Norwalk Transit Route 4), to the Metro
Blue Line and the Metro Expo Line at the 7th Street/Metro station, and to the Metro Orange Line
at Chatsworth station, all at no additional charge.
Shuttle service connects the Downtown Burbank and Burbank-Bob Hope Airport stations to the
Burbank Bob Hope Airport terminal. LAUS connects to the State-supported San Joaquin route in
Bakersfield via Amtrak Thruway bus service. In addition, it also connects to Amtrak long-distance
trains, such as the Sunset Limited, Southwest Chief, and Coast Starlight. LAUS also provides
connections with various local and city bus and shuttle services, including direct FlyAway shuttle
service to the Los Angeles International Airport.
Recent light-rail additions, including the Metro Exposition Line to Santa Monica (reachable from
LAUS via the Red or Purple Lines) and the Metro Gold Line Foothill Extension to Azusa, allow
Metrolink passengers to travel to additional areas.
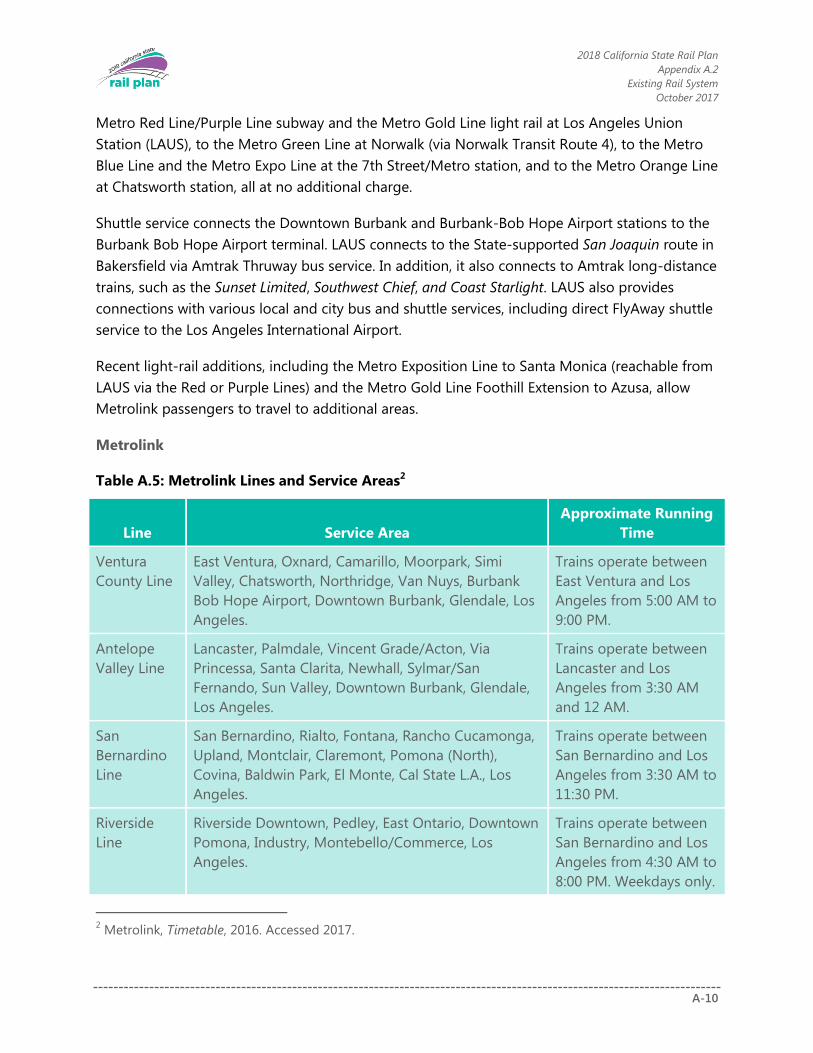
Metrolink
Table A.5: Metrolink Lines and Service Areas2
Line Service Area
Approximate Running
Time
Ventura
County Line
East Ventura, Oxnard, Camarillo, Moorpark, Simi
Valley, Chatsworth, Northridge, Van Nuys, Burbank
Bob Hope Airport, Downtown Burbank, Glendale, Los
Angeles.
Trains operate between
East Ventura and Los
Angeles from 5:00 AM to
9:00 PM.
Antelope
Valley Line
Lancaster, Palmdale, Vincent Grade/Acton, Via
Princessa, Santa Clarita, Newhall, Sylmar/San
Fernando, Sun Valley, Downtown Burbank, Glendale,
Los Angeles.
Trains operate between
Lancaster and Los
Angeles from 3:30 AM
and 12 AM.
San
Bernardino
Line
San Bernardino, Rialto, Fontana, Rancho Cucamonga,
Upland, Montclair, Claremont, Pomona (North),
Covina, Baldwin Park, El Monte, Cal State L.A., Los
Angeles.
Trains operate between
San Bernardino and Los
Angeles from 3:30 AM to
11:30 PM.
Riverside
Line
Riverside Downtown, Pedley, East Ontario, Downtown
Pomona, Industry, Montebello/Commerce, Los
Angeles.
Trains operate between
San Bernardino and Los
Angeles from 4:30 AM to
8:00 PM. Weekdays only.
2 Metrolink, Timetable, 2016. Accessed 2017.

2018 California State Rail Plan
Appendix A.2
Existing Rail System
October 2017
A-11
Line Service Area
Approximate Running
Time
Orange
County Line
Oceanside, San Clemente Pier, San Clemente, San
Juan Capistrano, Laguna Niguel/Mission Viejo, Irvine,
Tustin, Santa Ana, Orange, Anaheim, Fullerton, Buena
Park, Norwalk/Santa Fe Springs, Commerce, Los
Angeles.
Trains operate between
Oceanside and Los
Angeles from 4:30 AM to
12:00 AM.
Inland
Empire-
Orange
County Line
San Bernardino, Riverside Downtown, Riverside La
Sierra, North Main Corona, West Corona, Anaheim
Canyon, Orange, Santa Ana, Tustin, Irvine, Laguna
Niguel/Mission Viejo, San Juan Capistrano, San
Clemente, San Clemente Pier, Oceanside.
Trains operate between
San Bernardino and
Oceanside from 4:30 AM
to 8:30 PM.
91 Line South Perris, Downtown Perris, Moreno Valley /
March Field, Riverside Downtown, Riverside La Sierra,
North Main Corona, West Corona, Fullerton, Buena
Park, Norwalk/Santa Fe Springs, Los Angeles.
Trains operate between
South Perris and Los
Angeles from 4:30 AM to
8:30 PM.
COASTER
All COASTER stations have connecting transit services available. COASTER passengers can
connect with Amtrak trains at Oceanside, Solana Beach, Old Town Station, and the downtown
Santa Fe Depot in San Diego. At Oceanside Transit Center, connections are available to
Metrolink commuter service to Los Angeles and to North County Transit District’s (NCTD’s)
SPRINTER light-rail service to Escondido via Vista and San Marcos. Other stations have
connections to San Diego Transit and San Diego Trolley. Passengers can connect to San Diego
State University at the Old Town Transit Center via the San Diego Trolley’s Green Line, and bus
service from Santa Fe Depot to the San Diego International Airport. Transit connections in
northern San Diego County are provided by NCTD BREEZE buses, including several services
branded as “COASTER Connection” routes that provide peak-hour commute shuttle service to
COASTER stations in the Sorrento Valley.
2018 California State Rail Plan
Appendix A.2
Existing Rail System
October 2017
A-12
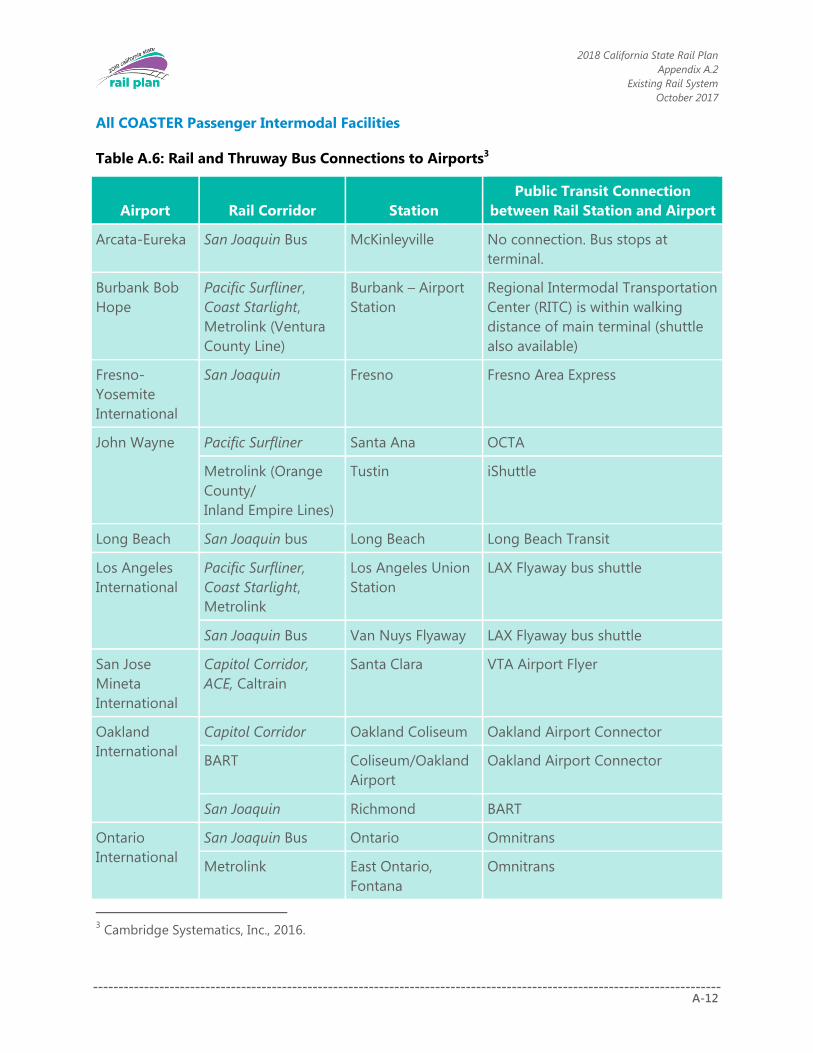
All COASTER Passenger Intermodal Facilities
Table A.6: Rail and Thruway Bus Connections to Airports3
Airport Rail Corridor Station
Public Transit Connection
between Rail Station and Airport
Arcata-Eureka San Joaquin Bus McKinleyville No connection. Bus stops at
terminal.
Burbank Bob
Hope
Pacific Surfliner,
Coast Starlight,
Metrolink (Ventura
County Line)
Burbank – Airport
Station
Regional Intermodal Transportation
Center (RITC) is within walking
distance of main terminal (shuttle
also available)
Fresno-
Yosemite
International
San Joaquin Fresno Fresno Area Express
John Wayne Pacific Surfliner Santa Ana OCTA
Metrolink (Orange
County/
Inland Empire Lines)
Tustin iShuttle
Long Beach San Joaquin bus Long Beach Long Beach Transit
Los Angeles
International
Pacific Surfliner,
Coast Starlight,
Metrolink
Los Angeles Union
Station
LAX Flyaway bus shuttle
San Joaquin Bus Van Nuys Flyaway LAX Flyaway bus shuttle
San Jose
Mineta
International
Capitol Corridor,
ACE, Caltrain
Santa Clara VTA Airport Flyer
Oakland
International
Capitol Corridor Oakland Coliseum Oakland Airport Connector
BART Coliseum/Oakland
Airport
Oakland Airport Connector
San Joaquin Richmond BART
Ontario
International
San Joaquin Bus Ontario Omnitrans
Metrolink East Ontario,
Fontana
Omnitrans
3 Cambridge Systematics, Inc., 2016.

2018 California State Rail Plan
Appendix A.2
Existing Rail System
October 2017
A-13
Airport Rail Corridor Station
Public Transit Connection
between Rail Station and Airport
Palm Springs San Joaquin Bus Palm Springs No connection. Bus stops at
terminal.
Sacramento
International
Capitol Corridor,
San Joaquin trains
and buses
Sacramento Yolobus
San Diego
International
Pacific Surfliner,
COASTER
Santa Fe Depot SDMTS
San Francisco
International
BART San Francisco
International
Airport
AirTrain
Caltrain Millbrae BART
a Thruway bus services listed provide airport connections from Amtrak stations
Sonoma-Marin Area Rail Transit (SMART)
Feeder bus and shuttle services will connect to multiple SMART stations. The northern terminus
of the Phase 1 line is at Sonoma County Airport. Phase 2 – South will extend to Larkspur Ferry,
which services San Francisco.4
4 Sonoma-Marin Area Rail Transit, What is SMART?, 2016. Accessed 2016.
2018 California State Rail Plan
Appendix A.2
Existing Rail System
October 2017
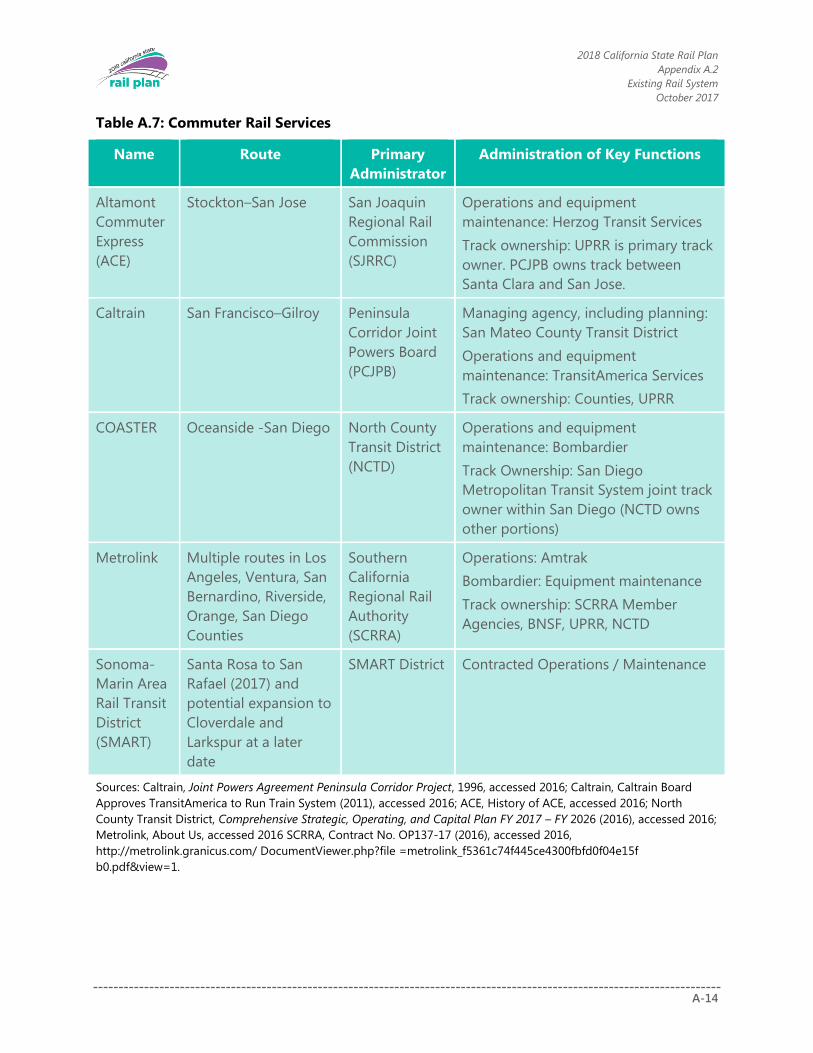
A-14
Table A.7: Commuter Rail Services
Name Route Primary
Administrator
Administration of Key Functions
Altamont
Commuter
Express
(ACE)
Stockton–San Jose San Joaquin
Regional Rail
Commission
(SJRRC)
Operations and equipment
maintenance: Herzog Transit Services
Track ownership: UPRR is primary track
owner. PCJPB owns track between
Santa Clara and San Jose.
Caltrain San Francisco–Gilroy Peninsula
Corridor Joint
Powers Board
(PCJPB)
Managing agency, including planning:
San Mateo County Transit District
Operations and equipment
maintenance: TransitAmerica Services
Track ownership: Counties, UPRR
COASTER Oceanside -San Diego North County
Transit District
(NCTD)
Operations and equipment
maintenance: Bombardier
Track Ownership: San Diego
Metropolitan Transit System joint track
owner within San Diego (NCTD owns
other portions)
Metrolink Multiple routes in Los
Angeles, Ventura, San
Bernardino, Riverside,
Orange, San Diego
Counties
Southern
California
Regional Rail
Authority
(SCRRA)
Operations: Amtrak
Bombardier: Equipment maintenance
Track ownership: SCRRA Member
Agencies, BNSF, UPRR, NCTD
Sonoma-
Marin Area
Rail Transit
District
(SMART)
Santa Rosa to San
Rafael (2017) and
potential expansion to
Cloverdale and
Larkspur at a later
date
SMART District Contracted Operations / Maintenance
Sources: Caltrain, Joint Powers Agreement Peninsula Corridor Project, 1996, accessed 2016; Caltrain, Caltrain Board
Approves TransitAmerica to Run Train System (2011), accessed 2016; ACE, History of ACE, accessed 2016; North
County Transit District, Comprehensive Strategic, Operating, and Capital Plan FY 2017 – FY 2026 (2016), accessed 2016;
Metrolink, About Us, accessed 2016 SCRRA, Contract No. OP137-17 (2016), accessed 2016,
http://metrolink.granicus.com/ DocumentViewer.php?file =metrolink_f5361c74f445ce4300fbfd0f04e15f
b0.pdf&view=1.
2018 California State Rail Plan
Appendix A.2
Existing Rail System
October 2017
A-15
Existing Passenger Rail Performance
This section presents performance information for the three State-supported intercity passenger
rail routes.
State-Supported Passenger Rail System Performance
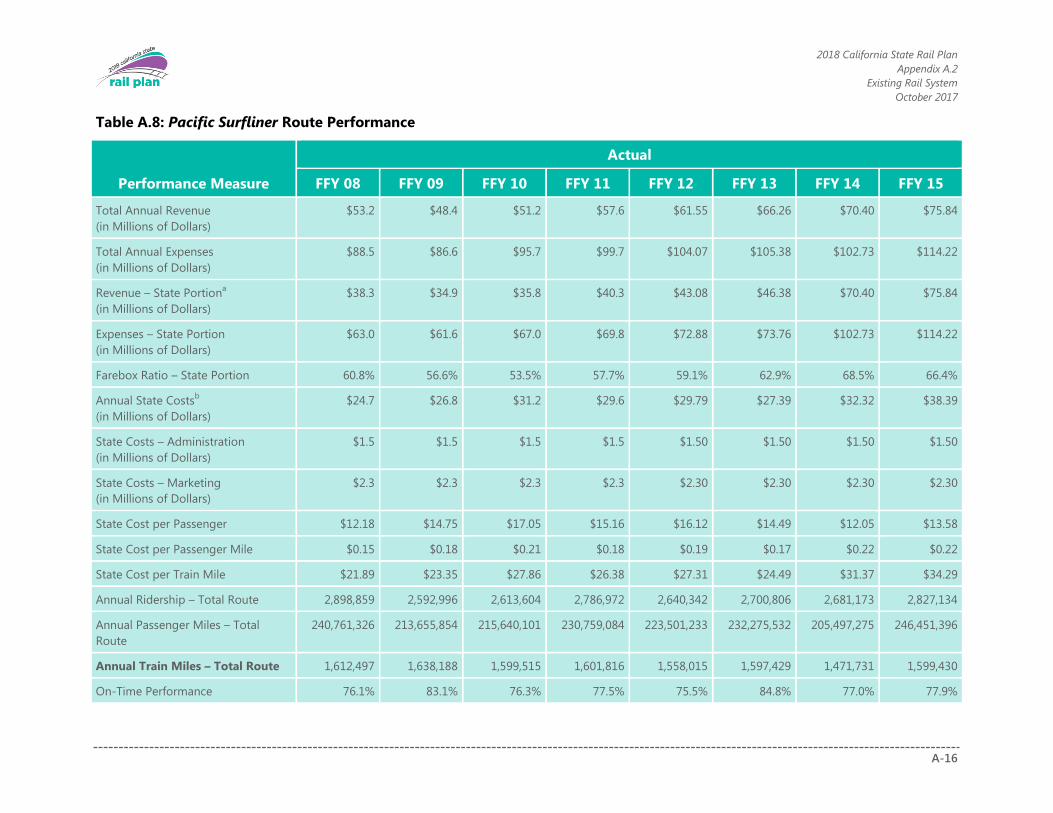
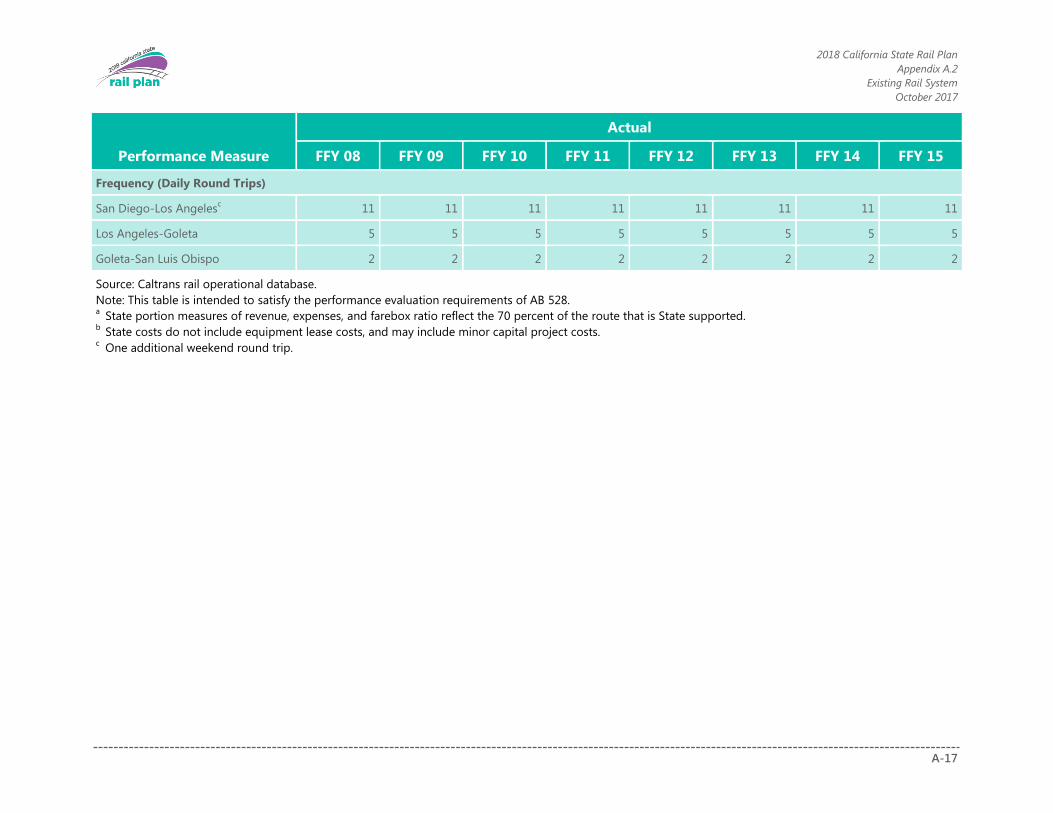
Table A.8, Table A.9 and Table A.10 provide route-specific performance for the Pacific
Surfliner, San Joaquin, and Capitol Corridor, respectively.
2018 California State Rail Plan
Appendix A.2
Existing Rail System
October 2017
A-16
Table A.8: Pacific Surfliner Route Performance
Performance Measure
Actual
FFY 08 FFY 09 FFY 10 FFY 11 FFY 12 FFY 13 FFY 14 FFY 15
Total Annual Revenue
(in Millions of Dollars)
$53.2 $48.4 $51.2 $57.6 $61.55 $66.26 $70.40 $75.84
Total Annual Expenses
(in Millions of Dollars)
$88.5 $86.6 $95.7 $99.7 $104.07 $105.38 $102.73 $114.22
Revenue – State Portiona
(in Millions of Dollars)
$38.3 $34.9 $35.8 $40.3 $43.08 $46.38 $70.40 $75.84
Expenses – State Portion
(in Millions of Dollars)
$63.0 $61.6 $67.0 $69.8 $72.88 $73.76 $102.73 $114.22
Farebox Ratio – State Portion 60.8% 56.6% 53.5% 57.7% 59.1% 62.9% 68.5% 66.4%
Annual State Costsb
(in Millions of Dollars)
$24.7 $26.8 $31.2 $29.6 $29.79 $27.39 $32.32 $38.39
State Costs – Administration
(in Millions of Dollars)
$1.5 $1.5 $1.5 $1.5 $1.50 $1.50 $1.50 $1.50
State Costs – Marketing
(in Millions of Dollars)
$2.3 $2.3 $2.3 $2.3 $2.30 $2.30 $2.30 $2.30
State Cost per Passenger $12.18 $14.75 $17.05 $15.16 $16.12 $14.49 $12.05 $13.58
State Cost per Passenger Mile $0.15 $0.18 $0.21 $0.18 $0.19 $0.17 $0.22 $0.22
State Cost per Train Mile $21.89 $23.35 $27.86 $26.38 $27.31 $24.49 $31.37 $34.29
Annual Ridership – Total Route 2,898,859 2,592,996 2,613,604 2,786,972 2,640,342 2,700,806 2,681,173 2,827,134
Annual Passenger Miles – Total
Route
240,761,326 213,655,854 215,640,101 230,759,084 223,501,233 232,275,532 205,497,275 246,451,396
Annual Train Miles – Total Route 1,612,497 1,638,188 1,599,515 1,601,816 1,558,015 1,597,429 1,471,731 1,599,430
On-Time Performance 76.1% 83.1% 76.3% 77.5% 75.5% 84.8% 77.0% 77.9%
2018 California State Rail Plan
Appendix A.2
Existing Rail System
October 2017
A-17
Performance Measure
Actual
FFY 08 FFY 09 FFY 10 FFY 11 FFY 12 FFY 13 FFY 14 FFY 15
Frequency (Daily Round Trips)
San Diego-Los Angelesc 11 11 11 11 11 11 11 11
Los Angeles-Goleta 5 5 5 5 5 5 5 5
Goleta-San Luis Obispo 2 2 2 2 2 2 2 2
Source: Caltrans rail operational database.
Note: This table is intended to satisfy the performance evaluation requirements of AB 528. a
State portion measures of revenue, expenses, and farebox ratio reflect the 70 percent of the route that is State supported. b
State costs do not include equipment lease costs, and may include minor capital project costs. c
One additional weekend round trip.

2018 California State Rail Plan
Appendix A.2
Existing Rail System
October 2017
A-18
Table A.9: San Joaquin Route Performance
Performance Measure
Actual
FFY 08 FFY 09 FFY 10 FFY 11 FFY 12 FFY 13 FFY 14 FFY 15
Annual Revenue
(in Millions of Dollars) $31.3 $29.6 $33.2 $37.8 $41.09 $41.83 $41.22 $40.46
Total Annual Expenses
(in Millions of Dollars) $68.3 $65.1 $67.8 $69.8 $73.09 $73.26 $81.86 $80.02
Farebox Ratio 45.8% 45.5% 48.9% 54.2% 56.2% 57.1% 50.4% 50.6%
Annual State Costsa
(in Millions of Dollars) $37.1 $35.5 $33.6 $32.0 $32.00 $31.43 $40.64 $39.56
State Costs–Administration
(in Millions of Dollars) $1.3 $1.3 $1.3 $1.3 $1.30 $1.30 $1.30 $1.30
State Costs – Marketing
(in Millions of Dollars) $1.5 $1.5 $1.5 $1.5 $1.50 $1.50 $1.50 $1.50
State Cost per Passenger $39.03 $38.17 $34.36 $29.96 $27.96 $25.77 $34.20 $33.61
State Cost per Passenger Mile $0.27 $0.27 $0.24 $0.20 $0.19 $0.18 $0.25 $0.24
State Cost per Train Mile $27.78 $26.65 $25.26 $24.02 $23.93 $23.88 $30.45 $29.74
Annual Ridership 949,611 929,172 977,834 1,067,441 1,144,616 1,219,818 1,188,228 1,177,073
Annual Passenger Miles 139,004,634 133,711,704 139,405,193 156,427,566 166,336,873 170,076,164 165,538,347 164,249,895
Annual Train Miles 1,334,289 1,330,956 1,330,280 1,331,481 1,337,454 1,316,044 1,334,853 1,330,060
On-Time Performance 82.6% 89.6% 90.7% 89.5% 88.1% 77.7% 75.4% 73.4%

2018 California State Rail Plan
Appendix A.2
Existing Rail System
October 2017
A-19
Performance Measure
Actual
FFY 08 FFY 09 FFY 10 FFY 11 FFY 12 FFY 13 FFY 14 FFY 15
Frequency (Daily Round Trips)
Oakland-Bakersfieldb 4 4 4 4 4 4 4 4
Sacramento-Bakersfield 2 2 2 2 2 2 2 2
Source: Caltrans rail operational database.
Note: This table is intended to satisfy the performance evaluation requirements of AB 528. a
State costs do not include equipment lease costs, and may include minor capital project costs. b
Starting in June 2016, the San Joaquin began offering 5 Oakland-Bakersfield round trips per day.

2018 California State Rail Plan
Appendix A.2
Existing Rail System
October 2017
A-20
Table A.10: Capitol Corridor Route Performance
Performance Measure
Actual
FFY 08 FFY 09 FFY 10 FFY 11 FFY 12 FFY 13 FFY 14 FFY 15
Annual Revenue
(in Millions of Dollars) $23.8 $23.5 $24.2 $27.1 $29.49 $29.20 $29.23 $30.09
Total Annual Expenses
(in Millions of Dollars) $53.3 $51.0 $53.9 $57.9 $59.41 $58.64 $57.71 $58.06
Farebox Ratio 44.6% 46.1% 44.9% 46.9% 49.6% 49.8% 50.6% 51.8%
Annual State Costsa
(in Millions of Dollars) $29.6 $27.5 $29.7 $30.2 $29.92 $29.45 $28.48 $27.96
State Costs – Administration
(in Millions of Dollars) $1.3 $1.3 $1.3 $1.3 $2.72 $2.72 $2.72 $2.72
State Costs – Marketing
(in Millions of Dollars) $1.2 $1.2 $1.2 $1.2 $1.20 $1.20 $1.20 $1.20
State Cost per Passenger $17.46 $17.18 $18.78 $17.65 $17.13 $17.31 $20.07 $18.96
State Cost per Passenger Mile $0.27 $0.27 $0.29 $0.28 $0.27 $0.26 $0.30 $0.28
State Cost per Train Mile $24.88 $23.17 $25.06 $25.16 $24.92 $25.30 $24.66 $23.90
Annual Ridership 1,693,580 1,599,625 1,580,619 1,708,618 1,746,397 1,701,185 1,419,134 1,474,873
Annual Passenger Miles 109,881,568 102,282,980 101,250,743 109,073,594 111,191,130 112,158,131 96,160,598 98,942,984
Annual Train Miles 1,188,104 1,186,351 1,184,181 1,198,842 1,200,493 1,164,118 1,154,770 1,169,957
On-Time Performance 86.0% 92.3% 93.1% 94.9% 93.9% 95.0% 95.3% 93.0%
2018 California State Rail Plan
Appendix A.2
Existing Rail System
October 2017
A-21
Performance Measure
Actual
FFY 08 FFY 09 FFY 10 FFY 11 FFY 12 FFY 13 FFY 14 FFY 15
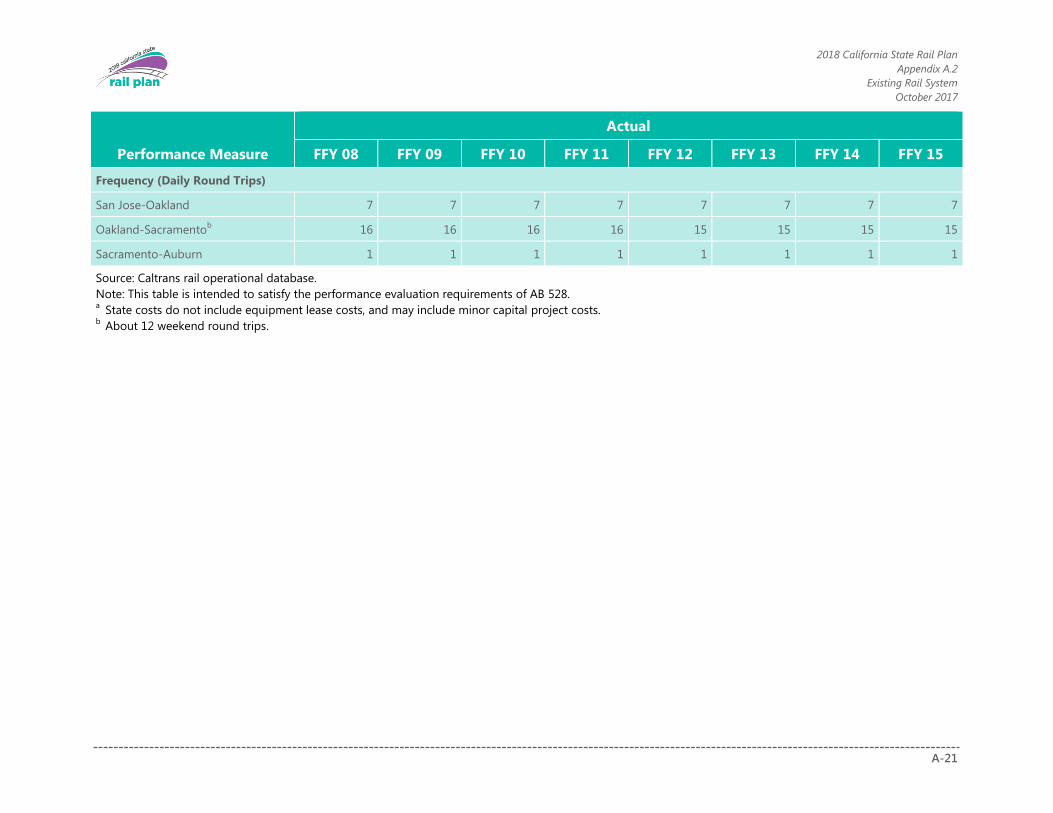
Frequency (Daily Round Trips)
San Jose-Oakland 7 7 7 7 7 7 7 7
Oakland-Sacramentob 16 16 16 16 15 15 15 15
Sacramento-Auburn 1 1 1 1 1 1 1 1
Source: Caltrans rail operational database.
Note: This table is intended to satisfy the performance evaluation requirements of AB 528. a
State costs do not include equipment lease costs, and may include minor capital project costs. b
About 12 weekend round trips.
2018 California State Rail Plan
Appendix A.2
Existing Rail System
October 2017
A-22
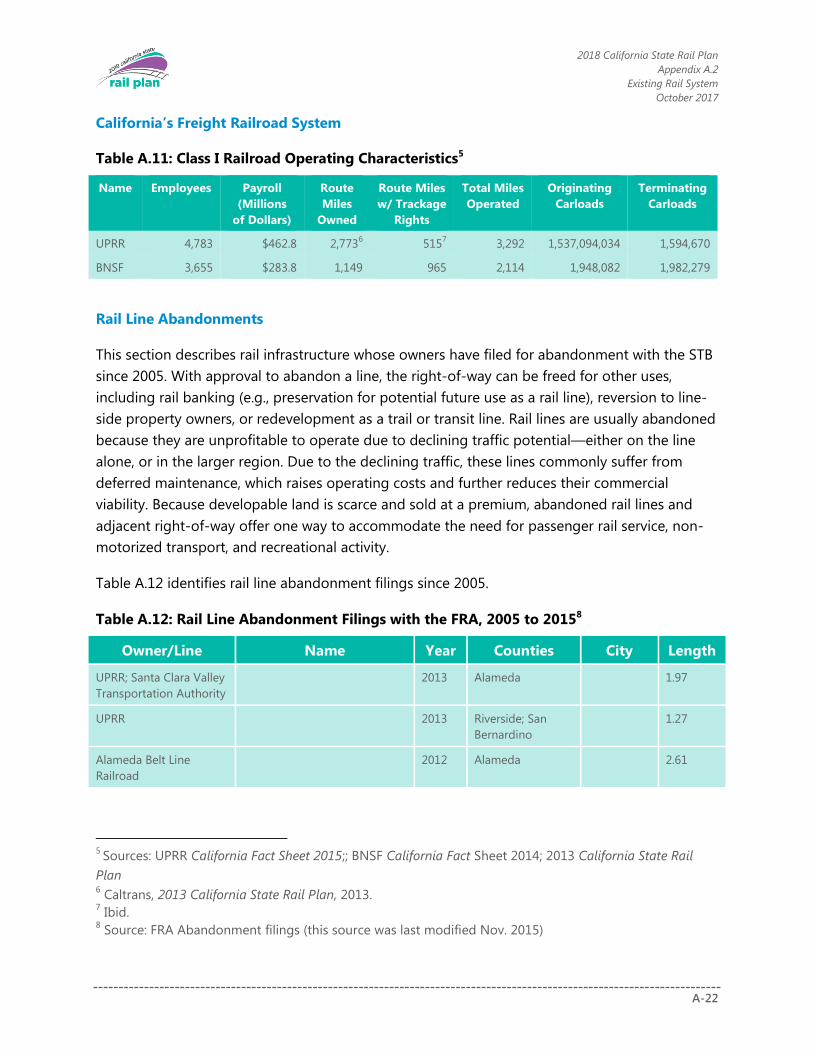
California’s Freight Railroad System
Table A.11: Class I Railroad Operating Characteristics5
Name Employees Payroll
(Millions
of Dollars)
Route
Miles
Owned
Route Miles
w/ Trackage
Rights
Total Miles
Operated
Originating
Carloads
Terminating
Carloads
UPRR 4,783 $462.8 2,7736 515
7 3,292 1,537,094,034 1,594,670
BNSF 3,655 $283.8 1,149 965 2,114 1,948,082 1,982,279
Rail Line Abandonments
This section describes rail infrastructure whose owners have filed for abandonment with the STB
since 2005. With approval to abandon a line, the right-of-way can be freed for other uses,
including rail banking (e.g., preservation for potential future use as a rail line), reversion to line-
side property owners, or redevelopment as a trail or transit line. Rail lines are usually abandoned
because they are unprofitable to operate due to declining traffic potential—either on the line
alone, or in the larger region. Due to the declining traffic, these lines commonly suffer from
deferred maintenance, which raises operating costs and further reduces their commercial
viability. Because developable land is scarce and sold at a premium, abandoned rail lines and
adjacent right-of-way offer one way to accommodate the need for passenger rail service, non-
motorized transport, and recreational activity.
Table A.12 identifies rail line abandonment filings since 2005.
Table A.12: Rail Line Abandonment Filings with the FRA, 2005 to 20158
Owner/Line Name Year Counties City Length
UPRR; Santa Clara Valley
Transportation Authority
2013 Alameda 1.97
UPRR 2013 Riverside; San
Bernardino
1.27
Alameda Belt Line
Railroad
2012 Alameda 2.61
5 Sources: UPRR California Fact Sheet 2015;; BNSF California Fact Sheet 2014; 2013 California State Rail
Plan 6 Caltrans, 2013 California State Rail Plan, 2013.
7 Ibid.
8 Source: FRA Abandonment filings (this source was last modified Nov. 2015)

2018 California State Rail Plan
Appendix A.2
Existing Rail System
October 2017
A-23
Owner/Line Name Year Counties City Length
UPRR; Santa Clara Valley
Transportation Authority
2012 Plumas; Lassen 8.95
BNSF 2012 Los Angeles 5.3
UPRR 2011 Riverside; San
Bernardino
3.73
BNSF Railway 2011 Los Angeles 4.85
Almanor Railroad Co. 2010 Plumas, Lassen Clear Creek 12.3
BNSF Alameda Beltline RR 2010 Alameda 2.0
UPRR Brea Chemical Industrial Lead 2010 Orange Brea 1.2
UPRR South San Francisco Industrial
Lead
2010 San Mateo 0.6
SDIY 2009 San Diego Escondido 1.4
Arizona and California
Railroad Co.
2009 San Bernardino
and Riverside
49.4
Tulare Valley RR Co. 2009 Tulare Ducor 5.9
UPRR McHenry Industrial Lead 2009 San Joaquin and
Stanislaus
5.2
UPRR (Nevada-CA) Lassen Valley Railway LLC 2009 22.3
UPRR Lakewood Industrial Lead 2008 Los Angeles Lakewood 0.3
San Joaquin Valley RR Co. South Exeter Branch 2008 Tulare 30.6
San Joaquin Valley RR Co. South Exeter Branch 2008 Tulare 9.2
UPRR Santa Monica Industrial Lead 2008 Los Angeles Los Angeles 0.4
LA Metro Santa Monica Industrial Lead 2008 Los Angeles 0.3
UPRR Loyalton Industrial Lead 2007 Plumas and Sierra 11.1
UPRR Loyalton Industrial Lead 2007 Sierra Loyalton 0.7
BNSF 2007 Riverside Riverside 0.5
UPRR Riverside Industrial Lead 2007 Riverside 0.3
UPRR (Nevada-CA) Flanigan Industrial Lead 2006 21.8
UPRR (Nevada-CA) Susanville Industrial Lead 2006 Wendal, Lassen 0.6
UPRR Pearson Industrial Lead 2006 Yuba 4.8
Sunset Railway Co/
San Joaquin Valley RR
Sunset Subdivision 2005 Kern Levee 0.2
McCloud RR Co. 2005 Siskiyou, Shasta 80.0
2018 California State Rail Plan
Appendix A.2
Existing Rail System
October 2017
A-24
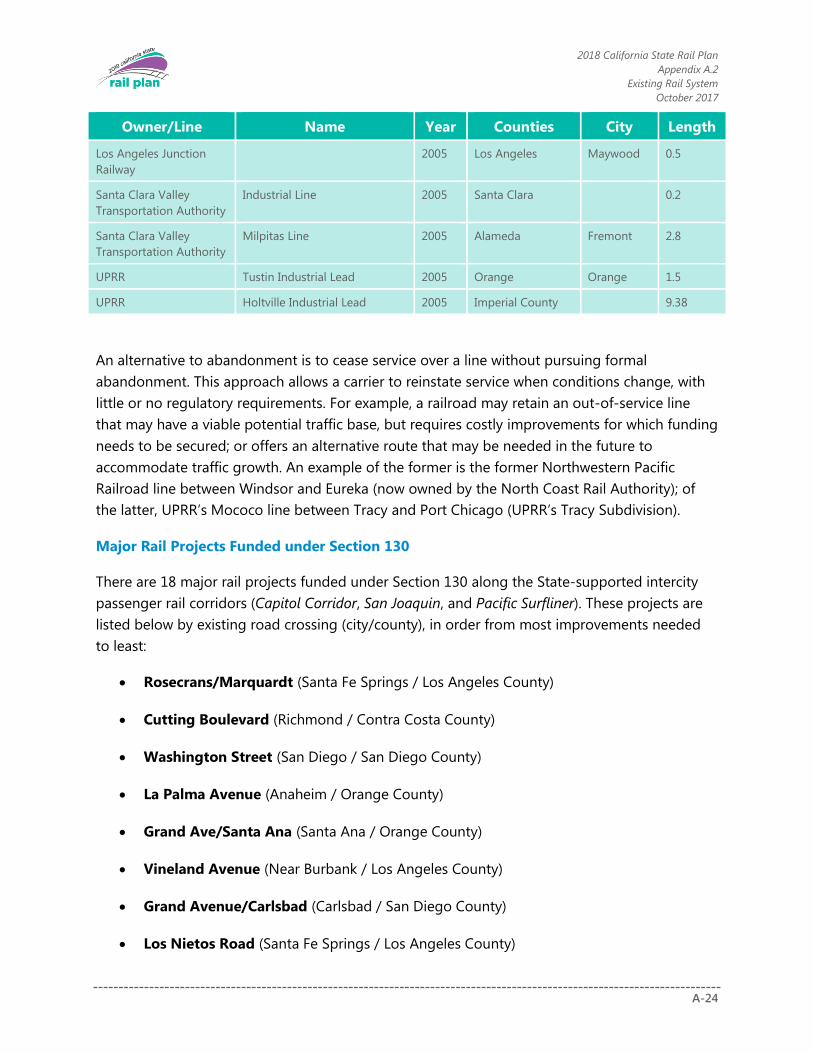
Owner/Line Name Year Counties City Length
Los Angeles Junction
Railway
2005 Los Angeles Maywood 0.5
Santa Clara Valley
Transportation Authority
Industrial Line 2005 Santa Clara 0.2
Santa Clara Valley
Transportation Authority
Milpitas Line 2005 Alameda Fremont 2.8
UPRR Tustin Industrial Lead 2005 Orange Orange 1.5
UPRR Holtville Industrial Lead 2005 Imperial County 9.38
An alternative to abandonment is to cease service over a line without pursuing formal
abandonment. This approach allows a carrier to reinstate service when conditions change, with
little or no regulatory requirements. For example, a railroad may retain an out-of-service line
that may have a viable potential traffic base, but requires costly improvements for which funding
needs to be secured; or offers an alternative route that may be needed in the future to
accommodate traffic growth. An example of the former is the former Northwestern Pacific
Railroad line between Windsor and Eureka (now owned by the North Coast Rail Authority); of
the latter, UPRR’s Mococo line between Tracy and Port Chicago (UPRR’s Tracy Subdivision).
Major Rail Projects Funded under Section 130
There are 18 major rail projects funded under Section 130 along the State-supported intercity
passenger rail corridors (Capitol Corridor, San Joaquin, and Pacific Surfliner). These projects are
listed below by existing road crossing (city/county), in order from most improvements needed
to least:
Rosecrans/Marquardt (Santa Fe Springs / Los Angeles County)
Cutting Boulevard (Richmond / Contra Costa County)
Washington Street (San Diego / San Diego County)
La Palma Avenue (Anaheim / Orange County)
Grand Ave/Santa Ana (Santa Ana / Orange County)
Vineland Avenue (Near Burbank / Los Angeles County)
Grand Avenue/Carlsbad (Carlsbad / San Diego County)
Los Nietos Road (Santa Fe Springs / Los Angeles County)

2018 California State Rail Plan
Appendix A.2
Existing Rail System
October 2017
A-25
Ferry Street (Martinez / Contra Costa County)
Mission Avenue (Oceanside / San Diego County)
Church Avenue (Fresno / Fresno County)
Hesperian Boulevard (San Leandro / Alameda County)
Grape Street (San Diego / San Diego County)
Hawthorn Street (San Diego / San Diego County)
7th Street (Hanford / Kings County)
Kansas Avenue (Near Guernsey / Kings County)
11th Avenue (Hanford / Kings County)
Bellevue Avenue (Atwater / Merced County)

2018 California State Rail Plan
Appendix A.2
Existing Rail System
October 2017
A-26
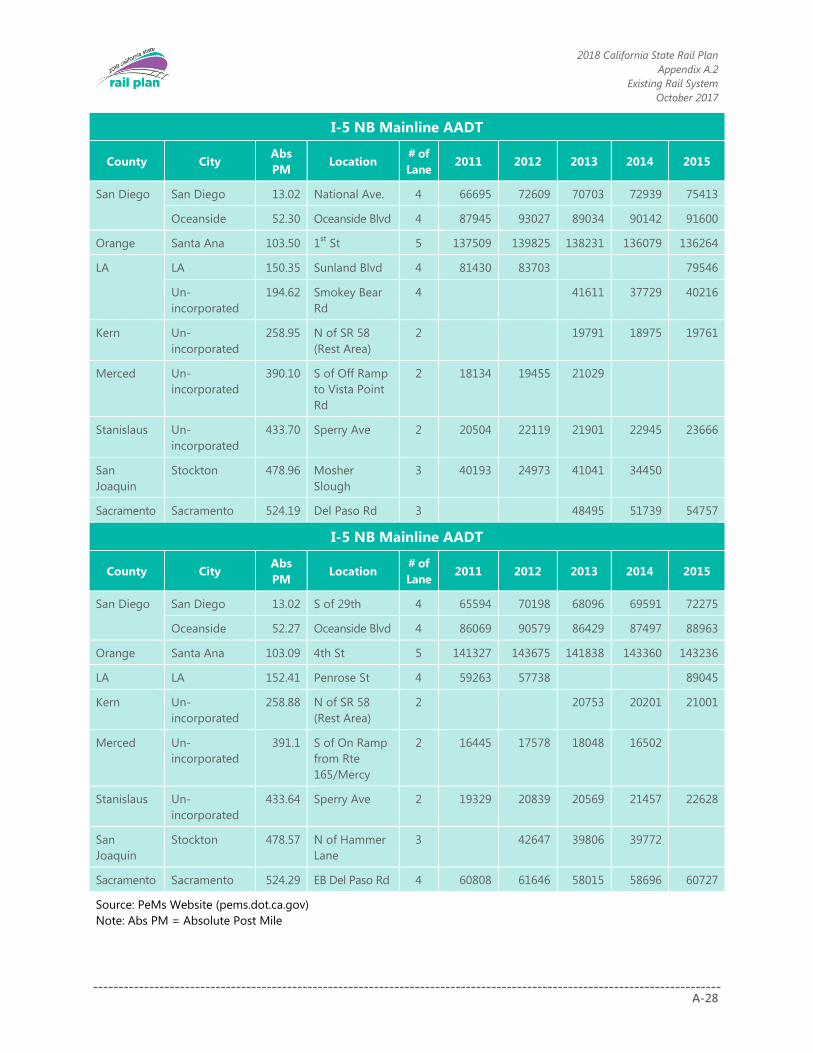
Trends and Forecasts
Highway Congestion Analysis
Table A.13, below, presents 5 years of mainline Annual Average Daily Traffic (AADT) volumes
obtained from the Caltrans Freeway Performance Measurement System (PeMS) database for
specific locations along I-5, I-10, and I-80. These freeways parallel existing BNSF and UPRR lines.
The changes in AADT over the years demonstrate the traffic growth patterns. Many areas have
been seen traffic increase over the last 5 years; the increases are not limited to metropolitan
areas like Los Angeles and San Francisco Counties. Traffic volumes are also seen to be increasing
in inland counties like Merced and Stanislaus Counties (along I-5), and Solano and Placer
Counties (along I-80).
Table A.13: AADT per Location on I-5, I-10 and I-80 from 2011 to 2015
I-10 EB Mainline AADT
County City
Abs
PM Location
# of
Lane 2011 2012 2013 2014 2015
LA Santa Monica 0.93 20th St 3 65114 68654 66078 64693 66063
San
Bernardino
Ontario 52.06 4th St 4 96569 103836 101423 102218 101784
Riverside Banning 99.27 San Gorgonio
OC
4 58389 60779 61996
Coachella 152.7 Brown Arroyo 2 14120 13466
I-10 WB Mainline AADT
County City
Abs
PM Location
# of
Lane 2011 2012 2013 2014 2015
LA Santa Monica 0.48 14th St 3 66592 72211 71467 70945 72107
San
Bernardino
Ontario 52.06 4th St 4 99574 100117 100611 101709 101541
Riverside Coachella 152.7 Brown Arroyo 2 14545 14077 14175

2018 California State Rail Plan
Appendix A.2
Existing Rail System
October 2017
A-27
I-80 EB Mainline AADT
County City
Abs
PM Location
# of
Lane 2011 2012 2013 2014 2015
San
Francisco
San Francisco 3.3 Bay Bridge S -
Curve
5 96721 89851 93316 119657 129000
Alameda Oakland 6.74 1400' E of Bay
Bridge
6 94645 100845 120253 133699
Solano Un-
incorporated
51.44 E of Pleasant
Valley OC
4 73032 66166 72154 81310 96992
Sacramento Un-
incorporated
98.1 WB Green
Back Lane
4 76610 78094 78688 80909 83143
Placer Un-
incorporated
145.92 Alta Rd 2 12738 12884 13198 13682 14778
I-80 WB Mainline AADT
County City
Abs
PM Location
# of
Lane 2011 2012 2013 2014 2015
San
Francisco
San Francisco 3.3 Bay Bridge 5 106917 116261 117334 127608
Alameda Oakland 6.74 1400' E of Bay
Bridge
5 127469 146370 145419 146282
Solano Un-
incorporated
51.44 E of Pleasant
Valley OC
4 82472 84761 67710 83239 96167
Sacramento Un-
incorporated
98 WB Elkhorn
Blvd
4 69582 70238 70429 72109 72956
Placer Un-
incorporated
145.92 Alta Rd 2 12890 13123 13185 13473 14719
2018 California State Rail Plan
Appendix A.2
Existing Rail System
October 2017
A-28
I-5 NB Mainline AADT
County City Abs
PM Location
# of
Lane 2011 2012 2013 2014 2015
San Diego San Diego 13.02 National Ave. 4 66695 72609 70703 72939 75413
Oceanside 52.30 Oceanside Blvd 4 87945 93027 89034 90142 91600
Orange Santa Ana 103.50 1st St 5 137509 139825 138231 136079 136264
LA LA 150.35 Sunland Blvd 4 81430 83703 79546
Un-
incorporated
194.62 Smokey Bear
Rd
4 41611 37729 40216
Kern Un-
incorporated
258.95 N of SR 58
(Rest Area)
2 19791 18975 19761
Merced Un-
incorporated
390.10 S of Off Ramp
to Vista Point
Rd
2 18134 19455 21029
Stanislaus Un-
incorporated
433.70 Sperry Ave 2 20504 22119 21901 22945 23666
San
Joaquin
Stockton 478.96 Mosher
Slough
3 40193 24973 41041 34450
Sacramento Sacramento 524.19 Del Paso Rd 3 48495 51739 54757
I-5 NB Mainline AADT
County City Abs
PM Location
# of
Lane 2011 2012 2013 2014 2015
San Diego San Diego 13.02 S of 29th 4 65594 70198 68096 69591 72275
Oceanside 52.27 Oceanside Blvd 4 86069 90579 86429 87497 88963
Orange Santa Ana 103.09 4th St 5 141327 143675 141838 143360 143236
LA LA 152.41 Penrose St 4 59263 57738 89045
Kern Un-
incorporated
258.88 N of SR 58
(Rest Area)
2 20753 20201 21001
Merced Un-
incorporated
391.1 S of On Ramp
from Rte
165/Mercy
2 16445 17578 18048 16502
Stanislaus Un-
incorporated
433.64 Sperry Ave 2 19329 20839 20569 21457 22628
San
Joaquin
Stockton 478.57 N of Hammer
Lane
3 42647 39806 39772
Sacramento Sacramento 524.29 EB Del Paso Rd 4 60808 61646 58015 58696 60727
Source: PeMs Website (pems.dot.ca.gov)
Note: Abs PM = Absolute Post Mile
2018 California State Rail Plan
Appendix A.2
Existing Rail System
October 2017
A-29
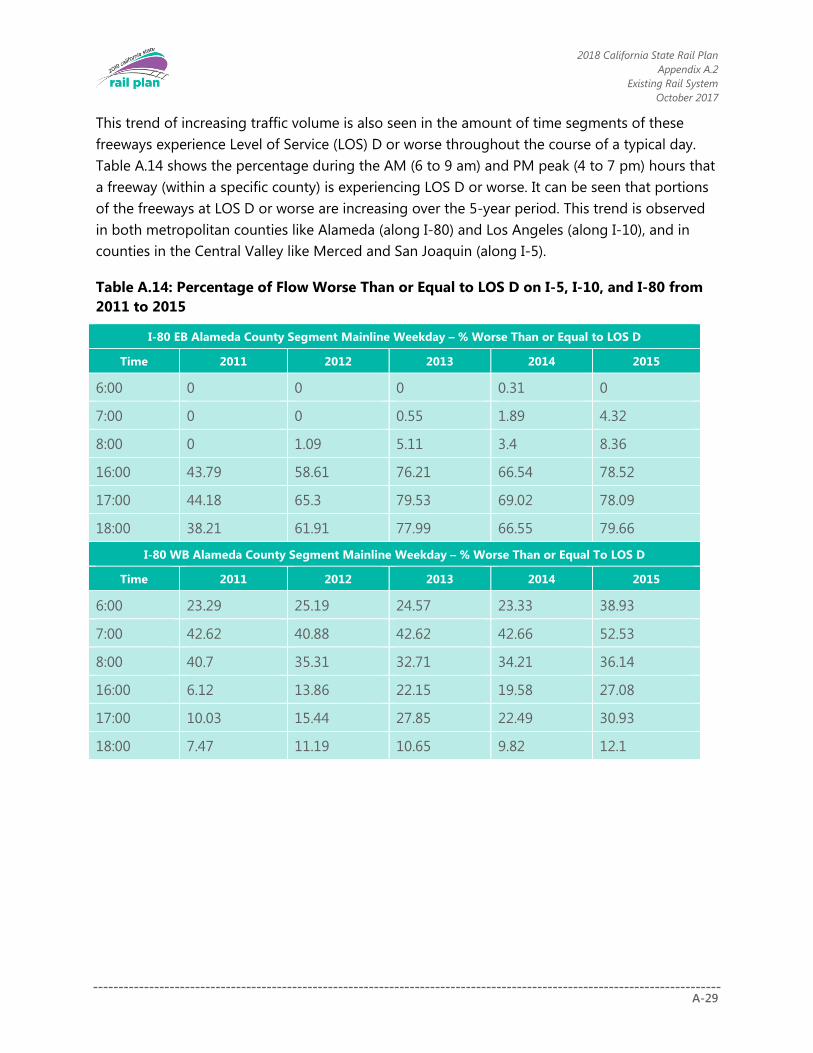
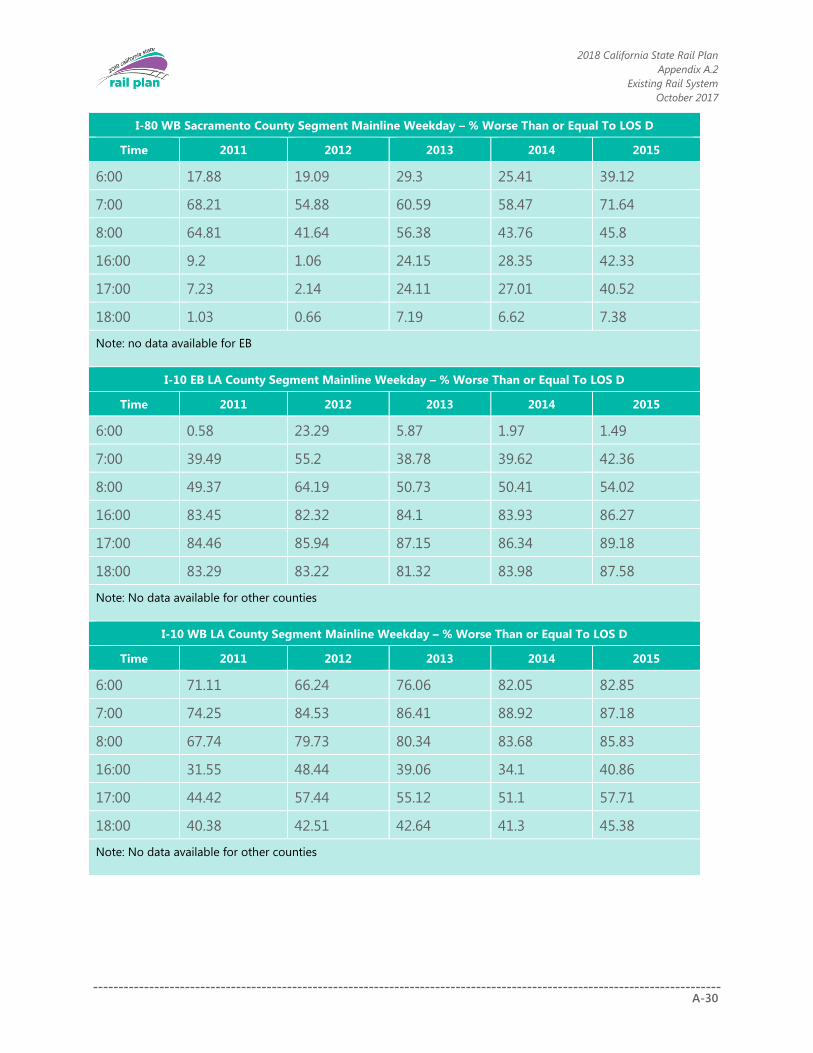
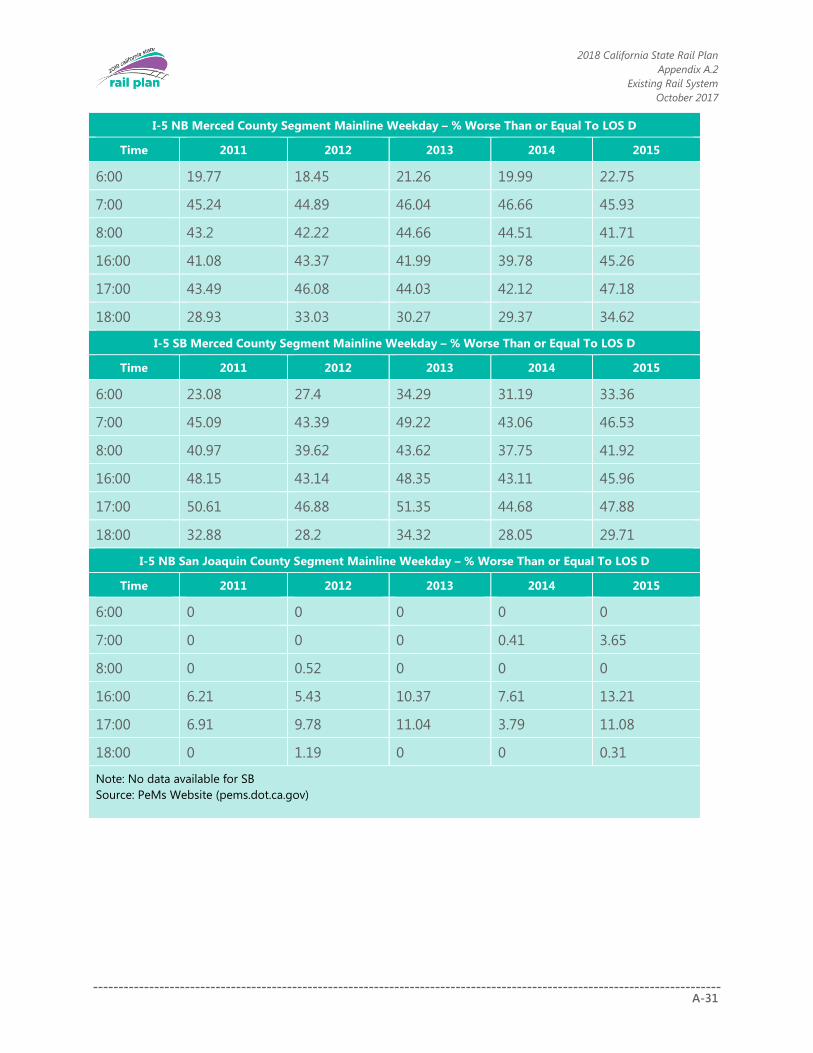
This trend of increasing traffic volume is also seen in the amount of time segments of these
freeways experience Level of Service (LOS) D or worse throughout the course of a typical day.
Table A.14 shows the percentage during the AM (6 to 9 am) and PM peak (4 to 7 pm) hours that
a freeway (within a specific county) is experiencing LOS D or worse. It can be seen that portions
of the freeways at LOS D or worse are increasing over the 5-year period. This trend is observed
in both metropolitan counties like Alameda (along I-80) and Los Angeles (along I-10), and in
counties in the Central Valley like Merced and San Joaquin (along I-5).
Table A.14: Percentage of Flow Worse Than or Equal to LOS D on I-5, I-10, and I-80 from
2011 to 2015
I-80 EB Alameda County Segment Mainline Weekday – % Worse Than or Equal to LOS D
Time 2011 2012 2013 2014 2015
6:00 0 0 0 0.31 0
7:00 0 0 0.55 1.89 4.32
8:00 0 1.09 5.11 3.4 8.36
16:00 43.79 58.61 76.21 66.54 78.52
17:00 44.18 65.3 79.53 69.02 78.09
18:00 38.21 61.91 77.99 66.55 79.66
I-80 WB Alameda County Segment Mainline Weekday – % Worse Than or Equal To LOS D
Time 2011 2012 2013 2014 2015
6:00 23.29 25.19 24.57 23.33 38.93
7:00 42.62 40.88 42.62 42.66 52.53
8:00 40.7 35.31 32.71 34.21 36.14
16:00 6.12 13.86 22.15 19.58 27.08
17:00 10.03 15.44 27.85 22.49 30.93
18:00 7.47 11.19 10.65 9.82 12.1
2018 California State Rail Plan
Appendix A.2
Existing Rail System
October 2017
A-30
I-80 WB Sacramento County Segment Mainline Weekday – % Worse Than or Equal To LOS D
Time 2011 2012 2013 2014 2015
6:00 17.88 19.09 29.3 25.41 39.12
7:00 68.21 54.88 60.59 58.47 71.64
8:00 64.81 41.64 56.38 43.76 45.8
16:00 9.2 1.06 24.15 28.35 42.33
17:00 7.23 2.14 24.11 27.01 40.52
18:00 1.03 0.66 7.19 6.62 7.38
Note: no data available for EB
I-10 EB LA County Segment Mainline Weekday – % Worse Than or Equal To LOS D
Time 2011 2012 2013 2014 2015
6:00 0.58 23.29 5.87 1.97 1.49
7:00 39.49 55.2 38.78 39.62 42.36
8:00 49.37 64.19 50.73 50.41 54.02
16:00 83.45 82.32 84.1 83.93 86.27
17:00 84.46 85.94 87.15 86.34 89.18
18:00 83.29 83.22 81.32 83.98 87.58
Note: No data available for other counties
I-10 WB LA County Segment Mainline Weekday – % Worse Than or Equal To LOS D
Time 2011 2012 2013 2014 2015
6:00 71.11 66.24 76.06 82.05 82.85
7:00 74.25 84.53 86.41 88.92 87.18
8:00 67.74 79.73 80.34 83.68 85.83
16:00 31.55 48.44 39.06 34.1 40.86
17:00 44.42 57.44 55.12 51.1 57.71
18:00 40.38 42.51 42.64 41.3 45.38
Note: No data available for other counties
2018 California State Rail Plan
Appendix A.2
Existing Rail System
October 2017
A-31
I-5 NB Merced County Segment Mainline Weekday – % Worse Than or Equal To LOS D
Time 2011 2012 2013 2014 2015
6:00 19.77 18.45 21.26 19.99 22.75
7:00 45.24 44.89 46.04 46.66 45.93
8:00 43.2 42.22 44.66 44.51 41.71
16:00 41.08 43.37 41.99 39.78 45.26
17:00 43.49 46.08 44.03 42.12 47.18
18:00 28.93 33.03 30.27 29.37 34.62
I-5 SB Merced County Segment Mainline Weekday – % Worse Than or Equal To LOS D
Time 2011 2012 2013 2014 2015
6:00 23.08 27.4 34.29 31.19 33.36
7:00 45.09 43.39 49.22 43.06 46.53
8:00 40.97 39.62 43.62 37.75 41.92
16:00 48.15 43.14 48.35 43.11 45.96
17:00 50.61 46.88 51.35 44.68 47.88
18:00 32.88 28.2 34.32 28.05 29.71
I-5 NB San Joaquin County Segment Mainline Weekday – % Worse Than or Equal To LOS D
Time 2011 2012 2013 2014 2015
6:00 0 0 0 0 0
7:00 0 0 0 0.41 3.65
8:00 0 0.52 0 0 0
16:00 6.21 5.43 10.37 7.61 13.21
17:00 6.91 9.78 11.04 3.79 11.08
18:00 0 1.19 0 0 0.31
Note: No data available for SB
Source: PeMs Website (pems.dot.ca.gov)

2018 California State Rail Plan
Appendix A.2
Existing Rail System
October 2017
A-32
Freight Demand and Growth
Methodology
In estimating train volumes, the 2018 Rail Plan builds on the analysis conducted for the 2013 Rail
Plan. For this Plan, the basic methodology for deriving base year (2013) and future year (2040)
train volumes entailed adjusting train volumes from the 2013 Rail Plan to reflect expected
changes in commodity flows using more recent data. The 2013 Plan conducted a network
assignment of 2007 and 2040 rail tonnage flows to estimate daily average freight train volumes.
The 2013 Rail Plan also validated the 2007 train volume estimates against freight train counts
using available Class I (BNSF and UPRR) train count data for selected rail segments. Train
volumes in Southern California were also compared to train volumes as estimated using the San
Pedro Bay Ports’ QuickTrip – Train Builder model. In using the 2013 Rail Plan train volume
analysis as a foundation, the 2018 analysis yielded consistent results in an efficient manner.
For the 2018 Rail Plan, train volume estimation proceeded as follows:
First, rail commodity flows were aggregated by service type (i.e., intermodal or carload)
into a geographical set of rail segments. Using the origins and destinations of the current
plan’s rail commodity flows, traffic was assigned to rail segments using the 2013 Rail
Plan’s network assignment.
Next, the ratios of the 2018 plan’s base year tonnages (2013) to the previous plan’s base
year tonnages (2007) were calculated. Those ratios were then applied to the 2007 train
volumes to estimate the 2013 train volumes.
The estimation of future year train volumes for the current plan proceeded similarly. The
ratios of the current plans forecast year tonnages (2040) to the previous plan’s base year
tonnages (2007) were calculated. Those ratios were then applied to the 2007 train
volumes to estimate the 2018 Rail Plan’s forecast year train volumes.
The resulting train count data were incorporated into the capacity analysis that was
conducted as part of the Service Development Plan, the results of which are provided in
Section A.2.2.7.

2018 California State Rail Plan
Appendix A.2
Existing Rail System
October 2017
A-33
Freight Flow
Exhibit A.4: Freight Flow Direction Categorization
2018 California State Rail Plan
Appendix A.2
Existing Rail System
October 2017
A-34
California Rail Funding
State Funding
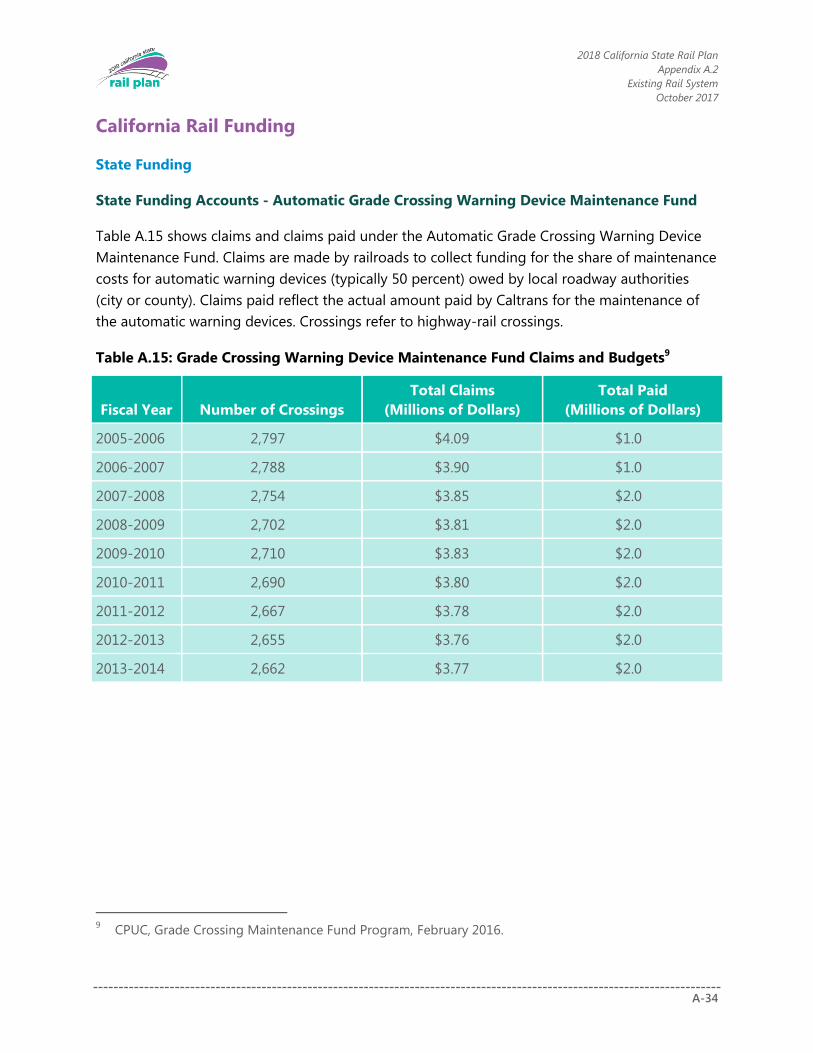
State Funding Accounts - Automatic Grade Crossing Warning Device Maintenance Fund
Table A.15 shows claims and claims paid under the Automatic Grade Crossing Warning Device
Maintenance Fund. Claims are made by railroads to collect funding for the share of maintenance
costs for automatic warning devices (typically 50 percent) owed by local roadway authorities
(city or county). Claims paid reflect the actual amount paid by Caltrans for the maintenance of
the automatic warning devices. Crossings refer to highway-rail crossings.
Table A.15: Grade Crossing Warning Device Maintenance Fund Claims and Budgets9
Fiscal Year Number of Crossings
Total Claims
(Millions of Dollars)
Total Paid
(Millions of Dollars)
2005-2006 2,797 $4.09 $1.0
2006-2007 2,788 $3.90 $1.0
2007-2008 2,754 $3.85 $2.0
2008-2009 2,702 $3.81 $2.0
2009-2010 2,710 $3.83 $2.0
2010-2011 2,690 $3.80 $2.0
2011-2012 2,667 $3.78 $2.0
2012-2013 2,655 $3.76 $2.0
2013-2014 2,662 $3.77 $2.0
9 CPUC, Grade Crossing Maintenance Fund Program, February 2016.
2018 California State Rail Plan
Appendix A.6
Proposed Passenger Improvements and Investments
October 2017
A-35
Appendix A.6
Proposed Passenger Improvements and
Investments
Overview of Capital Cost Methodology
Definitions
Rough-Order-of-Magnitude Cost Estimate: an estimate prepared during the pre-design stage
when the project is between 0 and 5 percent design development.
Construction Costs: Costs to construct the project, including the labor, equipment, and material
costs; subcontractors’ overhead and profit; and the general contractor’s overhead and profit.
Project Costs: Complete project cost, including the construction costs, right-of-way
acquisitioning, design, construction and project management fees, and professional services.
Escalation: An adjustment factor that is meant to account for annual labor and commodity
increases in construction materials, labor, and professional services.
Allocated Contingency: Also known as design contingency, this is an allowance carried in the
estimate detail that accounts for expected design development and unknowns at the time of the
estimate.
Unallocated Contingency: Also known as construction contingency, this is an allowance carried
at the executive summary level to account for unexpected changes that may occur during
construction, including unknown or undocumented site conditions.
Urban Rail: Passenger transportation on rail in urban areas, including light rail transit and heavy
rail transit (BART and LA Metro.) Only specific urban rail projects that are considered to be
significant regional connectors are included in the State Rail Plan.
Intercity Rail (Also referred to as Regional Rail and Commuter Rail): Passenger transportation
on rail that connects two or more cities, typically longer distances than Urban Rail (Amtrak,
Metrolink, Caltrain.)
High-Speed Rail: Passenger transportation on HSR infrastructure. This includes projects in the
California High Speed Rail (CSRP) and the Xpress West project (XpressWest). The State Rail Plan
contains the entire CSRP program, including Phase 1 under construction, Phase 1 planned, and
Phase 2 planned. The XpressWest project includes two segments: the Victorville to Las Vegas
segment published by Xpress West, and a connection from Victorville to Palmdale.
2018 California State Rail Plan
Appendix A.6
Proposed Passenger Improvements and Investments
October 2017
A-36
Introduction
This document is an Independent Cost Estimate and Cost Methodology Report prepared by
AECOM for the 2018 California State Rail Plan. This estimate is a high-level rough-order-of-
magnitude estimate based on an assortment of projects that are at the 0 percent design stage.
The costs provided in this estimate are at the corridor level, and are not meant to represent
individual projects. It is expected that these corridor-level totals will be subdivided into projects
and phases as part of project implementation planning and design development. No design has
been performed at this time at the project level.
This technical memorandum is intended to meet the following goals as defined by Caltrans and
AECOM:
Document the methodology and criteria used to complete the capital cost estimate.
Present the rough-order-of-magnitude capital cost estimate figures.
Provide detailed assumptions, project elements, unit prices, and pricing sources for
review by the Caltrans team.
Purpose
This document presents the rough-order-of-magnitude capital costs for the proposed
infrastructure improvements associated with the 2018 Rail Plan. This document presents the
methodology used in preparing the costs, as well as the estimate criteria, pricing sources, and
assumptions. This estimate is representative of the most realistic price under stable bidding
conditions for a project with the given assumptions and criteria. Any variance to the
assumptions listed in this report could be the cause for a variance in the design and
construction costs for the corridor improvements. This estimate is not intended to be a
prediction of an under-designed system or a low-bid estimate. Likewise, this estimate is not
intended to be a prediction of an over-designed system or open ended contract.
This document was prepared with the intended purpose of providing a strategic planning
overview of the estimated probable capital cost of completing the program of projects needed
to achieve the vision of an integrated passenger rail network and improved freight rail system
supporting the stated goals of the California Transportation Plan 2040.
2018 California State Rail Plan
Appendix A.6
Proposed Passenger Improvements and Investments
October 2017
A-37
Estimate Methodology and Criteria
Estimate Methodology
Estimate Level
The estimates of probable capital costs at this stage include planning-level estimates of cost that
take into consideration factors such as complexity, environment, geographic location (urban,
suburban, rural), proximity to active tracks, and other such factors that may significantly
influence the costs. Therefore, planning-level estimates of probable cost are gross-order-of-
magnitude estimates intended to be indicative and inform the prioritization of investment
decisions, and are not to be interpreted as engineer estimates.
Estimate Format
The estimate of probable cost is presented with totals listed by corridor-level improvements.
These costs are summarized into improvements by region. Key quantities are given for each
corridor to identify the essential project elements. Corridor estimates are based on either
sourced information, or built up using a capital cost unit price catalog. This catalog follows the
FRA Standardized Cost Categories (SCC), with unit costs for typical elements identified based on
an average project cost. For unique high-cost improvements such as intercity stations, local
stops, regional terminals, and major iconic intermodal hubs, maintenance yards, shops, and
administrative buildings, a lump sum opinion of cost is assumed based on a range of low,
medium, and high comparable costs derived from recent projects of similar scope.
Estimate Procedure
Step 1 – Capacity Charts/Network Graphs:
The 2040 Strategic Service Plan service type, frequency (system pulse), required average line
speed, departure and arrival times, and route nodes used to develop corridor-specific
improvements and build related capital cost estimates. This service plans were used to identify
capacity requirements at the corridor level throughout the state. These capacity requirements
are the primary basis for all project descriptions and assumptions in this estimate.
Step 2 – Corridor Investigation:
The corridors were investigated by a visual survey of the existing infrastructure using a
combination of Google Earth mapping and consulting team professional knowledge of the
existing conditions. The existing infrastructure was compared with future capacity requirements
from the Capacity / Network charts. The planning team then compared the existing
infrastructure to the future capacity requirements to identify the specific project components.
2018 California State Rail Plan
Appendix A.6
Proposed Passenger Improvements and Investments
October 2017
A-38
Step 3 – Pricing Research and Create Corridor Estimates:
An estimate of probable capital cost was prepared for each corridor by using sourced data or
building up a cost estimate by using sourced information, or using a capital cost unit price
catalog.
The cost catalog identified a “menu” of prototypical improvements, consisting of approximately
30 elements. Unit costs were developed for each element, using historical cost data from other
projects. Cost factors, mark-ups, and adjustments were added as needed to develop pricing for
new impacts not previously included in estimates, and / or adjust prior cost estimates to reflect a
consistent cost estimate system.
For costs that are not sourced, corridor estimates were built up using the cost catalog. The
corridor estimate applied unit costs to the programmatic project developments identified in
Step 2. Measurements were taken to determine lengths (in route miles) of guideway type with
assumptions for at-grade, aerial, or underground alignment.
Estimate Criteria
Pricing Sources and Standard Cost Categories
Sourced Projects
2016 Draft CAHSRA Business Plan (2016)
Capitol Corridor 2014 Vision Plan Update Final Report (2014)
Redlands Passenger Rail Project Fact Sheet (2015)
XpressWest Media Kit (2011)
Cost Catalog
Unit costs have been developed from historical cost data, both internal and gathered from due
diligent research. Many unit prices are based on the average or more conservative higher-end of
the statistical averages. All costs have been appropriately adjusted with location and escalation
factors to be comparable to California in the Plan Year of 2018.
10 Track Structures & Track – includes elevated structures (bridges and viaducts),
embankments and open cuts, retaining wall systems, tunnels, culverts and drainage, track
(ballasted and non-ballasted), and special trackwork. Unit costs are averages based on cost
estimates and bid results from Caltrain, Metrolink, BART, and LA Metro. Pricing is included for
new single track, new double track, and relocation of existing track.

2018 California State Rail Plan
Appendix A.6
Proposed Passenger Improvements and Investments
October 2017
A-39
20 Stations, Terminals, Intermodal – includes rough grading, excavation, station structures,
enclosures, finishes, equipment; mechanical and electrical components including heating,
ventilation, and air conditioning; station power, lighting, public address/customer information
systems; and safety systems such as fire detection and prevention, security surveillance, access
control, and life safety systems. Unit costs are averages based on cost estimates and bid results
from Caltrain, Metrolink, BART, and LA Metro. A range of costs has been used depending on the
intent of the design, with a range from low, medium, and high, to iconic. Iconic refers to a major
hub such as Los Angeles Union Station or San Francisco’s Transbay Terminal.
30 Support Facilities: Yards, Shops, Administration Buildings – includes rolling stock service,
inspection, storage, heavy maintenance and overhaul facilities and equipment, as well as
associated yard tracks and electrification. In addition, maintenance-of-way facilities are also
included in this cost category. Unit costs are averages based on cost estimates and bid results
from Caltrain, Metrolink, BART, and LA Metro. A range of costs has been used, depending on the
intent of the design, ranging from low to and high.
40 Sitework, Right-of-Way, Land, Existing Improvements – includes cost of demolition,
hazardous materials removals, environmental mitigation, utility relocations, noise mitigation,
intrusion protection, grade separations, roadway improvements, acquisition of real estate, and
temporary facilities and other indirect costs.
50 Systems – includes all costs of implementing Automatic Train Control (ATC) systems,
inclusive of Positive Train Control (PTC) and intrusion detection, where it is applicable. Includes
costs of traction power supply system such as supply, paralleling, and switching substations, as
well as connections to the power utilities; and traction power distribution system in the form of
Overhead Contact System (OCS). Unit costs are averages based on cost estimates and bid results
from Caltrain, Metrolink, BART, and LA Metro. Unit costs are averages based on cost estimates
and bid results from Caltrain, Metrolink, BART, and LA Metro. A range of costs has been used
depending on the geography of the design, ranging from rural and suburban to urban. A
sitework cost has been included for every mile of at-grade, aerial, and underground
construction.
60 Right-of-Way – Land acquisition purchase required for guideway, stations, and facilities.
Unit costs are based on the California High Speed Rail Authority’s Business Plan. Urban right-of-
way is estimated at 90 percent of the costs for the San Francisco to San Jose segment. Suburban
right-of-way costs are 67 percent of the San Francisco to San Jose cost. Rural San Francisco to
San Jose costs are estimated at 25 percent of the San Francisco to San Jose cost.
70 Vehicles – includes costs for acquisition of the trainsets (design, prototype unit, and
production and delivery of trainsets to the project site on an annual basis). This estimate
excludes all rolling stock.
2018 California State Rail Plan
Appendix A.6
Proposed Passenger Improvements and Investments
October 2017
A-40
80 Professional Services – includes all professional, technical, and management services related
to the design and construction of infrastructure (Categories 10 through 60) during the
preliminary engineering, final design, and construction phases of the project/program (as
applicable). A 30 percent mark-up has been used to account for all professional services.
Contingency
Allocated Contingency (or Pre-Construction Design Development)
Allocated contingency represents a percentage of unknown or undeveloped scope that has not
been implemented into the design documents. Because there is no design on any project, this
estimate uses the maximum of 30 percent contingency. This contingency is expected to be
reduced when the projects are designed.
Unallocated Contingency (or Change Order Contingency)
Unallocated contingency added to the construction and professional services costs at 10 percent
of the estimate. Unallocated contingency represents costs above and beyond in the project
budget, for such changes that are likely to occur during the construction. The construction
contingency allowance carried by the owner in the project budget should remain constant
throughout the design process.
Contract Procurement & Construction Fee
No assumptions have been made regarding contract procurement and delivery method. The
unit costs include appropriate allowances to cover contractor fees, overhead, general conditions,
and general requirements. The FRA format does not include a specific location for the
contractor’s General Conditions; therefore, the contractor’s General Conditions have been
included throughout the estimate at the unit cost level.
Cost Basis Year
AECOM established 2018 as the base year of all the cost estimates prepared for the 2018 Rail
Plan. Any previous data that have a different base year—for example, Sepulveda Pass Final
Compendium Report (2012), Capital Corridor 2014 Vision Plan Update Final Report, and 2016
Draft CAHSRA Business Plan—have been adjusted to match the base year established for the
2018 Rail Plan.
Cost Escalation Methodology and Calculations
The regional rail/commuter rail unit prices in the estimate detail are priced in 2018 value. Any
sourced project data have been escalated from the published report date to the year 2018. An

2018 California State Rail Plan
Appendix A.6
Proposed Passenger Improvements and Investments
October 2017
A-41
adjustment for cost escalation has been added to account for the anticipated cost increases
between the published date and the 2018 cost basis year.
The HSR unit prices in the estimate detail are also priced in future value of the cost basis year.
However, the adjustment for cost escalation has been performed at the summary level to
account for the anticipated cost increases between the CAHSRA report year (2016) and the cost
basis year (2018). The sum of the main elements has been escalated by 4 percent annually.
Escalation adjustment is meant to account for normal market growth across the state. The long-
range annual escalation factor has been calculated by aggregating escalation procured from
several government and consulting sources, including California Department of Transportation,
American General Contractors, Turner Construction, Cumming Corporation, Davis Langdon,
Engineering News Record, and the Los Angeles Bureau of Engineering. The average escalation
factor calculated when aggregating the data is 3.99 percent. This estimate rounds the escalation
rate up to 4 percent per year for long-range estimating purposes. Table A.29 depicts the
reference long-term escalation rates, sources, and the average escalation rate of all the
reference sources.
The following graph shows the average annual escalation data during the past 12 years, and the
projected escalation rates through 2018.
Table A.29: Bid Price Escalation Rates – Calculated Historic & Forecasted
Sources: Escalation rates have been calculated by aggregating long-range historic trends and forecasts from the
following sources: Caltrans Average Highway Contract Prices 2000-2012, ENR- LA BCI & CCI 2000-2012, AGC
Construction & Materials Outlook, May 1, 2013.
2018 California State Rail Plan
Appendix A.6
Proposed Passenger Improvements and Investments
October 2017
A-42
Qualifications
This estimate should be used for high-level visioning purposes only, and not for grant
applications or other decision making for specific projects.
Any flaws or errors in the ridership modeling or production of the network graphs are
carried through, and affect the estimate totals.
Actual project costs could range +/- 30 percent.
2018 California State Rail Plan
Appendix A.6
Proposed Passenger Improvements and Investments
October 2017
A-43
Emissions Inventory Analysis Supporting Information
2010 and 2040 Freight Locomotive Emissions Analysis
Emission rates by certification tier used for freight locomotives are reported in Table A.16, and
the locomotive fleet make-up is presented in Table A.17. Weighted emission rates, in terms of
grams per gallon of diesel, are shown in Table A.18.
Freight activity was provided in terms of estimated ton-miles in each air basin for 2013, 2040,
and “2040-High.” Straight line interpolation was used to extrapolate 2011 ton-miles, and
converted to fuel consumption, then scaled to match the most recent California Air Resources
Board (CARB) estimated fuel consumption estimate of 210 million gallons of fuel consumed
annually10. Estimated ton-miles and scaled fuel consumption were extrapolated for a
2010 baseline year; and scaled fuel economy was estimated for the 2040 and “2040-high”
activity estimates (Table A.19). Estimated emissions from freight were estimated by combining
these fuel consumption data with the emission rates (Table A.20).
2010 and 2040 Passenger Locomotive Emissions Analysis
Passenger locomotive emissions were estimated, first assuming no electrification based on
existing CARB passenger locomotive data, 11,12 and scaling factors based on estimated passenger
miles of travel (PMT) in each air basin (Table A.21, Table A.22, and Table A.23). This approach
implicitly assumes the mix of locomotive technologies assumed by CARB. The 2035 inventory
was used directly to represent 2040, assuming there would not be changes to the locomotive
fleet and train schedules between 2035 and 2040. Subsequent adjustments are made on these
tables to account for electrification. Statewide emissions from the CARB inventory were used as
a control total; emissions were allocated to each air basin based on the relative distribution of
passenger miles of travel in each air basin.
Table A.24 provides PMT data used to scale the CARB emissions inventory. The 2040 with-
demonstration data were broken out into electric and diesel operation by assuming that in the
San Joaquin Valley, Mojave Desert, San Francisco Bay Area, South Coast, and San Diego, 100
percent of the increases in PMT sources in 2040 (relative to 2040 no plan, and 50 percent of the
2010 to 2040 growth without the demonstration plan) would be electrified and have zero
10
Nicole Dolney and M. Malchow, (2014) Locomotive Inventory Update: Line Haul Activity, CARB tech distribution ref.
(Presentation), 2014, California Air Resources Board. 11
For criteria pollutants: CARB (2016) ARB’s Emission Inventory Activities, California Air resources Board,
Accessed 2016). 12
For CO2: Statewide total based on June 2016 California GHG Inventory, less estimated freight CO2
emissions.

2018 California State Rail Plan
Appendix A.6
Proposed Passenger Improvements and Investments
October 2017
A-44
emissions. Table A.25 then presents the 2040 with-demonstration emissions assuming
electrification.
CO2 emissions from electric power generation were then incorporated into the draft CSRP.
Estimates were based on the megawatt-hours required to power locomotives in each air basin;
and emission factors for power generation assuming California’s Renewable Portfolio Standard.
The final draft will present emissions assuming that all of the electricity used to power the
system will be generated from renewable resources such as solar and wind.
2010 and 2040 On-Road Vehicle Emissions Analysis
On-road emissions were estimated based on emissions for 2010 and 2040 that were calculated
using EMFAC 2014, run for each air basin in California. For passenger vehicles, emission rates
were derived from EMFAC and applied to passenger-vehicle miles of travel estimates from the
CSRP, by air basin. 2010 and 2040 passenger vehicle miles of travel, without the 2040 rail plan,
were scaled to match EMFAC 2014 estimates. Scaling is necessary because the statewide travel
demand model network is courser than the regional model networks that EMFAC default vehicle
miles of travel (VMT) is based on. The 2040 scaling factor was then applied to the reduced 2040
passenger vehicle VMT with the CSRP, and the resulting VMT was used in estimating with CSRP
emissions. Commercial vehicle VMT and emissions were taken directly from EMFAC 2014.
Table A.26 shows the resulting vehicle emissions inventory for 2010, 2040, and 2040 with the
CSRP.
2020 and 2025 Emissions
Straight line interpolation was used to estimate emissions for intermediate analysis years.
Table A.27 and Table A.28 show estimated grams of carbon dioxide emitted per passenger mile
of travel from passenger locomotives and on-road passenger vehicles; these data are derived
from the preceding tables.
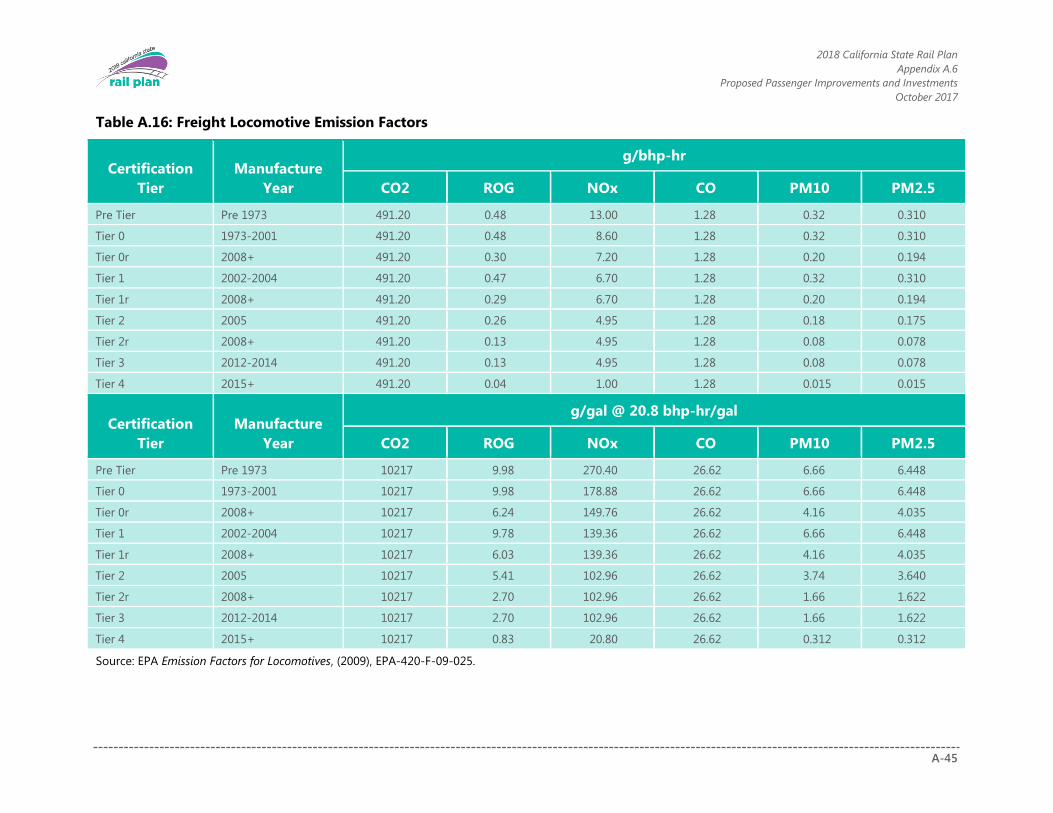
2018 California State Rail Plan
Appendix A.6
Proposed Passenger Improvements and Investments
October 2017
A-45
Table A.16: Freight Locomotive Emission Factors
Certification
Tier
Manufacture
Year
g/bhp-hr
CO2 ROG NOx CO PM10 PM2.5
Pre Tier Pre 1973 491.20 0.48 13.00 1.28 0.32 0.310
Tier 0 1973-2001 491.20 0.48 8.60 1.28 0.32 0.310
Tier 0r 2008+ 491.20 0.30 7.20 1.28 0.20 0.194
Tier 1 2002-2004 491.20 0.47 6.70 1.28 0.32 0.310
Tier 1r 2008+ 491.20 0.29 6.70 1.28 0.20 0.194
Tier 2 2005 491.20 0.26 4.95 1.28 0.18 0.175
Tier 2r 2008+ 491.20 0.13 4.95 1.28 0.08 0.078
Tier 3 2012-2014 491.20 0.13 4.95 1.28 0.08 0.078
Tier 4 2015+ 491.20 0.04 1.00 1.28 0.015 0.015
Certification
Tier
Manufacture
Year
g/gal @ 20.8 bhp-hr/gal
CO2 ROG NOx CO PM10 PM2.5
Pre Tier Pre 1973 10217 9.98 270.40 26.62 6.66 6.448
Tier 0 1973-2001 10217 9.98 178.88 26.62 6.66 6.448
Tier 0r 2008+ 10217 6.24 149.76 26.62 4.16 4.035
Tier 1 2002-2004 10217 9.78 139.36 26.62 6.66 6.448
Tier 1r 2008+ 10217 6.03 139.36 26.62 4.16 4.035
Tier 2 2005 10217 5.41 102.96 26.62 3.74 3.640
Tier 2r 2008+ 10217 2.70 102.96 26.62 1.66 1.622
Tier 3 2012-2014 10217 2.70 102.96 26.62 1.66 1.622
Tier 4 2015+ 10217 0.83 20.80 26.62 0.312 0.312
Source: EPA Emission Factors for Locomotives, (2009), EPA-420-F-09-025.
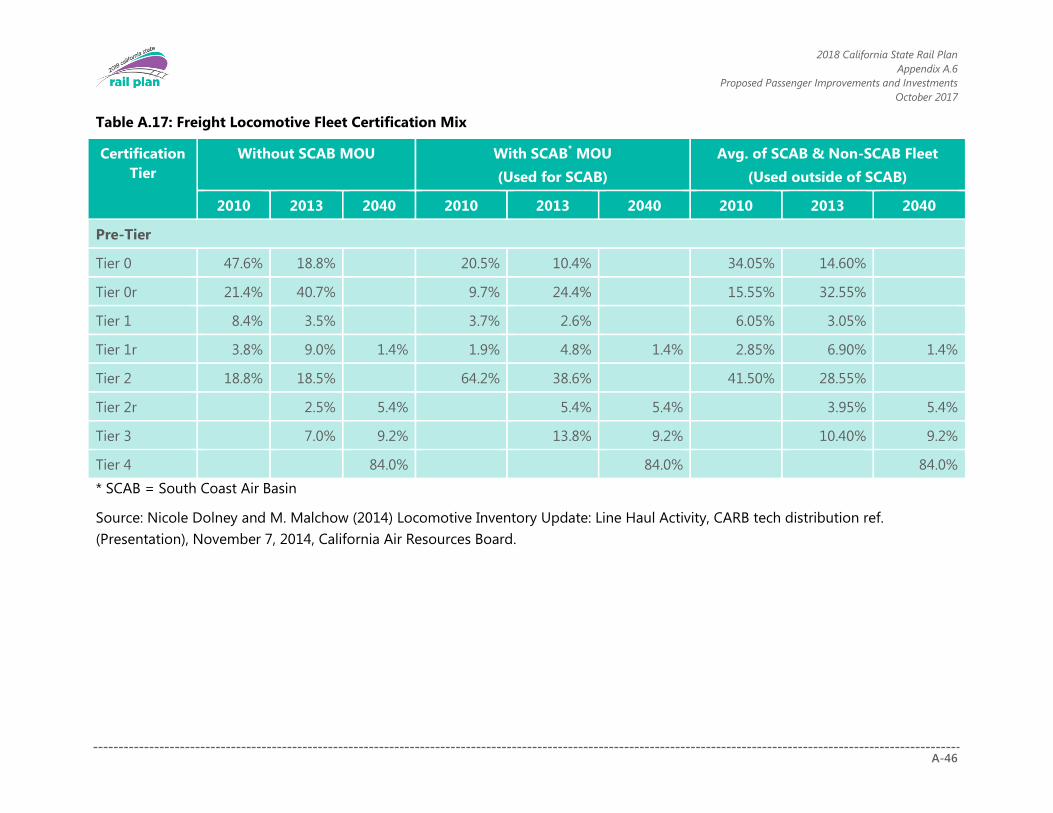
2018 California State Rail Plan
Appendix A.6
Proposed Passenger Improvements and Investments
October 2017
A-46
Table A.17: Freight Locomotive Fleet Certification Mix
Certification
Tier
Without SCAB MOU
With SCAB* MOU
(Used for SCAB)
Avg. of SCAB & Non-SCAB Fleet
(Used outside of SCAB)
2010 2013 2040 2010 2013 2040 2010 2013 2040
Pre-Tier
Tier 0 47.6% 18.8% 20.5% 10.4% 34.05% 14.60%
Tier 0r 21.4% 40.7% 9.7% 24.4% 15.55% 32.55%
Tier 1 8.4% 3.5% 3.7% 2.6% 6.05% 3.05%
Tier 1r 3.8% 9.0% 1.4% 1.9% 4.8% 1.4% 2.85% 6.90% 1.4%
Tier 2 18.8% 18.5% 64.2% 38.6% 41.50% 28.55%
Tier 2r 2.5% 5.4% 5.4% 5.4% 3.95% 5.4%
Tier 3 7.0% 9.2% 13.8% 9.2% 10.40% 9.2%
Tier 4 84.0% 84.0% 84.0%
* SCAB = South Coast Air Basin
Source: Nicole Dolney and M. Malchow (2014) Locomotive Inventory Update: Line Haul Activity, CARB tech distribution ref.
(Presentation), November 7, 2014, California Air Resources Board.
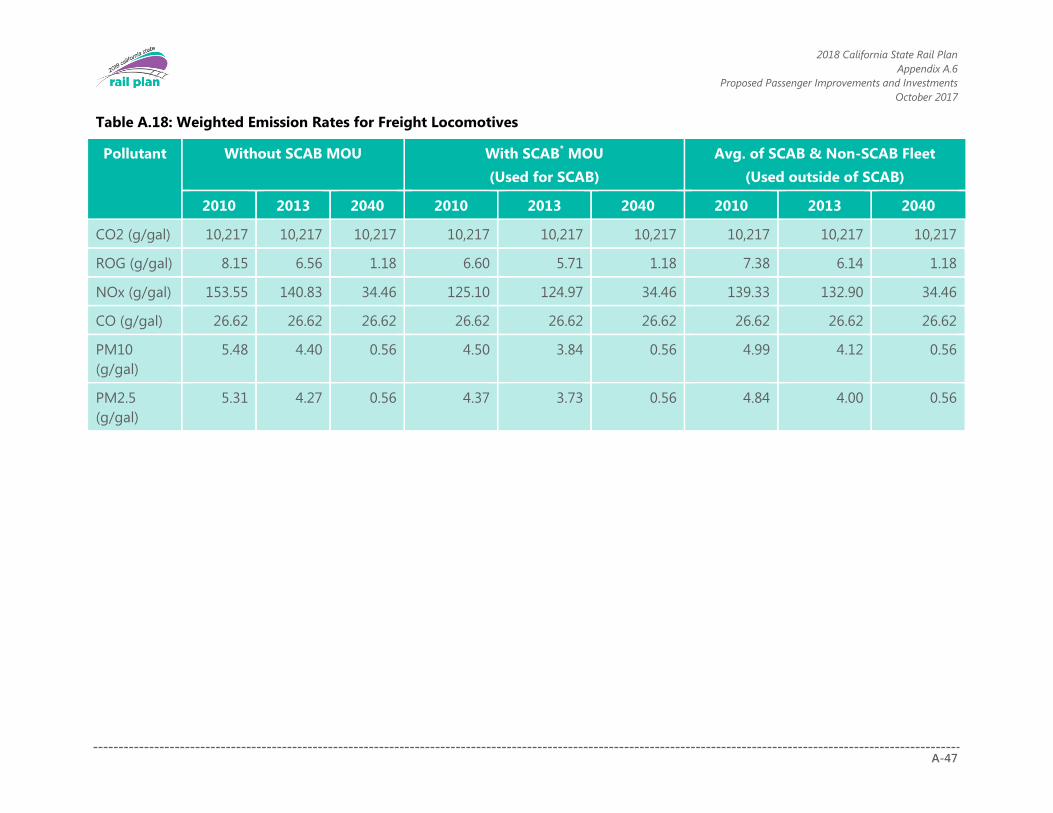
2018 California State Rail Plan
Appendix A.6
Proposed Passenger Improvements and Investments
October 2017
A-47
Table A.18: Weighted Emission Rates for Freight Locomotives
Pollutant Without SCAB MOU
With SCAB* MOU
(Used for SCAB)
Avg. of SCAB & Non-SCAB Fleet
(Used outside of SCAB)
2010 2013 2040 2010 2013 2040 2010 2013 2040
CO2 (g/gal) 10,217 10,217 10,217 10,217 10,217 10,217 10,217 10,217 10,217
ROG (g/gal) 8.15 6.56 1.18 6.60 5.71 1.18 7.38 6.14 1.18
NOx (g/gal) 153.55 140.83 34.46 125.10 124.97 34.46 139.33 132.90 34.46
CO (g/gal) 26.62 26.62 26.62 26.62 26.62 26.62 26.62 26.62 26.62
PM10
(g/gal)
5.48 4.40 0.56 4.50 3.84 0.56 4.99 4.12 0.56
PM2.5
(g/gal)
5.31 4.27 0.56 4.37 3.73 0.56 4.84 4.00 0.56

2018 California State Rail Plan
Appendix A.6
Proposed Passenger Improvements and Investments
October 2017
A-48
Table A.19: Estimated Annual Gallons of Diesel Consumed by Freight Operations (in
millions)
Air Basin 2010 2040 2040 High
Mojave Desert 71.0 101.0 104.1
Mountain Counties 14.4 25.2 25.2
North Central Coast 1.4 2.2 2.2
Northeast Plateau 5.3 7.1 7.1
Sacramento Valley 21.9 31.8 31.8
Salton Sea 4.9 7.3 8.8
San Diego County 1.9 3.0 3.0
San Francisco Bay 7.8 14.3 14.3
San Joaquin Valley 45.0 62.7 62.7
South Central Coast 3.3 3.9 3.9
South Coast 30.5 44.6 58.5

2018 California State Rail Plan
Appendix A.6
Proposed Passenger Improvements and Investments
October 2017
A-49
Table A.20: Estimated Freight Locomotive Emissions
Pollutant Bay Area
& N Cal
Greater LA
and
LOSAN
South
LOSAN
North and
Central
Coast
Xpress
West and
Inland
Empire
Cantal
Valley
Total
2010 Freight Locomotive Emissions (Tons/Day)
CO2 1,525 997 144 2,343 1,390 6,399
ROG 1.10 0.65 0.10 1.69 1.00 4.55
NOx 20.79 12.29 1.96 31.95 18.95 85.95
CO 3.97 2.60 0.37 6.11 3.62 16.67
PM10 0.74 0.44 0.07 1.14 0.68 3.08
PM2.5 0.72 0.43 0.07 1.11 0.66 2.99
2040 (Low Activity) Freight Locomotive Emissions (Tons/Day)
CO2 2,420 1,470 189 3,343 1,935 9,356
ROG 1.75 0.96 0.14 2.41 1.40 6.65
NOx 33.00 18.12 2.57 45.58 26.38 125.67
CO 6.31 3.83 0.49 8.71 5.04 24.38
PM10 1.18 0.65 0.09 1.63 0.94 4.50
PM2.5 1.15 0.63 0.09 1.58 0.92 4.37
2040 (High Activity) Freight Locomotive Emissions (Tons/Day)
CO2 2,420 1,896 189 3,483 1,935 9,923
ROG 1.75 1.23 0.14 2.52 1.40 7.03
NOx 33.00 23.35 2.57 47.50 26.38 132.81
CO 6.31 4.94 0.49 9.08 5.04 25.86
PM10 1.18 0.84 0.09 1.70 0.94 4.76
PM2.5 1.15 0.81 0.09 1.65 0.92 4.62
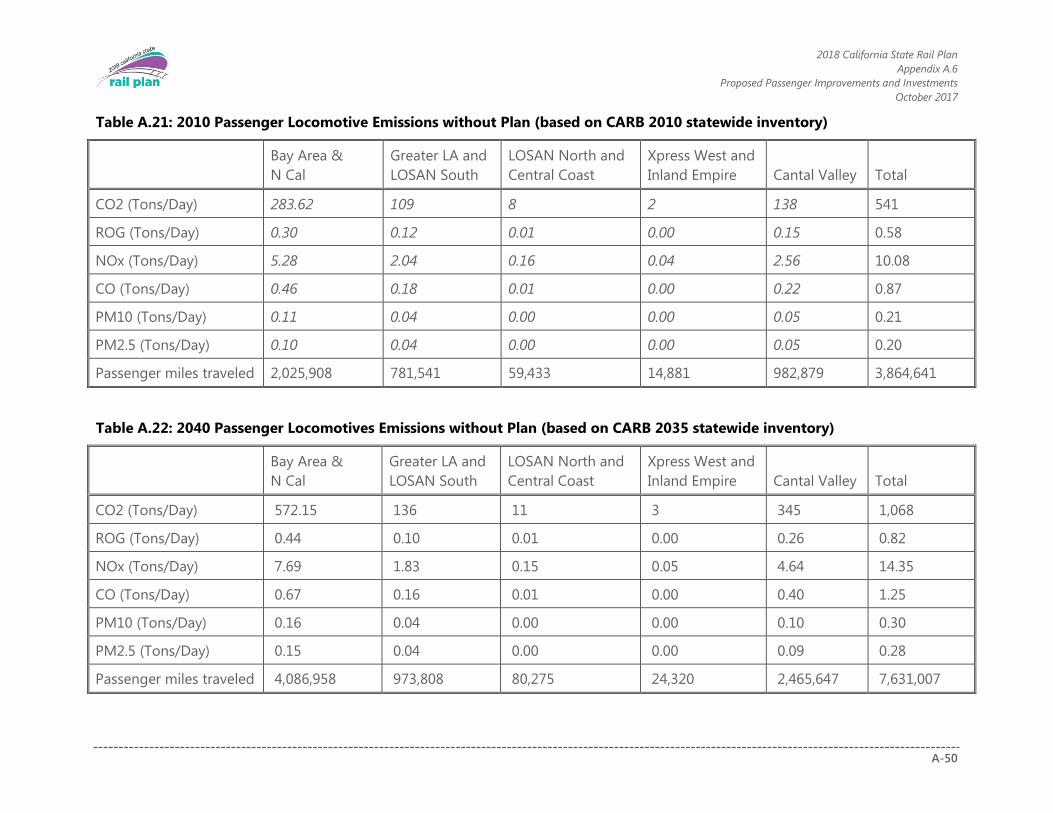
2018 California State Rail Plan
Appendix A.6
Proposed Passenger Improvements and Investments
October 2017
A-50
Table A.21: 2010 Passenger Locomotive Emissions without Plan (based on CARB 2010 statewide inventory)
Bay Area &
N Cal
Greater LA and
LOSAN South
LOSAN North and
Central Coast
Xpress West and
Inland Empire Cantal Valley Total
CO2 (Tons/Day) 283.62 109 8 2 138 541
ROG (Tons/Day) 0.30 0.12 0.01 0.00 0.15 0.58
NOx (Tons/Day) 5.28 2.04 0.16 0.04 2.56 10.08
CO (Tons/Day) 0.46 0.18 0.01 0.00 0.22 0.87
PM10 (Tons/Day) 0.11 0.04 0.00 0.00 0.05 0.21
PM2.5 (Tons/Day) 0.10 0.04 0.00 0.00 0.05 0.20
Passenger miles traveled 2,025,908 781,541 59,433 14,881 982,879 3,864,641
Table A.22: 2040 Passenger Locomotives Emissions without Plan (based on CARB 2035 statewide inventory)
Bay Area &
N Cal
Greater LA and
LOSAN South
LOSAN North and
Central Coast
Xpress West and
Inland Empire Cantal Valley Total
CO2 (Tons/Day) 572.15 136 11 3 345 1,068
ROG (Tons/Day) 0.44 0.10 0.01 0.00 0.26 0.82
NOx (Tons/Day) 7.69 1.83 0.15 0.05 4.64 14.35
CO (Tons/Day) 0.67 0.16 0.01 0.00 0.40 1.25
PM10 (Tons/Day) 0.16 0.04 0.00 0.00 0.10 0.30
PM2.5 (Tons/Day) 0.15 0.04 0.00 0.00 0.09 0.28
Passenger miles traveled 4,086,958 973,808 80,275 24,320 2,465,647 7,631,007

2018 California State Rail Plan
Appendix A.6
Proposed Passenger Improvements and Investments
October 2017
A-51
Table A.23: 2040 Passenger Locomotives Emissions with Plan (based on PMT scaling of 2040 no plan data and no
electrification)
Bay Area & N
Cal
Greater LA and
LOSAN South
LOSAN North
and Central
Coast
Xpress West and
Inland Empire Cantal Valley Total
CO2 (Tons/Day) 2,968 3,777 104 1,575 5,578 19,849
ROG (Tons/Day) 2.28 2.90 0.08 1.21 4.28 14.34
NOx (Tons/Day) 39.87 50.74 1.40 21.15 74.93 266.62
CO (Tons/Day) 3.47 4.42 0.12 1.84 6.53 21.97
PM10 (Tons/Day) 0.83 1.06 0.03 0.44 1.57 4.97
PM2.5 (Tons/Day) 0.78 0.99 0.03 0.41 1.46 4.87
Passenger miles
traveled
21,204,118 26,982,374 742,253 11,246,981 39,845,493 100,021,220
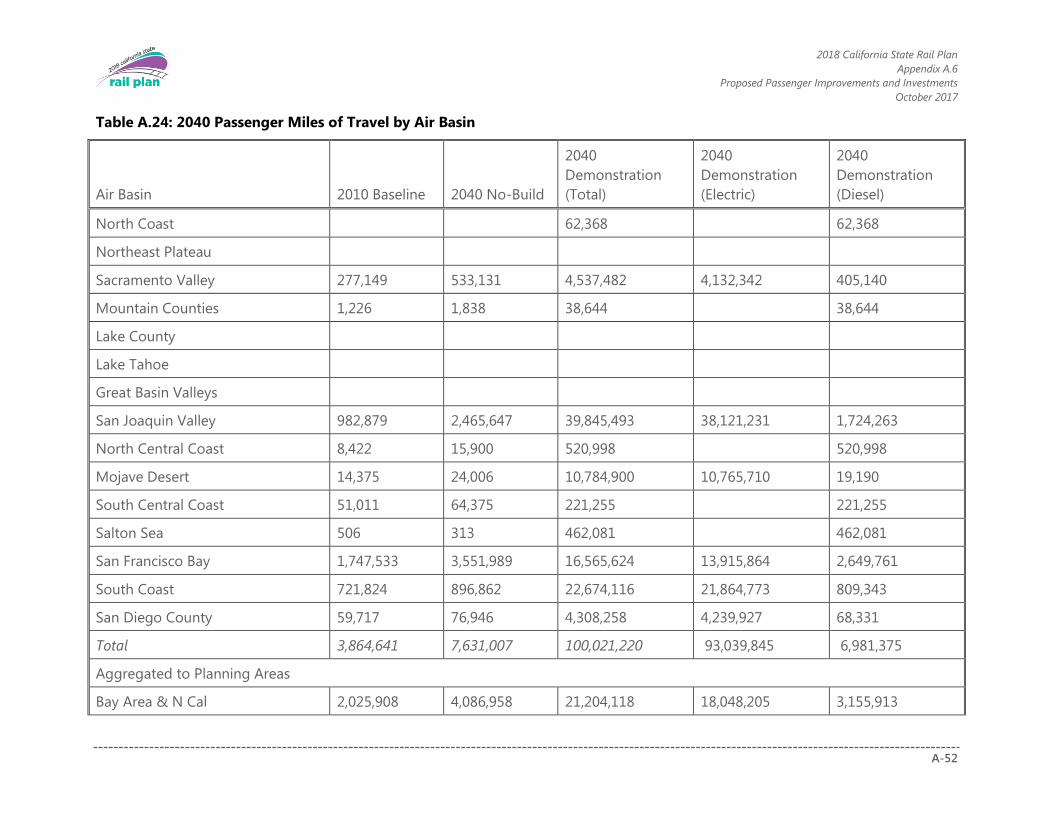
2018 California State Rail Plan
Appendix A.6
Proposed Passenger Improvements and Investments
October 2017
A-52
Table A.24: 2040 Passenger Miles of Travel by Air Basin
Air Basin 2010 Baseline 2040 No-Build
2040
Demonstration
(Total)
2040
Demonstration
(Electric)
2040
Demonstration
(Diesel)
North Coast
62,368
62,368
Northeast Plateau
Sacramento Valley 277,149 533,131 4,537,482 4,132,342 405,140
Mountain Counties 1,226 1,838 38,644 38,644
Lake County
Lake Tahoe
Great Basin Valleys
San Joaquin Valley 982,879 2,465,647 39,845,493 38,121,231 1,724,263
North Central Coast 8,422 15,900 520,998 520,998
Mojave Desert 14,375 24,006 10,784,900 10,765,710 19,190
South Central Coast 51,011 64,375 221,255 221,255
Salton Sea 506 313 462,081 462,081
San Francisco Bay 1,747,533 3,551,989 16,565,624 13,915,864 2,649,761
South Coast 721,824 896,862 22,674,116 21,864,773 809,343
San Diego County 59,717 76,946 4,308,258 4,239,927 68,331
Total 3,864,641 7,631,007 100,021,220 93,039,845 6,981,375
Aggregated to Planning Areas
Bay Area & N Cal 2,025,908 4,086,958 21,204,118 18,048,205 3,155,913

2018 California State Rail Plan
Appendix A.6
Proposed Passenger Improvements and Investments
October 2017
A-53
Air Basin 2010 Baseline 2040 No-Build
2040
Demonstration
(Total)
2040
Demonstration
(Electric)
2040
Demonstration
(Diesel)
Greater LA and LOSAN South 781,541 973,808 26,982,374 26,104,700 877,674
LOSAN North and Central Coast 59,433 80,275 742,253 742,253
Xpress West and Inland Empire 14,881 24,320 11,246,981 10,765,710 481,271
Cantal Valley 982,879 2,465,647 39,845,493 38,121,231 1,724,263
Bay Area and N. Cal = North Coast, Northeast Plateau, Sacramento Valley, Mountain Counties, Lake County, Lake Tahoe, San Francisco Bay Area
Greater LA and LOSAN South = South Coast, San Diego County
LOSAN North and Central Coast = North Central Coast, South Central Coast
Xpress West and Inland Empire = Great Basin Valleys, Mojave Desert, Salton Sea
Central Valley = San Joaquin Valley
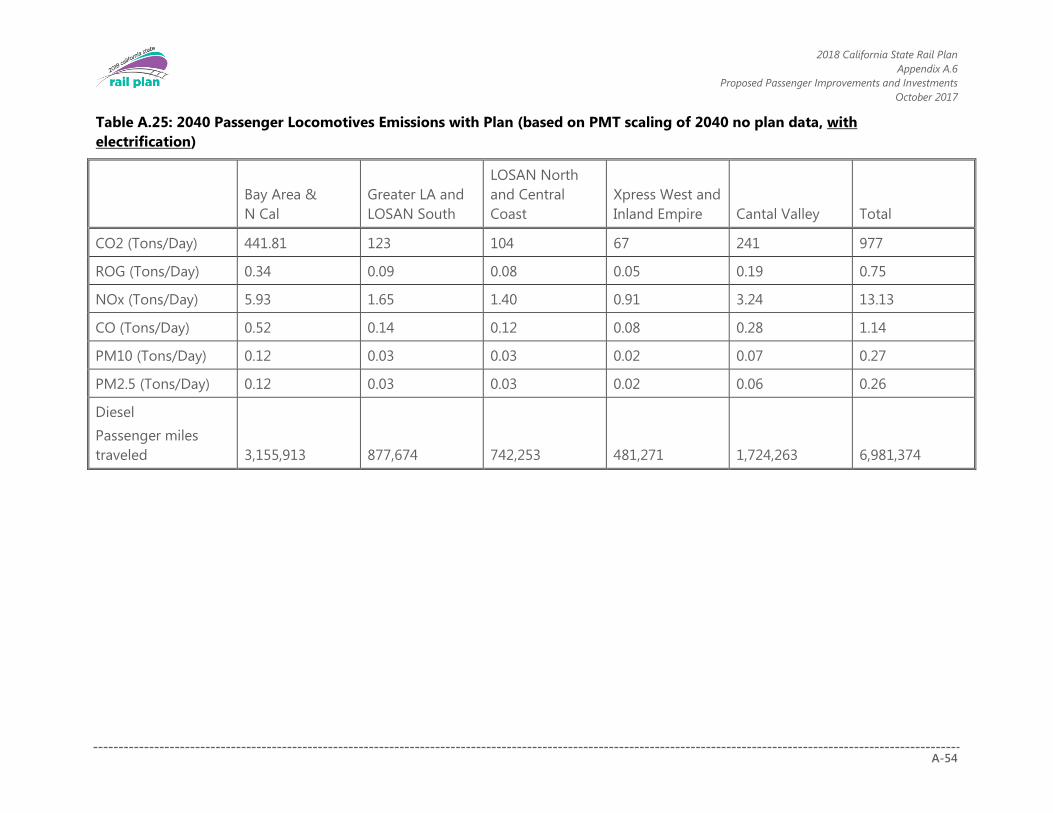
2018 California State Rail Plan
Appendix A.6
Proposed Passenger Improvements and Investments
October 2017
A-54
Table A.25: 2040 Passenger Locomotives Emissions with Plan (based on PMT scaling of 2040 no plan data, with
electrification)
Bay Area &
N Cal
Greater LA and
LOSAN South
LOSAN North
and Central
Coast
Xpress West and
Inland Empire Cantal Valley Total
CO2 (Tons/Day) 441.81 123 104 67 241 977
ROG (Tons/Day) 0.34 0.09 0.08 0.05 0.19 0.75
NOx (Tons/Day) 5.93 1.65 1.40 0.91 3.24 13.13
CO (Tons/Day) 0.52 0.14 0.12 0.08 0.28 1.14
PM10 (Tons/Day) 0.12 0.03 0.03 0.02 0.07 0.27
PM2.5 (Tons/Day) 0.12 0.03 0.03 0.02 0.06 0.26
Diesel
Passenger miles
traveled 3,155,913 877,674 742,253 481,271 1,724,263 6,981,374

2018 California State Rail Plan
Appendix A.6
Proposed Passenger Improvements and Investments
October 2017
A-55
Table A.26: Emissions Based on EMFAC 2014 Emissions Inventory Scaled by Changes in
Passenger Vehicle (LDA, LDT1, LDT2, MDV, MC) VMT in Each Air Basin
Bay Area &
N Cal
Greater LA
and LOSAN
South
LOSAN
North and
Central
Coast
Xpress
West and
Inland
Empire
Cantal
Valley Total
2010 Baseline (Tons/Day)
CO2 (Tons/Day) 140,463 238,338 27,627 34,394 62,532 503,353
ROG (Tons/Day) 149.0 207.7 30.8 34.0 59.5 480.98
NOx (Tons/Day) 352.1 469.3 67.6 116.1 225.1 1,230.13
CO (Tons/Day) 1,201.9 1,793.2 256.3 279.1 439.4 3,969.91
PM10 (Tons/Day) 22.5 34.6 4.3 6.5 12.0 79.99
PM2.5 (Tons/Day) 13.3 19.5 2.5 4.4 8.3 47.90
VMT 253,744,662 425,988,835 50,814,352 55,250,354 93,058,417 878,856,620
2040 No Plan (Tons/Day)
CO2 (Tons/Day) 106,453 185,041 19,051 32,252 62,980 405,777
ROG (Tons/Day) 30.3 50.6 5.7 8.3 12.8 107.73
NOx (Tons/Day) 57.7 87.5 8.9 17.4 44.4 215.93
CO (Tons/Day) 199.2 357.2 38.1 59.9 84.7 739.10
PM10 (Tons/Day) 18.9 32.0 3.6 5.0 9.1 68.52
PM2.5 (Tons/Day) 7.7 13.1 1.5 2.0 3.7 28.06
VMT 327,697,848 554,658,688 62,930,263 81,789,654 149,282,777 1,176,359,230
2040 with Plan (Tons/Day)
CO2 (Tons/Day) 104,429 179,830 18,259 31,540 59,032 393,090
ROG (Tons/Day) 29 49 5 8 11 102.99
NOx (Tons/Day) 57 87 9 17 44 213.80
CO (Tons/Day) 194 344 36 58 75 707.27
PM10 (Tons/Day) 18 31 3 5 8 65.82
PM2.5 (Tons/Day) 8 13 1 2 3 26.96
VMT 318,824,265 533,299,372 59,560,214 78,670,294 132,319,796 1,122,673,942

2018 California State Rail Plan
Appendix A.6
Proposed Passenger Improvements and Investments
October 2017
A-56
Bay Area &
N Cal
Greater LA
and LOSAN
South
LOSAN
North and
Central
Coast
Xpress
West and
Inland
Empire
Cantal
Valley Total
Plan Emission Reduction Benefit (Tons/Day)
CO2 (Tons/Day) 2,024 5,211 792 712 3,948 12,687
ROG (Tons/Day) 0.77 1.93 0.31 0.31 1.42 5
NOx (Tons/Day) 0.34 0.85 0.16 0.16 0.62 2
CO (Tons/Day) 5.08 13.10 2.11 2.14 9.40 32
PM10 (Tons/Day) 0.45 1.07 0.17 0.16 0.85 3
PM2.5 (Tons/Day) 0.18 0.44 0.07 0.06 0.35 1
VMT 8,873,582 21,359,317 3,370,049 3,119,360 16,962,981 53,685,288

2018 California State Rail Plan
Appendix A.6
Proposed Passenger Improvements and Investments
October 2017
A-57
Table A.27: Passenger Locomotive Emissions per Passenger Mile Traveled (g/PMT)
2010
baseline
(g/PMT)
2040
no plan
(g/PMT)
2040
demonstration
(g/PMT)
CO2 127.00 127.00 8.86
ROG 0.14 0.10 0.01
NOx 2.37 1.71 0.12
CO 0.20 0.15 0.01
Exhaust PM10 0.05 0.04 0.00
Exhaust PM2.5 0.05 0.03 0.00
Table A.28: Passenger Vehicle Emissions per Passenger Mile Traveled (g/PMT)
2010 2040
Trip length 5.50 4.93
CO2 363 179
ROG 0.38 0.07
NOx 0.34 0.03
CO 3.28 0.46
PM10 0.04 0.04
PM2.5 0.02 0.02
Based on assumed vehicle occupancy of 1.2 passengers per vehicle
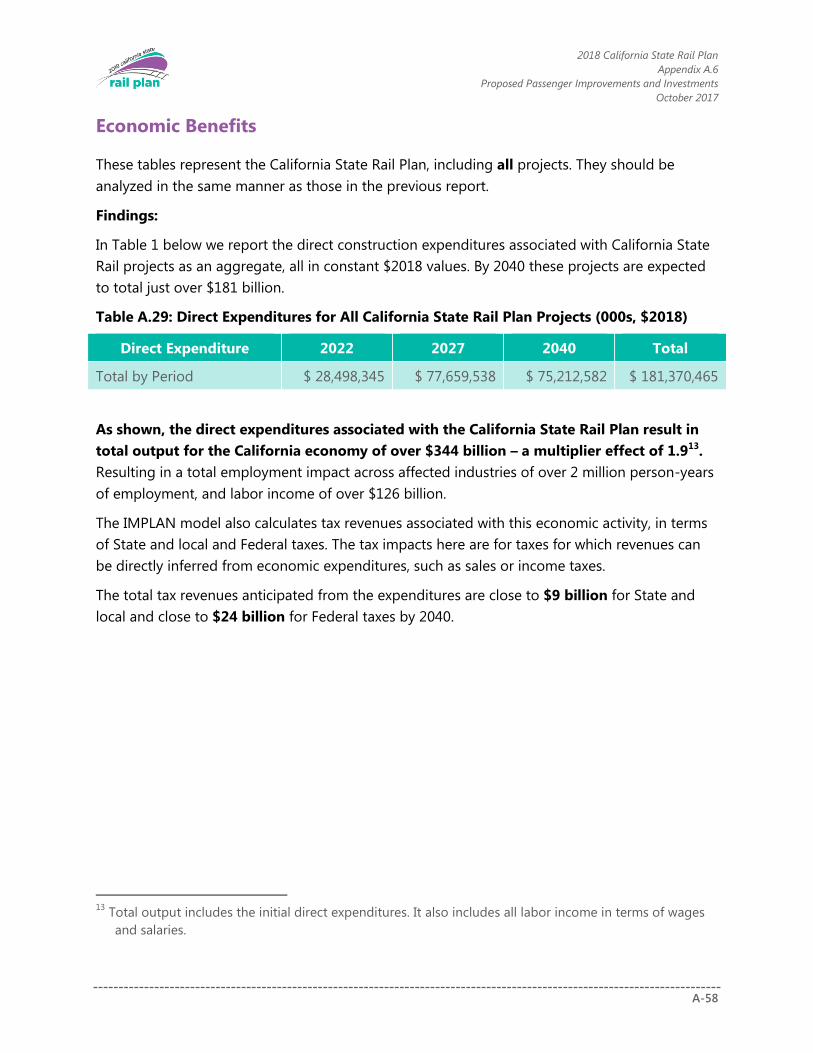
2018 California State Rail Plan
Appendix A.6
Proposed Passenger Improvements and Investments
October 2017
A-58
Economic Benefits
These tables represent the California State Rail Plan, including all projects. They should be
analyzed in the same manner as those in the previous report.
Findings:
In Table 1 below we report the direct construction expenditures associated with California State
Rail projects as an aggregate, all in constant $2018 values. By 2040 these projects are expected
to total just over $181 billion.
Table A.29: Direct Expenditures for All California State Rail Plan Projects (000s, $2018)
Direct Expenditure 2022 2027 2040 Total
Total by Period $ 28,498,345 $ 77,659,538 $ 75,212,582 $ 181,370,465
As shown, the direct expenditures associated with the California State Rail Plan result in
total output for the California economy of over $344 billion – a multiplier effect of 1.913.
Resulting in a total employment impact across affected industries of over 2 million person-years
of employment, and labor income of over $126 billion.
The IMPLAN model also calculates tax revenues associated with this economic activity, in terms
of State and local and Federal taxes. The tax impacts here are for taxes for which revenues can
be directly inferred from economic expenditures, such as sales or income taxes.
The total tax revenues anticipated from the expenditures are close to $9 billion for State and
local and close to $24 billion for Federal taxes by 2040.
13
Total output includes the initial direct expenditures. It also includes all labor income in terms of wages
and salaries.

2018 California State Rail Plan
Appendix A.6
Proposed Passenger Improvements and Investments
October 2017
A-59
Table A.30: Total Economic Impacts: Employment, Income, and Total Expenditures (000s,
$2018)
Impact Summary 2022 2027 2040 Total
Direct Expenditure Impacts (A):
Employment (Person Years) $ 180,656 $ 492,298 $ 476,786 $ 1,149,740
Labor Income ($) $ 11,154,666 $ 30,397,070 $ 29,439,296 $ 70,991,032
Output ($) $ 28,478,301 $ 77,604,918 $ 75,159,683 $ 181,242,902
Indirect Expenditure Impacts (B):
Employment (Person Years) $ 57,498 $ 156,685 $ 151,748 $ 365,931
Labor Income ($) $ 3,990,015 $ 10,873,007 $ 10,530,412 $ 25,393,434
Output ($) $ 11,972,622 $ 32,626,045 $ 31,598,038 $ 76,196,705
Induced Expenditure Impacts (C):
Employment (Person Years) $ 85,342 $ 232,561 $ 225,234 $ 543,137
Labor Income ($) $ 4,655,404 $ 12,686,230 $ 12,286,502 $ 29,628,136
Output ($) $ 13,679,629 $ 37,277,732 $ 36,103,157 $ 87,060,518
Total Impacts (A + B + C):
Employment (Person Years) $ 323,496 $ 881,544 $ 853,768 $ 2,058,808
Labor Income ($) $ 19,800,085 $ 53,956,307 $ 52,256,210 $ 126,012,602
Output ($) $ 54,130,552 $ 147,508,695 $ 142,860,878 $ 344,500,125
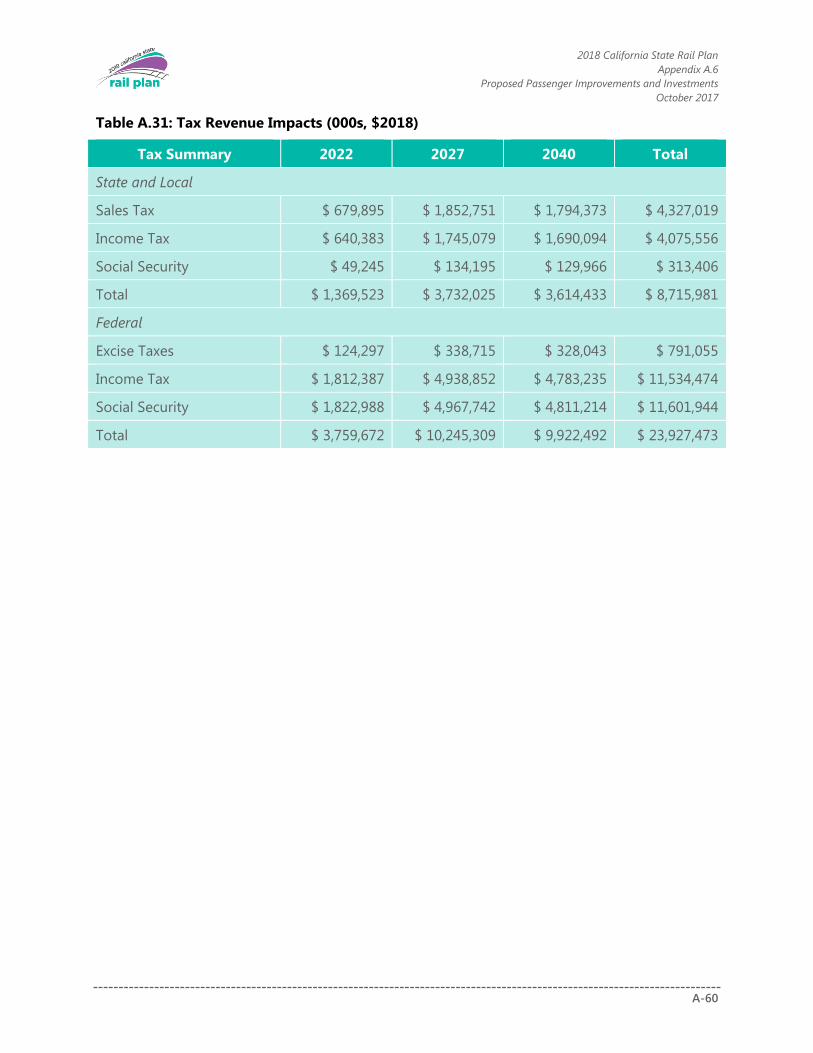
2018 California State Rail Plan
Appendix A.6
Proposed Passenger Improvements and Investments
October 2017
A-60
Table A.31: Tax Revenue Impacts (000s, $2018)
Tax Summary 2022 2027 2040 Total
State and Local
Sales Tax $ 679,895 $ 1,852,751 $ 1,794,373 $ 4,327,019
Income Tax $ 640,383 $ 1,745,079 $ 1,690,094 $ 4,075,556
Social Security $ 49,245 $ 134,195 $ 129,966 $ 313,406
Total $ 1,369,523 $ 3,732,025 $ 3,614,433 $ 8,715,981
Federal
Excise Taxes $ 124,297 $ 338,715 $ 328,043 $ 791,055
Income Tax $ 1,812,387 $ 4,938,852 $ 4,783,235 $ 11,534,474
Social Security $ 1,822,988 $ 4,967,742 $ 4,811,214 $ 11,601,944
Total $ 3,759,672 $ 10,245,309 $ 9,922,492 $ 23,927,473

2018 California State Rail Plan
Appendix A.6
Proposed Passenger Improvements and Investments
October 2017
A-61
2027 and 2040 Capital Projects Details
Table A.32: 2027 Capital Projects Details
Planning
Area
Corridor 2027 Projects 2027 Cost 14
South Bay
Area
San Francisco-San
Jose-Gilroy
San Francisco-San Jose Grade
Separations, Level Boarding, Longer
Trains and Performance Improvement
(Phase 1)
$5,000,000
San Jose-Gilroy Service Increase
Diridon Station Mobility Hub Phase 1
Downtown Extension from 4th & King
to Transbay Terminal
Corridor Capacity & Safety
Improvement Project Development
Altamont, East Bay
(south of Oakland) &
Dumbarton
Oakland-San Jose Capacity Increase
for Passenger and Goods Movement
$2,300,000
Tri-Valley Connectivity Between BART
and the Statewide Rail Network
Dumbarton Rail Crossing Integration
with Statewide Rail Network (Phase 1)
Altamont Corridor Capacity Increase
for Passenger and Goods Movement
I-680 Integrated Express Bus
Multiple Regional Network & Service
Integration Project Development
(Peninsula, Dumbarton, East Bay,
Altamont)
$20,000
14
Estimated costs in 2018 dollars. These costs are planning-level estimates and require further study in
implementation.

2018 California State Rail Plan
Appendix A.6
Proposed Passenger Improvements and Investments
October 2017
A-62
Planning
Area
Corridor 2027 Projects 2027 Cost 14
North Bay
Area
San Francisco-
Oakland
New Transbay Crossing Project
Development
$60,000
Oakland-Sacramento Martinez Station Capacity
Improvement for Corridor
Connectivity
$100,000
Stockton-Martinez Capacity Upgrades
for Bi-Hourly Service
Corridor-Wide Station Capacity &
Safety Improvements
Multiple North Bay to Sacramento Network &
Service Integration Project
Development (Marin, Sonoma, Napa,
Solano, Yolo, Sacramento, Contra
Costa, Alameda)
$10,000
Larkspur-Cloverdale SMART Sonoma County Airport to
Cloverdale Extension, including Fleet
$350,000
Central
Valley/Sierra
Nevada
Sacramento-
Roseville
Placer County Service Expansion (Ph
2)
$200,000
Fresno/Merced-
Stockton-
Sacramento
Regional Rail Expansion to Merced &
Sacramento
$950,000
Hourly Service from Fresno to
Sacramento
Madera Mobility Hub
Sierra Nevada Integrated Express Bus
North State Integrated Express Bus
Expansion
Central Coast Gilroy-Goleta Bi-Hourly Integrated Service from
Salinas & Hollister to Gilroy
$250,000
San Luis Obispo-Salinas Intercity Rail
Increase and Bi-Hourly Integrated
Service
Bi-Hourly Integrated Service from
Paso Robles to the Central Valley

2018 California State Rail Plan
Appendix A.6
Proposed Passenger Improvements and Investments
October 2017
A-63
Planning
Area
Corridor 2027 Projects 2027 Cost 14
Goleta-San Luis Obispo Intercity Rail
Increase and Bi-Hourly Integrated
Service
LOSSAN North Goleta/Santa Clarita-
Burbank-LA
Bi-Hourly Express Service Goleta-LA $550,000
Hourly Local Service Chatsworth-LA
Hourly Local Service Santa Clarita-LA
Vegas to
Palmdale
Victorville to
Las Vegas
HSR Palmdale-Las Vegas $10,500,000
Palmdale to
Victorville
LA Urban
Mobility
Corridor
LA Union Station LA Union Station Passenger Capacity
Expansion & Run Through Tracks
$2,500,000
Burbank-LA-
Anaheim
Corridor Capacity & Grade Separation
Projects for 1st Phase of Integrated
Local and Express Service
Inland Empire Multiple 1st Phase Integrated Local and
Express Service Los Angeles-San
Bernardino
$950,000
1st Phase Integrated Local Service Los
Angeles-Riverside-Perris Valley
1st Phase Integrated Local Service
Riverside-Orange County
Initial Service to Coachella Valley
LOSSAN South Anaheim-San Diego 1st Phase Integrated Local and
Express Service LA-Anaheim-San
Diego
$950,000
Statewide Multiple Amtrak/State Equipment
Replacement, Fleet Capacity
Expansion & Maintenance Facility
Investment
$900,000
Corridor Service Improvement -
Capitalized Maintenance
$20,000
HSR Central Valley to Bay Area $21,100,000

2018 California State Rail Plan
Appendix A.6
Proposed Passenger Improvements and Investments
October 2017
A-64
Planning
Area
Corridor 2027 Projects 2027 Cost 14
Integrated Express Bus in Partnership
with Regional Service
$150,000
Project Development for Statewide
Network Investments
$100,000
Fare Integration - Phase 2 $40,000
Total S47,000,000
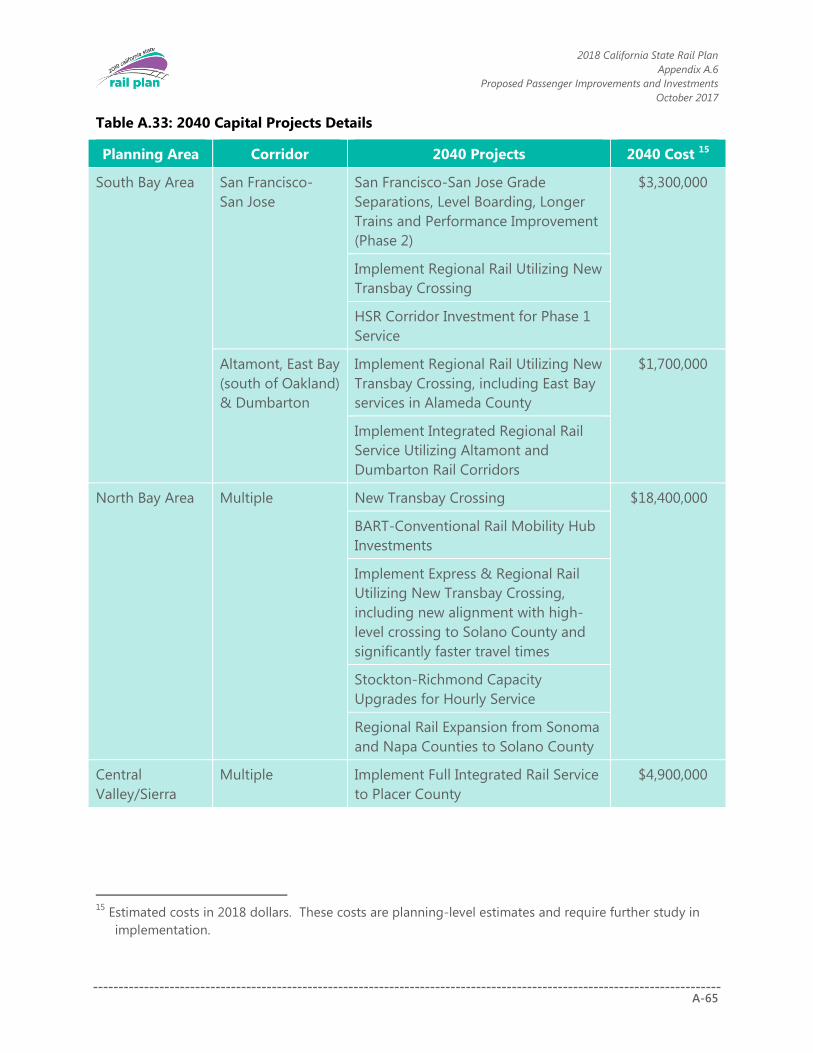
2018 California State Rail Plan
Appendix A.6
Proposed Passenger Improvements and Investments
October 2017
A-65
Table A.33: 2040 Capital Projects Details
Planning Area Corridor 2040 Projects 2040 Cost 15
South Bay Area San Francisco-
San Jose
San Francisco-San Jose Grade
Separations, Level Boarding, Longer
Trains and Performance Improvement
(Phase 2)
$3,300,000
Implement Regional Rail Utilizing New
Transbay Crossing
HSR Corridor Investment for Phase 1
Service
Altamont, East Bay
(south of Oakland)
& Dumbarton
Implement Regional Rail Utilizing New
Transbay Crossing, including East Bay
services in Alameda County
$1,700,000
Implement Integrated Regional Rail
Service Utilizing Altamont and
Dumbarton Rail Corridors
North Bay Area Multiple New Transbay Crossing $18,400,000
BART-Conventional Rail Mobility Hub
Investments
Implement Express & Regional Rail
Utilizing New Transbay Crossing,
including new alignment with high-
level crossing to Solano County and
significantly faster travel times
Stockton-Richmond Capacity
Upgrades for Hourly Service
Regional Rail Expansion from Sonoma
and Napa Counties to Solano County
Central
Valley/Sierra
Nevada
Multiple Implement Full Integrated Rail Service
to Placer County
$4,900,000
15
Estimated costs in 2018 dollars. These costs are planning-level estimates and require further study in
implementation.
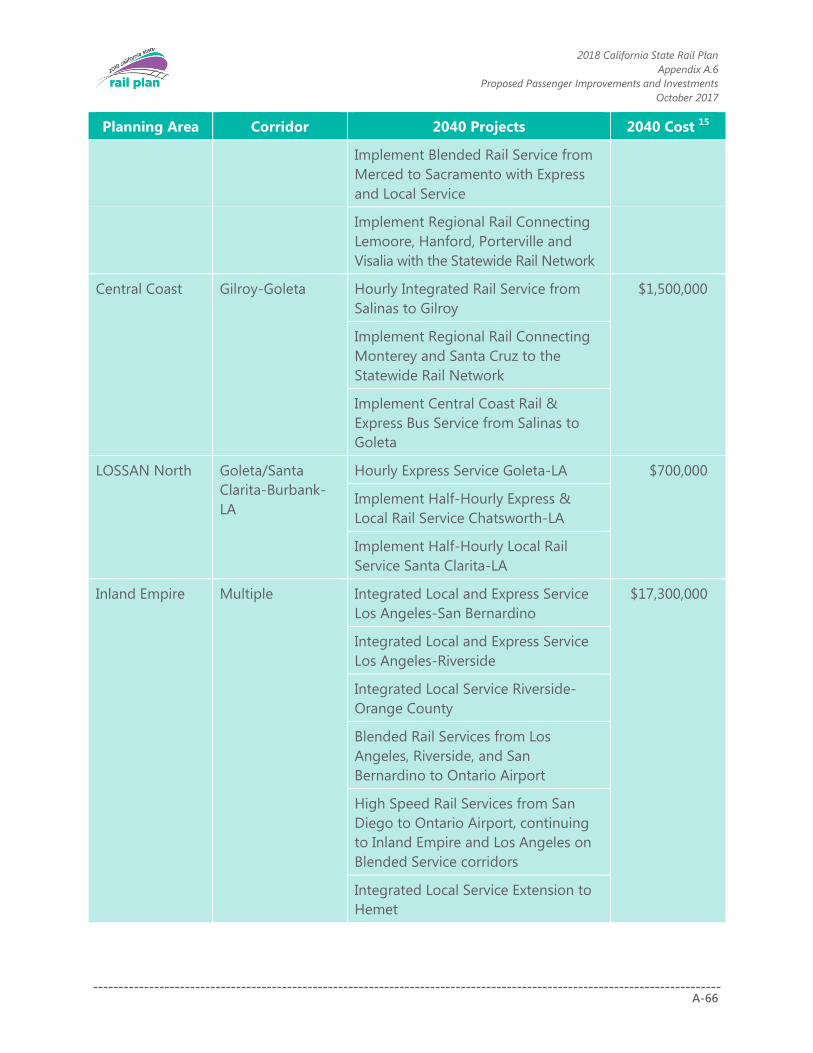
2018 California State Rail Plan
Appendix A.6
Proposed Passenger Improvements and Investments
October 2017
A-66
Planning Area Corridor 2040 Projects 2040 Cost 15
Implement Blended Rail Service from
Merced to Sacramento with Express
and Local Service
Implement Regional Rail Connecting
Lemoore, Hanford, Porterville and
Visalia with the Statewide Rail Network
Central Coast Gilroy-Goleta Hourly Integrated Rail Service from
Salinas to Gilroy
$1,500,000
Implement Regional Rail Connecting
Monterey and Santa Cruz to the
Statewide Rail Network
Implement Central Coast Rail &
Express Bus Service from Salinas to
Goleta
LOSSAN North Goleta/Santa
Clarita-Burbank-
LA
Hourly Express Service Goleta-LA $700,000
Implement Half-Hourly Express &
Local Rail Service Chatsworth-LA
Implement Half-Hourly Local Rail
Service Santa Clarita-LA
Inland Empire Multiple Integrated Local and Express Service
Los Angeles-San Bernardino
$17,300,000
Integrated Local and Express Service
Los Angeles-Riverside
Integrated Local Service Riverside-
Orange County
Blended Rail Services from Los
Angeles, Riverside, and San
Bernardino to Ontario Airport
High Speed Rail Services from San
Diego to Ontario Airport, continuing
to Inland Empire and Los Angeles on
Blended Service corridors
Integrated Local Service Extension to
Hemet
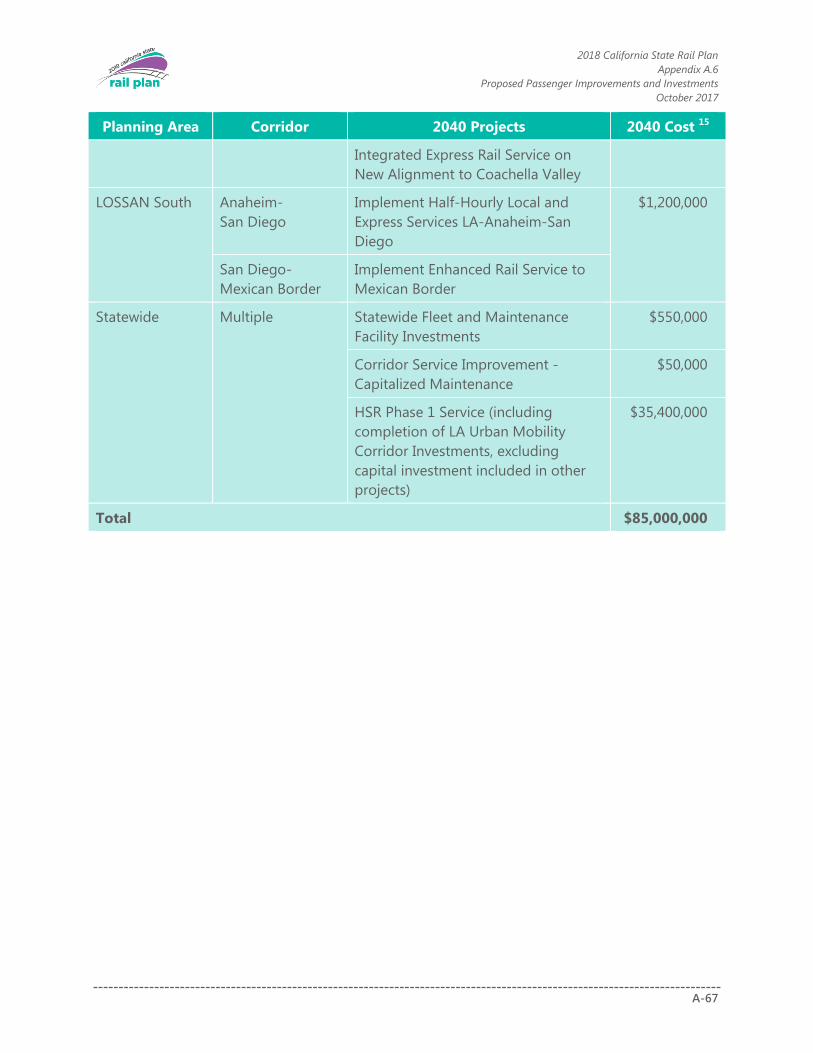
2018 California State Rail Plan
Appendix A.6
Proposed Passenger Improvements and Investments
October 2017
A-67
Planning Area Corridor 2040 Projects 2040 Cost 15
Integrated Express Rail Service on
New Alignment to Coachella Valley
LOSSAN South Anaheim-
San Diego
Implement Half-Hourly Local and
Express Services LA-Anaheim-San
Diego
$1,200,000
San Diego-
Mexican Border
Implement Enhanced Rail Service to
Mexican Border
Statewide Multiple Statewide Fleet and Maintenance
Facility Investments
$550,000
Corridor Service Improvement -
Capitalized Maintenance
$50,000
HSR Phase 1 Service (including
completion of LA Urban Mobility
Corridor Investments, excluding
capital investment included in other
projects)
$35,400,000
Total $85,000,000

2018 California State Rail Plan
Appendix A.7
Public Outreach and Stakeholder Involvement Details
October 2017
A-68
Appendix A.7
Public Outreach and Stakeholder
Involvement Details
Freight Meetings
Date Freight Railroad Type of Outreach
2/4/2016 California Freight Advisory Committee In-person meeting
5/5/2016 Santa Maria Railroad In-person Interview
5/6/2016 Pacific Harbor Lines In-person Interview
5/11/2016 Pacific Sun Railroad Phone Interview
5/19/2016 Central California Traction Phone Interview
5/24/2016 Northwestern Pacific Phone Interview
5/25/2016 Richmond Pacific Phone Interview
5/27/2016 Modesto & Empire Traction Phone Interview
6/8/2016 Sierra Northern In-person Interview
6/8/2016 Sacramento Valley Railroad In-person Interview
11/9/2016 BNSF In-person briefing
8/17/2016 CA Short Line Railroad Association In-person briefing
9/12/2016 California Freight Advisory Committee In-person meeting
11/10/2016 CA Short Line Railroad Association In-person briefing
11/14/2016 Union Pacific In-person briefing

2018 California State Rail Plan
Appendix A.7
Public Outreach and Stakeholder Involvement Details
October 2017
A-69
Network Integration Strategic Service Planning (NI SSP) Agency
Meetings
Date Agency Type of Outreach
6/27/2016 Transportation Agency for Monterey County In-person meetings
6/27/2016 San Luis Obispo Council of Governments In-person meetings
6/27/2016 Santa Cruz County Regional Transportation Commission In-person meetings
6/27/2016 San Benito Council of Governments In-person meetings
6/28/2016 Caltrain In-person meetings
6/28/2016 Metropolitan Transportation Commission In-person meetings
7/6/2016 Southern California High Speed Rail Authority In-person meetings
7/6/2016 LOSSAN Joint Powers Authority In-person meetings
7/6/2016 Orange County Transportation Authority In-person meetings
7/7/2016 Alameda County Transportation Commission In-person meetings
7/7/2016 San Francisco County Transportation Authority In-person meetings
7/7/2016 Valley Transportation Authority In-person meetings
7/8/2016 Sacramento Area Council of Governments In-person meetings
7/8/2016 Sacramento Regional Transit In-person meetings
7/8/2016 Sonoma-Marin Area Rail Transit In-person meetings
7/11/2016 Metrolink In-person meetings
7/11/2016 Riverside County Transportation Commission In-person meetings
7/12/2016 San Bernardino Association of Governments In-person meetings
7/13/2016 San Diego Association of Governments In-person meetings
7/13/2016 North County Transit District In-person meetings
7/13/2016 San Diego Metropolitan Transit System In-person meetings
7/14/2016 Southern California Association of Governments In-person meetings
7/14/2016 California High-Speed Rail Authority In-person meetings
7/15/2016 Santa Barbara County Association of Governments In-person meetings
7/19/2016 Placer County Transportation Planning Agency In-person meetings
8/1/2016 Transportation Agency for Monterey County In-person meetings
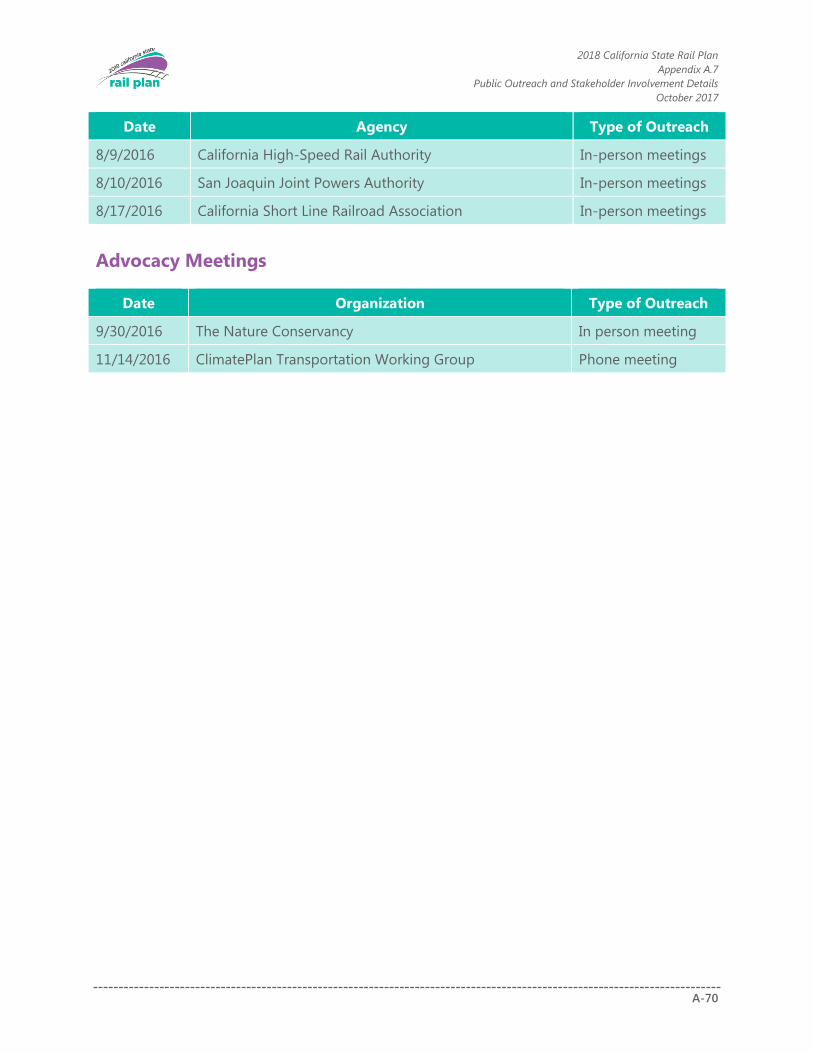
2018 California State Rail Plan
Appendix A.7
Public Outreach and Stakeholder Involvement Details
October 2017
A-70
Date Agency Type of Outreach
8/9/2016 California High-Speed Rail Authority In-person meetings
8/10/2016 San Joaquin Joint Powers Authority In-person meetings
8/17/2016 California Short Line Railroad Association In-person meetings
Advocacy Meetings
Date Organization Type of Outreach
9/30/2016 The Nature Conservancy In person meeting
11/14/2016 ClimatePlan Transportation Working Group Phone meeting

2018 California State Rail Plan
Appendix A.7
Public Outreach and Stakeholder Involvement Details
October 2017
A-71
Native American Tribes that Received Consultation
Date invitation letter sent December 28, 2016
Timeline of consultation January 2017- May 2017
Date of
request/response
Request
format Requesting tribe District
Jan 1 2017 Email/letter/call Name #
1/4/2017 Email Big Sandy Rancheria 6
1/12/2017 Email Federated Indians of Graton Rancheria 4
1/10/2017 Email Modoc Tribe of Oklahoma 2
1/17/2017 Email Agua Caliente Band of Cahuilla 8
1/23/2017 Letter Table Mountain Rancheria 6
3/2/2017 Letter United Auburn Indian Community of the Auburn Rancheria 3
Public Survey Results
As part of the effort to develop the 2018 California State Rail Plan (Rail Plan), Caltrans released
an early engagement survey in January 2016 seeking public input for inclusion. This summary
report provides an overview of the survey results. The survey was available through the Caltrans
website and distributed to an extensive rail plan mailing list; through organizations represented
on the Rail Plan stakeholder advisory committee, and through press releases and Amtrak and
Caltrans social media sites. The survey received a total of 2,189 responses between January 27
and March 4, 2016.
The goal of this survey was to obtain input from a large range of current and potential rail riders
in California to help guide the Rail Plan which will present a vision for California’s future
passenger and freight rail network, and address strategies to achieve a modernized and
integrated rail system. The Rail Plan fulfills state and federal rail plan requirements, and is an
important element in the comprehensive examination of transportation investment strategies
for the next 50 years.
Survey questions inquired about respondents’ current usage of California rail, their opinions on
the current state of California rail, and their highest priorities for improving California rail in the
future. Additional optional demographic questions helped garner general information on
respondents’ affiliations, age, gender, income, race, and contact information to enter them into
a raffle for a $50 Amtrak gift card. Five winners from across the State were randomly selected
and contacted.

2018 California State Rail Plan
Appendix A.7
Public Outreach and Stakeholder Involvement Details
October 2017
A-72
Survey Results
The top reasons WHY current rail riders use rail: The top reason (more than 75%) were
convenience and enjoyment of riding the train. Following that, respondents selected
saving money, time, and safety as their top reasons for using the train.
The TOP FIVE IMPROVEMENTS Caltrans should make to passenger train services were
focused on a) serving more places / expand coverage; b) adding more trains per day; c)
improving connections with local transit, bicycle, and pedestrian access; d) improving on-
time performance and reliability; and e). making transfers between different trains easier
and faster.
The MOST IMPORTANT FREIGHT RAIL IMPROVEMENTS were listed as: a) separating
freight from passenger lines and b) encouraging more use of freight rail for shipping to
relieve roadway congestions.
For SAFETY IMPROVEMENTS, an overwhelming majority of respondents believed the
highest priority should be improving crossings with grade separations.
WHY NOT the Train? The main factors selected as preventing respondents from choosing
the train as a regular means of travel were a) trains not operating frequently enough; and
b) trains not going where respondents want to go. (Less than 6% of respondents chose
trains being too crowded or inadequate bicycle facilities as their reasons for not using
the train regularly.)
Top choices selected for how the rail network should SUPPORT ECONOMIC GROWTH
were: a) providing more mobility choices for people to encourage economic activity, b)
fostering transit oriented development, and c) reducing highway congestion.
Detailed Responses
The following provide a detailed breakdown of the responses received and a sample of
additional write-in responses, where applicable.
What do you use or would like to use rail travel for? (Please select all that apply.)
Answer Options Response Percent
Exploring the state/ tourism 70.5%
Visiting family or friends 67.2%
Long distance travel 66.8%
Short distance travel 66.1%
Special events (e.g. attend a sporting event) 61.8%
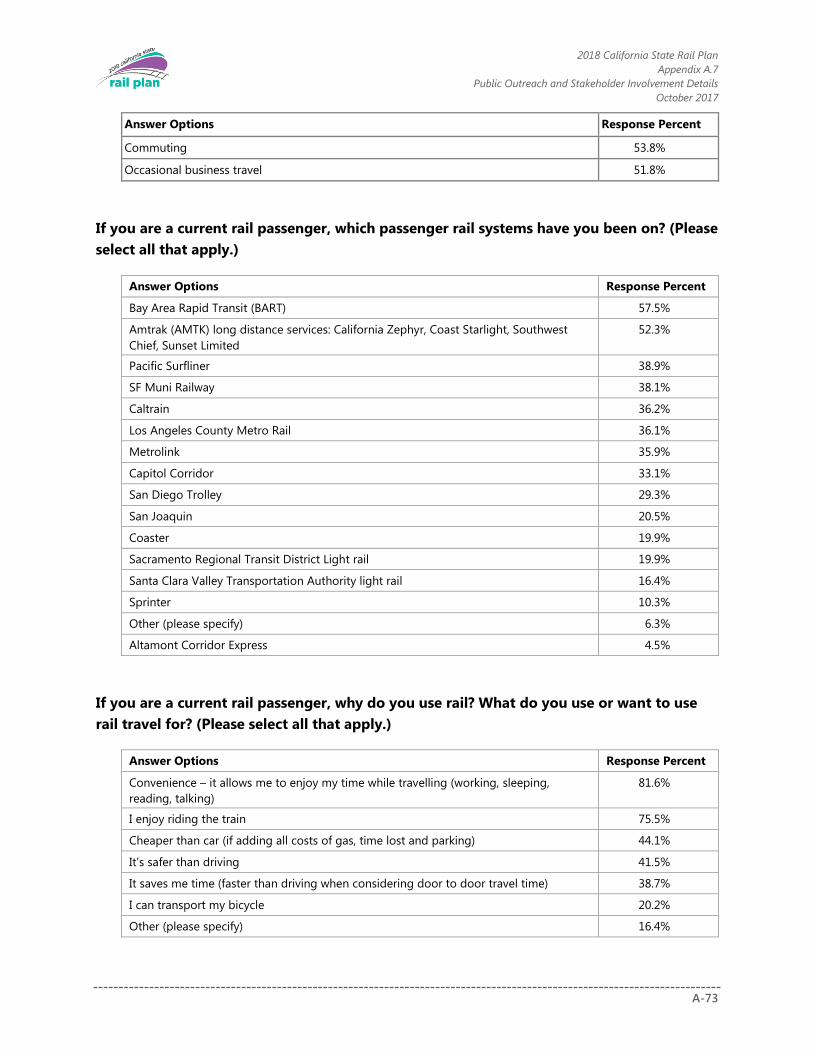
2018 California State Rail Plan
Appendix A.7
Public Outreach and Stakeholder Involvement Details
October 2017
A-73
Answer Options Response Percent
Commuting 53.8%
Occasional business travel 51.8%
If you are a current rail passenger, which passenger rail systems have you been on? (Please
select all that apply.)
Answer Options Response Percent
Bay Area Rapid Transit (BART) 57.5%
Amtrak (AMTK) long distance services: California Zephyr, Coast Starlight, Southwest
Chief, Sunset Limited
52.3%
Pacific Surfliner 38.9%
SF Muni Railway 38.1%
Caltrain 36.2%
Los Angeles County Metro Rail 36.1%
Metrolink 35.9%
Capitol Corridor 33.1%
San Diego Trolley 29.3%
San Joaquin 20.5%
Coaster 19.9%
Sacramento Regional Transit District Light rail 19.9%
Santa Clara Valley Transportation Authority light rail 16.4%
Sprinter 10.3%
Other (please specify) 6.3%
Altamont Corridor Express 4.5%
If you are a current rail passenger, why do you use rail? What do you use or want to use
rail travel for? (Please select all that apply.)
Answer Options Response Percent
Convenience – it allows me to enjoy my time while travelling (working, sleeping,
reading, talking)
81.6%
I enjoy riding the train 75.5%
Cheaper than car (if adding all costs of gas, time lost and parking) 44.1%
It’s safer than driving 41.5%
It saves me time (faster than driving when considering door to door travel time) 38.7%
I can transport my bicycle 20.2%
Other (please specify) 16.4%

2018 California State Rail Plan
Appendix A.7
Public Outreach and Stakeholder Involvement Details
October 2017
A-74
Answer Options Response Percent
I don’t have a car/other personal transportation 9.5%
I don’t have a driver’s license 3.9%
Additional write-in responses:
Lower stress than driving
Climate Crisis requires us to emit less GHG
Unlike bus or airplane modes, passenger rail allows me to change cars during the trip.
This increases comfort: stretch legs, get away from noisy passengers, find car with cooler
or warmer climate.
Better for the environment
Please rate your current rail transportation options in California based on your level of
agreement with this statement: “Rail gets me where I want to go in a timely manner with
minimal inconvenience”?
Answer Options Response Percent
Agree 27.0%
Disagree 24.8%
Neutral 24.4%
Strongly disagree 13.9%
Strongly Agree 6.4%
No opinion 3.6%
What are the most important improvements that that you think Caltrans should make to
passenger train services in California (high-speed, intercity and commuter)? Please select
your top 5.
Answer Options Response Percent
Serve more places (expanding coverage) 70.6%
More trains per day 61.1%
Improve connections with local transit services, bicycle and pedestrian access 53.0%
Improving on-time performance and reliability 45.9%
Easier/faster transfers between different trains 33.1%
Reducing ticket costs 30.9%
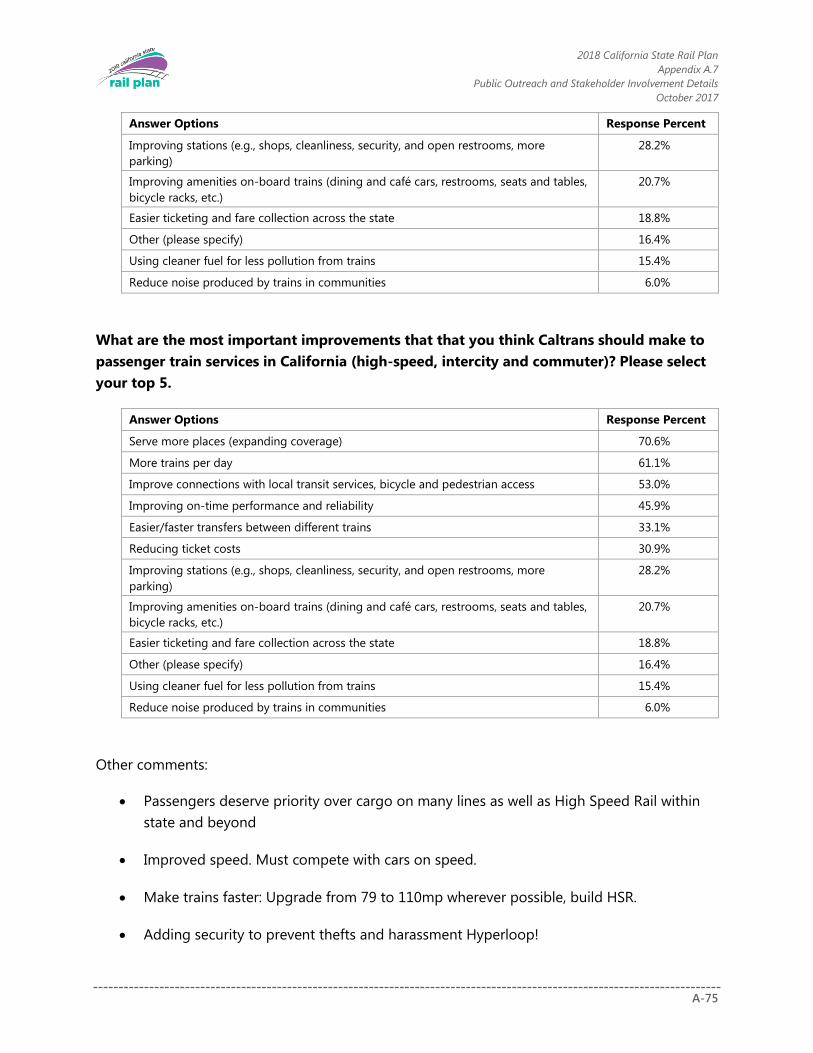
2018 California State Rail Plan
Appendix A.7
Public Outreach and Stakeholder Involvement Details
October 2017
A-75
Answer Options Response Percent
Improving stations (e.g., shops, cleanliness, security, and open restrooms, more
parking)
28.2%
Improving amenities on-board trains (dining and café cars, restrooms, seats and tables,
bicycle racks, etc.)
20.7%
Easier ticketing and fare collection across the state 18.8%
Other (please specify) 16.4%
Using cleaner fuel for less pollution from trains 15.4%
Reduce noise produced by trains in communities 6.0%
What are the most important improvements that that you think Caltrans should make to
passenger train services in California (high-speed, intercity and commuter)? Please select
your top 5.
Answer Options Response Percent
Serve more places (expanding coverage) 70.6%
More trains per day 61.1%
Improve connections with local transit services, bicycle and pedestrian access 53.0%
Improving on-time performance and reliability 45.9%
Easier/faster transfers between different trains 33.1%
Reducing ticket costs 30.9%
Improving stations (e.g., shops, cleanliness, security, and open restrooms, more
parking)
28.2%
Improving amenities on-board trains (dining and café cars, restrooms, seats and tables,
bicycle racks, etc.)
20.7%
Easier ticketing and fare collection across the state 18.8%
Other (please specify) 16.4%
Using cleaner fuel for less pollution from trains 15.4%
Reduce noise produced by trains in communities 6.0%
Other comments:
Passengers deserve priority over cargo on many lines as well as High Speed Rail within
state and beyond
Improved speed. Must compete with cars on speed.
Make trains faster: Upgrade from 79 to 110mp wherever possible, build HSR.
Adding security to prevent thefts and harassment Hyperloop!

2018 California State Rail Plan
Appendix A.7
Public Outreach and Stakeholder Involvement Details
October 2017
A-76
Longer hours of service (late-night)
What prevents you from choosing the train as a regular means of travel? Please choose all
that apply.
Answer Options Response Percent
Train schedules are not convenient/ don’t operate often enough 51.2%
Trains don’t go where I want to go 45.2%
There are no good connections from the train station to my destination 32.0%
No train station near where I live (more than 15- 20 minutes away) 31.8%
No easy public transportation connection to the train station from where I live 31.5%
Taking the train takes too long 31.1%
I would have to change trains/ buses 20.9%
It’s too expensive 18.3%
Comment (please specify) 18.1%
It’s not reliable 13.3%
Parking at train station is full when I need it 11.2%
Inadequate bicycle facilities 5.5%
It’s too crowded 5.5%
Other comments:
There is no parking at station, others are too expensive to park
It's hard to do without my car at the destination
Need direct link to major airports
Harassment of women, profane music, loud music (LA Blue Line)
What do you think Caltrans’ highest priority should be for investments to enhance rail
safety?
Answer Options Response Percent
Improve crossings with grade separations (e.g., build over- or under-crossings, sealed
corridor) to allow trains to be faster while reducing the possibility of collisions with
vehicles, pedestrians, bicyclists, etc.
72.0%
Improve the safety and security of train and transportation terminals (i.e. airports,
shipping ports, etc.)
9.3%
Prepare for emergencies, response, and recovery for all modes of transportation from
human and natural disasters
6.6%
Don’t know 6.3%

2018 California State Rail Plan
Appendix A.7
Public Outreach and Stakeholder Involvement Details
October 2017
A-77
Answer Options Response Percent
Other (please specify) 5.9%
California’s freight rail system is privately operated and provides many of the tracks
utilized by public passenger trains. What do you think California’s highest priority should
be to improve its freight rail system?
Answer Options Response Percent
Separate freight from passenger lines 36.4%
Encourage more use of freight rail for shipping to relieve congestion from trucks on
roadways
22.0%
Grade separate rail freight lines within city limits to reduce traffic impacts through town 13.3%
Provide more freight rail lines to move trucks off of the highways 10.1%
Don’t know 7.3%
Other (please specify) 4.9%
Reduce environmental pollution from trains 3.0%
Encourage local economies to reduce the need for transporting goods far distances 3.0%
How should the rail network support economic growth? Please select your top three.
Answer Options Response Percent
Provide more mobility choices and better access for people to get to where they want
to go to encourage economic activity (work, businesses, parks, shopping, sporting
events)
74.3%
Foster transit oriented development near train stations (mixture of housing, office, retail
and/or other amenities in a walkable neighborhood and located within a half-mile of
public transportation)
55.3%
Reduce highway congestion 47.7%
Make train stations into destinations with shopping, housing and business districts 39.7%
Improve the efficiency of the freight system, get more freight to move by train rather
than truck
34.8%
Contribute towards state and federal Air Quality Requirements 17.5%
Other (please specify) 6.1%
Don’t know 1.6%

2018 California State Rail Plan
Appendix A.7
Public Outreach and Stakeholder Involvement Details
October 2017
A-78
Respondent Demographics
INTEREST / ASSOCIATION RESPONSE % AGE RESPONSE %
Current rail passenger 64.0% Under 19 1.0%
Interested member of the California public 57.0% 20-24 4.9%
Previous rail passenger 33.7% 25-34 20.6%
Local or state government employee 21.9% 35-44 17.9%
Potential rail passenger (never taken a train) 8.3% 45-54 18.9%
Advocacy group/NGO 5.3% 55-59 12.7%
Local, metropolitan or regional planning agency 4.1% 60-64 10.2%
Community leader/or elected official 3.0% 65-74 9.3%
Passenger rail operating agency 2.3% 75 to 84 2.5%
Freight rail provider 1.5% 85 years and older 0.3%
Transportation Industry representative 1.2% GENDER RESPONSE %
Tribal Representative 0.5% Female 26.1%
TIME SPENT COMMUTING PER WORKDAY RESPONSE % Male 72.8%
Less than 30 minutes 30.1% RACE OR ETHNICITY RESPONSE %
30 minutes – 1 hour 27.3% White or Caucasian 71.2%
1-2 hours 19.5% Asian-American/Pacific Islander 8.6%
2-3 hours 6.4% Spanish, Hispanic, or Latino 7.1%
More than 3 hours 3.4% Multiple ethnicities 4.4%
Do not commute to work 13.2% Black or African-American 2.8%
HOUSEHOLD INCOME RESPONSE % Native American /Alaska Native 1.8%
$0 to $9,999 1.7% LANGUAGE SPOKEN AT HOME RESPONSE %
$10,000 to $24,999 3.7% English 97.8%
$25,000 to $49,999 9.8% Spanish 3.0%
$50,000 to $74,999 14.0% Chinese (Cantonese or Mandarin) 2.1%
$75,000 to $99,999 14.6% Tagalog 0.9%
$100,000 to $124,999 16.5% Other 2.3%
$125,000 to $149,999 7.1%
$150,000 to $174,999 7.5%
$175,000 to $199,999 3.8%
$200,000 and up 9.3%
Conclusion
The more than 2,000 responses to the 2018 California State Rail Plan Survey helped shape the
vision for the Draft Rail Plan. This vision will guide California’s future passenger and freight rail
network. According to responses to the survey, top priorities and themes include:
To expand coverage and increase service for passenger rail. These were the top two
priorities for improving passenger rail and the top two factors preventing people from
using rail regularly. Additional priorities include: Improve transfers, connections with local
transit, reliability and on-time-performance
2018 California State Rail Plan
Appendix A.7
Public Outreach and Stakeholder Involvement Details
October 2017
A-79
The majority of respondents choose rail because they enjoy riding the train, and the train
is often cheaper than using a car
They use or would like to use rail for a variety of different reasons, from leisure travel to
commuting
Highest priority for safety improvements are to improve crossings with grade separations