teachingpfl_elementary_session1_jan2016
TRANSCRIPT

Personal Financial Literacy
Session 1: Income and Taxes
Teaching
In the Elementary Grades
Katie Sauer, Ph.D.University of Colorado
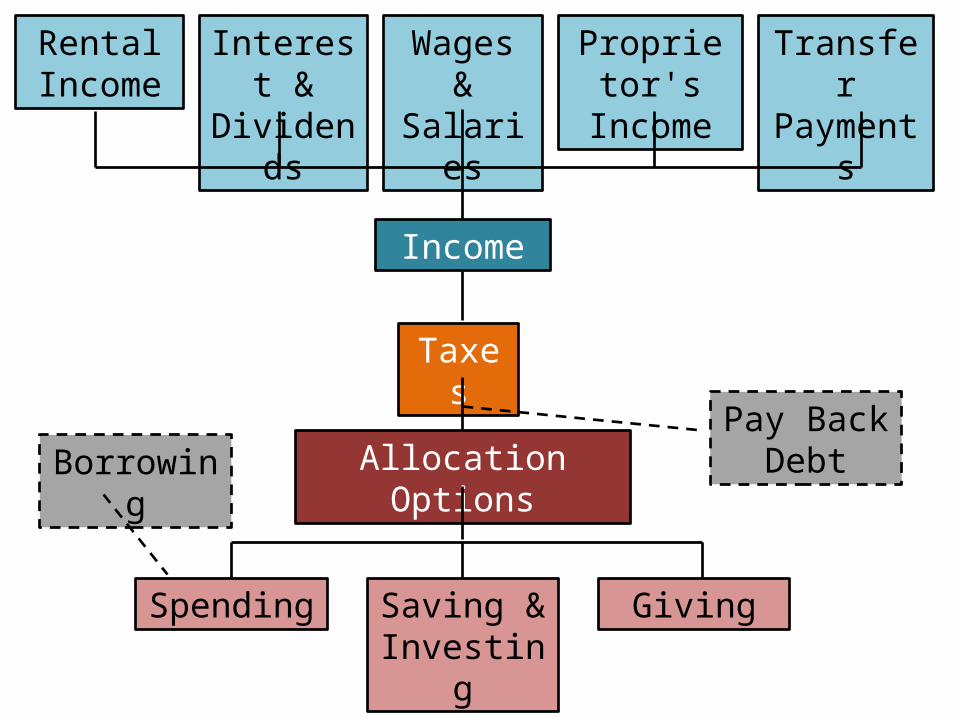
Income
Wages & Salaries
Interest & Dividends
Rental Income
Proprietor's Income
Transfer Payments
Taxes
Allocation Options
Spending Saving & Investing
Giving
Pay Back DebtBorrowing
3
Session Overview
I. Intro to Income
II. Three Main Determinants of Income- human capital- state of the economy- structure of the labor market
III. Payroll and Income Taxes
4
I. Intro to IncomeHow much income does the average US household earn in a year?
If you are looking for statistics on the average
income, you probably won’t find much.
You need to look for median or mean income.
5
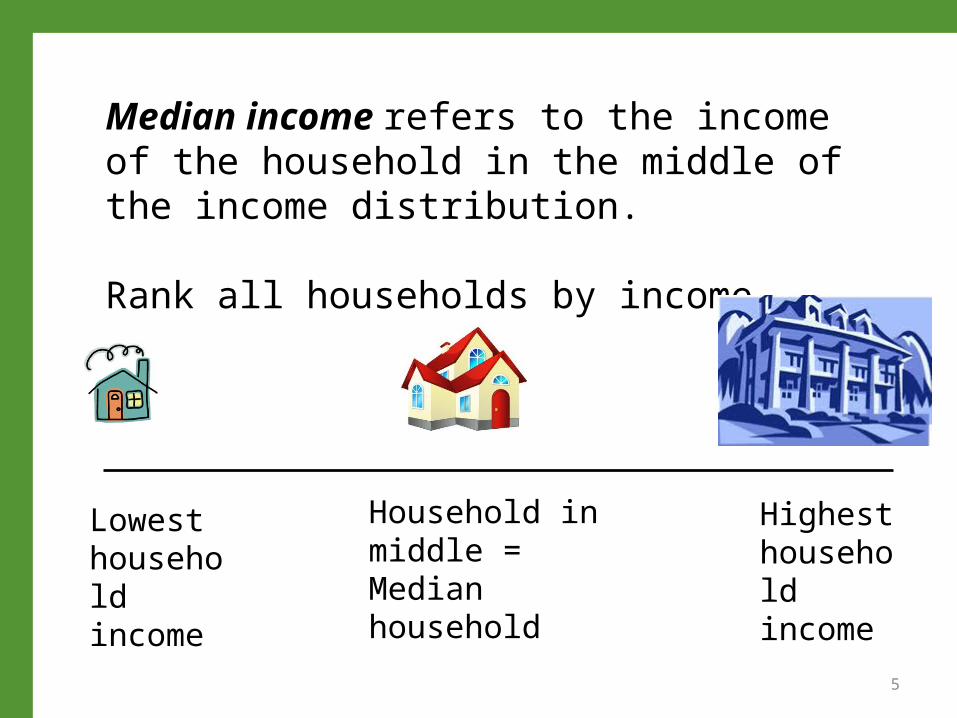
Median income refers to the income of the household in the middle of the income distribution.
Rank all households by income.
Lowest household income
Highest household income
Household in middle = Median household
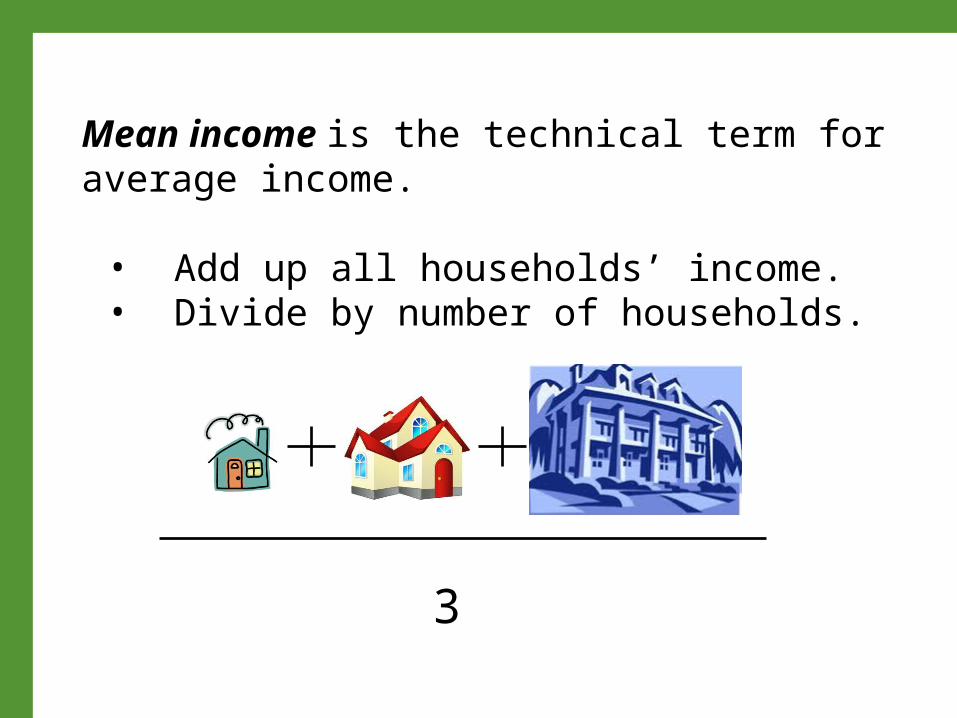
Mean income is the technical term for average income.
• Add up all households’ income.• Divide by number of households.
3
For income statistics, the median is the more widely-reported figure.
This is because the mean can easily be skewed by a few very high income households.
We can find statistics on US median income at the Census Bureau website.
www.census.gov
Data is available with a lag. For example, the median household income was $53,046 in 2013.

In 2010, personal income in the U.S. totaled:
$12.4 trillion.
Data Source: Bureau of Labor Statistics (www.BLS.gov)
Per capita personal income was about $40,000.
Per capita income = Total income / Population
Per capita income = $12.4 trillion / 310 million
Personal Income Statistics
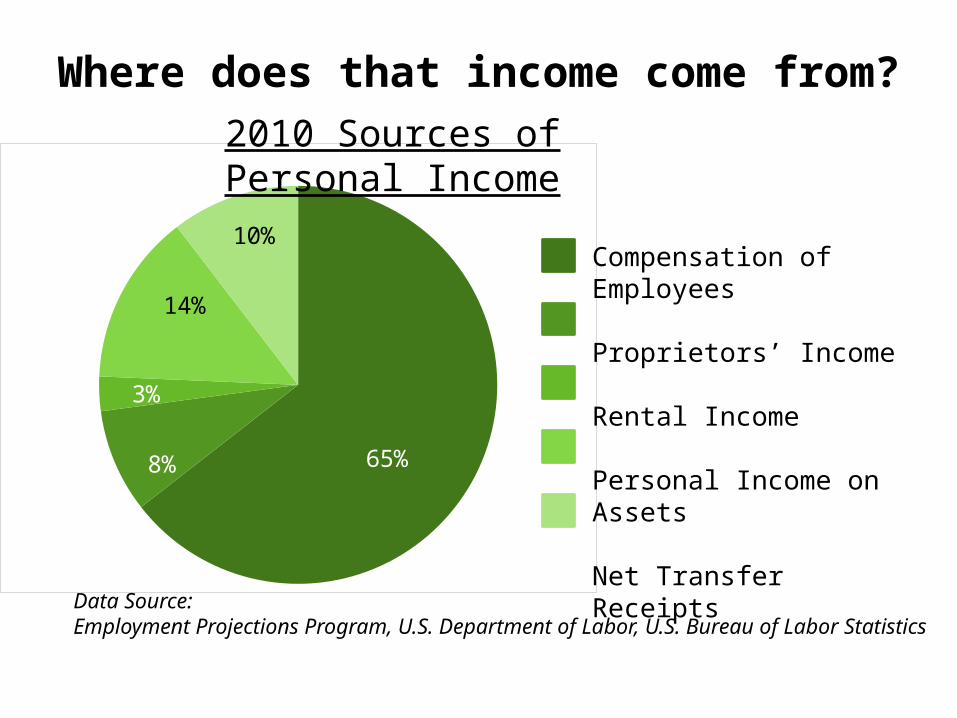
Where does that income come from?
65%8%
3%
14%
10%
2010 Sources of Personal Income
Compensation of Employees
Proprietors’ Income
Rental Income
Personal Income on Assets
Net Transfer Receipts
Data Source: Employment Projections Program, U.S. Department of Labor, U.S. Bureau of Labor Statistics
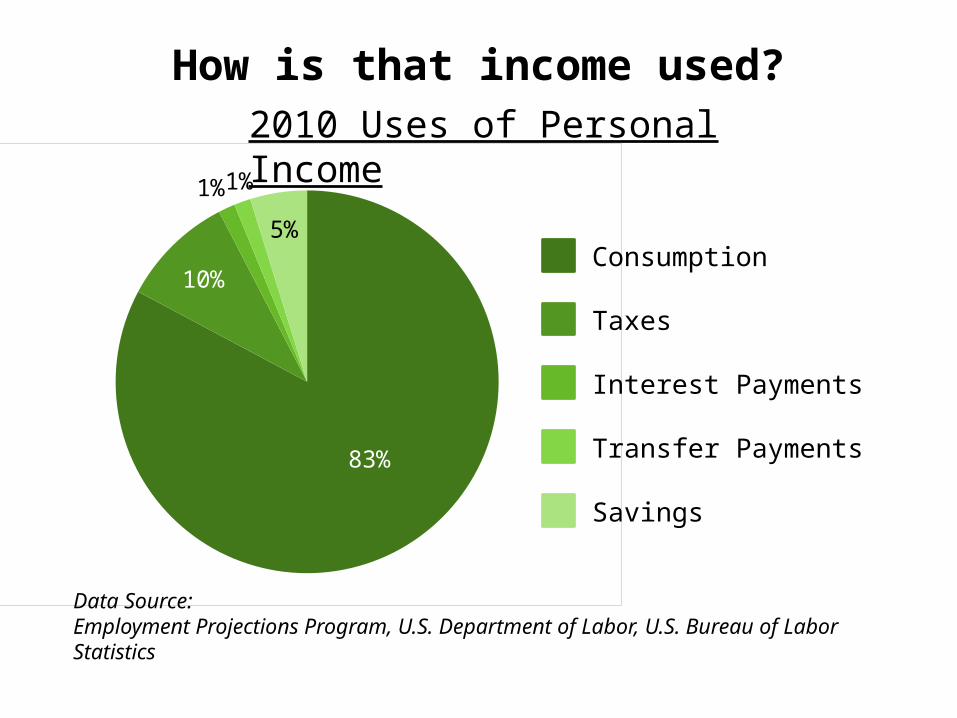
How is that income used?
83%
10%
1%1%
5%
2010 Uses of Personal Income
Data Source: Employment Projections Program, U.S. Department of Labor, U.S. Bureau of Labor Statistics
Consumption
Taxes
Interest Payments
Transfer Payments
Savings
12
A. Human Capital encompasses a person’s knowledge, ability, and skills.
Most human capital is built through education and training.
II. What determines income from working?A. Human CapitalB. State of the EconomyC. Structure of the Specific Labor Market
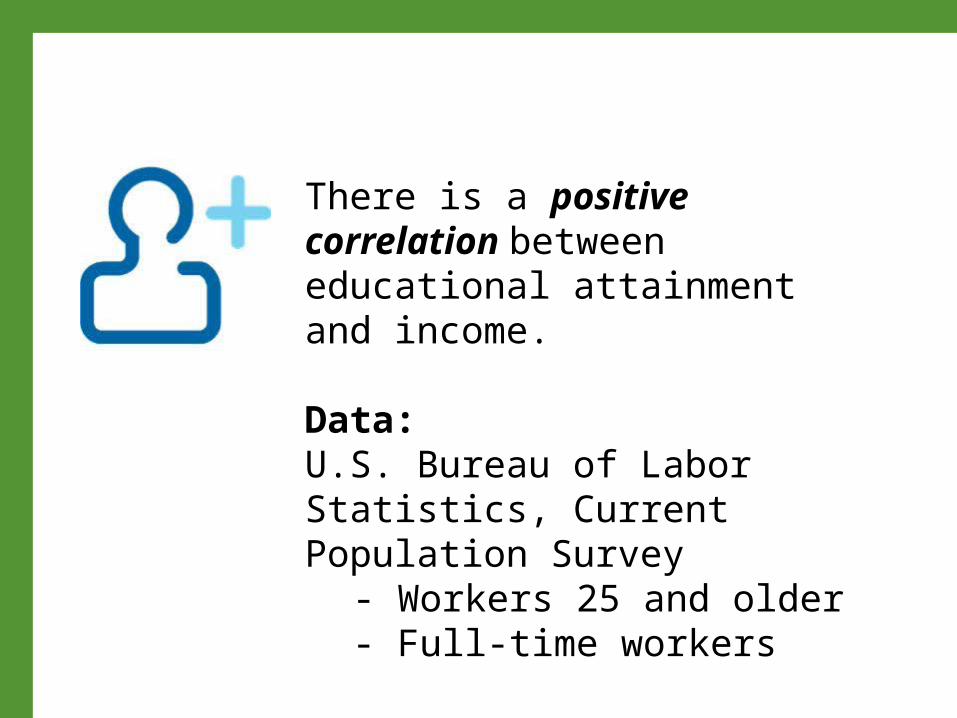
There is a positive correlation between educational attainment and income.
Data: U.S. Bureau of Labor Statistics, Current Population Survey
- Workers 25 and older- Full-time workers
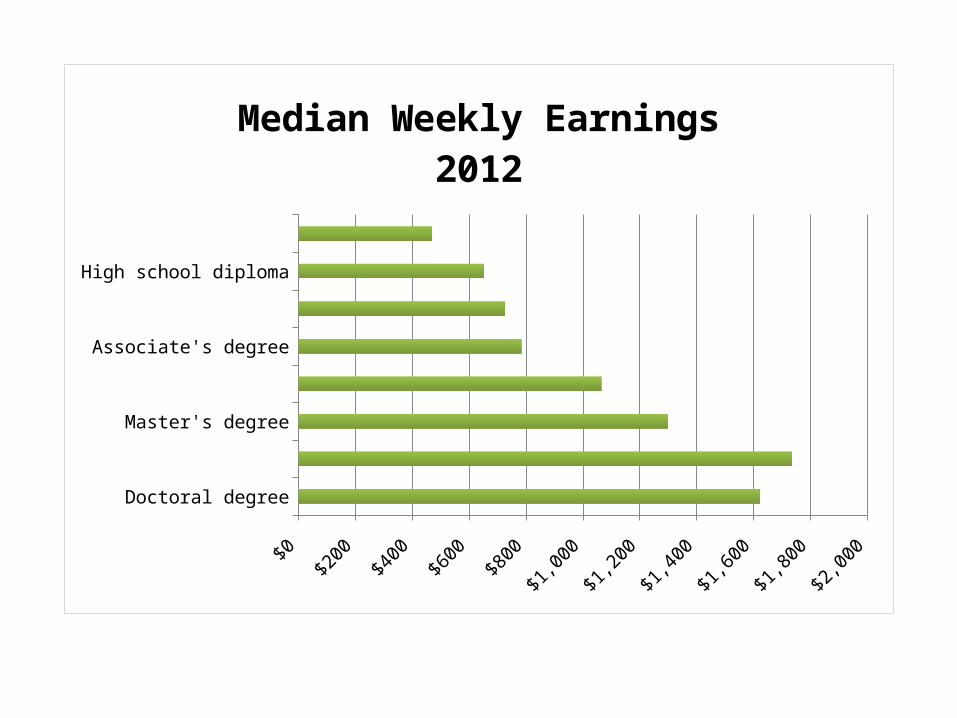
Doctoral degree
Professional degree
Master's degree
Bachelor's degree
Associate's degree
Some college, no degree
High school diploma
Less than a high school diploma
Median Weekly Earnings2012
15
Investing in human capital has an opportunity cost:When students are in class they aren’t being productive in the economy.
Increasing human capital can have benefits:- higher paycheck- better society- productive workers
16
Individuals, firms and governments are willing to pay the cost of investing in building human capital because they expect to see benefits in the future.
Governments fund public education because a better educated population contributes to faster and sustainabledevelopment.
Firms invest in employee training because they expect tocover the costs through higher profits from higher workerproductivity.
Individuals spend time and money on higher education because they expect to earn higher wages.
17
A degree or certification can signal that someone has likely built their human capital.
18
There may *not* be a return on education if
- it is of low quality
- the knowledge/skills learned don’t match market demand
- there is slow economic growth (low demand for new workers)
- workers are paid the same regardless of skill (centrally planned economies, bureaucratic systems)
19
B. The State of the Economy
When the economy is doing well, firms are hiring, people find it relatively easy to find jobs.
The type of jobs needed in the economy change over time as the structure of the economy changes.
If you are skilled in a sector that becomes obsolete, you will need to acquire new skills to work in a different sector or you will be unemployed for a long time.
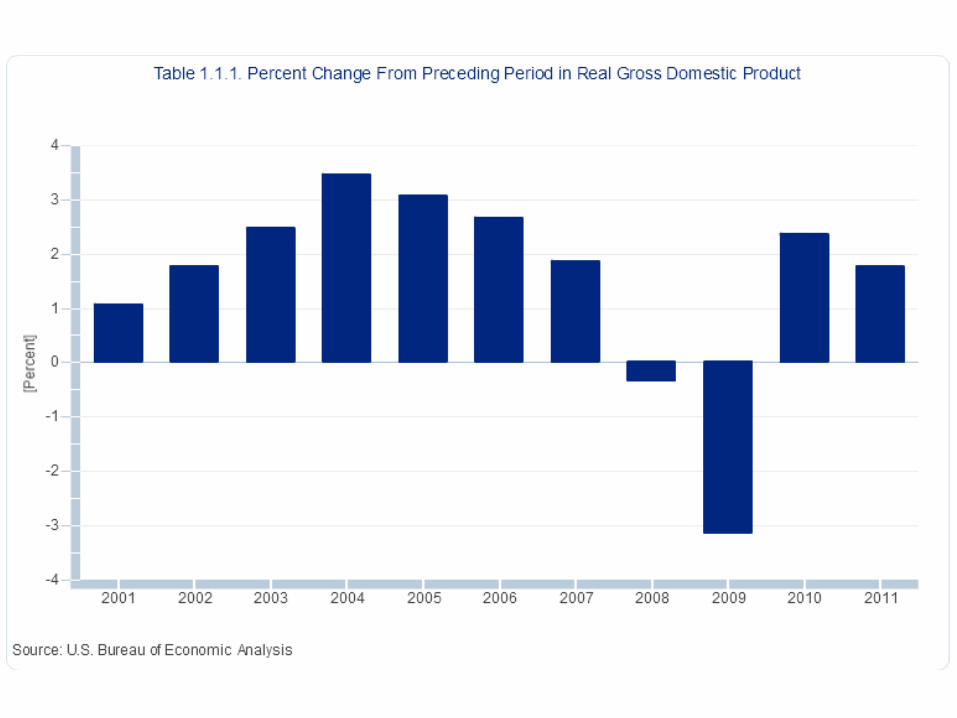
The business cycle is visualized by plotting the economy’s growth rate over time.
The growth rate is measured by calculating the percent change in Real Gross Domestic Product (real GDP).

peak
trough
trough
expansion slow down
contraction recovery
peak
If expansions happen too quickly, inflation (rising prices) can be a problem. Unemployment falls during expansions.
As the economy slows down, typically so does inflation.
In contractions, inflation isn’t usually a problem, but rising unemployment is.
24
The state of the economy affects more than just your income from working.
It affects:• your income from assets like stocks and bonds• the interest rates you pay on loans and your
credit cards• the cost of living in general.
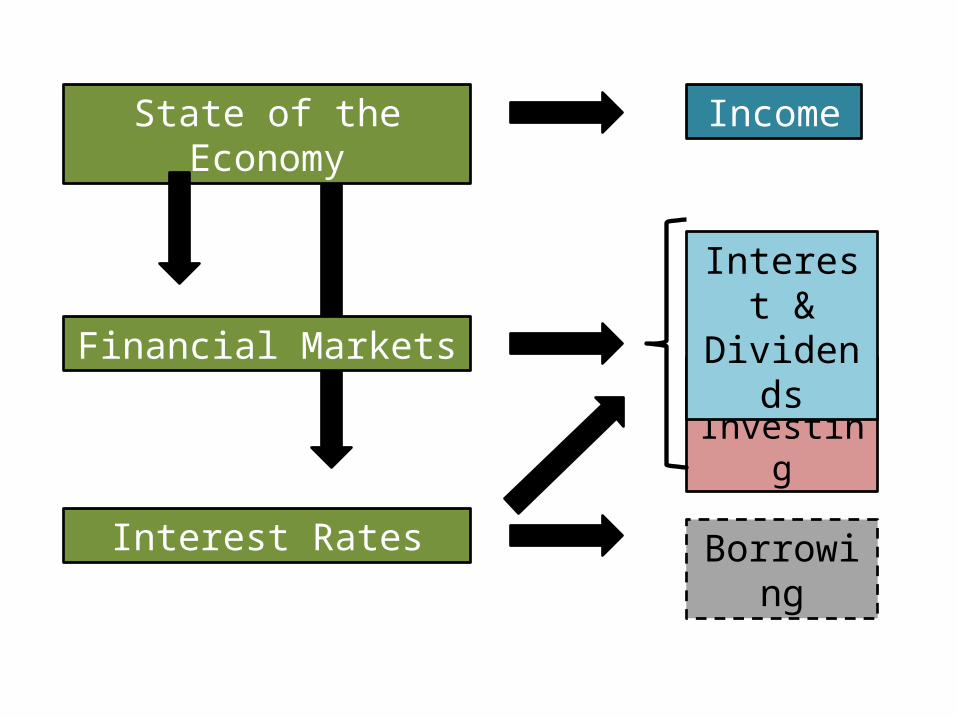
State of the Economy Income
Financial MarketsSaving & Investing
Interest Rates
Interest & Dividends
Borrowing
26
A higher level of human capital can help an individual to fare better in bad economic times.
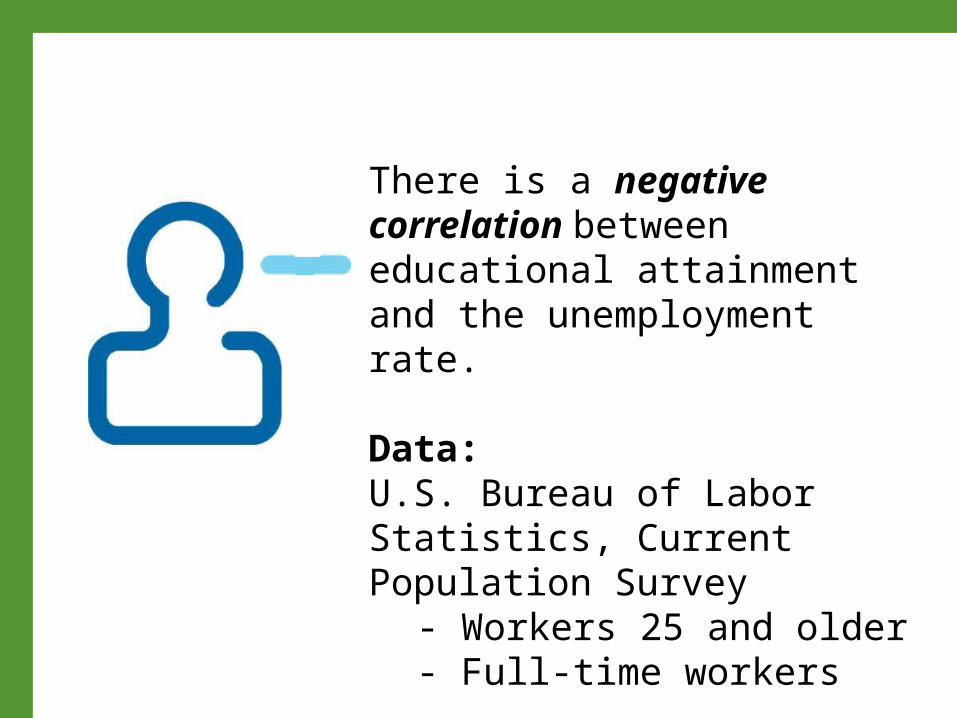
There is a negative correlation between educational attainment and the unemployment rate.
Data: U.S. Bureau of Labor Statistics, Current Population Survey
- Workers 25 and older- Full-time workers
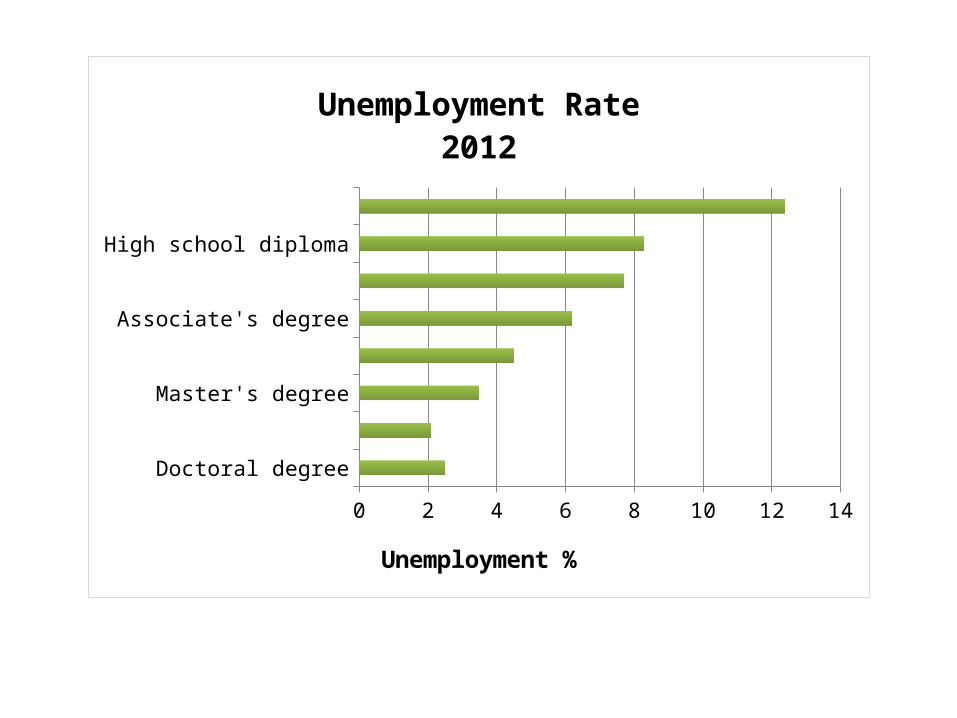
Doctoral degree
Professional degree
Master's degree
Bachelor's degree
Associate's degree
Some college, no degree
High school diploma
Less than a high school diploma
0 2 4 6 8 10 12 14
Unemployment Rate2012
Unemployment %

The market wage is determined by the
supply and demand for labor.
C. Structure of the Specific Labor Market
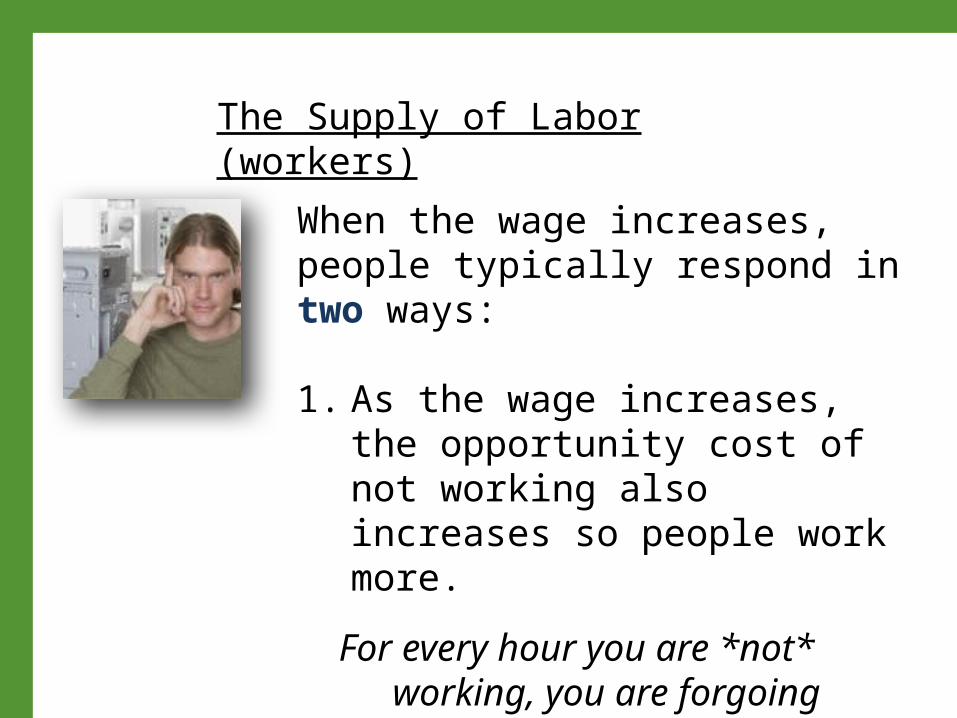
When the wage increases, people typically respond in two ways:
1. As the wage increases, the opportunity cost of not working also increases so people work more.
For every hour you are *not* working, you are forgoing earning money.
The Supply of Labor (workers)
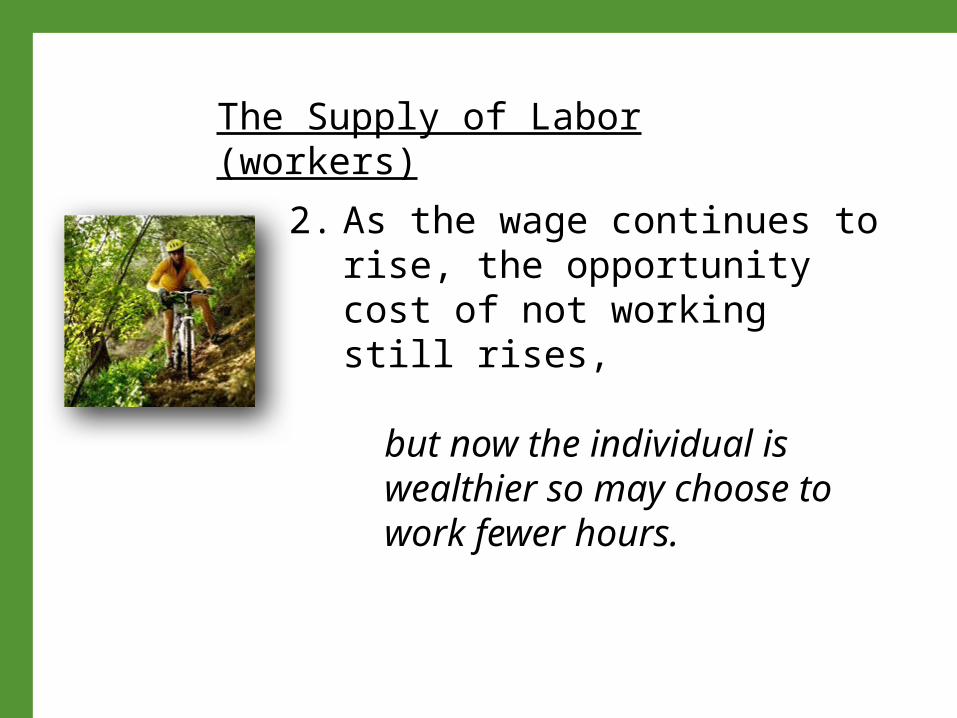
2. As the wage continues to rise, the opportunity cost of not working still rises,
but now the individual is wealthier so may choose to work fewer hours.
The Supply of Labor (workers)

We can illustrate these two effects with a
labor supply curve.
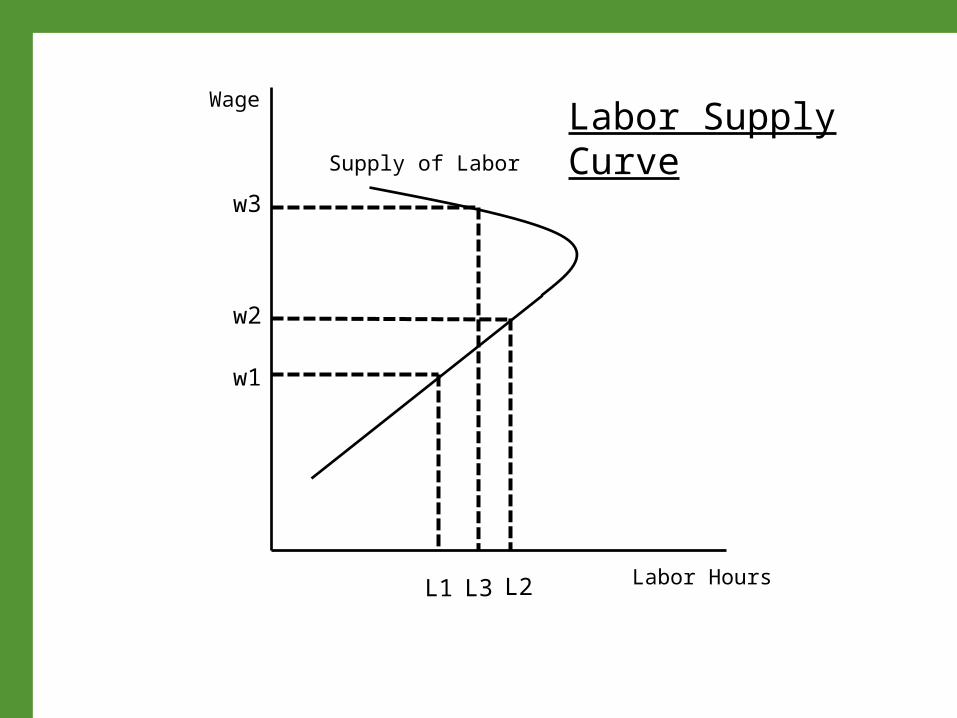
Wage
Labor Hours
Supply of Labor
L1
w1
w2
L2
w3
L3
Labor Supply Curve
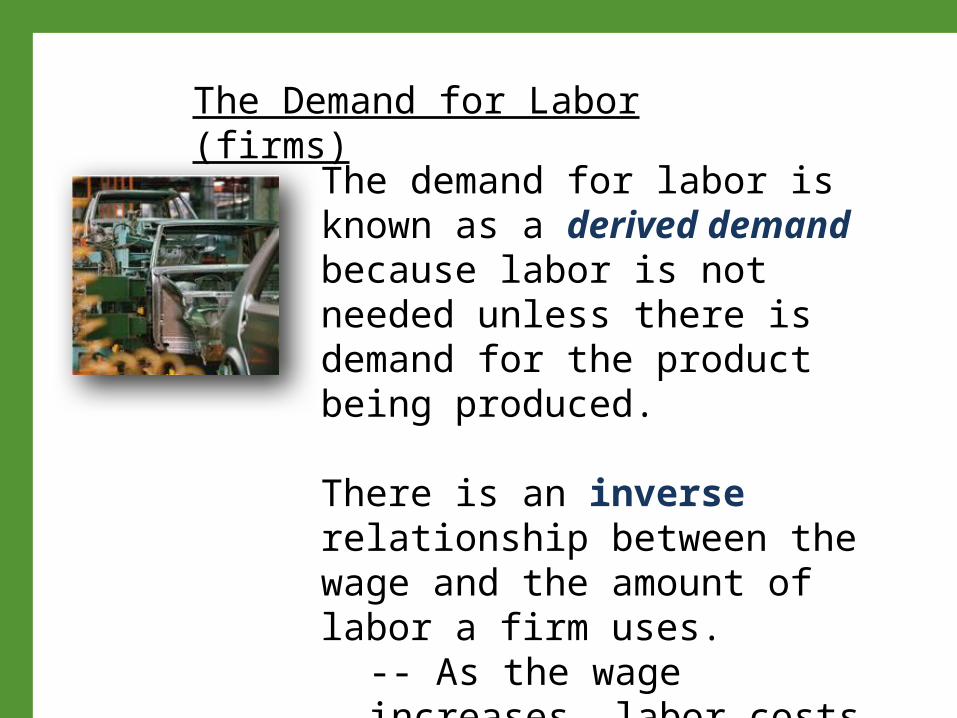
The demand for labor is known as a derived demand because labor is not needed unless there is demand for the product being produced.
There is an inverse relationship between the wage and the amount of labor a firm uses.
-- As the wage increases, labor costs increase, the firm uses less labor.
The Demand for Labor (firms)
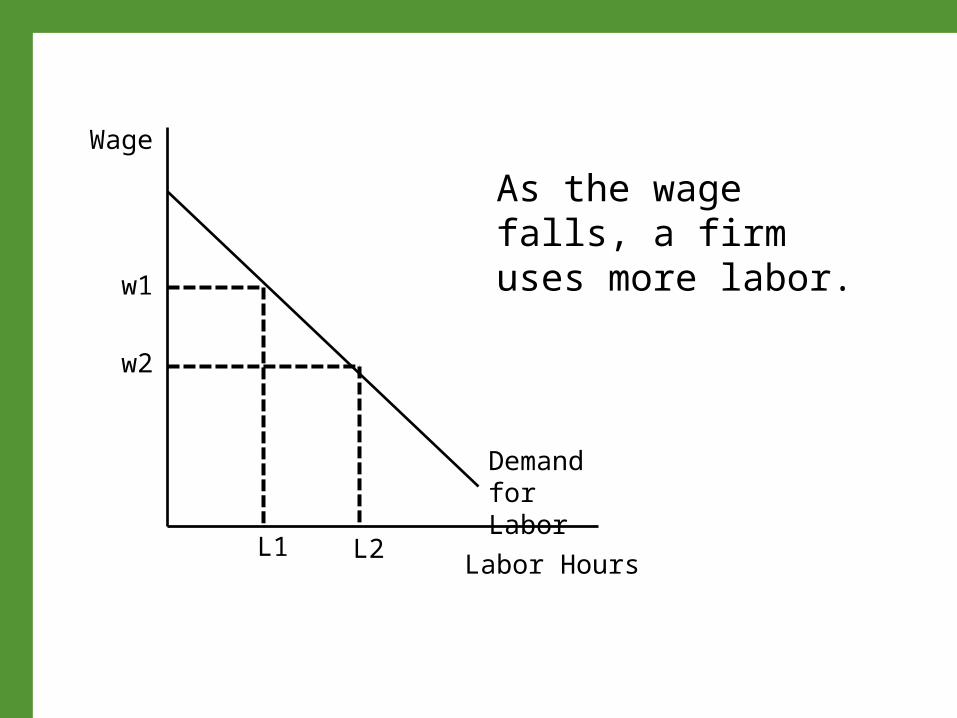
Demand for Labor
Labor Hours
Wage
As the wage falls, a firm uses more labor.
L1
w1
L2
w2

The supply and demand for labor interact to
determine the market wage.
Supply and Demand Together
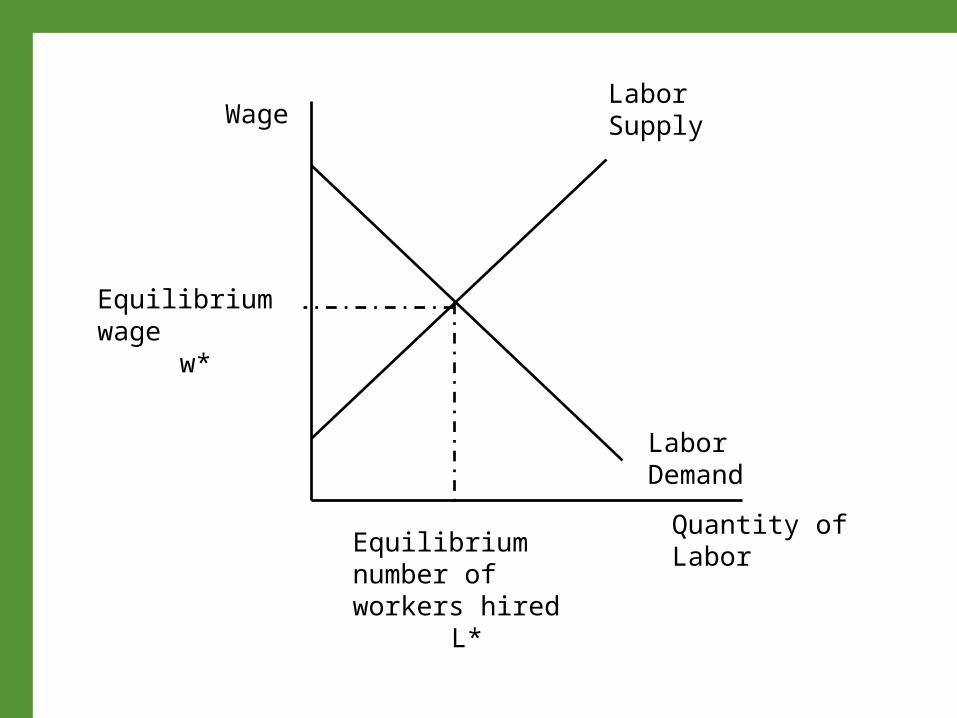
Labor Demand
Quantity of Labor
WageLabor Supply
Equilibrium wagew*
Equilibrium number of workers hired
L*
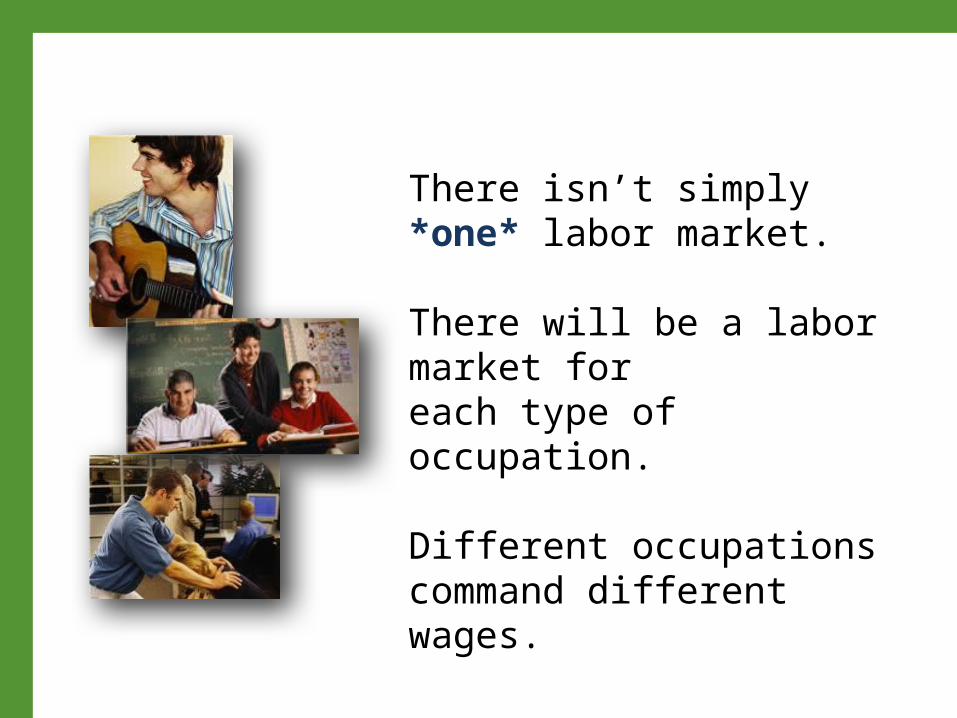
There isn’t simply *one* labor market.
There will be a labor market for each type of occupation.
Different occupations command different wages.
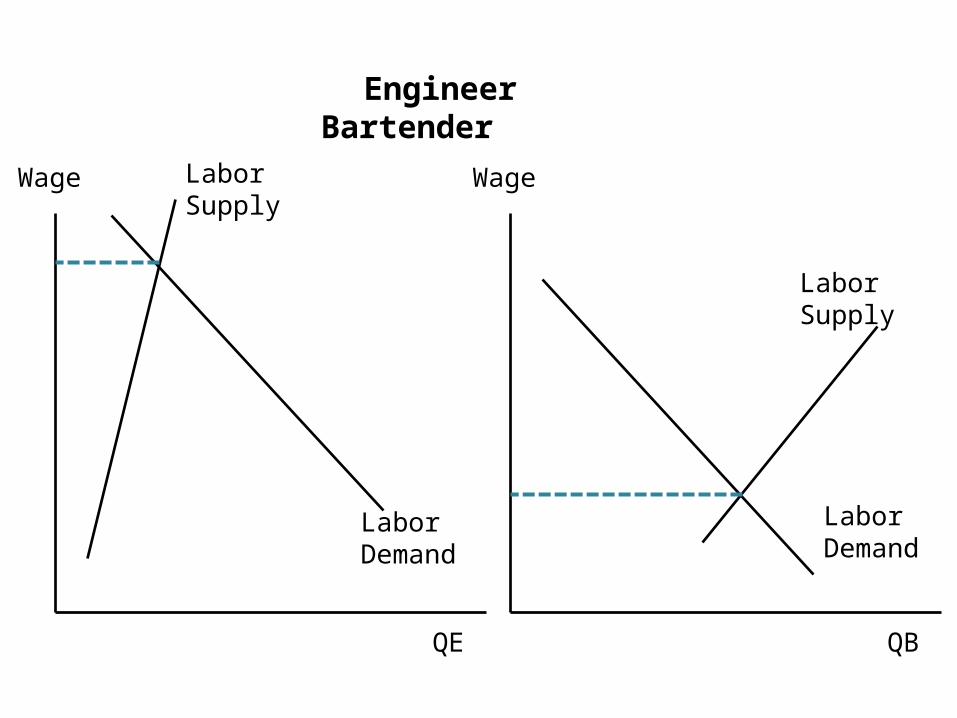
Engineer Bartender
Labor Demand
QE
Wage Labor Supply
Labor Demand
QB
Wage
Labor Supply
40
The interaction of:• Human capital• State of the economy• Structure of the specific labor market
will determine your income from working.
41
Regardless of what industry you are in or what the economy is like, working adults all learned very quickly that the income they earn is not all theirs to keep.
Everyone must pay taxes!
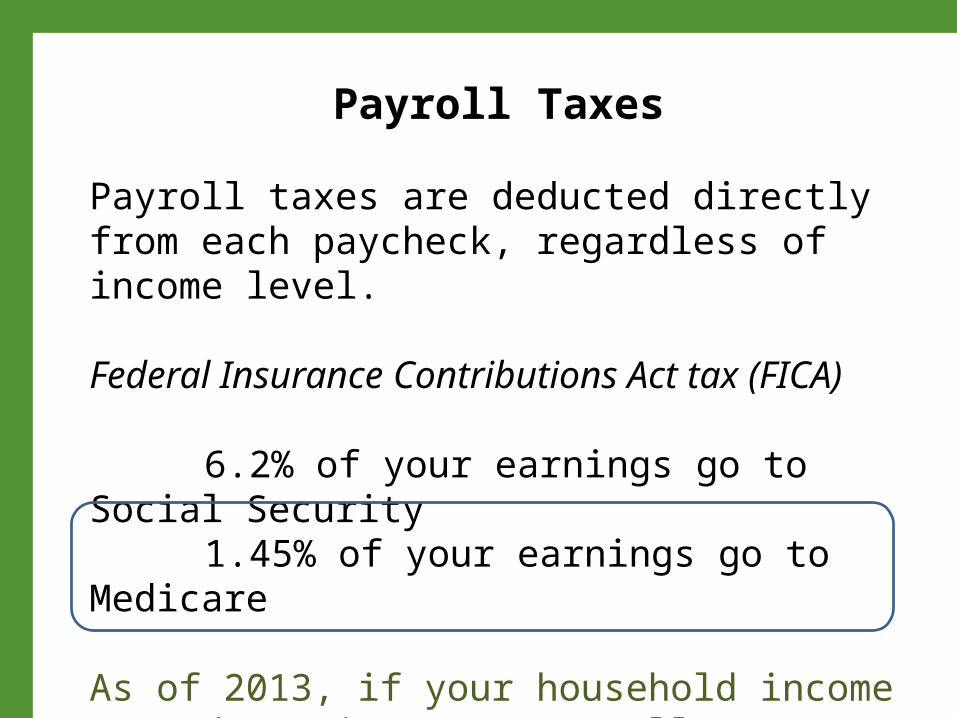
Payroll taxes are deducted directly from each paycheck, regardless of income level.
Federal Insurance Contributions Act tax (FICA)
6.2% of your earnings go to Social Security 1.45% of your earnings go to Medicare
As of 2013, if your household income exceeds $200,000, you’ll pay an additional 0.9% to Medicare.
Payroll Taxes
Did you know?
Your employer also pays the equivalent of 6.2% of your earnings to Social Security
and 1.45% to Medicare.
Did you know?
Social Security taxes are paid on the first $118,500 of your
wage income (2016).
Medicare taxes are paid on all wage income.
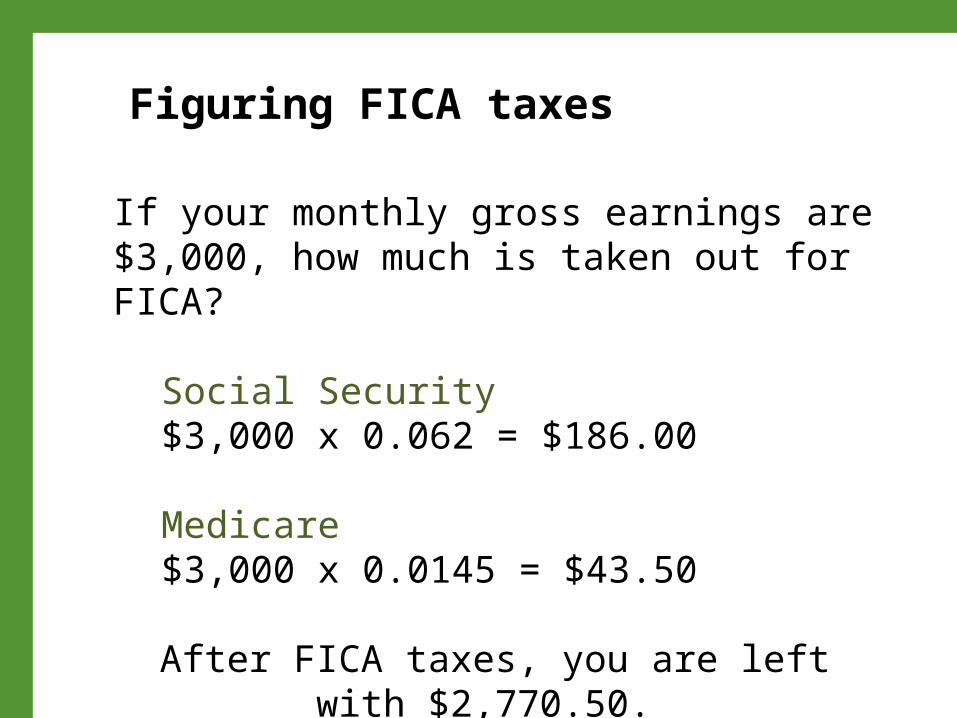
If your monthly gross earnings are $3,000, how much is taken out for FICA?
Social Security$3,000 x 0.062 = $186.00
Medicare$3,000 x 0.0145 = $43.50
After FICA taxes, you are left with $2,770.50.
Figuring FICA taxes
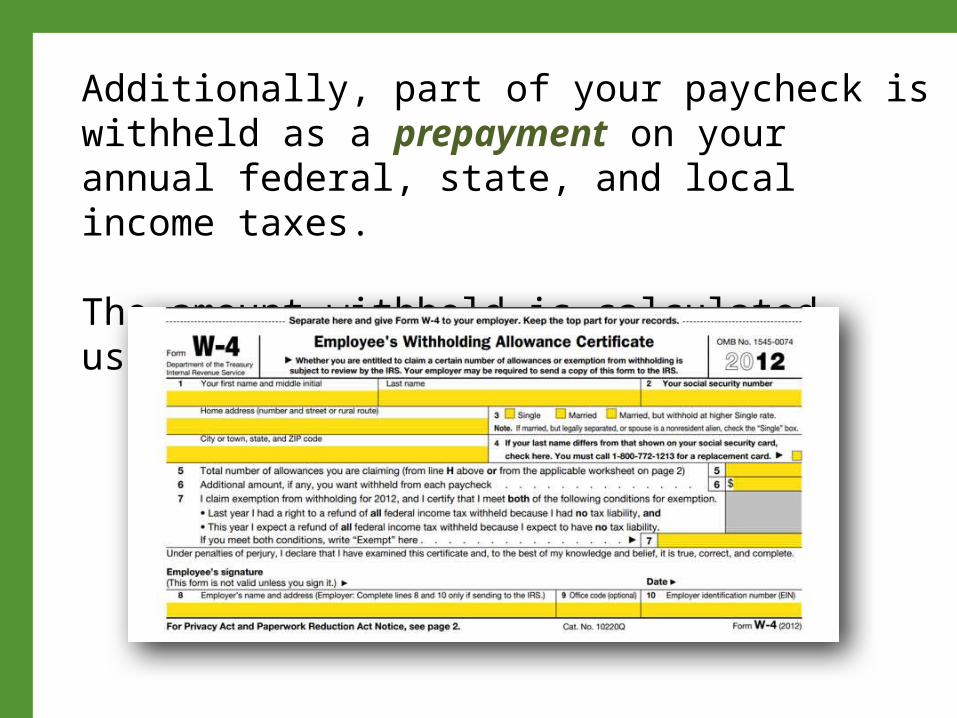
Additionally, part of your paycheck is withheld as a prepayment on your annual federal, state, and local income taxes.
The amount withheld is calculated using your W-4 form.

At the end of the year, if the amount withheld is greater than the amount you owe, you’ll receive a refund.
If the taxes you owe exceed the amount you had withheld, you’ll have to send the government a check.
1. Compute gross income• Wages and salaries• Interest• Rental income
Calculating Your Federal Income Tax
2. Compute adjusted gross incomeSubtract off:
• Retirement savings contributions• Alimony• Educator expenses• Contributions to HSAs• Job-related move expenses• Interest paid on student loans
And if self-employed:• Health insurance premiums• 50% of paid payroll taxes
3. Subtract any exemptions • Fixed amount of money that
is deducted for the taxpayer, spouse, dependents
• Indexed for inflation2015: $4,000 per person2016: $4,050 per person• Phases out for higher
incomes
4. Decide on deduction type
2016 Standard Deduction$12,600 for married couples filing jointly $6,300 for singles $6,300 for married individuals filing separately $9,300 for heads of household

Itemized Deduction
• Medical/dental expenses exceeding 10% of AGI (adjusted gross income)
• Other taxes paid (state, local income tax)• Interest on mortgage• Charitable donations• Casualty and theft losses• Union dues• Job travel expenses
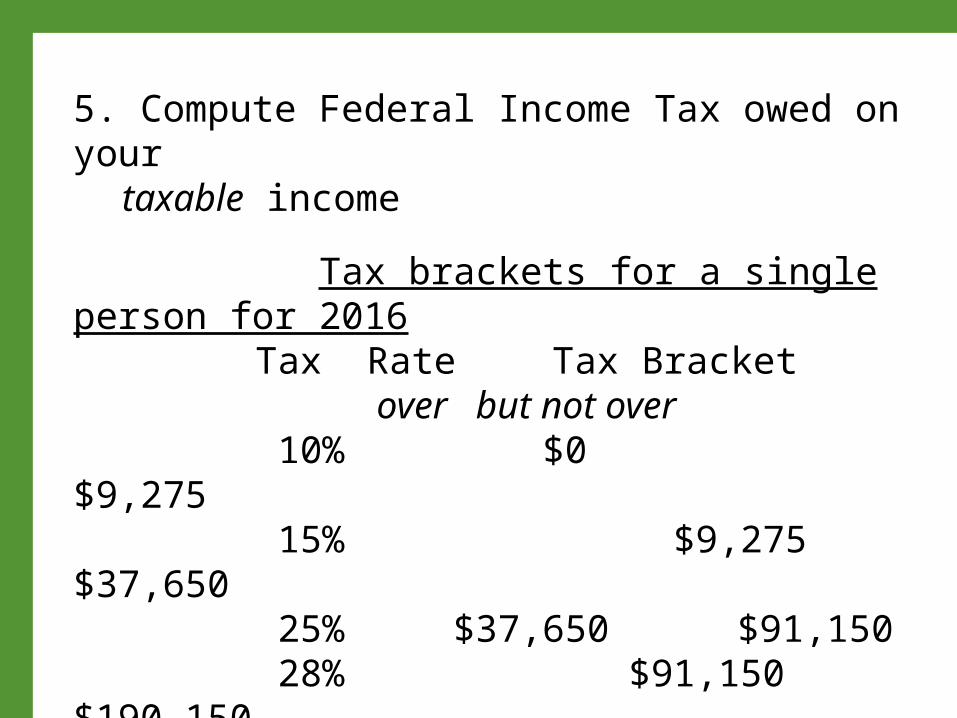
5. Compute Federal Income Tax owed on your taxable income
Tax brackets for a single person for 2016 Tax Rate Tax Bracket over but not over 10% $0 $9,275 15% $9,275 $37,650 25% $37,650 $91,150 28% $91,150 $190,150 33% $190,150 $413,350 35% $413,350 $415,050
39.6% $415,050
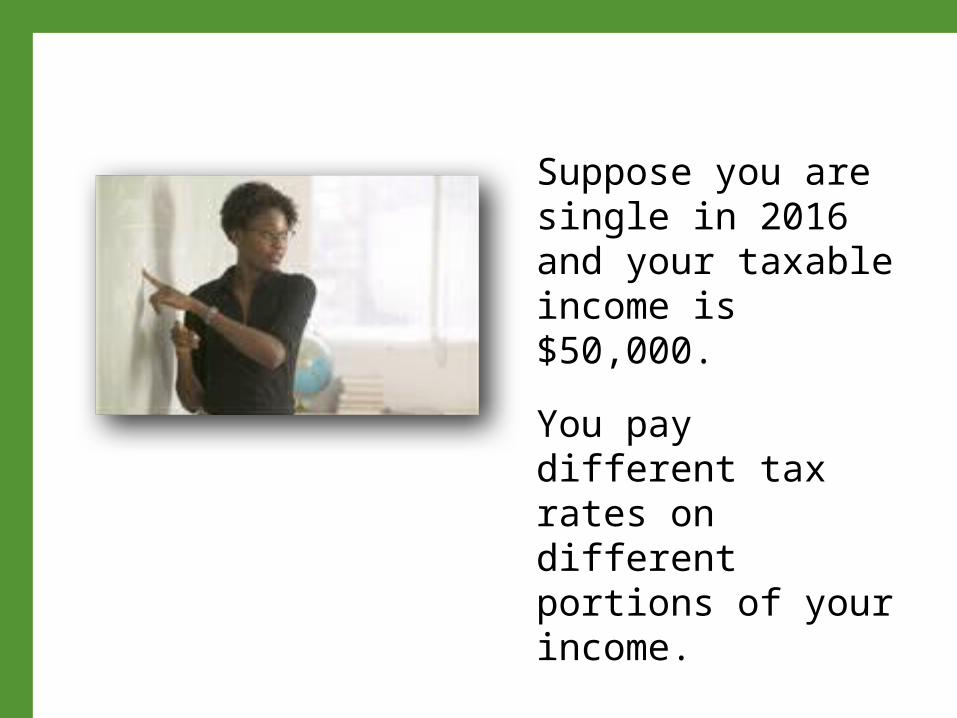
Suppose you are single in 2016 and your taxable income is $50,000.
You pay different tax rates on different portions of your income.
Tax Rate Tax Bracket over but not over
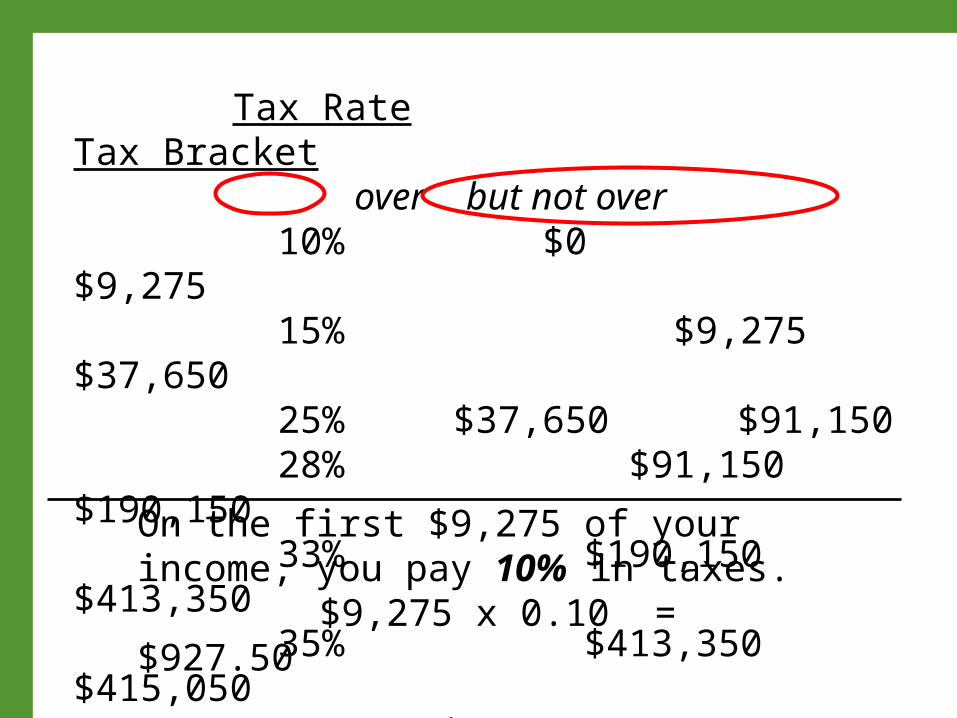
10% $0 $9,275 15% $9,275 $37,650 25% $37,650 $91,150 28% $91,150 $190,150 33% $190,150 $413,350 35% $413,350 $415,050
39.6% $415,050On the first $9,275 of your income, you pay 10% in taxes.
$9,275 x 0.10 = $927.50
Tax Rate Tax Bracket over but not over
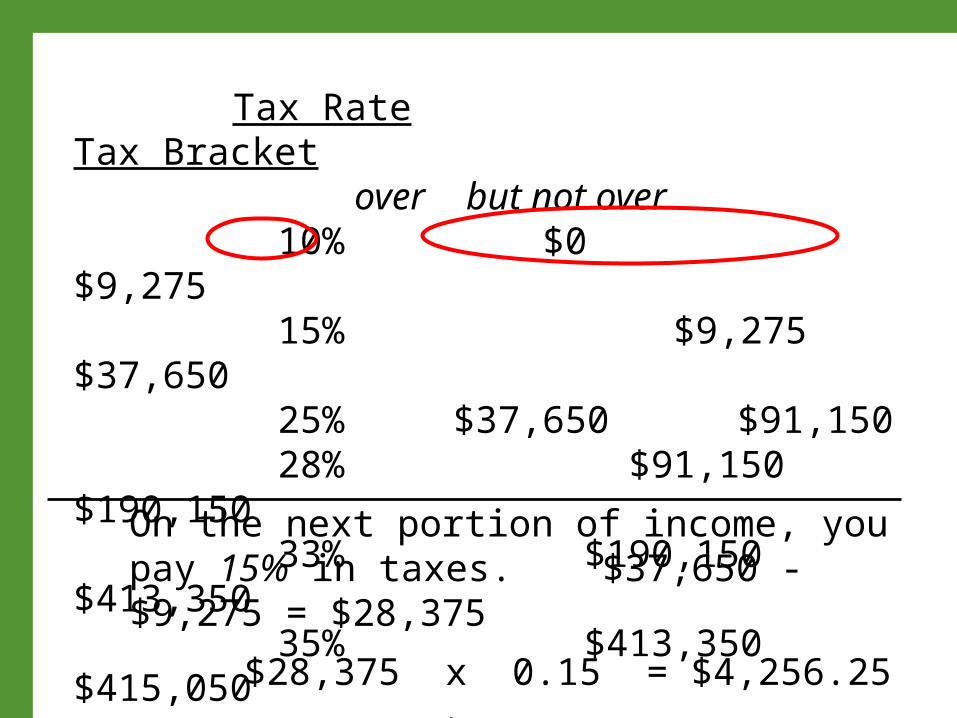
10% $0 $9,275 15% $9,275 $37,650 25% $37,650 $91,150 28% $91,150 $190,150 33% $190,150 $413,350 35% $413,350 $415,050
39.6% $415,050On the next portion of income, you pay 15% in taxes. $37,650 - $9,275 = $28,375 $28,375 x 0.15 = $4,256.25
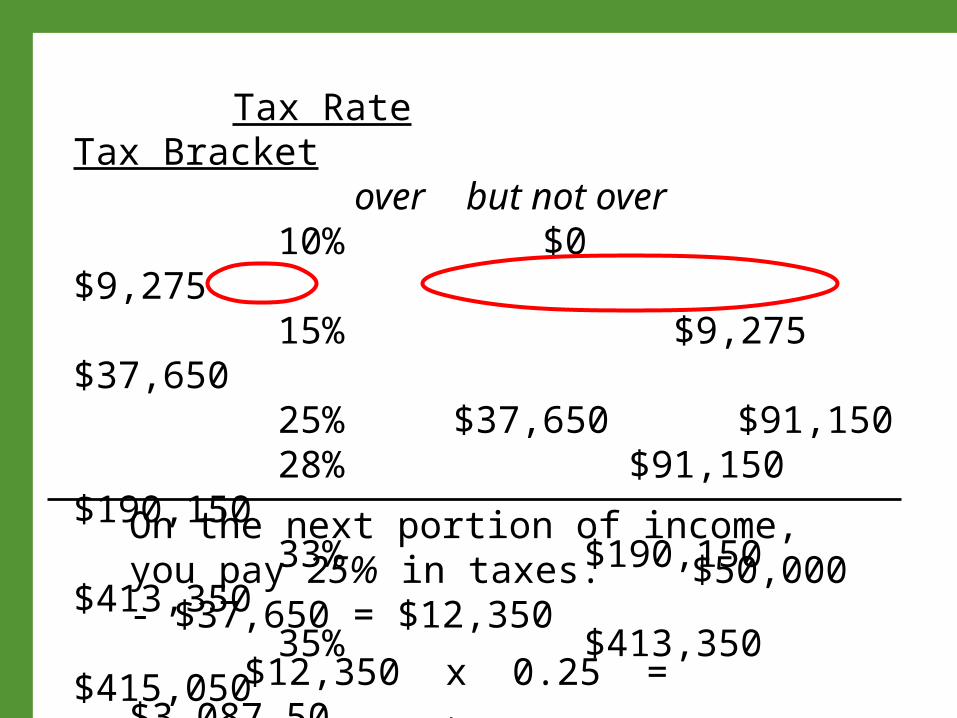
Tax Rate Tax Bracket over but not over
10% $0 $9,275 15% $9,275 $37,650 25% $37,650 $91,150 28% $91,150 $190,150 33% $190,150 $413,350 35% $413,350 $415,050
39.6% $415,050
On the next portion of income, you pay 25% in taxes. $50,000 - $37,650 = $12,350
$12,350 x 0.25 = $3,087.50
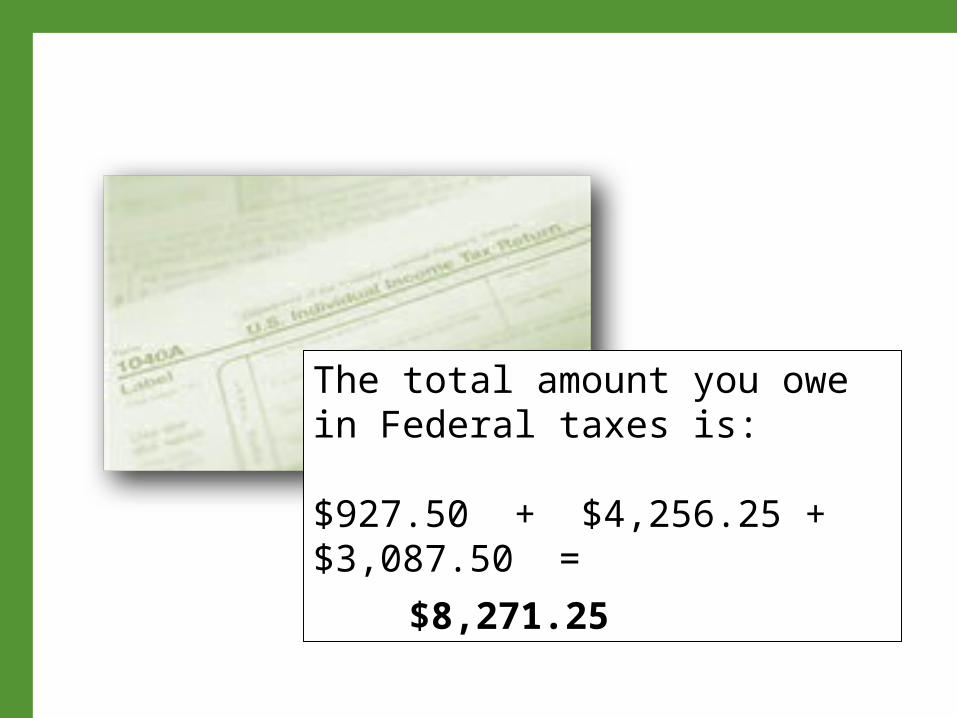
The total amount you owe in Federal taxes is: $927.50 + $4,256.25 + $3,087.50 =
$8,271.25
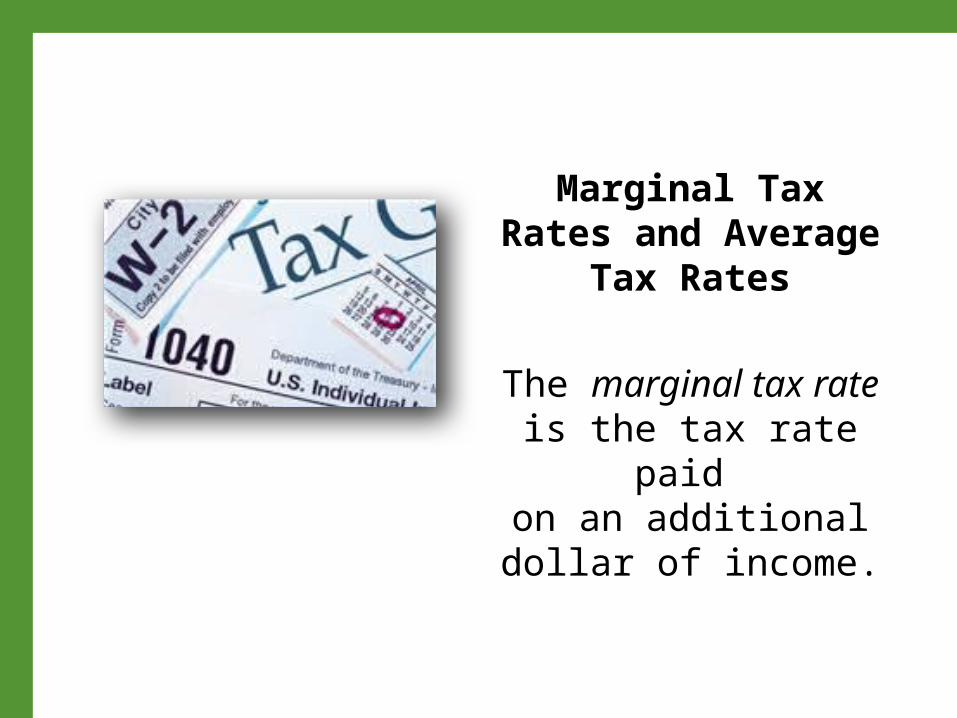
Marginal Tax Rates and Average Tax Rates
The marginal tax rate is the tax rate paid
on an additional dollar of income.
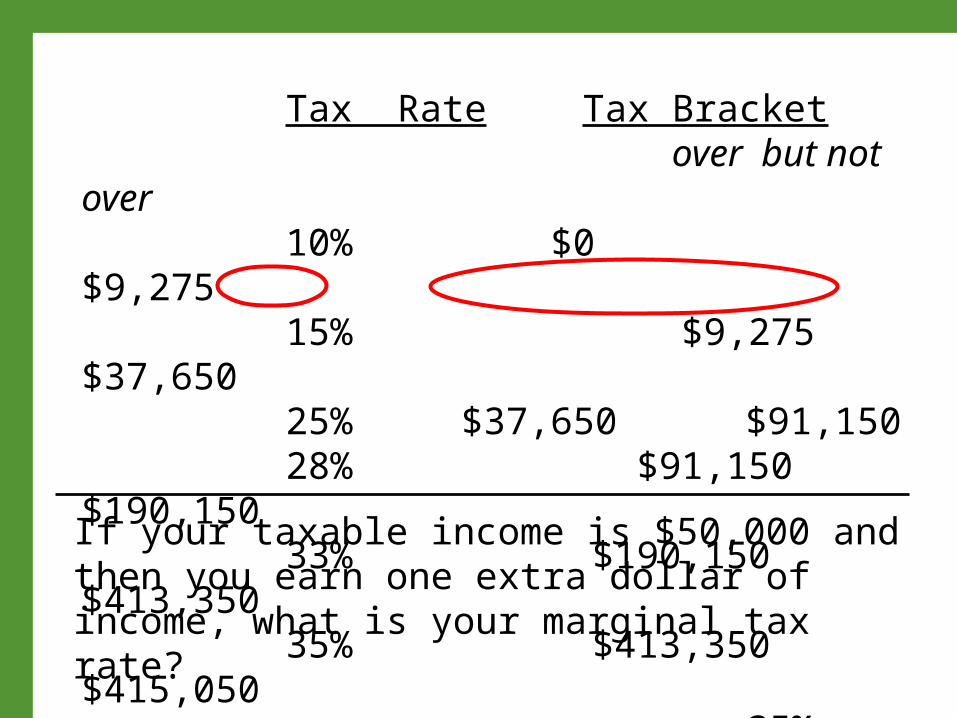
Tax Rate Tax Bracket over but not over 10% $0 $9,275 15% $9,275 $37,650 25% $37,650 $91,150 28% $91,150 $190,150 33% $190,150 $413,350 35% $413,350 $415,050
39.6% $415,050
If your taxable income is $50,000 and then you earn one extra dollar of income, what is your marginal tax rate?
25%
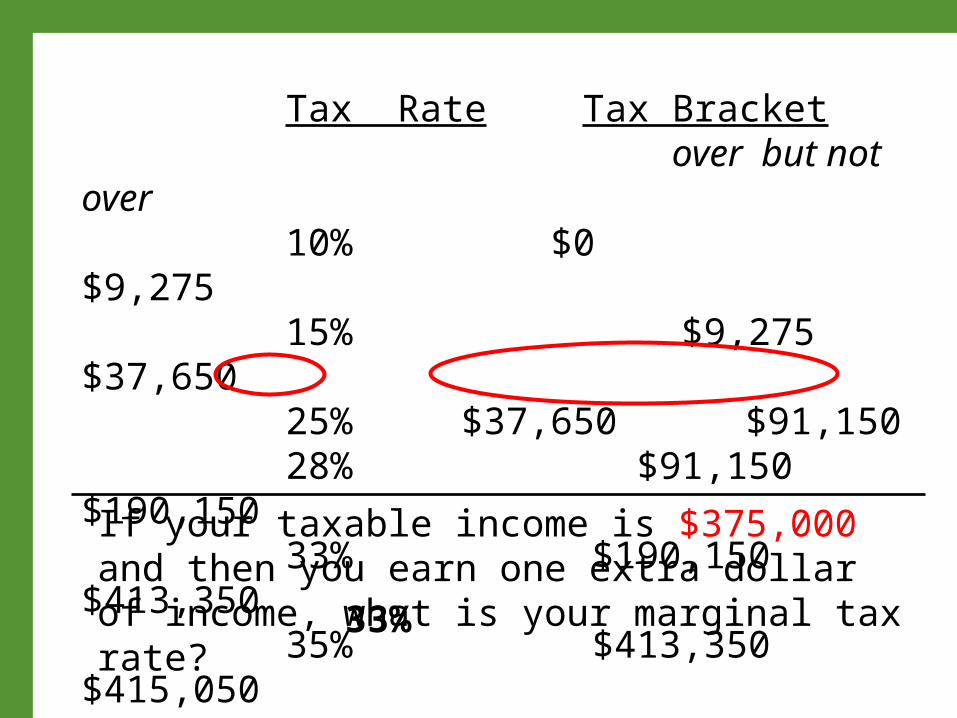
Tax Rate Tax Bracket over but not over 10% $0 $9,275 15% $9,275 $37,650 25% $37,650 $91,150 28% $91,150 $190,150 33% $190,150 $413,350 35% $413,350 $415,050
39.6% $415,050If your taxable income is $375,000 and then you earn one extra dollar of income, what is your marginal tax rate? 33%
The average tax rate (ATR) is the total taxes paid divided by total income, in percentage terms.
ATR = Taxes paid / gross income x 100%
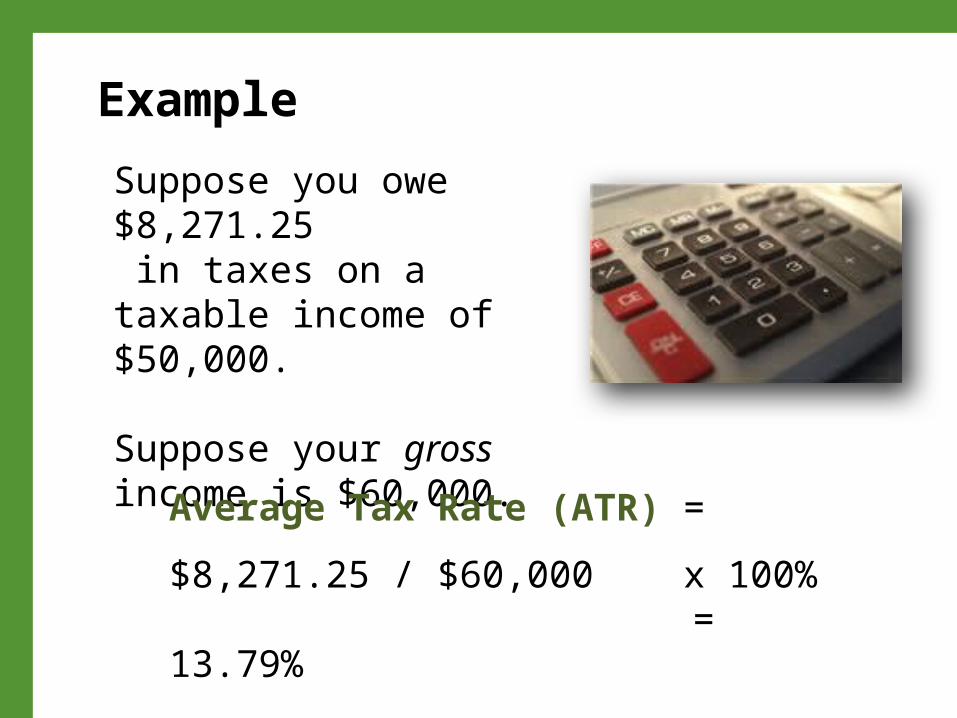
Suppose you owe $8,271.25 in taxes on a taxable income of $50,000.
Suppose your gross income is $60,000.
Example
Average Tax Rate (ATR) =
$8,271.25 / $60,000 x 100% = 13.79%
For a single person with a taxable income of $50,000:
• the marginal tax rate is 25% and• the average tax rate is 14%.
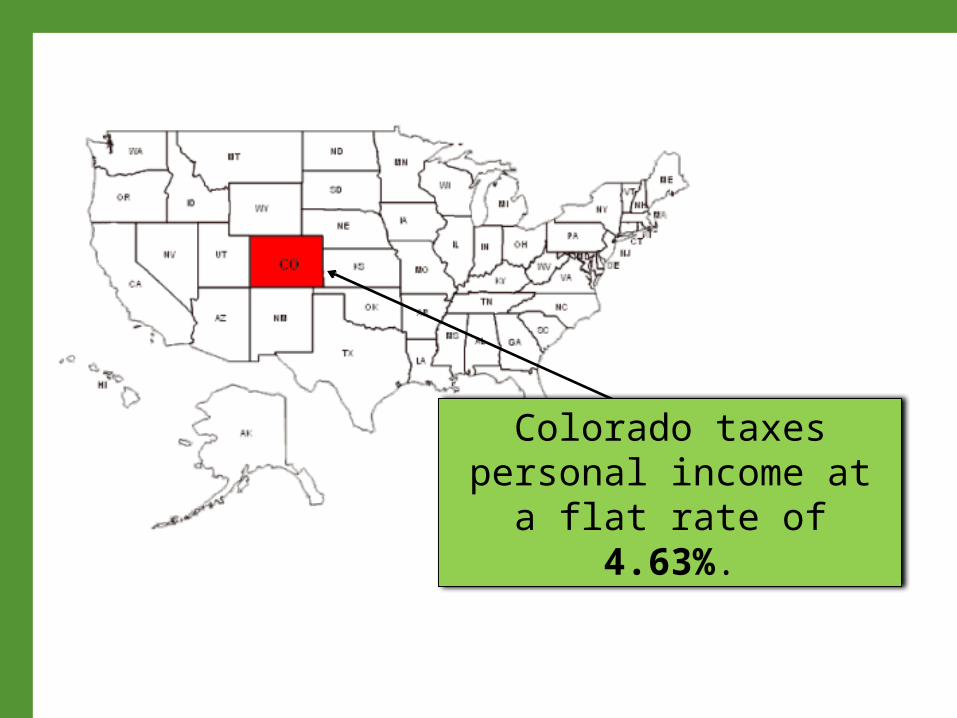
Colorado taxes personal income at a flat rate of
4.63%.
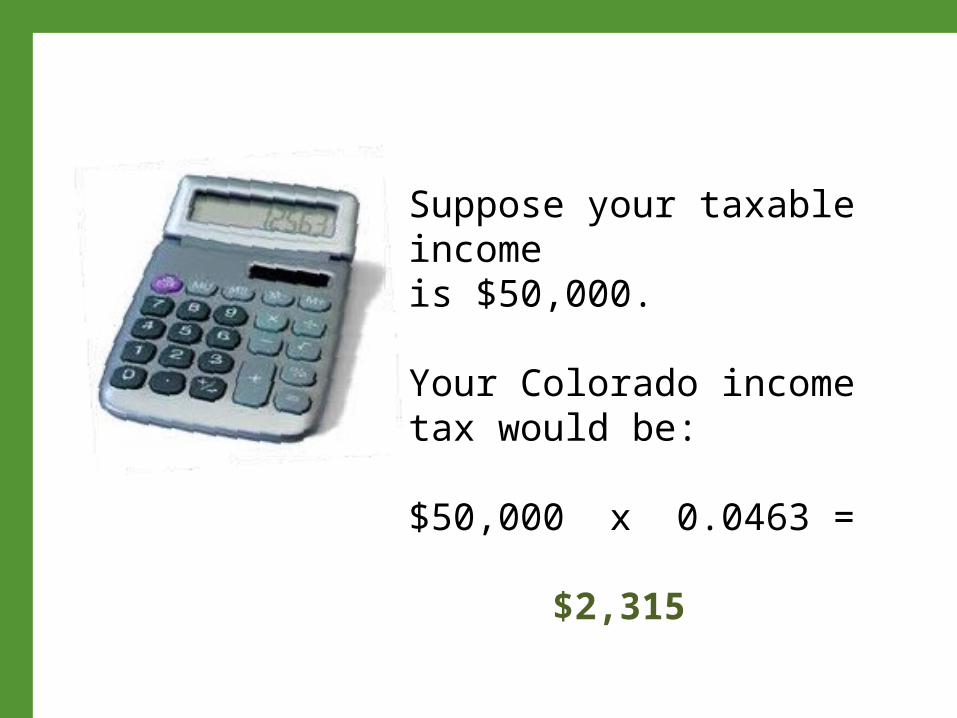
Suppose your taxable incomeis $50,000.
Your Colorado income tax would be:
$50,000 x 0.0463 = $2,315

© 2013, 2016 Colorado Council for Economic Education www.ccee.net