teaching and learning lq 02 - lawrence hall of...
TRANSCRIPT

Communicating Science: A Science Teaching Methods Course Session 2: Teaching and Learning
© 2010 by The Regents of the University of California
1
Session 2: Teaching and Learning
Contents
Overview 1
Background Information for the Presenter 3
Materials and Preparation 5
Preparing for the Session 8
Instructor’s Guide 10
Presentation Slides (also in separate PowerPoint document) 23
Session Handouts 27
Optional Activities 37
Physics Learning Stations 38 Ice Cube Learning Stations 43 Fingerprinting—Solving the Crime 56 Sand on Stage Model Lesson 58

Communicating Science: A Science Teaching Methods Course Session 2: Teaching and Learning
© 2010 by The Regents of the University of California
2
Overview This session is designed to explore how people learn best and to model how to develop lessons that support a variety of learning styles.
— Participants experience a series of learning stations, each using a different teaching approach to investigate the same topic. As they visit each station, the participants are challenged to be aware of their reactions and how each activity supported—or did not support—their individual learning experience. — The group then discusses the advantages and disadvantages of particular approaches. This shared experience makes for a dynamic discussion about teaching approaches, as well as about the diversity in individual learning styles. — The presenter introduces a research-based, instructional model known as the “Learning Cycle,” which focuses on ordering activities to match the way people naturally learn. This useful model breaks the learning process into five different phases that may each suggest particular types of teaching approaches. Although several versions of learning cycles are currently in use, the model presented in this session is based on a five-phase cycle: invitation, exploration, concept invention, application, and reflection. — Finally, as participants experience an exemplar lesson based on this model, they learn how the model can be used to help provoke questions and enable students to integrate and apply new concepts and information.
Participants leave the session with a useful tool for planning and conducting educational activities.

Communicating Science: A Science Teaching Methods Course Session 2: Teaching and Learning
© 2010 by The Regents of the University of California
3
Background Information for the Presenter There has been much research, particularly in the past 10 years, concerning the processes involved in how people learn. An awareness of some of the main findings from this research is extremely useful to anyone involved in designing or presenting educational activities. This session is designed to open the door on the topic of how people learn, and suggest ways to craft learning experiences that reflect this understanding. The Learning Cycle model introduced in this session has been developed by researchers and educators, and refined and deepened in recent years by newer findings in neuroscience and cognitive psychology. The model represents the learning process as taking place in specific phases–invitation, exploration, concept invention, application, and reflection—which eventually lead the learner to begin the cycle once again. This model for instruction also takes into account the learner's prior understandings, and recognizes their need for firsthand experiences. Lessons or activities designed according to the Learning Cycle are learner-centered, provoke questions, and enable the learner to conceptually integrate and apply new ideas and information. In fact, all the adult learning activities in this entire course have been designed with the phases of the Learning Cycle in mind. Familiarity with this instructional model can help course participants begin to understand why they should follow carefully designed activity plans, and supports their ability to make thoughtful instructional decisions while leading science activities. While its roots go back to forerunners such as Dewey, Vygotsky, Bruner, Piaget, and others, the contemporary idea of the Learning Cycle grew out of a breakthrough in science education in the early 1960s, as scientists and educators wrestled with more effective ways to help students acquire, retain, and apply important concepts. In 1962 Robert Karplus and J. Myron Atkin described a three-phase cycle: exploration, invention, and discovery, termed the “guided discovery” approach to learning. The model was further developed in the 1970s as it was applied toward developing more effective science activities for the elementary classroom. Other learning cycle models have evolved including similar phases, although they may be named differently. Some of these instructional models maintain the three main stages of the Atkin/Karplus model, others involve four or more phases such as Rodger Bybee’s “5 E’s” model (Bybee, Achieving Scientific Literacy, 1997). The research on the effectiveness of the Learning Cycle has been quite extensive, (for a summary see Lawson, Abraham, and Renner, 1989; and Lawson, 1995). The Learning Cycle has been instrumental in helping curriculum developers design materials and in assisting teachers in presenting educational experiences that are consistent with what is known about how people learn. These learning cycle-based instructional models share a common vision of how learning takes place and are grounded in a constructivist theory of teaching and learning. Constructivist ideas rely on the assumption that learners must internalize and transform information for themselves in order to create deeper understandings. As summarized in the National Research Council’s 2000 report How People Learn: Brain, Mind, Experience, and School, the most recent cognitive research supports the view that learners are active agents in their own construction of knowledge and delineates three key findings that relate closely to phases of the Learning Cycle. Key Finding #1 states: “Students come to the classroom with preconceptions about how the world works. If their initial understanding is not engaged, they may fail to grasp the new concepts and information, or they may learn them for purposes of a test but revert to their preconceptions outside the classroom.” This finding explains why the Invitation phase of the Learning Cycle is so

Communicating Science: A Science Teaching Methods Course Session 2: Teaching and Learning
© 2010 by The Regents of the University of California
4
crucial and why teachers should take the time to uncover and try to understand students’ prior knowledge of a subject before beginning an instructional sequence. The Invitation phase often provides a significant motivating factor for learning science by engendering student interest and generating a need to know and understand. Key Finding #2 states: “To develop competence in an area of inquiry, students must (a) have a deep foundation of factual knowledge, (b) understand facts and ideas in the context of a conceptual framework, and (c) organize knowledge in ways that facilitate retrieval and application.” This finding highlights the importance of the Exploration, Concept Invention, and Application phases of the Learning Cycle. Students should have a variety of opportunities to explore various scientific phenomena and data sets in order to acquire factual knowledge, and must also consider how this new information fits into larger conceptual frameworks. In this way, the knowledge of facts and an understanding of overarching conceptual ideas both play a significant role in helping students learn about science. Students also need multiple opportunities to apply what they’ve learned and “test out” their new conceptual frameworks in different situations. According to current research, the ability to easily access and transfer knowledge and understanding is key to developing expert knowledge in a discipline. Key Finding #3 states: “A metacognitive approach to instruction can help students learn to take control of their own learning by defining learning goals and monitoring their progress in achieving them.” Metacognition involves learners in considering their learning path and taking note of experiences and ideas that have led to their personal understanding. This type of internal self-monitoring exemplifies the Reflection phase of the Learning Cycle. As students acquire scientific knowledge and understandings, it’s critical that they spend time discussing how they arrived at these concepts and explain their thinking. Through reflecting on their learning processes, they develop the ability to think flexibly and acquire new understanding as needed. It’s important to be mindful of the fact that the Learning Cycle we present is one model that can be used to represent, organize, and categorize main phases in science learning. It’s not the only way to conceptualize learning. It should not be seen as a rigid or mechanical model—people and their learning processes are gloriously complex, and there is no automatic order or sequence in which these phases must take place. That said, the Learning Cycle model of instruction can be powerful and enormously helpful in stimulating thinking about how people learn and in designing lessons that succeed in conveying concepts to students in meaningful and effective ways. References Atkin, J. M. & Karplus, R. (1962). Discovery or invention. The Science Teacher 29(2), 121-143. Bybee, R. M. (1997) Achieving Scientific Literacy: From Purposes to Practices, Portsmouth,
NH, Heinemann Lawson, A. E. (1995). Science teaching and the development of thinking. Belmont, CA,
Wadsworth Publishing Company. Lawson, A. E., Abraham, M. R., & Renner, J. W. (1989). A theory of instruction: Using the
learning cycle to teach science concepts and thinking skills [Monograph, Number One]. Kansas State University, Manhattan, KS, National Association for Research in Science Teaching.
National Research Council (2000) How People Learn: Brain, Mind, Experience, and School, Washington D.C., National Academies Press

Communicating Science: A Science Teaching Methods Course Session 2: Teaching and Learning
© 2010 by The Regents of the University of California
5
Materials and Preparation Important Note to Presenter: You will need to decide on two important points before proceeding:
(1) The Content of the Activity Stations. Choose whether you want to use the four Chemistry stations (most appropriate for audiences with less background in science) or the four Physics (cup and card) stations (most appropriate for science-sophisticated audiences). While both sets of stations have been successfully used with broad audiences, we’ve found that the lesson is particularly effective if the activities are challenging enough to stretch the participants, but not overly challenging so they become frustrated.
Note: The overall goals of the session apply to the teaching of any topic, however the activities are most effective if participants are authentically learning new content themselves. For this reason, we’ve included several choices of topics. There is a set of four chemistry stations that are challenging enough and work well for most audiences. These are described in the body of this session write up. If you are presenting this session to people with a higher-level science background (such as science teaching assistants, science professors, or researchers) who need to be challenged with a more complex problem, consider using the Physics “cup and card” learning station activities which focus on the concept of pressure (page 37). If ocean science content is more appropriate for your audience then select the Ice Cube learning stations that explore the concept of density (page 42).
(2) The Learning Cycle Lesson Exemplar. Choose whether you want to present portions of the GEMS unit Fingerprinting described in this session or if you’d prefer to present another lesson that models the learning cycle. Here’s how Fingerprinting follows the learning cycle:
Invitation: Questions to elicit interest and curiosity: “What are fingerprints?” “ What do you know about fingerprints?” “Have you ever been fingerprinted?”
Exploration: Students make their own fingerprints, look at them, notice patterns, then group and name them in their own way. Look at 10 new prints.
Concept Invention: The standard classification system (arch, loop, whorl) is introduced.
Application: Students classify their own fingerprints using the standard system. Optional: students further apply what they’ve learned to a mystery scenario (“Who Robbed the Safe?”)
Another excellent exemplar, from the On Sandy Shores GEMS unit, has been used in the Communicating Ocean Science course—we provide a concise version of this “Sand on Stage” activity (page 58). The GEMS unit On Cabbages and Chemistry is another excellent exemplar—but there’s significant work involved preparing materials for that lesson. If you already present the unit or have access to pre-made GEMS kits, you might consider presenting “Telltale Colors” and “Presto-Change-o.” Ideally, the exemplar lesson you present should be one you’re very familiar with that’s appropriate for the level of your participants and/or their students, as well as being specific to the science content needs of your course. The specific lesson is less important than choosing something that provides a good and relevant example of the learning cycle.

Communicating Science: A Science Teaching Methods Course Session 2: Teaching and Learning
© 2010 by The Regents of the University of California
6
Materials Needed For the Learning Stations Special Note: We recommend that for up to 20 participants, one of each of the four stations is adequate. With more than 20, you will want to provide two set-ups of each station, so participants can rotate through them in the time allowed and have a real opportunity to experience each station. Should the number of participants grow even larger, you will need to increase stations and materials accordingly.
For the workshop/all stations: ❐ 6 cafeteria trays (or cookie sheets) to carry station materials ❐ 6 sets of debrief questions
For each participant: — one copy of “Read and Answer” sheet (master on page 34) — one copy of “The Learning Cycle” sheet (master on page 35)
For each two participants: — one copy of “Structured Activity” sheets (master on page 32–33)
For Station A, Open-Ended Exploration ( materials needed to set up one station): ❐ 1 squeeze bottle phenol red (diluted with tap water) ❐ 1 squeeze bottle bromothymol blue (diluted with tap water) ❐ 1 squeeze bottle white vinegar (mixed 50/50 with tap water) ❐ 2 squeeze bottles water ❐ 1 labeled container of each: salt, baking soda, and baking powder ❐ 3 1/4 teaspoons ❐ 3 popsicle sticks or coffee stirrers ❐ 3 paint trays ❐ 1 dish tub for rinsing equipment ❐ 1 sponge ❐ 1 copy of the Station A instructions
For Station B, structured activity, materials needed to set up one station:
❐ 1 squeeze bottle vinegar ❐ 1 squeeze bottle phenol red ❐ 2 squeeze bottles water ❐ 3 labeled graduated cylinders - 25 ml size (or cough-medicine-type cups) for
vinegar, phenol red, and water ❐ 1 labeled container of each: baking soda and salt ❐ 6 clear plastic cups ❐ 2 teaspoons ❐ 2 popsicle sticks or coffee stirrers ❐ 1 dish tub for rinsing equipment ❐ 1 sponge ❐ 1 copy of the Station B instructions

Communicating Science: A Science Teaching Methods Course Session 2: Teaching and Learning
© 2010 by The Regents of the University of California
7
For Station C, challenge/application (materials needed to set up one station): ❐ 1 squeeze bottle phenol red ❐ 1 squeeze bottle bromothymol blue ❐ 1 squeeze bottle vinegar ❐ 2 squeeze bottles water ❐ 1 labeled container of each: salt, baking soda, and baking powder ❐ 3 1/4 teaspoons ❐ 3 25 ml graduated cylinders or plastic vials without lids ❐ 3 popsicle sticks or coffee stirrers ❐ bag of small balloons ❐ 3 paint trays ❐ 1 dish tub for rinsing equipment ❐ 1 sponge ❐ 1 copy of the Station C instructions
For Station D, Read & Answer: — one copy for each participant of the “Read and Answer” sheet (page 34) — one copy of the Station D instructions (master on page 31)
Materials Needed For the Fingerprinting activities: What You Need For the group:
❐ 1 pair of scissors ❐ 1 overhead transparency “Fingerprint Patterns” (see masters following page 36)
❐ an overhead projector For each pair of students:
❐ 1 envelope containing the “10 Fingerprints” cut apart (see #5 under “Getting Ready” for Fingerprinting below)
❐ 2 “Fingerprint Patterns” sheets (masters following page 36) ❐ a magnifying lens
For each student:
❐ a completed “Your Fingerprints” sheet ❐ a pencil Larger versions of the three main fingerprint patterns at the end of the set of masters that follow page 36, should you wish to use them for transparencies. For the optional Solving the Mystery activity: For each student: –“Suspects” student sheet (see masters following page 36) –“Safe with Prints” (see masters following page 36) 1 pencil 1 magnifying lens

Communicating Science: A Science Teaching Methods Course Session 2: Teaching and Learning
© 2010 by The Regents of the University of California
8

Communicating Science: A Science Teaching Methods Course Session 2: Teaching and Learning
© 2010 by The Regents of the University of California
9
Preparing for the Session Before the Session
Make overhead transparencies or PowerPoint slides of the following: Think About Your Own Learning Experiences The Learning Cycle Session Summary
For the Chemistry Stations:
1. Copy station signs. Make enough signs to have one for each station you are setting up.
2. Make copies for each participant and set aside: — one copy of “Read and Answer” sheet (master, page 34) — one copy of “The Learning Cycle” sheet (master on page 35)
3. Make copies for each two participants: — “Structured Activity” sheet for Station B (master on pages 32–33)
4. Make a wall chart list of station titles. Write the following list of the stations in large lettering on chart paper or a chalkboard to refer to throughout the session:
A — Open-ended Investigation B — Structured Activity C — Problem-Solving Challenge/Application D — Read and Answer
5. Label squeeze bottles: 3 phenol red, 2 bromothymol blue, 3 vinegar, 6 water
6. Prepare indicator solutions. Add a small amount of concentrated phenol red into labeled bottles—then dilute the phenol red with tap water until it is pale red in color. Do the same with the concentrated bromothymol blue solution, until it turns pale blue.
7. Prepare the vinegar solution. Mix white vinegar 50/50 with water in squeeze bottles.
8. Label and fill the powder containers. Use masking tape or self-adhesive mailing labels to label the containers, then fill them with the designated powders: 3 containers salt, 3 of baking soda, 2 of baking powder.
For the Fingerprinting activities:
1. Duplicate one copy of the following two student sheets for each participant: “Your Fingerprints” and “Fingerprint Patterns” (masters after page 36)
2. Use a high quality photocopier to duplicate one “10 Fingerprints” sheet from the master following page 36, for each pair of students. If you will also present the mystery scenario, photocopy one “Suspects” sheet and one “Safe with Prints” sheet for each student from the masters following page 36.

Communicating Science: A Science Teaching Methods Course Session 2: Teaching and Learning
© 2010 by The Regents of the University of California
10
3. Make an overhead transparency of the “Fingerprint Patterns” sheet. While using a projector in this activity may seem optional, teachers have found that it significantly increases students’ understanding of how to classify fingerprints. 4. Before you begin the lesson, spend 5–10 minutes learning the technique described below by making your own set of fingerprints.
a. Using a No. 2 pencil, rub a small black patch of graphite onto a piece of paper.
b. Rub your finger back and forth across the graphite. (It is important that the front of the finger, not the tip, be blackened. If only the tip is blackened the print will not include the “interesting” part of the fingerprint.
c. After your finger is blackened, use a piece of tape to “lift” the fingerprint directly from the finger.
d. Place the tape on a clean part of the white scratch paper: The fingerprint can now be seen and examined.
5. Cut out the ten fingerprints from the “10 Fingerprints” sheets and put them together in an envelope. Make one envelope containing all ten prints for each pair of students. Alternatively, you can have the students cut out the fingerprints. Teachers who present this activity many times to different groups of students have chosen to laminate the ten fingerprints. 6. Familiarize yourself with the standard fingerprint classification scheme by reading the descriptions of the main categories on the “Fingerprint Patterns” sheet. Practice classifying the “10 Fingerprints.” Check yourself with the key for “10 Fingerprints” included in the masters following page 36. Try classifying your own fingerprints. As you attempt to classify more and more fingerprints, you will discover that many prints seem to fit in more than one category. Your job in classifying them is to decide, for instance, whether most of the lines “leave” on the same side of the print that they “started” (like a loop), or whether most of the lines “leave” on the other side of the print (like an arch).
On the Day of the Session
1. Set up the teaching approaches stations Set up the three stations by putting the materials (described under “What You Need” above) on a tray, with the instructions for that station. You will need to set up duplicate sets of these stations if you have more than 20 participants. The three stations are: Open-Ended Investigation; Structured Activity; and Problem-Solving Challenge/Application. 2. Set out the materials needed for the model lesson. Place the fingerprinting materials somewhere convenient for later distribution.

Communicating Science: A Science Teaching Methods Course Session 2: Teaching and Learning
© 2010 by The Regents of the University of California
11
Instructor’s Guide Session Objectives In this session, participants: — explore the advantages and limitations of different teaching approaches. — understand that different learners have preferences for different teaching
approaches. — see the importance of providing learners with a balance of different
teaching approaches. — learn about an effective model for instruction known as “the learning
cycle,” and gain the ability to analyze how lessons can be constructed to incorporate the learning cycle.
— become aware of the power of strategic sequencing of different teaching approaches to achieve in-depth learning.
Time Frame
Total Workshop: 2 hours Introduce Session & Activity stations (10 minutes) Activity Stations (30–40 minutes) Debrief Stations (20 minutes) Introduce Learning Cycle (10 minutes) Model learning cycle lesson (30 minutes) Session Summary (10 minutes)
Session Activities at a Glance Introducing the Session The session begins with participants thinking back on how different teaching approaches have affected them as learners, as a way to invite participants to begin thinking about the topic, and access prior knowledge they may have about teaching and learning. Rotating through Activity Stations The participants are then briefly introduced to the logistics of rotating through and participating in four activity stations: Open-ended Investigation, Structured Activity, Problem-Solving Challenge, and Read & Answer. They then rotate through the stations while thinking about how each activity affects their experience of learning. Debriefing Activity Stations After all participants have completed each station, the presenter leads a probing discussion of their experiences and thoughts, helping the group to compare and contrast the strengths of each kind of teaching approach. The presenter draws out the fact that different learners have different abilities and preferences for teaching approaches, highlighting the importance of a teacher using a variety of approaches.

Communicating Science: A Science Teaching Methods Course Session 2: Teaching and Learning
© 2010 by The Regents of the University of California
12
Introducing the Learning Cycle The presenter introduces the instructional model known as the learning cycle, in the following sequence, as a helpful way to think about how people learn: invitation–exploration–concept invention–application-reflection. The presenter leads participants to discuss how different teaching approaches are more or less suited for each phase of the learning cycle and to understand the logic of sequencing different types of learning activities. Learning Cycle Lesson Exemplar The presenter concludes the session by conducting a lesson that exemplifies the Learning Cycle. This is an important step in which the participants apply the theory presented in this activity to an activity they may be presenting to students. Participants are invited to point out the different phases of the cycle and reflect on the power of this order in this particular learning situation.
Session Summary Participants reflect on how the learning cycle was used throughout the entire session and the presenter emphasizes the flexible use of the tool. Introduce the Topic of Teaching Approaches (10 minutes)
INVITATION At this point, participants access prior knowledge and experience with the topic in order to engage them and set up the learning station activity. Note: The phases of the learning cycle have been labeled in this write-up for the presenter’s awareness, but are not meant to be announced to participants.
1. Initiate thinking about the topic. Ask your participants to brainstorm different teaching approaches that they have experienced themselves. For example: lecture, textbook, simulation, debate, exploration activity, etc. Have participants discuss the following question with the person sitting next to them for about two minutes
In your own education, what teaching approaches do you remember responding best and worst to? Note to Presenters: As with all sessions in this guide, the presentation to workshop participants has been designed to “practice what we preach.” The lesson plan itself has been set up to reflect a learning cycle approach to instruction. Through the session, the participants actually experience a version of the learning cycle instructional model as they learn about it. It is important that the session and presenter provide the opportunity for participants to experience each phase of the model for themselves— resisting the temptation to dole out too much information too early. Rather, the presenter should set up the circumstances and allow the participants to bring up most issues, while strategically inserting appropriate information to help clarify and organize the experience (and learning!) of the participants.

Communicating Science: A Science Teaching Methods Course Session 2: Teaching and Learning
© 2010 by The Regents of the University of California
13
2. Introduce the goals of the activity stations. Point out that in this next part of the session, they will be rotating through three stations that represent different instructional approaches. Later, they will explore a fourth approach all at the same time.
a. Stations designed for adults. Let them know that these stations have been specifically designed for adults, to stimulate discussion on how people learn, and how classroom learning can be structured. These activities are not meant to be presented to children. Explain that they may know a little or a lot about this particular topic, but the stations represent different approaches to teaching a topic of any kind.
b. Reflect on learning experience. Emphasize that although one of their goals is to perform the assigned tasks, and get “caught up” in the activities themselves, the most important objective is to reflect on the learning experience. Encourage them to be aware of how they personally react to each approach, and how each stimulates, stifles, or in some other way impacts their learning.
3. Introduce the station activities. Explain that at each station they will:
a. Do the activity: Work with a partner to read the signs and follow the directions. There will be a signal given when your time is almost up. You should expect to spend about eight to ten minutes at each station.
b. Clean up the station: When you are finished, please use the dish tubs, squirt bottles and sponges provided to rinse and clean up the materials before moving on to the next station.
EXPLORATION Participants experience a variety of learning stations, notice how they are affected by them, and begin to come up with questions and ideas on the topic.
Rotating through Activity Stations (40 minutes) 1. Pass out trays and monitor station activities. Place an activity station tray at
each table of participants. As participants work at the stations, check in with the groups to make sure they understand the directions, are making progress, and that they clean up the station before they move on.
2. Announce time and rotate groups. Keep an eye on the progress of groups at
Station B. When most of them have finished both sides of their worksheet (after about eight to ten minutes), announce to the whole group that it is time to clean up and move on to the next station. Explain how they should rotate, with people from Station A moving on to Station B, Station B moving to Station C, and Station C moving to Station A.
3. Hand out Station D Read & Answer worksheets. After all groups have
rotated through the first three stations, hand out the Station D worksheet to each participant to complete individually.

Communicating Science: A Science Teaching Methods Course Session 2: Teaching and Learning
© 2010 by The Regents of the University of California
14
Debriefing Station Activities (20 minutes) Note to Presenter: In order for participants to feel comfortable sharing their own ideas in a discussion based on open-ended questions, it’s important for the presenter to be accepting of all responses. The discussion may be much less effective if a hidden agenda emerges when the discussion leader responds in an accepting fashion to some comments while negatively to others. Also, in order to encourage participation from everyone—rather than just a few more assertive participants— after asking a question, allow a few seconds of “wait time” before calling on anyone. The beauty of the following discussion is that participants bring up all the points, and the leader merely serves as facilitator of the discussion. Although the “script” for leading this discussion is provided as a guideline and framework, it should not simply be read off to participants. Instead, the discussion leader should ask open-ended questions—many of which are suggested in the script—and “flow” with the participants’ responses and comments, while keeping the discussion generally on track and within schedule. This kind of dynamic interchange cannot be fully scripted, and depends on the facilitation skills of the presenter. 1. Participants discuss responses to Station A. Ask participants to reflect on their responses to the activities. Draw attention to Station A, the Open-ended Investigation, and ask them to reflect on their reactions to the station. How did it make them feel? Did they learn from it? Be accepting of all responses. Be prepared for (and welcome) some disagreement. If only positive reactions to the station are brought up, ask if anyone had a negative reaction, and vice versa. You may want to point out that the Open-Ended Investigation station was intentionally unstructured in an exaggerated fashion, in order to provoke reaction and discussion. In the classroom, an open-ended activity need not be completely unstructured. You may want to point out that providing specific procedural directions, suggesting charts for recording data and conducting debrief discussions can often make an investigation a more rewarding educational experience for all learners. 2. Discuss reactions to rest of the stations. Follow the same process in discussing stations B, C and D. Give ample time for discussion of each station and make sure participants point out both strengths and weaknesses of each approach. 3. Conduct a quick vote for favorite stations, and discuss participant preferences. Ask participants to raise their hand for the station at which they felt most comfortable. Read the station titles and letters from the wall chart one at a time, and take a quick visual survey of the group’s votes. Point out and discuss any interesting trends that may emerge in your group.
Explain that different individuals often have different teaching approach preferences, and each group of participants may (or may not) have a shared collective preference. Note that these preferences may have to do with individual

Communicating Science: A Science Teaching Methods Course Session 2: Teaching and Learning
© 2010 by The Regents of the University of California
15
learning styles or with what teaching approaches they’ve had most exposure to in the past. 4. Ask participants to suggest some possible goals related to different teaching approaches. Point out that teachers’ choices for different approaches can often depend on the goals of the lesson. Ask what goals each type of approach might serve. Use the following summary, not to read off item by item, but to supplement the discussion, if necessary.
Open-Ended Investigation • Introduce a new subject area • Generate questions • Generate student interest and foster positive attitudes about science. • Encourage students to work together without direct teacher instruction • Develop and identify concepts, processes and skills, raise questions and
problems. • Provide a common base of experiences. • Practice observation skills.
Structured Activity • Introduce concepts, vocabulary, processes, skills, and investigation
methods. • Guide students toward specific discoveries. • Provide a common base of experiences. • Provide successful activities with predictable outcomes.
Problem-Solving Challenge/Application • Model what scientists do. • Provide a sense of accomplishment. • Challenge students’ conceptual understanding and skills by applying
them to new situations. • Develop deeper and broader understanding through real world
applications.
Read and Answer • Provide specific content information and vocabulary on a topic. • Extend the information from an activity into descriptions of related
experiences that are impractical in a classroom setting. • Provide alternative explanations and make connections into other
subject areas. 5. Note other factors that may impact teachers’ choices. Point out that choices of teaching approaches also depend on available time, home and school culture, and the previous experiences of the audience and the teacher. One of the most significant factors influencing an educators’ choice of teaching approach is their own comfort level with learning via a given approach. For example, if an educator prefers to learn from an Open-Ended Investigation approach, they are more likely to teach using that approach. Remind participants to keep in mind that not all learners function best with one particular approach. Some groups (and individuals) may need more guidance, and others may need more time to explore. Because of different learners’ readiness, as well as their preferences—it’s best to use a balanced diet of teaching approaches.

Communicating Science: A Science Teaching Methods Course Session 2: Teaching and Learning
© 2010 by The Regents of the University of California
16
6. Discuss the sequence of stations. If it hasn’t been mentioned, point out that each group rotated through the groups in a different sequence. Ask if they thought there were any advantages to the order they did the activities, or if there is a different order they think would suit them better or be more effective.
CONCEPT INVENTION Participants’ experiences and ideas are integrated into research and ideas of educational experts, as the learning cycle is introduced.
Explaining the Learning Cycle (10 minutes)
1. Introduce questions about how people learn. When faced with a new experience or learning situation, how do people tend to approach and successfully integrate lessons into useful knowledge? Many scientists and educators have openly wondered about the same thing: How do people learn? Is there a specific sequence that encourages optimal learning? 2. Provide background about the model. The Learning Cycle is a model that was developed to provide a method for organizing and delivering educational experiences that are consistent with what is known about how people learn. This instructional model was actually foreshadowed by leading educators in the early 1900s, and has now gained wide acceptance as a useful way to look at the phases encountered when people learn. In the early 1960s scientists and education researchers who were dedicated to designing science and mathematics lessons that were educationally effective and better aligned with the learning process, began using the learning cycle model to help guide their curriculum development. It is has been transformed and deepened through educational research on common components of good instructional models, as well as the work of cognitive scientists and classroom-based researchers who study teaching and learning.
Some Other Variations of the Learning Cycle “The Five E’s”: Engagement, Exploration, Explanation, Elaboration, and Evaluation from the chapter entitled “Improving Instruction” in Achieving Scientific Literacy: From Purposes to Practices by Roger Bybee (1997). David Kolb’s (1984) Experiential Learning Model: Concrete experience, Reflective observation, Abstract conceptualization, and Active experimentation. (Referred to in Learning is About Making Connections by K. Patricia Cross.) Also “Common Components Shared by Instructional Models from Inquiry and the National Science Education Standards, “page 35. In addition, the “Ignatian Pedagogical Paradigm” of the Jesuits: Context, Experience, Reflection, Action, and Evaluation.
3. Display the Learning Cycle slide, and describe each phase.
Invitation: An invitation is a question, problem, observation or demonstration that initiates the learning task. It should make connections between past and present learning experiences, anticipate activities and organize students’ thinking toward the learning outcomes of current activities. If learners are not engaged, they may not retain what they learn and are probably only involved in rote learning.

Communicating Science: A Science Teaching Methods Course Session 2: Teaching and Learning
© 2010 by The Regents of the University of California
17
Exploration: Learner is engaged in open-ended investigation of real phenomena, and can also involve some discussion about discoveries, results, ideas, and questions that arise. This can be through hands-on activity or through discourse and thought processes. It can be more or less structured, but the idea is that exploration should be driven mainly by the learner’s interest and questions.
Concept Invention: The concept invention phase involves the active processing of the experience by the learner. Learners now review evidence and data gathered through exploration and try to make sense of it. With interest and attention focused, new ideas can be discovered and the learner can solve problems and begin to construct new meanings. When possible, students should be free to invent and discuss their own understandings directly from their hands-on experiences.
Application: Armed with new ideas and concepts, the learner applies knowledge and abilities to different situations from those they have already encountered. Researchers agree that in-depth learning requires being able to transfer knowledge from familiar circumstances to novel ones.
Reflection: After trying out new ideas in different settings, students reflect on how their original notions have been or need to be modified. They may also generate new questions that can initiate a new learning cycle.
APPLICATION Participants apply the phases of the learning cycle to the activities they just experienced. 4. Connect the structure of this session with the learning cycle model. Draw participants’ attention to the elements of the session that fit with the learning cycle model.
Invitation: The initial questions posed at the beginning of the lesson. Exploration: The station activities and discussion. Concept Invention: The introduction to the learning cycle model. Application: Discussing how the learning cycle applies to the structure of the session. Further application and reflection will occur later in the session.
5. Emphasize the learning cycle as a model. Explain that every successful lesson need not include all stages of the Learning Cycle. There may be cycles within cycles in one lesson, or just one stage of a cycle in a lesson. Sometimes students may have explored a subject extensively before coming to class and be ready to enter the cycle at the concept invention phase right away. Emphasize that the learning cycle is a model—meant to represent, organize, and categorize main phases in learning—but not to suggest that this is the only way to conceptualize learning! Nor should it be seen as a rigid or mechanical model—people and their learning processes are gloriously complex. Depending on the person and the content being learned there is no requirement that these phases must take place during a single lesson.
6. Describe drawbacks of focusing on only one phase. Point out that many educational activities suffer as a result of the instructor focusing on the particular phase of the cycle with which they feel most comfortable. For example, many teachers spend most of their time with concept invention, most likely because

Communicating Science: A Science Teaching Methods Course Session 2: Teaching and Learning
© 2010 by The Regents of the University of California
18
this is the way they were taught. It can also be just as detrimental to focus solely on exploration, neglecting or rushing other important phases in the process. Model a Learning Cycle-Based Lesson (30 minutes)
Note: Following are instructions for presenting a portion of the GEMS unit Fingerprinting, as an exemplar of a learning cycle-based lesson. Be sure to give enough time for your course participants to experience at least a sense of what students would experience in classroom presentation, and to get a feel for the overall flow of the lesson, but keep in mind the 30-minute time frame for the activity. It’s okay to abbreviate and shortcut certain portions, once the participants understand what’s intended to happen with students. (If you have more time, you may also want to go through the optional mystery scenario, on page 56.) Introducing Fingerprinting 1. Introduce the model lesson. Tell the participants that you’ll now be presenting a lesson that embodies the learning cycle. At the conclusion of the lesson, you’d like them to share their ideas of how the different phases of the learning cycle relate to the activities. 2. Introduce Fingerprints. Lead participants in a short discussion of fingerprints by asking:
• “What are fingerprints?”
• “Raise your hand if you’ve heard that all people’s fingerprints are different.”
• “Have you had your fingerprints taken?”
• “What are some of the reasons fingerprints are taken?”
• “Why are prints taken from fingers—couldn’t we take elbow or
ankle prints instead?” [One logical response is that fingers are used to pick things up.]
3. Explain Criminalist’s role. Tell participants that they will become criminalists in this activity. Explain that criminalists are people who study crimes and analyze clues in a systematic and scientific way and fingerprints are an important part of what criminalists study. A criminalist is a person who uses science to analyze physical evidence in legal proceedings. Another name for a criminalist is a forensic scientist. 4. Demonstrate technique for recording fingerprints. Model the following steps for making fingerprints:
a. Using a No. 2 pencil, rub a small black patch of graphite onto a piece of paper.

Communicating Science: A Science Teaching Methods Course Session 2: Teaching and Learning
© 2010 by The Regents of the University of California
19
b. Rub your finger back and forth across the graphite. It’s important that the front of the finger, not the tip, be blackened. If only the tip is blackened the print will not include the “interesting” part of the fingerprint. The “interesting” part of the print can be seen by looking at the front of your finger. The area between the tip and the bend at the first knuckle has lines that swirl, loop, arch, or in some other way have a pattern. c. After your finger is blackened, use a piece of tape to “lift” the fingerprint directly from the finger. Place the bottom edge of the tape on the line of the first joint. (Make a simple drawing on the board that shows the tape going across the front of the finger.) d. Finally, place the tape on a clean part of the white scratch paper: The fingerprint can now be seen and examined.
5. Warn about not making fingerprints too dark. If the fingerprints are too dark, this makes them very difficult to read. One way to avoid this is to point out that the graphite mark on the scratch paper need not be too dark. Using the same graphite patch to print all fingers will help keep the prints from becoming too dark. Also, encourage participants to use paper towels to keep their fingers clean, which will keep the tape from getting smudged. 6. Make practice prints. Ask the participants to start by making a few practice prints. The goal is to let them practice until they can make clear prints. 7. Distribute materials. Distribute a pencil and a piece of scratch paper to each student and a tape dispenser to each group of students, and let them begin practicing. 8. Circulate between working groups. Go around the room and help, making sure that:
• the prints are coming from the front of the finger, not the tip,
• the tape is not wrinkled, and
• the fingerprints are not too dark.
Always examine the prints after the tape has been placed on the paper, as it is much easier to see them this way. When everyone can make clear prints, go to the next step. Making a Clean Set of Fingerprints 1. Introduce student sheet. Hold up a “Your Fingerprints” sheet and tell the participants to each make a set of very clean prints and stick them to their sheets. Show them how they can use either their right hand (palm down) or their left hand (palm up). Ask them to record on their sheet which hand they use.

Communicating Science: A Science Teaching Methods Course Session 2: Teaching and Learning
© 2010 by The Regents of the University of California
20
2. Begin making prints and recording. Distribute a “Your Fingerprints” sheet to each participant and have them get started. Encourage them to make the best set of prints possible. If someone “messes up,” it’s easy to start over. Just remove the print by peeling the tape off the paper. Circulate around the room as the they work, and help them make clear prints. 3. Participants examine their prints. Give magnifying lenses to people who finish early, and have them examine their prints carefully. When everyone is done, collect the fingerprint sheets. 4. Describe sessions. Explain to participants that ordinarily this would end one class session, and students would be told that in the next session they would have a chance to examine their fingerprints much more closely. For this course, you’ll just go ahead into the next activity, which is called “Classifying Fingerprints.” Students Create Their Own Fingerprint Classifications 1. Introduce ten fingerprints. Show the participants an envelope containing the ten fingerprints. Explain that each team will get a set of these ten prints. Tell them that they may use magnifying lenses to examine the prints more carefully. 2. Explore and describe prints. Have participants look at the ten fingerprint patterns and think of words to describe what they see. Distribute the packets of ten fingerprints and the magnifying lenses. Let participants have several minutes to examine the prints. Emphasize that it is important that students be given enough time to develop their own descriptive categories fro fingerprints. 3. Share discoveries. Ask participants to share words that describe the patterns of lines in the fingerprints. Record “descriptions” on the board. Accept and record all responses. Typical descriptions include: rainbow, bulls-eye, square, maze, coiled, dark, circular, swirling, wave, and tornado. The goal is to involve everyone in examining and describing the lines that make up a fingerprint. 4. Introduce grouping fingerprints. Explain that criminalists must be able to pick out one particular fingerprint out of thousands. To do this they have to find ways to group them. Ask participants to now sort the ten fingerprints into groups. They may choose to make as many or as few groups as they’d like. 5. Assist groups as needed. Walk around and encourage the participants. If a team has difficulty getting started, give them an example: If we wanted to sort all of the shoes in this room, we could do it in several ways. We could put all of the tie shoes in one pile, the buckle shoes in a different pile, and the slip-on shoes in a third pile. How else could we sort the shoes? [By color, by size, etc.]
Ask pairs why they grouped as they did. Typical responses include: “These are hills” “These are waves.” “These have waves over triangles,” “These are circles” and “This has little humps.” Encourage them to be imaginative.

Communicating Science: A Science Teaching Methods Course Session 2: Teaching and Learning
© 2010 by The Regents of the University of California
21
6. Discuss fingerprint groups. After everyone has sorted their prints, reconvene the group and ask, “Which prints did you group with print #1?” Write several groups’ responses on the board. Ask them to explain why they grouped a particular print with print #1. You can do this with all ten prints, depending on the level of interest and the time available. Introducing Standard Fingerprint Classification System
1. Introduce standard classification. Tell participants that criminalists have also devised a way to sort or classify fingerprints. Use the overhead and the transparency to show the three patterns to the whole class. 2. Define the three basic fingerprint types:
• arches have lines that start on one side, rise, and exit on the other side of the print
• loops have lines that enter and exit on the same side of the print
• whorls have circles that do not exit on either side of the print.
If possible, relate the “standard” categories to categories that the groups generated. (For instance: The “arch” group seems to be just a different name for what Steve and Lisa called their “rainbow” group.) 3. Explain that some prints might seem to fit in either of two groups. For example, a print might have some lines that start on one side and exit on the other side of the print (like an arch) and other lines that enter and exit on the same side of the print (like a loop). Tell them that they will need to decide whether most of the lines are like the lines in an arch or whether most of them are like the lines in a loop. Ask the participants if they have any questions.
Applying the Standard Classification
1. Participants classify prints. Ask the groups to now use the arch/loop/whorl system to classify the ten prints that they had previously classified on their own. Walk around the room and help, as needed.
2. Debrief classifications. After everyone has classified the fingerprints, go to the board and write the three headings, “arch,” “loop,” and “whorl.” Under these headings list the numbered prints by asking, “Which prints did you think were arches?” Write the responses on the board.
3. Discuss differences. After all of the responses are listed on the board, identify a number that’s listed under more than one heading. Lead a short discussion to decide in which category that print fits best. If there’s a lot of contention and the class can’t decide, ask if they think a new category needs to be invented. (It’s not only okay to struggle with the task of classifying hard-to-classify prints, but such discussions are important in developing their understanding of both the standard fingerprint classifications and the process of classifying. The goal is not to force everyone to agree on a particular categorization, but to clarify and refine the definitions of each category so it will be easier to classify individual prints.)

Communicating Science: A Science Teaching Methods Course Session 2: Teaching and Learning
© 2010 by The Regents of the University of California
22
IMPORTANT NOTE: Some of the fingerprints that do not fit easily into the three categories are sometimes put into a fourth category called “mixed.” An unusual fingerprint is included in the set of ten. Encourage them to grapple with this print using their own classifications and the standard system. If your participants find shortcomings in the system encourage them to suggest solutions. Go ahead and present the fourth category of “mixed” only after the group has considered all other options. Introducing this new category too early often results in students placing all hard-to-classify prints in it. If this becomes a problem, come up with a rule for when it’s okay to call a print “mixed.”
Finding Their Own Fingerprint Formulas
1. Participants classify their own prints. Now have individuals classify their own prints, using the standard classification system. Have them refer to the “Your Fingerprints” sheet they made in the first activity. Participants who finish quickly can double-check their classifications or help another person who is unsure. 2. Introduce fingerprint formulas. When everyone has finished, tell them that you’d like them to figure out their “fingerprint formulas.” A fingerprint formula is the list of print classifications for one hand, from thumb to pinkie. For example, a hand that has fingers of loop, arch, arch, whorl, loop, has a formula of l-a-a-w-l. Ask each person to write his or her fingerprint formula at the bottom of the “Your Fingerprints” sheet. 3. Explain how students share results. Tell participants that students would now trade data sheets with their teammates and check each other’s classifications. If the teammates disagree, they are encouraged to discuss their opinions with one another. APPLICATION Participants apply the phases of the learning cycle to the model lesson they have just experienced. Debriefing the Learning Cycle-Based Lesson (10 minutes) 1. Reflect on learning cycle structure in model lesson. Ask participants to note the stages of the learning cycle in the lesson you just presented. For example, the following is a suggested outline of the learning cycle stages of Fingerprinting.
Invitation: Questions to elicit interest and curiosity: “What are fingerprints?” “ What do you know about fingerprints?” Have you ever been fingerprinted?” Exploration: Students make their own fingerprints, look at them, notice patterns, then group and name them in their own way. Look at 10 new prints and categorize them. Concept Invention: The standard classification system (arch, loop, whorl) is introduced. Problem-Solving Challenge/Application: Students classify their own fingerprints using standard system.
Optional: students further apply what they’ve learned to a mystery scenario (“Who Robbed the Safe?”)

Communicating Science: A Science Teaching Methods Course Session 2: Teaching and Learning
© 2010 by The Regents of the University of California
23
2. Reiterate importance of encouraging invitation and exploration before concept invention. Explain that putting concept invention at the beginning of an activity tends to introduce information that children have not necessarily thought about and may not be interested in, and can steal the fun of discovering ideas for themselves. By opening an activity with an invitation and free exploration, youth can develop their own ideas, and it creates a much more learner-centered experience. 3. Contrast with typical science presentation. Point out that it is very common for science to be presented in a non-learning cycle-based way in the classroom. Often instructors choose to introduce science topics and content vocabulary before students have a chance to explore for themselves. There may not be adequate time allotted for students to discover science ideas on their own, or a teacher may instruct students to follow a procedure through which chosen concepts are merely demonstrated or verified. Explain that it can be easy to reformat “traditional” science activities to follow a more student-centered, learning cycle approach. 4. Reflect on their experience in today’s session. Point out that you could have started the lesson today by skipping the exploration and invitation phases and moving immediately to concept invention about the learning cycle. Ask them how their experience would have been different had the lesson begun with the introduction of the learning cycle without the station activities and discussion. 5. Explain how Learning Cycle can be used. Point out that the learning cycle approach can be an extremely valuable tool for designing educational activities and classroom lessons. When a lesson is ineffective, it’s often because concepts and vocabulary have been introduced before exploration. The learners aren’t interested yet, and have little context for the concepts. In some cases, students are given the opportunity to explore but not to engage in concept invention, which is a missed opportunity for them to try to make sense of their experience. Some otherwise great activities lack the opportunity for application, which can result in lessening the impact of the experience.
An internalized learning cycle model is an excellent lesson-planning tool—and it can also help guide the many on-the-spot decisions educators must make during instruction.
6. Emphasize that flexible use of the learning cycle model is the most effective. Close by emphasizing that the learning cycle model is not meant to be viewed in a mechanical or lockstep fashion. Remind participants that they will see as they present different science activities, that there is not always a complete learning sequence that applies in every situation. It is important to be flexible in applying the learning cycle, depending on the specific topic, the children’s experience level, and many other factors. Rather than a closed circle, it is more fitting to see the learning cycle as an ongoing, ever-spiraling process. Even as one question is investigated, many new questions arise. 7. Summarize goals for effective teaching. Display summary slide. Explain that effective teachers are aware of the advantages and limitations of different teaching approaches and use them accordingly. They are also aware that learners have different needs and preferences so they are careful to use a variety of approaches in the classroom. They also know that sequencing lessons using the Learning Cycle can help students to achieve deeper understanding of content.

Communicating Science: A Science Teaching Methods Course Session 2: Teaching and Learning
© 2010 by The Regents of the University of California
24
Presentation Slides Slide 1: Think About Your Own Learning Experiences Slide 2: Learning Cycle Slide 3: Session Summary

Communicating Science: A Science Teaching Methods Course Session 2: Teaching and Learning
© 2010 by The Regents of the University of California
25
Teaching and Learning Presentation Slide #1
Think about your own learning experiences…
• What are some teaching approaches or strategies that you are familiar with?
• What teaching approaches
do you respond best and worst to?

Communicating Science: A Science Teaching Methods Course Session 2: Teaching and Learning
© 2010 by The Regents of the University of California
26
Teaching and Learning Presentation Slide #2
The Learning Cycle
Invitation
Exploration Reflection
Concept Application Invention

Communicating Science: A Science Teaching Methods Course Session 2: Teaching and Learning
© 2010 by The Regents of the University of California
27
Teaching and Learning Presentation Slide #3
Session Summary
• Be aware of the advantages and
limitations of different teaching approaches and use them accordingly.
• Since learners can have different
preferences, use a balance of teaching approaches.
•• Sequencing lessons based on the
Learning Cycle can achieve deeper learning for students.

Communicating Science: A Science Teaching Methods Course Session 2: Teaching and Learning
© 2010 by The Regents of the University of California
28
Session Handouts
1. Chemistry Station signs 2. Chemistry Structured Activity handout 3. Chemistry Read and Answer handout 4. Learning Cycle Explained Handout

Communicating Science: A Science Teaching Methods Course Session 2: Teaching and Learning
© 2010 by The Regents of the University of California
29
Station A
Open-ended Investigation
Find out whatever you
can about these chemicals.

Communicating Science: A Science Teaching Methods Course Session 2: Teaching and Learning
© 2010 by The Regents of the University of California
30
Station B Structured Activity
Do the experiments and answer the questions on the
back.

Communicating Science: A Science Teaching Methods Course Session 2: Teaching and Learning
© 2010 by The Regents of the University of California
31
Station C Problem-Solving
Challenge
Using the chemicals provided, can you figure out
a way to make bubbles?
To make a color change?
To inflate a balloon?

Communicating Science: A Science Teaching Methods Course Session 2: Teaching and Learning
© 2010 by The Regents of the University of California
32
Station D Read and Answer
Read the
information sheet and answer the
questions.

Communicating Science: A Science Teaching Methods Course Session 2: Teaching and Learning
© 2010 by The Regents of the University of California
33
Station B - Structured Activity Do the experiments and then answer the questions on the back of the page. Experiment in Cup # 1
• use the graduated cylinder labeled “water” to measure 15 ml. water, and pour it into a cup. • measure 1 teaspoon of salt and add it to the water. • add 5 ml. phenol red using the graduated cylinder labeled “phenol red.”
Record your observations below.
• now use the graduated cylinder labeled “vinegar” to measure and add 15 ml. of vinegar to the same cup.
Record your observations below. Experiment in Cup # 2
• use the graduated cylinder labeled “water” to measure 15 ml. water, and pour it into another cup. • measure 1 teaspoon of baking soda and add it to the water. • add 5 ml. phenol red using the graduated cylinder labeled “phenol red.”
Record your observations below.
• now use the graduated cylinder labeled “vinegar” to measure and add 15 ml. of vinegar to the second cup.
Record your observations below.

Communicating Science: A Science Teaching Methods Course Session 2: Teaching and Learning
© 2010 by The Regents of the University of California
34
Questions Phenol red turns yellow when it comes in contact with an acid. Did you observe any evidence of an acid in your tests? Which of these chemicals (if any) do you think might be acids? When an acid is added to a carbonate, carbon dioxide gas bubbles are released. Did you observe any evidence of a carbonate in your tests? Which of these chemicals (if any) do you think might be carbonates?

Communicating Science: A Science Teaching Methods Course Session 2: Teaching and Learning
© 2010 by The Regents of the University of California
35
(Read and Answer sheet) Chemical Reactions In a chemical reaction, the original substances, reactants, are transformed into other substances, the products. This chemical change is frequently accompanied by changes in physical properties such as color or physical state and changes in energy such as evolution of heat. Many types of chemical reactions exist and there are several ways to classify them. One useful classification distinguishes chemical reactions by the physical state of one or more products. Reactions forming a gas are an important and commonly encountered class. The reaction of hydrochloric acid with sodium bicarbonate is an interesting example of a gas-forming reaction. In this reaction, hydrochloric acid (HCl) reacts with sodium bicarbonate (NaHCO3) to produce sodium chloride (NaCl), carbon dioxide (CO2), and water (H2O). Of the three products, only carbon dioxide is a gas and we can observe its formation by effervescence or bubbling of the resulting aqueous solution. The common name for sodium bicarbonate is baking soda. In addition to bicarbonate (HCO3
-) salts, the related carbonate (CO32-) salts are also commonly found in everyday life.
Sea shells, cement, limestone, marble, and chalk each contain bicarbonate or carbonate. The reaction between hydrochloric acid and sodium bicarbonate can be generalized. In fact, all bicarbonate and carbonate salts react with acids to produce carbon dioxide. There are many examples of this reaction occurring in everyday life, some useful and others harmful. In one useful application in cooking, we add baking powder to cake batter so that during baking bubbles of carbon dioxide are formed which make the cake rise. The reaction in that case is between tartaric acid and sodium bicarbonate and takes place when they are mixed with water. In the environment, a harmful effect of acid rain involves this gas-forming reaction. Acid rain, produced by fossil fuel combustion, often contains sulfuric acid. When acid rain contacts buildings made of limestone or cement and marble statues, the sulfuric acid damages them by dissolving away the carbonate materials. Questions:
(1) What happens when an acid reacts with a carbonate salt? (2) What elements are in all carbonates and bicarbonates? (3) Name two products formed when sulfuric acid reacts with a marble statue.
Communicating Science: A Science Teaching Methods Course Session 2: Teaching and Learning
© 2010 by The Regents of the University of California
36
Teaching and Learning Session Handout
Learning Cycle Explained Invitation
Reflection Exploration
Application
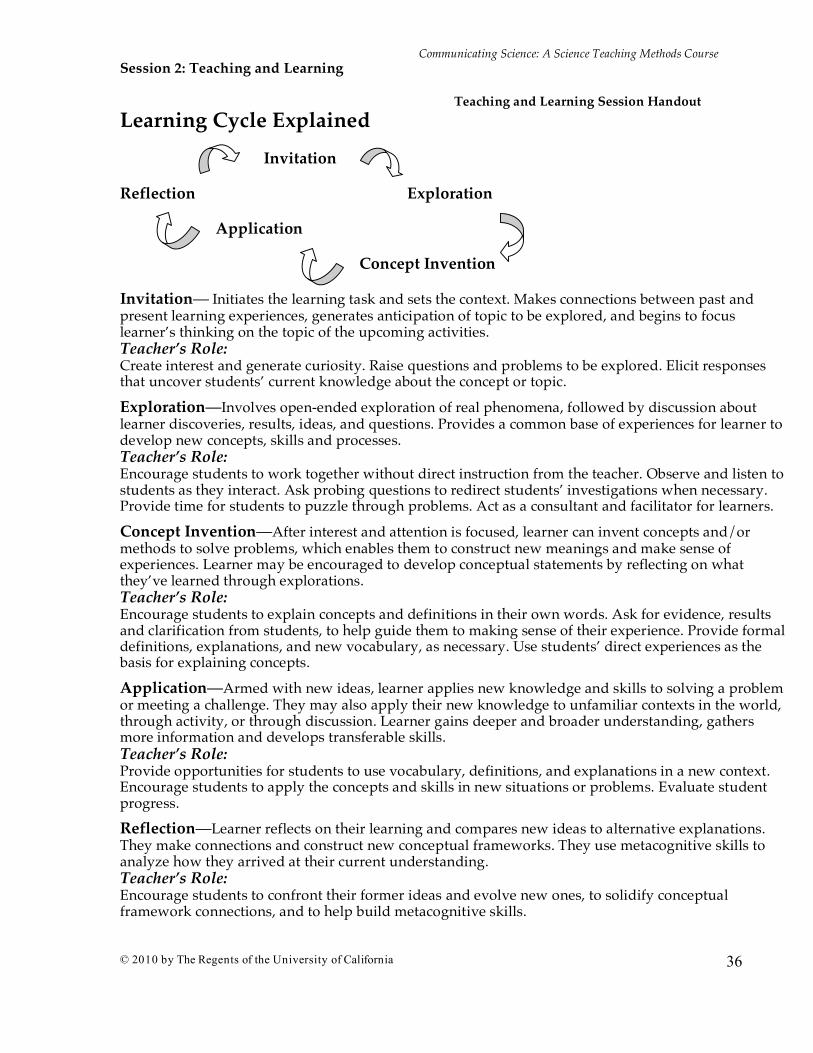
Concept Invention Invitation— Initiates the learning task and sets the context. Makes connections between past and present learning experiences, generates anticipation of topic to be explored, and begins to focus learner’s thinking on the topic of the upcoming activities. Teacher’s Role: Create interest and generate curiosity. Raise questions and problems to be explored. Elicit responses that uncover students’ current knowledge about the concept or topic.
Exploration—Involves open-ended exploration of real phenomena, followed by discussion about learner discoveries, results, ideas, and questions. Provides a common base of experiences for learner to develop new concepts, skills and processes. Teacher’s Role: Encourage students to work together without direct instruction from the teacher. Observe and listen to students as they interact. Ask probing questions to redirect students’ investigations when necessary. Provide time for students to puzzle through problems. Act as a consultant and facilitator for learners.
Concept Invention—After interest and attention is focused, learner can invent concepts and/or methods to solve problems, which enables them to construct new meanings and make sense of experiences. Learner may be encouraged to develop conceptual statements by reflecting on what they’ve learned through explorations. Teacher’s Role: Encourage students to explain concepts and definitions in their own words. Ask for evidence, results and clarification from students, to help guide them to making sense of their experience. Provide formal definitions, explanations, and new vocabulary, as necessary. Use students’ direct experiences as the basis for explaining concepts.
Application—Armed with new ideas, learner applies new knowledge and skills to solving a problem or meeting a challenge. They may also apply their new knowledge to unfamiliar contexts in the world, through activity, or through discussion. Learner gains deeper and broader understanding, gathers more information and develops transferable skills. Teacher’s Role: Provide opportunities for students to use vocabulary, definitions, and explanations in a new context. Encourage students to apply the concepts and skills in new situations or problems. Evaluate student progress.
Reflection—Learner reflects on their learning and compares new ideas to alternative explanations. They make connections and construct new conceptual frameworks. They use metacognitive skills to analyze how they arrived at their current understanding. Teacher’s Role: Encourage students to confront their former ideas and evolve new ones, to solidify conceptual framework connections, and to help build metacognitive skills.

Communicating Science: A Science Teaching Methods Course Session 2: Teaching and Learning
© 2010 by The Regents of the University of California
37
Masters Needed for the Fingerprints Activities “Your Fingerprints” “Fingerprint Patterns” “10 Fingerprints” “10 Fingerprints Key” “Suspects” “Safe with Prints” “Large Versions Fingerprints”


Communicating Science: A Science Teaching Methods Course Session 2: Teaching and Learning
© 2010 by The Regents of the University of California
38
Optional Activities
Physics Learning Stations Ice Cube Learning Stations Fingerprinting—Solving the Crime Sand on Stage Model Lesson

Communicating Science: A Science Teaching Methods Course Session 2: Teaching and Learning
© 2010 by The Regents of the University of California
39
Physics Learning Stations Materials Needed For the Cup & Card Stations For the workshop/all stations: cafeteria trays for materials For each participant: •� one copy of “Read and Answer” sheets (on pressure and volume) •� one copy of “The Learning Cycle” sheet (page XX) Station A: Open-Ended Exploration (materials for one station) 2 Erlenmeyer flasks, 250 and 500 ml 2 rigid plastic glasses 4-6 flexible plastic cups (squat Solo type) ~25 pennies 1 dish tub filled with water 4-6 plastic coated 3 x 5 cards 1 copy of Station A Instructions Station B: Structured Activity (materials for one station) 50 ml graduated cylinders 4-6 flexible plastic cups (squat Solo type) ~25 pennies 1 dish tub filled with water 4 plastic coated 3 x 5 cards 4-6 graduated cylinders (50 ml) 3 rulers 1 copy of Station B Instructions Station C: Problem-Solving Challenge/Application (for one station) 4-6 flexible plastic cups (squat Solo type) ~25 pennies 1 dish tub filled with water 4 plastic coated cards 50 ml dropper bottle of liquid soap (diluted) 4 graduated cylinders (50 ml) 1 copy of Station C Instructions Station D: Read & Answer Station (materials for one station) Reading excerpted from textbook on Pressure/Volume relationship

Communicating Science: A Science Teaching Methods Course Session 2: Teaching and Learning
© 2010 by The Regents of the University of California
40
Preparation for the Physics Stations:
1. Copy station signs. Make enough signs to have one for each station you are setting up. 2. Make copies for each participant and set aside:
— one copy of “Read and Answer” sheets — one copy of “The Learning Cycle” sheet
3. Make copies for each two participants:
— “Structured Activity” sheet for Station B
4. Make a wall chart list of station titles. Write the following list of the stations in large lettering on chart paper or a chalkboard to refer to throughout the session:
A - Open-ended Investigation B - Structured Activity C - Problem-Solving Challenge D - Read and Answer
Before participants go to the stations, demonstrate the Cup & Card phenomenon. Fill a solo cup halfway with water. Place a piece of plastic coated cardstock on top of the cup. While holding the card tightly against the cup, turn the cup upside down. Ask the participants what they think will happen when you remove your hand from the card. Do it—it will remain suspended. Tell them that they will be exploring this same phenomenon in different ways, at each of the stations you’ve prepared for them.

Communicating Science: A Science Teaching Methods Course Session 2: Teaching and Learning
© 2010 by The Regents of the University of California
41
Physics—Station Instructions Open-Ended Investigation Find out everything you can about the inverted cup with water and card shown below. Structured Activity Follow the instructions on the “Exploring Pressure “activity sheet and answer the questions. Problem-Solving Challenge Design an experiment that explains why the card remains suspended upon inverting the cup with water. Read & Answer Read the text provided and answer the questions that follow.

Communicating Science: A Science Teaching Methods Course Session 2: Teaching and Learning
© 2010 by The Regents of the University of California
42
Physics - Structured Activity Handout Exploring Pressure Procedure: 1. Measure 200 ml of water and add into a cup. 2. Add 5 pennies to the cup with water. 3. Place a card on top of the cup and invert the cup while holding
the card in place. Release the card. Task: Add more pennies to the cup to try to find the maximum number of pennies that the card will support (along with 200 ml of water). Make sure to count the number of pennies that can be added until the card no longer stays up. Total number of pennies added to cup = _________ 4. Using the data from the previous task, along with following information, !de !t!e !r!m !i !n!e ! !t !h!e ! !maximum p!r!e !s !s !u !r!e ! supported by the card for 200ml of water and the total number of pennies added. ! PT! (total pressure) != ! � ! ( !pressure from pennies + pressure from water!) ! Pressure is determined by the amount of force per unit area :
P (pressure) = F/A so, PT = force from pennies/area of cup opening
+ force from water/area of cup opening The downward force of an object is determined by its mass and the acceleration due to gravity:
F! != ! !m!g. ! ! ! ! ! ! ! !( !g! != ! !9!. !8! !m !/ !s !e !c !, !the mass of !o!n!e ! !p!e !n!n!y! !is !2!. !5! !g, the mass of 1 ml water is 1g!) ! !! The area of a circle is A! != ! � !r!2!
! Total pressure supported by the card = __________ 5. What is the difference between the downward pressure exerted by the pennies & water and the external air pressure?

Communicating Science: A Science Teaching Methods Course Session 2: Teaching and Learning
© 2010 by The Regents of the University of California
43
Physics - Read and Answer handout
Gas Behavior: Pressure and Volume A gas is a collection of particles that move independently and fill a volume containing mostly empty space. Of the three physical states of matter, gases are the only state that has indefinite shape and volume. A gas can fill a container of any shape and expand or compress to different volumes. Under ideal conditions, the behavior of gases can be predicted since a small set of physical properties describe a gas. These four properties or variables of a gas are: pressure, temperature, volume, and amount (or number of moles). In fact, these four variables can be combined into one law describing a gas, the Ideal Gas Law. If two of these variables are held constant, the relationship between the other two is easily discerned. With a constant amount of gas and temperature, the pressure (P) and volume (V) have a well-defined relationship. If a fixed amount of gas is held at constant temperature, the volume is inversely proportional to the pressure. This is Boyle’s Law. Stated mathematically:
PV = constant or at constant amount and temperature
V = constant/P
In other words, if the pressure of a gas is doubled, the volume is halved. Robert Boyle derived this law from pressure and volume measurements on gases. Boyle first performed these quantitative experiments in 1661. Using a J-shaped tube sealed at one end, he added liquid mercury to the open end until the mercury level was the same on both sides of the J. The enclosed gas was then at atmospheric pressure (1 atm or 760 mm Hg). Addition of 760 mm of Hg to the open end doubled the pressure, and the volume of the enclosed gas decreased by half. Another addition of 760 mm Hg, tripling the pressure from the original pressure, decreased the gas volume to one-third of the original volume. From his results, Boyle concluded that in general the volume of a gas was inversely proportional to the pressure—Boyle’s Law.
Questions:
(1) Two properties of a gas are indefinite shape and volume. Give an example that demonstrates each. (2) State Boyle’s Law. Be specific about the variables held constant. (3) In Boyle’s experiments with the J-shaped tube, determine the pressure of the enclosed gas when the volume was one-third of the original volume.

Communicating Science: A Science Teaching Methods Course Session 2: Teaching and Learning
© 2010 by The Regents of the University of California
44
Ice Cube Learning Stations
Materials Needed For the Ice Cube Activity Stations (The materials here are for approximately 20 participants with one set-up of each of the four stations with up to 5 participants per station.)
For the session/all stations: ❑ 4 cafeteria trays (or cookie sheets) to carry station materials
For each participant:
❑ one copy of “Read and Answer” sheets for Station B ❑ one copy of “Structured Activity” sheet for Station D
❑ one copy of “The Learning Cycle” sheet ❑ one copy of “Mystery Water – What Happened and Why” sheet
For the entire group:
ice cubes 3 pitchers of tap water 3 pitcher of salt water paper towels kosher salt stir stick or spoon
For Station A, Open-Ended Investigation (materials needed to set up one station):
2 identical approx. 12 ounce clear containers (plastic cups or beakers)
1 large sheet of paper (a piece of flip chart paper works well)
food coloring (any dark color – red, blue, dark green, not yellow)
small plastic bag or bowl to contain ice cubes 1 sponge small tub to dispose of used water small plastic bag containing kosher salt spoon (to use with the salt) pitcher of fresh water (labeled “fresh water”) pitcher of salt water (labeled “salt water” and prepared the
day before) 1 copy of the Station A sign 1 copy of Station A directions 2 thermometers miscellaneous “sink and float” objects including marbles,
blocks, crayons, paperclips

Communicating Science: A Science Teaching Methods Course Session 2: Teaching and Learning
© 2010 by The Regents of the University of California
45
For Station B, Structured Activity (materials needed to set up one station):
2 identical approx. 12 ounce clear containers (plastic cups or beakers); one labeled “salt water,” the other labeled “fresh water.”
1 large sheet of paper (a piece of flip chart paper works well)
food coloring (any dark color – red, blue, dark green, not yellow)
small plastic bag or bowl to contain ice cubes 1 sponge small tub to dispose of used water pitcher of fresh water (labeled “fresh water”) pitcher of salt water (labeled “salt water” and prepared the
day before) 1 copy for each participant of the Station B instructions 1 copy of the Station B sign
For Station C, challenge/application (materials needed to set up one station):
2 identical approx. 12 ounce clear containers (plastic cups or beakers)
1 large sheet of paper (a piece of flip chart paper works well)
food coloring (any dark color – red, blue, dark green, not yellow)
small plastic bag or bowl to contain ice cubes 1 sponge small tub to dispose of used water 1 pitcher fresh water (labeled A; otherwise unlabeled) 1 pitcher salt water (labeled B; otherwise unlabeled) 2 thermometers miscellaneous “sink and float” objects including marbles,
blocks, crayons, paperclips 1 copy of Station C directions 1 copy of the Station C sign
For Station D, Read & Answer:
1 copy for each participant of the “Read and Answer” sheets
1 copy of the Station D sign

Communicating Science: A Science Teaching Methods Course Session 2: Teaching and Learning
© 2010 by The Regents of the University of California
46
Preparation Before the Session
Ice Cube Activity Stations:
1. Copy station signs. Make enough signs to have one for each station you are setting up. You might want to laminate the station signs because they are likely to get wet. 2. Make copies for each participant and set aside:
❑ one copy of “Structured Activity” sheet ❑ one copy of “Read and Answer” sheets ❑ one copy of The Learning Cycle and the Sand Activity ❑ one copy of “The Learning Cycle” sheet ❑ one copy of “Mystery Water – What Happened and Why” sheet
3. Make a wall chart list of station titles. Write the following list of the stations in large lettering on chart paper or a chalkboard to refer to throughout the session:
A — Open-ended Exploration B — Structured Activity C — Problem-Solving Challenge/Application D — Read and Answer
4. Prepare salt water solution: Add 11 tablespoons of kosher salt to 1 gallon of fresh water. Allow the solution to sit until water is no longer turbid. Use this solution for all stations of the activity. This makes a solution of about 40 ppm (a salinity that ensures that food coloring density isn’t a factor in the saltwater part of the experiment and makes the visual impact more dramatic.)
Preparation on the Day of the Session Set up the stations Set up the four stations by putting the materials (described under “What You Need” above) on a tray, with the instructions for that station. You will need to set up duplicate sets of these stations if you have more than 20 participants. The four stations are: Open-Ended Investigation; Structured Activity; Problem-Solving Challenge/Application; and Read and Answer.

Communicating Science: A Science Teaching Methods Course Session 2: Teaching and Learning
© 2010 by The Regents of the University of California
47
Teaching and Learning Session Handout
Station A Open-ended Investigation
Examine the materials on the tray. Using only those materials, devise investigations you can perform to learn as much as you can about: • the characteristics of warmer vs. cooler water. • the characteristics of salty vs. fresh water. • the relative densities of different temperatures
and salinities of water. • density-driven currents in the ocean.
And remember, this is a science classroom—no tasting!

Communicating Science: A Science Teaching Methods Course Session 2: Teaching and Learning
© 2010 by The Regents of the University of California
48
Teaching and Learning Session Handout
Station B Structured Activity
Follow the procedures described on the worksheet provided. You may work as a group to conduct the activity and to arrive at your answers.

Communicating Science: A Science Teaching Methods Course Session 2: Teaching and Learning
© 2010 by The Regents of the University of California
49
Teaching and Learning Session Handout
Instructions and Worksheet for Station B – Structured Activity
1. Find two cups of water on the table. One is labeled “salt water,” the other is labeled “fresh water.”
2. If you place the same number of ice cubes in each cup at the same
time, which do you predict will melt the fastest? ____________________________________________________________
Why?_______________________________________________________ ________________________________________________________________________________________________________________.
3. Now place two ice cubes in each cup of water. Observe both cups for
90 seconds. Do not stir or disturb the ice cubes or take them out of the water. Allow them to continue to melt in the cup as you complete this station.
4. Observe the ice cubes in the cup. Which ice cubes melted the fastest?
(Look from the side and from the top of the cup.) ________________________________________________________
5. Do you have any further explanation to match your evidence?
________________________________________________________________________________________________________________________________________________________________________.
6. Gently add 2 drops of food coloring to each cup right on top of the
ice cube without stirring or otherwise disturbing the water. Describe your observations. ________________________________________________________ ___________________________________________________________________________________________________________________________________________________
7. Explain what you think is happening.
_______________________________________________________ ________________________________________________________________________________________________________________________________________________________________________.

Communicating Science: A Science Teaching Methods Course Session 2: Teaching and Learning
© 2010 by The Regents of the University of California
50
Teaching and Learning Session Handout
Station C Problem-Solving
Challenge
There are two beakers of water on the table. One contains salt water, the other fresh water. Using only the materials at the table, devise an investigation that you can perform right now to find out which is the salt water. Record your experiment (design, procedures) and the results. Describe the evidence that you collect and how it supports your determination of which is the salt water. Oh, and by the way, no tasting allowed!

Communicating Science: A Science Teaching Methods Course Session 2: Teaching and Learning
© 2010 by The Regents of the University of California
51
Teaching and Learning Session Handout
Station D Read and Answer
Read the information sheet and answer the questions.

Communicating Science: A Science Teaching Methods Course Session 2: Teaching and Learning
© 2010 by The Regents of the University of California
52
Teaching and Learning Session Handout
Reading for Station D Water Density, Ocean Stratification and Density-Driven Circulation Density is a property of all substances and is the ratio of the mass of a substance to its
volume: density = mass / volume. In aquatic systems water density plays an important role in
structuring the environment and in determining how water moves. Pure Water
By definition, the density of pure water at 4oC is 1 gram per cubic centimeter (cm3 ;
note: 1 cm3 = 1 ml). Most substances become more dense as they cool, but water is unusual in
this respect. The density of water increases as it cools down to 4oC (3.98oC, to be exact), but
then, as cooling continues, the density of water decreases as the molecules form a rigid
framework and the hydrogen bonds between water molecules cause the liquid to expand slightly.
When water crystallizes into ice at 0oC, its density decreases abruptly. Ice is less dense than an
equal volume of water. As ice cools below 0oC its density increases, but no matter how cold ice
becomes its density never reaches the density of liquid water. Since ice is less dense than water,
ice “freezes over” as a floating layer instead of “freezing under” or freezing from the bottom like
almost all other liquids.
Seawater Seawater is a solution of pure water and dissolved materials. A liter of seawater weighs
between 2% and 3% more than a liter of pure water. Most of materials dissolved in seawater are
ions (positively or negatively charged atoms and molecules) that combine into salts when the
water is evaporated. Salinity is the total grams of salts in 1,000 grams of seawater, and salinity is
commonly expressed in terms of parts (of salts) per thousand (parts of seawater). For example,
ocean water which has 35 g of salts dissolved in 1000 g of seawater has a salinity 35 parts per
thousand or 35o/oo. (Note: Scientists now express salinity as a conductivity ratio using the
Practical Salinity Scale, but this change does not need to be considered in this discussion of
salinity and water density.)

Communicating Science: A Science Teaching Methods Course Session 2: Teaching and Learning
© 2010 by The Regents of the University of California
53
Ocean Stratification and Density-driven Circulation Ocean water tends to form into stable layers with the least dense water at the surface and
the most dense water on the bottom. This phenomenon is called density stratification. In the
open ocean, salinity does not vary to a great extent, and density stratification is determined
primarily by temperature. In coastal areas and bays, in contrast, salinity can vary significantly
due to inputs of freshwater from rivers and land run-off, and density stratification may be
determined primarily by salinity. The greater the difference in density between the surface and
bottom waters the more stable the water column is and the harder it is to mix surface water down
to depth or deep water up to the surface.
Density differences between water masses drive deep-ocean currents. In some regions of
the ocean dense water masses form at the surface (e.g. polar regions like the Norwegian Sea and
Weddell Sea, or enclosed regions like the Mediterranean Sea). These dense water masses sink
and displace less dense water underneath. This density-driven circulation is called thermohaline
circulation (“therme” = heat; “halos” = salt). Virtually the entire world ocean is involved in
thermohaline circulation, a slow process that is responsible for most of the vertical movement of
water in the ocean and for the circulation of the world ocean as a whole.
--------------------

Communicating Science: A Science Teaching Methods Course Session 2: Teaching and Learning
© 2010 by The Regents of the University of California
54
Teaching and Learning Session Handout
Worksheet for Station D: Questions to Answer on “Water Density, Ocean Stratification, and Density-Driven Circulation”
Answer these Questions:
1. What is density?
2. What factor(s) affect the density of pure water? How does the density of pure water vary with
each factor you have listed?
3. What factor(s) affect the density of seawater? What is the relationship between seawater
density and each factor you have listed?
4. What is density stratification in the ocean? How might density stratification affect organisms
in the ocean?
5. What is thermohaline circulation? How might thermohaline circulation affect organisms in
the ocean?

Communicating Science: A Science Teaching Methods Course Session 2: Teaching and Learning
© 2010 by The Regents of the University of California
55
Use Fig. 2 (in the reading) to solve these problems: 6. DATA (these measurements were made in the vicinity of the Straits of Gibraltar)
Temperature (oC) Salinity (o/oo) Density (g/cm3) Mediterranean Sea 18 39 ______ Atlantic Ocean 20 36 ______ a. Determine the densities of Mediterranean Sea water and Atlantic Ocean water.
b. How will water from the Mediterranean Sea behave when it flows into the Atlantic Ocean at the Straits of Gibraltar?
7. DATA
Temperature (oC) Salinity (o/oo) Density (g/cm3) Yukon River (AK) 4 ______ ______ Bering Sea 9 33 ______
a. Determine the densities of Yukon River water and Bering Sea water. What assumptions (if any) do you have to make?
b. How will water from the Yukon River behave when it flows into the Bering Sea? 8. Can you think of any factors in addition to temperature and salinity that might affect the density of seawater?
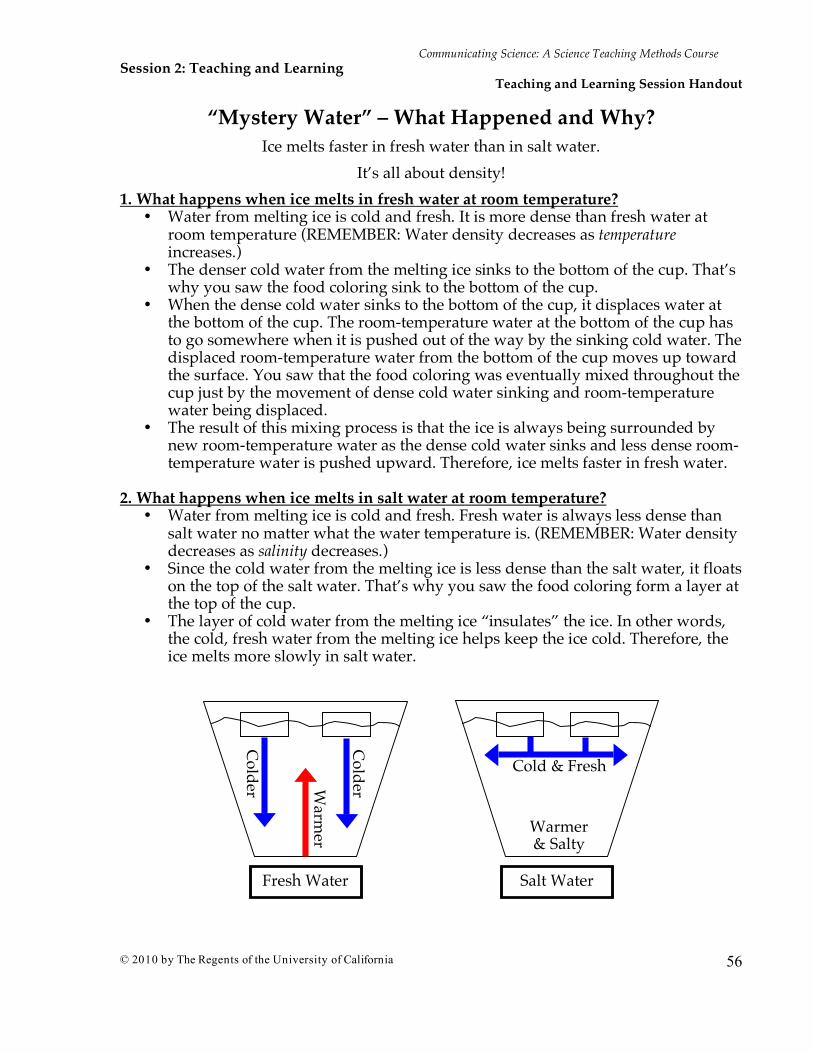
Communicating Science: A Science Teaching Methods Course Session 2: Teaching and Learning
© 2010 by The Regents of the University of California
56
Teaching and Learning Session Handout
“Mystery Water” – What Happened and Why?
Ice melts faster in fresh water than in salt water.
It’s all about density!
1. What happens when ice melts in fresh water at room temperature? • Water from melting ice is cold and fresh. It is more dense than fresh water at
room temperature (REMEMBER: Water density decreases as temperature increases.)
• The denser cold water from the melting ice sinks to the bottom of the cup. That’s why you saw the food coloring sink to the bottom of the cup.
• When the dense cold water sinks to the bottom of the cup, it displaces water at the bottom of the cup. The room-temperature water at the bottom of the cup has to go somewhere when it is pushed out of the way by the sinking cold water. The displaced room-temperature water from the bottom of the cup moves up toward the surface. You saw that the food coloring was eventually mixed throughout the cup just by the movement of dense cold water sinking and room-temperature water being displaced.
• The result of this mixing process is that the ice is always being surrounded by new room-temperature water as the dense cold water sinks and less dense room-temperature water is pushed upward. Therefore, ice melts faster in fresh water.
2. What happens when ice melts in salt water at room temperature?
• Water from melting ice is cold and fresh. Fresh water is always less dense than salt water no matter what the water temperature is. (REMEMBER: Water density decreases as salinity decreases.)
• Since the cold water from the melting ice is less dense than the salt water, it floats on the top of the salt water. That’s why you saw the food coloring form a layer at the top of the cup.
• The layer of cold water from the melting ice “insulates” the ice. In other words, the cold, fresh water from the melting ice helps keep the ice cold. Therefore, the ice melts more slowly in salt water.
warm
er
Colder Warm
er
Cold & Fresh
Warmer & Salty
Fresh Water Salt Water
Colder

Communicating Science: A Science Teaching Methods Course Session 2: Teaching and Learning
© 2010 by The Regents of the University of California
57
Fingerprinting— Solving the Crime
The students solve a mystery by using the standard classification system they’ve just learned. They are given the suspect’s fingerprints, the formula of the fingerprints found at the scene of the crime, and copies of the actual prints.
What You Need For each student: “Suspects” student sheet (master included following page 36) “ Safe with Prints” (master included following page 36) 1 pencil 1 magnifying lens Who Robbed the Safe? 1. Tell the students to imagine that a crime has been committed. It’s time to use what they have learned about fingerprints to try to solve the crime. Explain that a safe has been robbed. The safe is in the office of the president of a big company, and was found early this morning open and empty. The theft was discovered by the night security guard. The guard called the police immediately. There are five suspects: • Barbie Brilliant, the president of the company, is in debt, owing money to many people. • Stewart Starr, the vice-president, has been trying to take over control of the company. • Peter Page, the secretary, was recently fired unfairly. He left without returning the keys to the building. • Ned Numbers, the accountant, has three cars, a big house, and lives very luxuriously. • Carla Clean, the janitor, was recently injured on the job and wasn’t given any days off to recuperate. She is very angry about this. 2. Hold up a copy of the “Suspects” sheet. Tell students that these are the fingerprints of the suspects’ right hands. The fingerprints found on the safe were from a right hand. Explain that when the police first investigate evidence, they narrow down the number of suspects by comparing the suspects’ fingerprint formulas to the formula of prints found as evidence. 3. Tell your students that their first task will be to find the fingerprint formulas of the five suspects. You will give them the formula of the prints found on the safe after they have figured out the fingerprint formula of each suspect. This serves as a review and practice of the standard classification system. There are examples of the categories at the top of the data sheet, for those students who have forgotten what they look like. [Two of the formulas match the fingerprint formula on the safe.]

Communicating Science: A Science Teaching Methods Course Session 2: Teaching and Learning
© 2010 by The Regents of the University of California
58
4. Distribute a “Suspects” sheet to each student and have them begin. Answer questions about the classifications and help students determine the fingerprint formulas. 5. After all the students have figured out the suspects’ fingerprint formulas, reveal the fingerprint formula of the prints found on the safe: l-a-l-w-l (thumb to pinkie), or loop, arch, loop, whorl, loop. 6. Let students speculate on “who done it.” Ask which suspects they can now eliminate, based on this evidence. 7. Now distribute the “Safe with Prints” sheet. 8. Ask the students to decide whose prints are on the safe. (They will be making a one-to-one comparison of the prints and will probably be able to do this very quickly.) Ask students who finish early to determine whether they have the same fingerprint formula as the one that appeared on the safe. Discussing the Evidence 1. Ask students to tell you which of the suspects has prints that match those on the safe. Also ask them to give you reasons why they think that the others do not match. Encourage very specific answers. Some teachers have had their students write a description of the evidence and what led them to think it was a certain suspect’s prints on the safe. 2. After the students have decided whose prints are on the safe, ask whether or not these prints might normally be on the safe, or if finding the prints proves that the suspect they identified robbed the safe. One of the goals of this series of activities is to let students gather evidence and draw conclusions from the evidence. Who actually robbed the safe is less important than the process your students use to arrive at their conclusions. (By the way, it was the accountant’s prints that were found on the safe, but we still don’t know who robbed the safe. While the accountant may have needed the money, there are lots of legitimate reasons why his fingerprints might be on the safe!)
3. Ask the students if there are any other techniques they can think of that they, as detectives, could use to help solve this crime.

Communicating Science: A Science Teaching Methods Course Session 2: Teaching and Learning
© 2010 by The Regents of the University of California
59
Sand On Stage Model Lesson
Modeling a Learning Cycle-Based Lesson
Note: Following are instructions for presenting a portion of the MARE/GEMS activity Sand on Stage (from the GEMS teacher’s guide On Sandy Shores). Be sure to give enough time for your students to experience at least a sense of what elementary students would experience in classroom presentation, and to get a feel for the overall flow of the lesson, but keep in mind the 40-minute time frame for the activity. It’s okay to abbreviate and shortcut certain portions, once the participants understand what’s intended to happen with students. Start the Model Lesson Tell participants you’ll be presenting a lesson that embodies the learning cycle. At the conclusion of the lesson, you’d like them to share their ideas of how the different phases of the learning cycle relate to this lesson. Introducing the Activity 1. Lead participants in a short discussion of sand by asking: • “Where are some of the places you can find sand?” • “What are some ways we can use sand?” • “How might sand be made?” • “How does sand get onto the beach?”
2. Tell your students that they will become sand scientists (arenologists) in this unit to see if they can learn something about sand by making some close observations. To do this, they will first need to select a sand to learn more about and make a sand sample. 1. Show the students how to make a sand sample:
a. Choose a small ziplock bag of sand. b. Select an index card and place a quarter-sized smear of white glue in the center of the card. If the chosen sand is dark in color, choose a white card. If the sand is light in color, choose a colored card. c. Carefully open the ziplock bag of sand and sprinkle a pinch or two of sand onto the glue. Completely close the ziplock bag when finished. d. Finally, write the location of your sand below your sand sample on the card. Be careful not to smear your still-wet sand sample.

Communicating Science: A Science Teaching Methods Course Session 2: Teaching and Learning
© 2010 by The Regents of the University of California
60
2. Pass out Sand on Stage datasheets to each student (see master following page 63)
3. Inform students that they will each be exploring and learning more about the sand of which they just made a sample.
Making Observations 1. Give each student a Sand on Stage data sheet. Have them take a close look at their own sand sample with a hand lens, and write down or show with colored crayons or markers all the different individual colors that they see. Note: Your college students will be able to go through the activities on their own with simple directions from the teacher. With younger students, going through the student sheet together with the teacher asking guiding questions will help students to work together and complete each observation task successfully. 2. Have students pass their own card to the person on their right and look at the sample the person on their left passes to them. Encourage students to especially notice the colors of the different sands. Have them keep passing the cards around the circle, looking at each, until they have their own card back. What are some reasons for sand being different colors? (dark sands are often volcanic in origin, light sands can be made of shells, corals or of quartz from granite mountains.) 3. Have each team categorize their sands into color groups of their own choosing Are there some samples which are difficult to categorize? Why? 4. Now, have each group sequence the samples in a line on their table from darkest to lightest and record their results on their worksheets. 5. The next few tasks take some extra concentration, so tell students to help their fellow team mates. Have students look again at their slide through a hand lens (or a microscope). This time look specifically at the shape of individual grains. Have students draw several large examples of the exact shape of their grains on their worksheet. Why are some grains smooth and others bumpy? (Very round grains have been worn smooth for hundreds or thousands of years, while angular grains may have broken off a rock or shell quite recently.) Have students compare their grains to those shown on their worksheet. Is their sand smooth (very old) or angular (very young?) 6. Have each group sequence their sand cards again, this time from the smallest grains to the largest grains. Have them record their results on the worksheet. Students can now measure the size of their grains by comparing them to the size chart. Have them record their findings.

Communicating Science: A Science Teaching Methods Course Session 2: Teaching and Learning
© 2010 by The Regents of the University of California
61
7. Ask the students to imagine they are a very tiny sand grain, about the size of the smallest grain in their group’s samples. What might happen to them if they were hit by a large wave or were in a fast rushing river? Do they think they would be able to stay in one place? What about if they were one of the larger grains? [They might stay put because they are heavier.] What could the size of the sand grain tell you about the kind of place your sand sample was from? [If their grains are very small, they were probably from an area with slow moving water such as a protected bay beach or a pool in a slow moving stream. Tiny particles can stay put only where the water is moving slowly and gently. Large waves or fast water pick up small grains and carry them away down the river or off the beach and out to the ocean. If their sand has mainly large grains, it was probably from a wave-tossed beach where the rough water carried all the smaller grains away. Only the larger grains were not picked up by the waves.] 8. Have students drag a magnet along the outside of their sand sample bag. Are any grains moving inside the bag? If so, this is evidence that the sand contains some magnetic minerals, such as iron or magnetite. What color is the magnetic sand? Students record their results. 9. What are the sand grains made of? small rocks? shells? wood? glass? plant material? How do they get broken up into tiny sand grains? 10. Give each group a rock and/or mineral kit. Have students compare their sand grains to the kit. Can they make any guesses about what types of rocks or minerals could have been broken down to become their sand? 11. Explain that sand is almost always in constant motion, and that the sand grains on a beach one day, might be entirely replaced by others in a few weeks. One way that sand moves is by the wind. Place a little sand in a tray, box lid, or shoe box and give each student a chance to gently blow on it for five seconds or so. The wind blows almost all the time at the beach. What effect does this have on beach and dune sand? [The “wind” separates or sorts the small grains from the larger ones.] 12. Have students look at their own sand sample now. If all the grains are roughly the same size, they may have come from a windy beach. If the sample is “mixed” in size, then it may have been from a beach with very little wind. Can they make a guess about whether or not their sand came from a windy place?
The Experts Meet 1. Now have students with the same type of sand meet together in "expert groups." They can compare their answers on their student sheets and discuss any discrepancies. 2. As they finish, ask them to imagine the beach their sand came from. What does it look like? Is it a sunny warm place with tropical animals or a cold one? Where did the sand come from? A coral reef? A mountain? A lava flow? Clam and mussel shells? Is the sand very old or very young? What evidence do they have for each inference?

Communicating Science: A Science Teaching Methods Course Session 2: Teaching and Learning
© 2010 by The Regents of the University of California
62
3. If appropriate, have each student in the new teams complete the Expert Team student sheet (masters following page 63). 4. Have students each draw a picture of what their beach looks like. Have them label their drawings with the name of where the sand came from. Post the student art around the room next to the sand sample it illustrates. Students can present to the class their drawings and evidence. 5. Discuss with students why sand is important to people. It creates fun and beautiful places for us to walk and play. It is an important home to many, many plants and animals. Many things that we use are made from sand. What are some items made from sand? (It is important for oil and cement production. Glass is made from melted and reformed sand. Sand is used for sandblasting, sandpaper, and of course, in playgrounds and sandboxes.) If it wasn't for sand, we might not have paved streets, tall buildings, concrete sidewalks or glass windows. 6. Hold up the Key Concepts for one or more students to read aloud. Post it near your sand table or sand display for students to refer to later.
• Sand grains can be made of animals, plants, rocks, or minerals. • Sand grains come in many different shapes, sizes, and colors. • Differences between sand grains can be clues about where the sand came from
and how it got to the beach. Debriefing the Learning Cycle-Based Lesson 1. Ask participants to note the stages of the learning cycle in the lesson just presented. Following is a suggested outline of the learning cycle stages of Sand on Stage.
Invitation: Questions to elicit interest and curiosity: “What is sand?” “Where can sand be found?” “How might sand be made?”
Exploration: Students make their own sand samples, look at them, notice similarities and differences, then group and answer specific questions based on observations and evidence.
Concept Introduction: The process of erosion and transport is introduced.
Problem-Solving Challenge/Application: Students meet as “experts” to explore their sand further. Students make inferences based on evidence to depict their sands origin.

Communicating Science: A Science Teaching Methods Course Session 2: Teaching and Learning
© 2010 by The Regents of the University of California
63
Masters Needed for Sand on Stage Activity Sand on Stage! student sheet (2 pages) Expert Group student sheet (2 pages)


