tb care i indonesia year 3 annual reportcmsfocus.net/cpanel/knc62f7/images/xplod/report/tb care i...
TRANSCRIPT

TB CARE I - Indonesia
Year 3
Annual Report
Period
October 1, 2012 –September 30, 2013
November 7, 2013

2
Table of Contents
Executive Summary ............................................................................................................... 4
Introduction .......................................................................................................................... 9
Core Indicators ..................................................................................................................... 11
Summary of Project Indicators ................................................................................................ 12
1. Universal and Early Access .............................................................................................. 28
2. Laboratory Strengthening ................................................................................................ 31
3. Infection Control ............................................................................................................ 35
4. Programmatic Management of Drug Resistant TB (PMDT) ..................................................... 35
5. TB/HIV ......................................................................................................................... 39
6. Health System Strengthening (HSS) ................................................................................. 40
7. Monitoring & Evaluation, Surveillance and OR ..................................................................... 42
8. Drug supply and management ......................................................................................... 44

3
List of Abbreviations
APA Annual Plan of Activity ART Anti Retroviral Therapy ATS American Thoracic Society BBLK Balai Besar Laboratorium Kesehatan (Grand Office of Health Laboratory) BLK Balai Laboratorium Kesehatan (Office of Health Laboratory) BPOM Badan Pengawas Obat dan Makanan (Food and Drug Administration) BPPM Bina Pelayanan Penunjang Medik (Medical Laboratory Support Services) BSC Biological Safety Cabinet C/DST Culture/Drug Sensitivity Test CCM Country Coordinating Mechanism CPT Co-trimoxazole Prevention Therapy Ditjenpas Direktorat Jenderal Pemasyarakatan (Directorate of Correctional Services) DOTS Direct Observed Treatment - Short Course EQA External Quality Assurance FHI 360 Family Health International 360 FLD First Line Drug GF Global Fund HCW Health Care Worker HIV Human Immunodeficiency Virus HRD Human Resource Department IC Infection Control INH Isoniazide IPT Isoniazide Prevention Therapy JATA Japan Anti Tuberculosis Association KARS Komite Akreditasi Rumah Sakit (National Committee of Hospital Accreditation) LQAS Lot Quality Assurance Sampling System M&E Monitoring and Evaluation MDR Multi Drug Resistant MIFA Management Information for Action MoH Ministry of Health MSH Management of Science for Health NAD Nangroe Aceh Darussalam NAP National AIDS Program NRL National Reference Laboratory NTP National Tuberculosis Program OJT On the Job Training OR Operational Research PLHIV People Living with HIV PMDT Programmatic Management of Drug Resistant Tuberculosis PPM Public Private Mix Puskesmas Pusat Kesehatan Masyarakat (Public Health Center) QA Quality Assurance SITT Sistem Informasi Tuberkulosis Terpadu (Integrated Tuberculosis Information SLD Second Line Drug SOP Standard Operating Procedure SRL Supranational Reference Laboratory SSF Single Stream Funding TA Technical Assistance TB Tuberculosis UGM Universitas Gadjah Mada UI University of Indonesia USAID U.S. Agency for International Development WHO World Health Organization

4
Executive Summary In APA3 TB CARE I has successfully provided technical assistance and operational support to the Indonesia National Tuberculosis Program (NTP) at national, provincial, district and health facilities level. This support was complementary to Global Fund Single Stream Funding. Buy in for APA3 was 9.300.000 million US dollars and the total available amount (including APA2 carry-over) was US$ 12.984.000. Support focused on 10 out of 33 provinces, covering a population of more than 155 million, which is around 65% of the total population of Indonesia. Led by KNCV Tuberculosis Foundation (KNCV), all seven partners (American Thoracic Society (ATS), Family Health International 360 (FHI 360), Japan Anti Tuberculosis Association (JATA), KNCV, Management Science for Health (MSH), International Union Against TB and Lung Diseases (The Union), World Health Organization (WHO)) collaborated in all 8 TB CARE I technical areas: 1) Universal and Early Access, 2) Laboratory Strengthening, 3) TB Infection Control, 4) Programmatic Management of Drug Resistant TB (PMDT), 5) TB-HIV Collaboration, 6) Health Systems Strengthening (HSS), 7) Monitoring & Evaluation, Surveillance and Operational Research, and 8) Drug Supply and Logistics Management. Summary of APA3 results During the year the following major results were achieved:
1. Results of PMDT expansion TBCARE I assistance has resulted in a total of 11 PMDT sites fully operational in 10 provinces (2 sites out of TB CARE I area), establishment of 3 PMDT sub-referral hospitals, and almost 375 PMDT satellites. This year, the sites succeeded in screening 2218 MDR-TB presumptive MDR-TB cases, of which 511 were found positive. 531 MDR-TB patients were enrolled on SLD treatment. Since the launch of PMDT in 2009, 6620 presumptive cases were tested, 1783 MDR-TB cases were identified, and 1378 cases were put on treatment. The table below shows MDR-TB case notification from 2011-2013.
Table 1. Quarterly MDR TB Case Notification 2011-2013
Quarters Suspects Confirmed Enrolled
2011 2012 2013 2011 2012 2013 2011 2012 2013 Jan-Mar 287 448 811 104 126 216 40 67 193 Apr-Jun 309 648 866 98 183 216 73 125 240 Jul-Sept 318 680 541* 97 152 79* 60 105 98* Oct-Dec 343 683 111 149 82 135
Total 1257 2459 2218 410 610 511 255 433 531
Target 400
(63%) 900
(48%) 1800
(30%)

5
In APA3 assistance focused on decreasing the mortality rate of MDR-TB: the program succeeded to halt the increase of default (24.3% in 2011 to 19.2% in 2012) and mortality rates (15.7% in 2011 to 12.2% in 2012) of notified MDR-TB cases, but both rates are still too high. To improve patient adherence, TBCARE made strong efforts to assist NTP in decentralization of services to the nearest health facility and improving patient support, including establishment of Peer Educators for MDR TB and introduction of Patient Centered Approaches. In 2013 more than 300 PMDT satellites will be functional. At the end of September 2013, 452 patients out of 708 (64%) are continuing treatment at satellites health centers. Peer educators have been prepared in five treatment centers.
2. Results in Universal Access and PPM TB CARE I supported the establishment of PPM teams in 25 districts located in 7 TB CARE I provinces. The objective of these PPM teams is to improve coordination and ensure networking between major stakeholders, i.e. provincial health services, hospitals, private providers and professional societies, prison department, laboratories, workplaces etc, resulting in increased notification of TB patients. An increased number of TB patients were notified in public and private hospitals in 4 provinces of TB CARE I supported areas. This contributed to 13,434 (13%) out of 104,515 cases notified in 2012. TB CARE I intensified technical assistance to expand implementation of ISTC by engaging a total of 97 pulmonologists in 61 private hospitals in 3 provinces (Jakarta, Banten, West Java). Starting from 2010 through June 2013, some 4,118 (42%) were additionally notified out of a total of 7,986 TB cases reported to the NTP. Gradually patient cohorts show a deceasing default rate and improving treatment success rate. Moreover, 269 private providers are collaborating and notifying cases to the NTP. Furthermore TB CARE I made strong progress with regulation of private practitioners by
- Finalization of the National Guidelines for Medical Practice Standards for TB Care (PNPK). These standards are essential to ensure standardization and quality of TB care delivered by private providers, and establish a legal basis and foundation for certification under the Indonesia Medical Association (IMA). In APA3 TB CARE I supported the Indonesian Medical Association with development of a framework for private provider certification, which will be piloted and implemented in APA4.
- Good progress has also been achieved in implementation of hospital accreditation for TB control: TB CARE I facilitated development and finalization of an assessment instrument that facilitates surveyors to evaluate the status of DOTS implementation in hospitals, based on the accreditation standards for TB control. The next step will be including TB IC standards in the accreditation standards. Good progress can also be reported on implementation of TB control in prison:
- TB CARE I have successfully supported the NTP, NAP and MoLHR to implement TB in prisons and TB-HIV collaborative activities in 25 large prisons and detention centers. External linkages with other health facilities for released inmates with TB and/or HIV

6
with a referral success rate of 80%. All prisons now conduct mass-, and at-entry screening.
- Furthermore the National Pediatric TB guidelines were updated in line with the Revised WHO guidelines for TB in Children (2012) and the “Rapid Advice” document.
3. Results in TB-HIV
Up to end of June 2013, 7,104 (93%) out of 7,668 PLHIV, visiting HIV/ART Referral Hospitals in TB CARE I sites, had their TB status assessed during their last visit. Among 12,904 TB patients, notified in 63 TBCARE I sites, some 2,074 (16%) were tested for HIV and had their HIV test result recorded in the TB register. Among these patients, 856 (41%) are HIV-positive. 410 (48%) started or continued on anti retroviral therapy for HIV and 720 (84%) started or continued on CPT (Cotrimoxazole Preventive Therapy). These results reflect an increase compared to APA2 which shows improved TB-HIV collaborative activities and better understanding on TB-HIV reporting and recording due to intensive technical assistance through TBCARE I. The pilot implementation of IPT has been successfully completed in 4 hospitals: 205 out of 281 / 73% PLHIV from the 4 hospitals received IPT and 167 (81%) of the patients completed the 6 month regimen. NTP will scale up the implementation of IPT with assistance of TB CARE I in APA4. TB CARE I has successfully strengthened TB-HIV coordination at central and provincial level by supporting national and provincial TB-HIV technical working groups, providing technical inputs for development of 11 provincial TB-HIV joint plans: All 33 provinces now have provincial TB-HIV plans. TB CARE I supported NTP and NAP to further introduce the use of GeneXpert for TB diagnosis among HIV patients in 25 ART hospitals. 1036 HIV patients were tested with GeneXpert, which is 28% of the total tested in APA3.
4. Results in Laboratory strengthening and GeneXpert implementation Six Reference Laboratories are now certified for culture & DST and are quality assured by the SRL (IMVS, Adelaide). These labs are: Surabaya Reference Laboratory (LJ, MGIT, HAIN), Microbiology Lab University of Indonesia (MGIT) (HAIN for research), Microbiology University of Hasanudin (NHCR) (MGIT), Persahabatan Hospital (LJ, MGIT, HAIN),BLK Bandung (LJ), BLK Semarang (LJ). The Surabaya National Reference lab is being prepared to take over national quality assurance for C/DST through panel testing and certification of provincial C/DST laboratories in Indonesia. Four other laboratories (Micro-UI, RS-Persahabatan, BLK Bandung, and NHCR-Makassar) have also passed SL-DST EQA for 2013. Five additional reference laboratories are in the pipeline, currently undergoing the process for QA for DST: These labs are: Adam Malik (North Sumatra, Medan), BLK Jayapura in Papua, the provincial reference laboratory in Jakarta (BBLK), the Sanglah lab in Bali, and Microbiology lab of the University of Gadjah Mada (Yogyakarta). Six other laboratories have been assessed and are being prepared for C/DST certification in the period 2014-2016

7
During APA3 TBCARE I joined a new partnership with Beckon Dickinson, USAID and MoH in the efforts to promoting science, technology and innovation in Indonesia. Xpert implementation: Indonesia is one of the 3 pilot countries for ‘Intensified implementation of GeneXpert’. This pilot has successfully been concluded. Results show that Xpert is crucial to achieve national PMDT expansion targets. This innovative technology seems now well accepted and is fully integrated into the routine diagnostic algorithm for MDR-TB. Xpert roll-out is now considered to be one of the highest programs priorities. A ‘’lesson learnt’’ document has been developed including a set of recommendations that will be implemented in APA4.
Results:
Screening of presumptive MDR-TB cases and HIV patients through GeneXpert was conducted in 17 sites, with a total number of 3,678 examinations:
Successful tests
MTB positive Rif resistant
Rif sensitive
MDR-TB presumptive cases
2,642 1,881 (71%) 719 (27%) 1,162
PLHIV 1,036 260 (25%) 24 (2%) 2,36
Total tested 3,678 2,141 (58%) 743 (20%) 1,398
Table. GeneXpert tests and result in APA3
After introduction of Xpert, the number of presumptive MDR-TB cases tested for RIF resistance increased by almost 50%. TB detection increased by 15%.
A larger proportion of presumptive MDR-TB cases received a rifampicin resistance test result (70%) compared to before when only culture/DST was done (56%).
The average time in days between registration of presumptive MDR-TB cases and time to second-line treatment initiation was 81 days befóre Xpert introduction and 15 days áfter Xpert introduction.
The proportion of RIF resistant TB cases that started MDR-TB treatment increased by 17% and time from suspect registration to treatment initiation reduced by 69 days.
5. Results in other technical areas
National guideline for TB IC implementation in health facilities has been finalized and is being distributed. The next step is the inclusion in the national accreditation standards. During APA3, TB CARE I supported 26 health facilities and 25 prisons/DCs for TB IC implementation. TB CARE I supported the development of a tool for costing of TB services and estimating the economic burden of TB. Analysis of District Health Account TB expenditure and data from insurance companies has been documented. These will be used in further costing modeling for expansion.

8
With support from TB CARE I partners, the National TB Prevalence Survey is being implemented. Methods and tools were piloted in selected clusters. TBCARE provided technical assistance and supported preparation of the laboratories and procurement of equipment and supplies. So far 38 out of 156 (24%) clusters have been completed with close supervision from TB CARE I and NIHRD. E-TB Manager is now being implemented in 10 out of 11 PMDT sites, as a tool to provide timely, consistent and accurate data on MDR-TB case management, laboratory results and SLD stock levels. All PMDT sites have been trained in management of SLD to ensure availability of stocks.
6. Support to GF
TB CARE I has successfully assisted the PR in the Phase 2 proposal development and grant negotiations. Indonesia was awarded Phase 2 renewal funding of up to $36.3 million for two TB grants: One under PR Ministry of Health ($29.7 million) and one under PR Aisyiyah ($6.6 million). Consequently the total budget for phase 2 is now agreed at 56.5 Million US$ for the MoH, and 10 Million for PR Aisyiyah. The Grant Approvals Committee (GAC) emphasized the need to set more ambitious targets and scale up coverage of services for TB/HIV and multiple-drug-resistant TB (MDR-TB). It noted major concerns related to low absorption, and the need to balance rapid scale-up with strengthening financial management systems and program quality.
The Grant Approval Committee acknowledged that partner organizations, including TBCARE, make significant investments in technical assistance to complement Global Fund resources. These include investments in improving MDR-TB program quality, and in strengthening financial management capacity by experts contracted under TB CARE I. If sufficient scale up is achieved and PR MoH demonstrates absorption capacity, Indonesia may apply for additional resources under the NFM. Grant signing for Phase 2 is expected for November 2013 and the next phase will take off in January 2014.

9
Introduction
TB CARE I APA 3 in Indonesia is implemented by a coalition of 7 international organizations in TB control. KNCV Tuberculosis Foundation (KNCV) is the prime partner and 4 in-country collaborating partners, i.e. Family Health International 360 (FHI 360), Japan Anti-Tuberculosis Association (JATA), Management Sciences for Health (MSH), and World Health Organization (WHO); and 3 other collaborating partners, i.e. American Thoracic Society (ATS) and International Union Against Tuberculosis and Lung Disease (The Union).
TB CARE I is providing support to the NTP for the implementation of the National TB Control Strategic Plan 2011-2014 through well-coordinated assistance by TB CARE I partners through their country offices and respective headquarters. TB CARE I Indonesia’s main approach is building capacity in all technical areas, assuring that all assistance is complementary to the support provided by other sources including Global Fund Single Stream Funding. External consultants, where necessary, provided technical support to selected areas with the objective to train and coach national technical officers and assist the NTP in problem solving. This support was realized through country visits and distance assistance. TB CARE I supported NTP at central level and also at provincial and district level. Selection of the provinces and districts is based on the priorities of NTP as described in the National Strategic Plan, as well as the burden of MDR-TB, TB/HIV, remoteness of the area, and performance of the program.
TB CARE I Indonesia APA 3 is complementary to GFATM SSF Phase 1 supported activities and encompasses 8 technical areas. The technical areas are:
1. Ensuring universal and early access of TB services: Ensuring universal access to quality TB services through expansion of public-private mix (PPM), TB control in prisons, supporting TB service delivery to people living in remote areas and increasing pediatric TB case finding and improving the treatment quality
2. Strengthening laboratory system: Strengthening the laboratory network: expanding technical laboratory capacity, expanding LQAS for smear microscopy, expanding capacity for Culture and DST, and supporting further implementation of GeneXpert
3. Implementing TB infection control: Scaling up implementation of TB-IC strategies including implementation of infection control in hospitals, prisons and treatment centers
4. Control of MDR TB (PMDT): Improving the quality of PMDT in existing sites and supporting stepwise scale up of Programmatic Management of Drug resistant TB to 4 new sites, complementary to operational support provided by the GFATM
5. TB-HIV collaboration: Improving prevention diagnosis and treatment of TB–HIV co-infection in 8 provinces (North Sumatra, Riau Islands, DKI, West Java, Central Java, East Java, Papua, and West Papua)

10
6. Health Systems Strengthening: Supporting health system strengthening including human resource development and support development of exit strategies to greatly increase domestic funding for TB with an emphasis on costs, government allocations and revenue generation (especially from insurances)
7. Strengthening TB surveillance and Operational Research: Strengthening surveillance and improving the capacity to analyze and use quality data for decision-making. This includes implementation of integrated electronic TB recording and reporting system (SITT/Sistem Informasi Tuberkulosis Terpadu), scaling up and improving functioning of e-TB Manager and improving capacity for operational research
8. Improving Drug Management: Improving drug and pharmaceutical management to ensure uninterrupted supply of first and second line TB drugs to all health facilities/PMDT sites
TB CARE I APA3 was approved in March 2013 with total obligated amount of USD 9,300,000.
Figure 1. TB CARE I Indonesia focus area

11
Core Indicators TB CARE I has seven core indicators that the program as a whole is working to improve TB control across all countries. Table 1 summarizes the core indicator results across the life of the project for TB CARE I Indonesia. Results for 2013 will be reported on next year. Table 1: TB CARE I core indicator results for Indonesia Indicators 2010
(Baseline)
2011 (Year
1)
2012 (Year
2) C1. Number of cases notified (all forms) 302,861 321,308 331,413 C2. Number of cases notified (new confirmed)
183,366 197,797 202,319
C3. Case Detection Rate (all forms) 69% 70% 72% C4. Number of TB cases among HCWs NA NA NA C5. Treatment Success Rate of confirmed cases
91% 88% 90%
C6. Number of MDR cases diagnosed 185 410 610 C7. Number of MDR cases put on treatment 140 255 438

Summary of Project Indicators
Table 2. Outcome Indicators in Year 3 Expected Outcome 1.1 Increased demand for and use of high quality TB services and improve the satisfaction with the services provided (Population/Patient Centered Approach)
Outcome Indicators
Indicator Definition Baseline Target Y3 Result Y3 Comments
1.1.1 Number of facilities where quality of services is measured
NTP should measure the patient perception of the quality of services available/accessible and the appropriate health seeking behavior related to TB. Available tools for this purpose are TB CAP’s QUOTE TB and QUOTE TB Light tools. However, any other tools could be used to measure it. Count the number of facilities where quality of services from a patient’s perspective was measured using QUOTE or any other tool in the last 12 months.
13 (for 2012)
39 (for 2013) 39
1.1.2 Number of facilities where cost to patients is measured
NTP should measure the cost to patients for TB diagnosis, treatment and/or care. One available tool for this purpose is TB CAP’s Tool to Estimate Patients’ Cost. However, any other tools could be used to measure it. Count the number of facilities where cost to patients was measured using any tool in the last 12 months
0 (for 2012)
26 26
1.1.3 TB personnel trained on the Patients’ Charter
The Patients’ Charter for Tuberculosis Care (The Charter) outlines the rights and responsibilities of people with tuberculosis. The Charter outlines 15 rights: Care (3), Dignity (2), Information (5), Choice (3) and Confidence (2). This WHO indicator measures whether TB personnel have been trained on the use of the Patient’s Charter in the last year
0 (for 2012)
76 76
Expected Outcome 1.2 Increased quality of TB services delivered by all care providers (Supply)

13
Outcome Indicators
Indicator Definition Baseline Target Y3 Result Y3 Comments
1.2.1 Private providers collaborating with the NTP
Number of private providers collaborating with the NTP (i.e. reporting TB case information to the NTP). This is a WHO indicator.
284 300 366
1.2.2 TB cases diagnosed by private providers
Number of new cases of TB diagnosed according to NTP guidelines by private providers
1827 from recruited pulmonologists (2011)
3000 3819 from recruited pulmonologists (2012)
1.2.3 Status of PPM implementation
This indicator measures the status of the Public-Private Mix (PPM) strategy and interventions. Indicator Value: Based on the scoring system below: 0= The country has no PPM activities 1= The country has piloted at least one PPM intervention 2= The country has a PPM strategy 3= The country has started implementation of the PPM strategy
3 (2012) 3 3
1.2.5 Childhood TB approach implemented
Childhood TB is an important component of an NTP’s strategy. This indicator measures the level to which childhood TB is addressed in the NTP’s strategy. Indicator value: Score based on the following: 0 = Childhood TB is not mentioned in the NTP Strategic Plan 1 = Childhood TB is mentioned in the strategic plan, but no activities are implemented on childhood TB 2 = Childhood TB activities are being piloted or are implemented in select sites 3 = Childhood TB is an integral part of the NTP strategic plan and regular activities.
3 3 3

14
1.2.6 Number of TB cases (all forms) diagnosed in children 0 – 14
This indicator measures the number of TB cases (all forms) diagnosed in children 0-14 years of age. When childhood TB is a priority, being able to report on and measure changes in case notification by age group is important.
22765 (2012) TB CARE I area
28890 27368
1.2.7 Prisons with DOTS
This indicator measures the coverage of TB CARE I-supported prisons providing DOTS services. Prisons should regularly diagnose and refer suspects and should put patients on treatment in order to be qualified as providing DOTS.
100% (20/20) (2012)
25/25 (100%) 25/25 (100%)
1.2.11 Percentage of prisons conducting screening for TB
This indicator is used to monitor the implementation of screening for TB in prisons. This indicator is also required by USAID Mission.
100% (20/20) (2012)
25/25 (100%) 25/25 (100%)
1.2.12 Inmates screened for TB symptoms, diagnosed and treated for TB according to national standard
This indicator is used to ensure the implementation of active TB case finding and follow-up diagnosed and treatment of TB in prison
15,000 screened/1400 sputum exam/115 treated (2011)
22,000 screened/ 2,000 sputum exam/ 200 treated
49,0618 screened/ 2,943 sputum exam/ 484 treated
1.2.13 Released/transferred inmates with TB and TB/HIV in TB CARE I supported prisons come to referral facilities to continue their treatment
This indicator is used to ensure released/transferred inmates with TB and TB/HIV continue their treatment.
34% (for 2010)
70% 74/97 (76%)

15
1.2.14 Proportion of TB patients released from prisons during treatment and completed treatment
Percentage of TB patients that are released from the prisons and successfully transferred for continuing TB treatment that have completed treatment during the respective period. This is a Mission indicator
N/A N/A 13% (5 completed out of 38 released prisoners from 25 prisons/detention centers)
1.2.15 Inmates with HIV screened for TB
This is a process indicator for an activity intended to reduce the impact of TB among people living with HIV in prison.
80% 706/718 (98%)
1.2.16 HIV patients with active TB in prison received TB treatment
This indicator is use to ensure HIV patients with TB received TB treatment
90% 125/128 (98%)
1.2.17 TB patients in prisons with known HIV status
This indicator measures the HIV status of TB patients. Knowledge of HIV status enables HIV-positive TB patients to access the most appropriate HIV prevention, treatment, care and support services.
60% 283/407 (70%)
1.2.18 TB/HIV co-infected patients in prisons received CPT
The purpose is to monitor commitment and capacity of the prison program to provide CPT to HIV-positive TB patients. It is important for program at prison to know the proportion of HIV-positive TB patients who receive this potentially life-saving therapy
60% 103/135 (76%)
1.2.19 Districts implementing childhood TB approach
Number of districts implementing childhood TB approach
100 50

16
1.2.22 Percentage of hospitals implementing quality DOTS in TB CARE I area
Percentage of hospitals implementing quality DOTS in TB CARE I area. This is also a Mission indicator.
189/325 (58%)
225/335 (67%)
303/457 (66%)
1.2.23 Percentage of districts implementing PPM in TB CARE I area
Percentage of districts implementing PPM in TB CARE I area
0 19/226 (8.4%)
25/226 (11%)
Expected Outcome 2.1 Ensured capacity, availability and quality of laboratory testing in country needed to support the diagnosis and monitoring of TB patients
Outcome Indicators
Indicator Definition Baseline Target Y3 Result Y3 Comments
2.1.1 A national strategic plan developed and implemented for providing the TB laboratory services needed for patient diagnosis and monitoring, and to support the NTP
0 = Laboratory strategic plan is not available 1 = Laboratory strategic plan is ready but no annual implementation plan and budget available for the current year. 2 = Laboratory annual implementation plan and budget is available for the current year 3 = NTP annual report for the current year includes a section demonstrating progress with the implementation of the laboratory strategic plan.
2 3 3
Expected Outcome 2.2 Ensured the availability and quality of technical assistance and services
Outcome Indicators
Indicator Definition Baseline Target Y3 Result Y3 Comments

17
2.2.1 Confirmed link with an SRL through a memorandum of agreement
The country has a written memorandum of agreement with an SRL as confirmation of a formal link with that SRL.
Yes Yes Yes
2.2.2 Technical assistance visits from a SRL through a formal link of memorandum of agreement
A selected SRL conducts TA visits to reference laboratories. TA visit reports should be provided by the SRL. Suggestions for improvement made by SRL should be successfully implemented. TA visits have been formalized in a memorandum of agreement.
Yes Yes Yes
Expected Outcome 2.3 Ensured optimal use of new approaches to the laboratory confirmation of TB and incorporation in national strategic lab plans
Outcome Indicators
Indicator Definition Baseline Target Y3 Result Y3 Comments
2.3.1 Diagnostic sites offering advanced technologies for TB or drug-resistant TB
Number of diagnostic sites, in which GeneXpert MTB/RIF, HAIN MTBDRplus or liquid C/DST are implemented and routinely used for diagnosis, stratified by testing type.
Xpert: 5, C/DST: 2
Xpert: 17, C/DST: 6
Xpert: 17, C/DST: 6
2.3.2 Rapid tests conducted
Number of rapid tests conducted using GeneXpert MTB/RIF.
1015 2200 3678 i.e. successful tests
2.3.3 Patients diagnosed with GeneXpert
This indicator measures the number and percent of patients diagnosed using GeneXpert (disaggregated by RIF-resistance) RR: RIF resistant RS: RIF sensitive
598/1015 (59%)
All (RR and RS): 1200/2200 (54%)
RS: 1398/3678 (38%) RR 743/3678 (20%)
Expected Outcome 3.1 Increased TB IC Political Commitment
Outcome Indicators
Indicator Definition Baseline Target Y3 Result Y3 Comments

18
3.1.1 National TB- IC guidelines that are in accordance with the WHO TB IC policy have been approved
The TB-IC guidelines must have been approved by the NTP or MOH, and must be consistent with the 2009 WHO Policy on TB-IC. The guidelines should cover controls in healthcare facilities, congregate settings and households/communities
Yes (2010)
Yes Yes Revised national guidelines were finalized in APA3
3.1.2 TB- IC measures included in the overall national IPC policy
TB-IC measures must be included (in a special section on transmission-based airborne infection prevention and control) in the overall national IPC policy
Yes (2010)
Yes Yes
Expected Outcome 3.2 Scaled-up implementation of TB-IC strategies
Outcome Indicators
Indicator Definition Baseline Target Y3 Result Y3 Comments
3.2.1 “FAST” strategy has been adapted and adopted
NTP must have adopted a FAST strategy that prioritizes the following four core interventions to implement TB IC a) active identification of coughing patients, b) rapid diagnosis, c) separation of TB suspects and infectious TB patients, and d) early onset of effective treatment of TB patients. (FAST - “Find cases Actively, Separate safely, and Treat effectively”) 0=Country has not adopted the four core interventions for TB IC FAST strategy and there are no plans for implementation 1=Country has adopted the four core interventions for TB IC (“FAST strategy”) and there are plans for implementation but the implementation has not started 2=Fast strategy has been piloted 3= Fast strategy has been fully implemented at the national level
0 N/A 0 No plans for FAST strategy adoption this year
3.2.2 Facilities implementing TB IC measures with TB CARE I support
Facilities that received support for implementation of TB IC measures through TB CARE I out of the number of facilities planned to receive support for TB IC implementation.
11 30 52
19
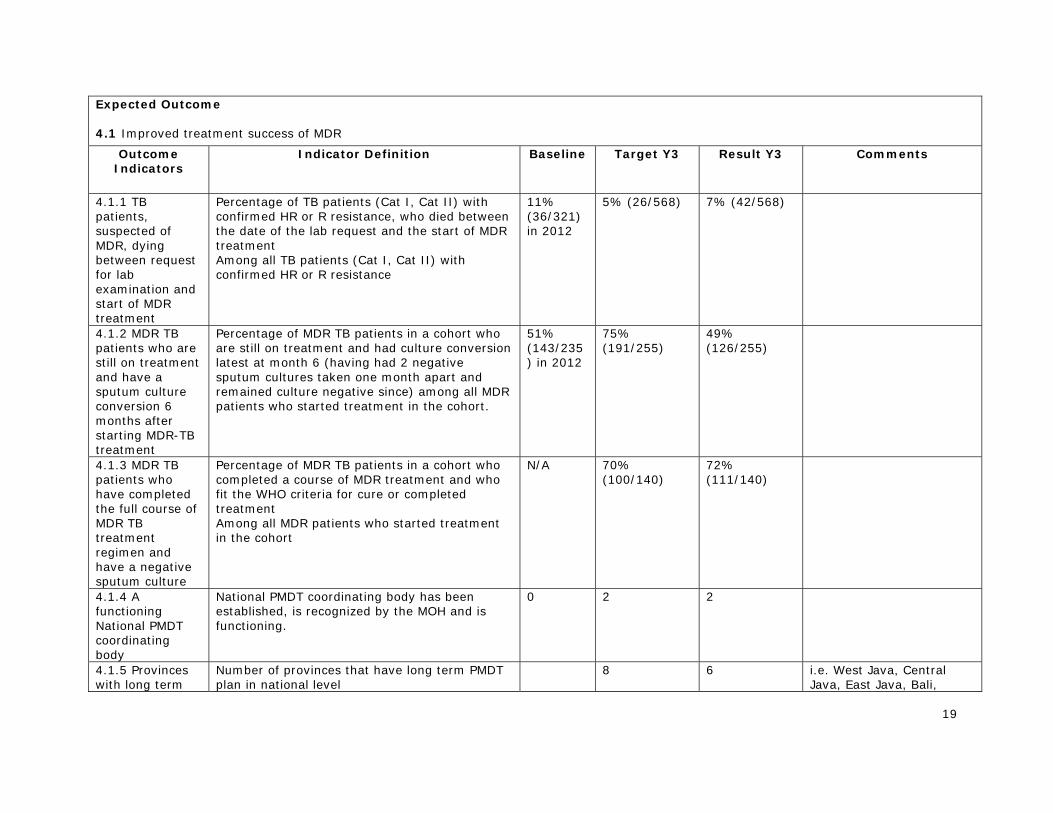
Expected Outcome 4.1 Improved treatment success of MDR
Outcome Indicators
Indicator Definition Baseline Target Y3 Result Y3 Comments
4.1.1 TB patients, suspected of MDR, dying between request for lab examination and start of MDR treatment
Percentage of TB patients (Cat I, Cat II) with confirmed HR or R resistance, who died between the date of the lab request and the start of MDR treatment Among all TB patients (Cat I, Cat II) with confirmed HR or R resistance
11% (36/321) in 2012
5% (26/568) 7% (42/568)
4.1.2 MDR TB patients who are still on treatment and have a sputum culture conversion 6 months after starting MDR-TB treatment
Percentage of MDR TB patients in a cohort who are still on treatment and had culture conversion latest at month 6 (having had 2 negative sputum cultures taken one month apart and remained culture negative since) among all MDR patients who started treatment in the cohort.
51% (143/235) in 2012
75% (191/255)
49% (126/255)
4.1.3 MDR TB patients who have completed the full course of MDR TB treatment regimen and have a negative sputum culture
Percentage of MDR TB patients in a cohort who completed a course of MDR treatment and who fit the WHO criteria for cure or completed treatment Among all MDR patients who started treatment in the cohort
N/A 70% (100/140)
72% (111/140)
4.1.4 A functioning National PMDT coordinating body
National PMDT coordinating body has been established, is recognized by the MOH and is functioning.
0 2 2
4.1.5 Provinces with long term
Number of provinces that have long term PMDT plan in national level
8 6 i.e. West Java, Central Java, East Java, Bali,

20
PMDT plan Yogyakarta, Bangka Belitung
4.1.6 PMDT sites assessed using the comprehensive site readiness tool
Number of PMDT sites assessed using the comprehensive site readiness tool. This is Mission indicator.
9 6
4.1.7 PMDT sites trained and treating patients (new sites)
Number of new PMDT sites that have been trained and are treating patients. This is Mission indicator.
7 19 Trained sites during 2013: 19 sites at 19 provinces. 2 site (Dok II hospital, Papua and Dipati Hamzah, Babel) has started treating patients. 5 other sites (Riau, Riau Islands, West Sumatera, Central Sulawesi and Maluku) are under final stage to start treatment.
4.1.8 Percent of patients tested by Xpert with RIF+, put on treatment within 7 days
Proportion of TB or MDR-TB patients either from MDR-TB or HIV suspects that diagnosed as Rif positive with Xpert and put on the right treatment within 7 days among all Rif+ patients tested with Xpert. This is also indicator from the Mission.
2% (12/511) 2% (12/511) Based on e-TB manager data
Expected Outcome 5.1 Strengthened prevention of TB/HIV co-infection
Outcome Indicators
Indicator Definition Baseline Target Y3 Result Y3 Comments
5.1.2 Eligible PLHIV enrolled for IPT during reporting period
Number of eligible PLHIV enrolled for IPT during reporting period
200 205
5.1.3 Number of PMDT sites with functioning TB-HIV linkages
Number of PMDT sites with functioning TB-HIV linkages. This indicator is required by the Mission
5 5 Five PMDT sites have SOP for TB-HIV linkages, however, those sites need to improve the quality first in order to fulfill the

21
requirement in indicator definition
Expected Outcome 5.2 Improved diagnosis of TB/HIV co-infection
Outcome Indicators
Indicator Definition Baseline Target Y3 Result Y3 Comments
5.2.1 HIV-positive patients who were screened for TB in HIV care or treatment settings
Percentage of HIV-positive patients seen at HIV testing and counseling or HIV treatment and care services who were screened for TB symptoms among all HIV-positive patients seen at HIV testing and counseling or HIV treatment and care services, over given time period.
1427/2946 (48%) for 2011
85% 7104/7668 (93%)
5.2.2 TB patients (new and re-treatment) with an HIV test result recorded in the TB register
The purpose is to assess how many TB patients know their HIV status, regardless of whether testing was done before or during TB treatment. In settings where HIV is driving the TB epidemic, all TB patients should be offered and encouraged to have an HIV test.
911/5770 (16%) for 2011
20% 2074/12904 (16%)
5.2.3 TB patients (new and re-treatment) recorded as HIV-positive (Note: Mission indicator)
The purpose is to assess the prevalence of HIV among TB patients. In settings where HIV is driving the TB epidemic, all TB patients should be offered and encouraged to have an HIV test. This indicator looks at TB patients (new and retreatment) with an HIV+ test results recorded in the TB register
243/911 (27%) for 2011
856/2074 (41%)
5.2.4 Number of newly identified HIV+ TB patients
Number of newly HIV+ TB patients during TB treatment This indicator is required by the Mission Indicator
211
Expected Outcome 5.3 Improved treatment of TB/HIV co-infection

22
Outcome Indicators
Indicator Definition Baseline Target Y3 Result Y3 Comments
5.3.1 Registered HIV infected TB patients receiving ART during TB treatment
Percentage of all HIV-positive TB patients, registered over a given time period, who receive ART (are started on or continue previously initiated ART) Among all HIV-positive TB patients registered over the same given time period.
104/243 (43%) for 2011
50% 410/856 (48%)
5.3.2 HIV-positive TB patients who receive CPT
Percentage of HIV-positive TB patients, registered over a given time period, who receive (given at least one dose) CPT during their TB treatment among total number of HIV-positive TB patients registered over the same given time period.
197/243 (81%) for 2011
85% 720/856 (84%)
5.3.3 HIV patients with active TB who receive TB treatment
Number of all HIV patients diagnosed with TB who started TB treatment among all HIV patients diagnosed with TB registered over the same given time period
90% 1170/1213 (96%)
5.3.4 Number of HIV TB patients completing TB treatment
Number of HIV patients that completed their TB treatments. This is also an indicator required by USAID Mission.
161 161 completing TB treatment out of 309 TB-HIV patients that has been reported with result of TB treatment
Expected Outcome 6.1 Ensured that TB control is embedded as a priority within the national health strategies and plans, with commensurate domestic financing and supported by the engagement of partners
Outcome Indicators
Indicator Definition Baseline Target Y3 Result Y3 Comments
6.1.1 Government budget includes support for anti-TB drugs
The annual government budget should allocate funding for anti-TB drugs (first and second line drugs). This indicator measures the percent of the annual anti-TB drug costs paid by the government.
Yes (for 2011)
Yes (for 2013) 100%
Yes (for 2013) 77%
In 2013, government provides IDR 69,743,500,906 for FLD only. SLD is being provided by GF with amount IDR 20,854,054,584 (Total, budget for FLD and SLD is

23
IDR 90,597,555,490) so government contributes 77 %
6.1.2 CCM and/or other coordinating mechanisms include TB civil society members and TB patient groups
Civil society members and TB patient groups that are officially registered as being members of the CCM and particulate in the regular CCM meetings
Yes (for 2011)
Yes (for 2013) Yes (for 2013)
Expected Outcome 6.2 TB control components (drug supply and management, laboratories, community care, HRD and M&E) formed integral part of national plans, strategies and service delivery of these components
Outcome Indicators
Indicator Definition Baseline Target Y2
Result Y2 Comments
6.2.1 TB CARE I-supported supervisory visits conducted
TB CARE I supports supervisory activities in several countries. This indicator measures TB CARE I’s support of NTP’s supervisory activities by comparing the number of planned visits in the TB CARE I work plan (denominator) to what is actually conducted (numerator). These visits can occur at any level (intermediate, peripheral) so long as TB CARE I.
0 (for 2011)
N/A 395/296 (133%)
6.2.2 People trained using TB CARE I funds
Health care workers at all levels trained on any area of TB control using TB CARE funds
446 (for 2010)
500 (for 2012)
911 (368 male, 543 female)
6.2.4 Provinces with developed/ updated HRD plan
Number of provinces that have developed an HRD plan
33 (2012) 33 33

24
Expected Outcome 7.1 Strengthened TB surveillance
Outcome Indicators
Indicator Definition Baseline Target Y2
Result Y2 Comments
7.1.1 An electronic recording and reporting system for routine surveillance exists at national and/or sub-national levels
The routine Electronic Recording and Reporting (ERR) TB surveillance for all TB patients is based on at least all standard variables which are included in the TB treatment register. The record/case-based data flow from data collection level to national level (via intermediate/regional levels) is digital. Note that having an ERR just for MDR-TB or at district level with case-based data (not aggregate) also fulfills this indicator.
Yes (2012)
Yes Yes
7.1.2 PMDT sites implementing e-TB manager for real-time patient and inventory data in TB CARE I areas
Percentage of PMDT sites implementing e-TB manager for real-time patient and inventory data in TB CARE I areas. This indicator is also required by USAID Mission.
5/5 (100%)
9/9 (100%)
10/11 (91%)
7.1.3 Districts using SITT for quarterly reporting of case registers and logistics
Percentage of districts that are using SITT for quarterly reporting of case registers and logistics. This is a Mission indicator.
N/A Case register: 80% Logistics: 60%
Case register: 440/499 (88%) Logistics: 304/499 (61%)
Expected Outcome 7.2 Improved capacity of NTPs to analyze and use quality data for management of the TB program
Outcome Indicators
Indicator Definition Baseline Target Y3
Result Y3 Comments
7.2.1 Data quality measured by NTP
Any aspect of data quality has been measured in the last year (internal consistency, timeliness, completeness, accuracy, etc.) at national, intermediate/regional or peripheral levels.
Yes (2012)
Yes Yes
25
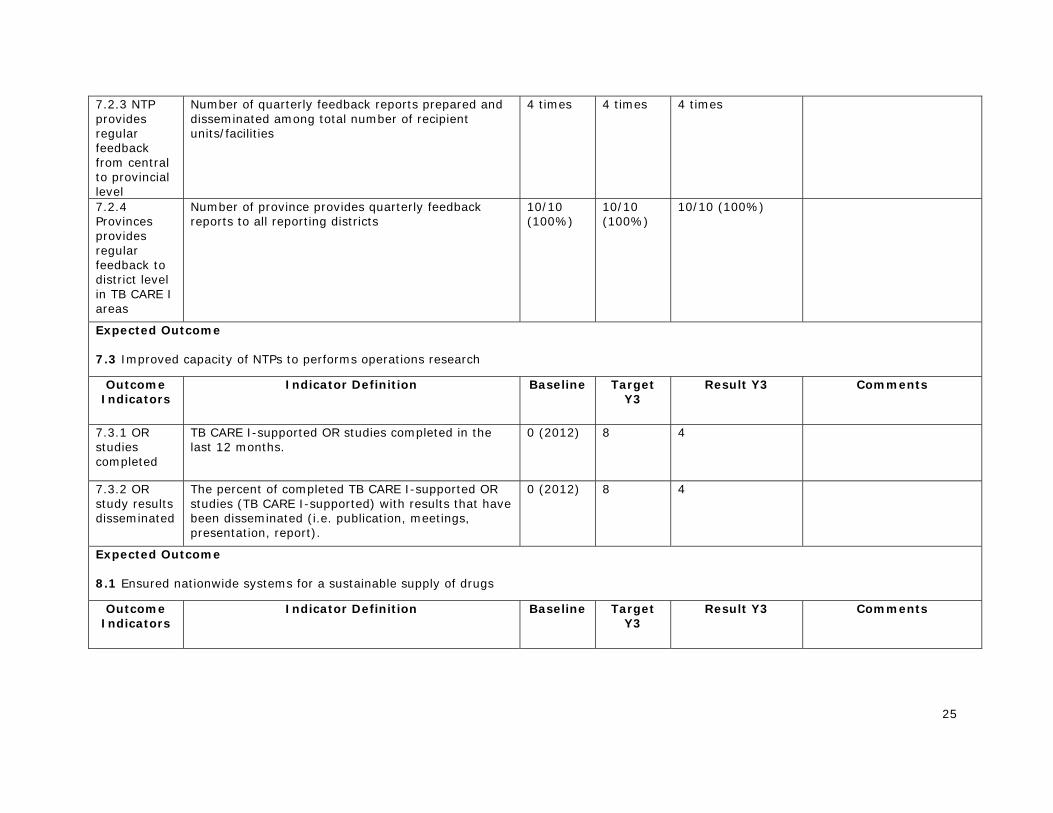
7.2.3 NTP provides regular feedback from central to provincial level
Number of quarterly feedback reports prepared and disseminated among total number of recipient units/facilities
4 times 4 times 4 times
7.2.4 Provinces provides regular feedback to district level in TB CARE I areas
Number of province provides quarterly feedback reports to all reporting districts
10/10 (100%)
10/10 (100%)
10/10 (100%)
Expected Outcome 7.3 Improved capacity of NTPs to performs operations research
Outcome Indicators
Indicator Definition Baseline Target Y3
Result Y3 Comments
7.3.1 OR studies completed
TB CARE I-supported OR studies completed in the last 12 months.
0 (2012) 8 4
7.3.2 OR study results disseminated
The percent of completed TB CARE I-supported OR studies (TB CARE I-supported) with results that have been disseminated (i.e. publication, meetings, presentation, report).
0 (2012) 8 4
Expected Outcome 8.1 Ensured nationwide systems for a sustainable supply of drugs
Outcome Indicators
Indicator Definition Baseline Target Y3
Result Y3 Comments

26
8.1.1 National forecast for the next calendar year is available
A national forecast of both first and second line TB drugs for the next fiscal year has been conducted. If yes, indicate when it was done and by whom.
Yes (2012)
Yes Yes (mid September 2013)
8.1.2 Updated SOPs for selection, quantification, procurement, and management of TB medicines available
Completed and agreed upon SOPs for drug management of both FLDs and SLDs available for NTP usage that are not older than five years. FLDs and SLDs can be addressed through two separate documents or combined in one SOP.
Yes (2012)
Yes Yes
8.1.3 Districts reporting complete and timely FLD stock on a quarterly basis
Percentage of districts nationwide reporting FLD stock using TB13 format on quarterly basis among all districts in the country
80% 327/492 (66%)
8.1.4 PMDT sites reporting complete and timely SLD stock on a quarterly basis
Percentage of PMDT sites reporting SLD stock using TB13b format
5/5 (100%)
9/9 (100%)
9/10 (90%)
8.1.5 Drugs stock-outs (counts each drug)
Number of drug stock-outs (counts for each drug). This indicator is required by the Mission.
0 0 0
27
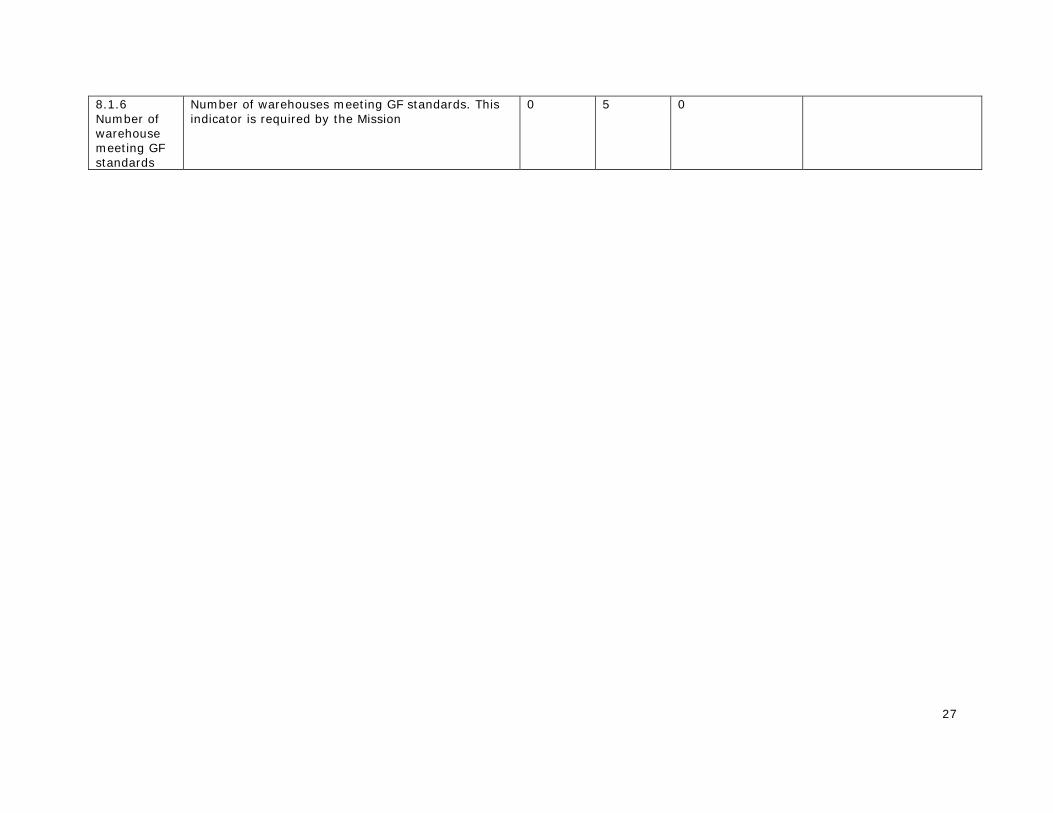
8.1.6 Number of warehouse meeting GF standards
Number of warehouses meeting GF standards. This indicator is required by the Mission
0 5 0

28
1. Universal and Early Access There were 4 partners working in this technical area (ATS, FHI 360, KNCV and WHO). At the beginning of APA3, six major challenges were identified:
1. Sub-optimal linkages for Public Private Mix (PPM) in provincial and district/regency level leading to low case notification and treatment success;
2. Significant patient delay due to poor awareness of availability of quality TB care; 3. Lack of implementation and monitoring of International Standard of TB Care (ISTC) in
the healthcare facilities in general and in accredited hospitals; 4. Limited resources and capacity to diagnose, treat TB and TB/HIV in prison and maintain
these treatments after release from prison; 5. Low case notification and treatment success rates among patients living in remote areas; 6. Under-notification and misdiagnosis of pediatric TB in public and private sector.
Key Results 1. Improving linkage for PPM in provincial and district level to improve case notification and treatment success • TB CARE I provided technical assistance to private sector (private hospitals, clinics) and
linked private practitioners to NTP in all 10 TB CARE I provinces which contributed 48,525 (23%) cases out of total 202,128 cases notified in the provinces (see table 3 below).
• Up to end of June 2013, intensive assistance was also provided to 97 pulmonologists in 61 private hospitals in 3 provinces, which resulted in 7986 cases being notified to the NTP.
• More men (59%) than women (41%) are diagnosed with smear positive pulmonary tuberculosis (TB). However the treatment success between men and women are almost similar. The possible influence of gender on TB diagnosis (ability to access appropriate care, undergo examination, submit sputum for microscopic testing) needs to be explored further. (see table 4)
Table 3. Case Contribution by private sector in TB CARE I provinces (Jan – Dec 2012)
Province Private hospitals Clinic Workplace
Total in provinces
North Sumatra 2.011 249 0 17.775 West Sumatra 1.354 0 0 6.090 Jakarta 11.140 381 0 24.463 West Java 12.166 350 6 60.526 Central Java 9.052 66 0 34.707 East Java 5.799 109 99 38.014 Yogyakarta 702 0 0 2.433 South Sulawesi 1.979 10 0 10.769 Papua 1.580 353 171 5.525 West Papua 942 6 0 1.826 Total 46.725 1.524 276 202.128 Contribution 23% 0.8% 0.14%
Source: SITT preliminary data as per 07 November 2013

29
Table 4. Treatment Success Rate for cases from Jan to Sep 2012 in TB CARE I areas by gender
No Province Smear positive Cured Completed
Treatment Success Rate
Male Female Male Female Male Female Male Female
1 North Sumatra 7,642 4,098 6,096 3,262 120 73 81% 81%
2 West Sumatra 2,076 1,135 1,541 855 127 59 80% 81%
3 Jakarta 3,168 2,034 2,067 1,418 415 248 78% 82%
4 West Java 13,892 10,146 10,242 7,683 994 765 81% 83%
5 Central Java 7,429 5,758 4,971 4,115 416 290 73% 77%
6 Yogyakarta 521 337 388 278 37 17 82% 88%
7 East Java 9,554 7,621 7,966 6,546 543 396 89% 91%
8 South Sulawesi 3,683 2,689 3,112 2,367 142 88 88% 91%
9 West Papua 259 194 114 102 49 39 63% 73%
10 Papua 878 664 466 373 171 141 73% 77% TB CARE I area 49,102 34,676 36,963 26,999 3,014 2,116 81% 84%
2. Efforts to implement and monitor ISTC in healthcare facilities in hospitals and private practices
The National Guidelines for Medical Practice Standards for TB Care (PNPK) have been finalized during APA3. These guidelines are essential to ensure standardization of quality TB care delivered by private providers by ensuring a legal basis for certification under the Indonesia Medical Association (IDI). All activities are supported and facilitated by TB CARE I.
3. Efforts in improving capacity to diagnose, treat TB and TB-HIV in prison and maintain treatments after release resulted in: • The assignment of Pengayoman Hospital (prison hospital) as ART (Anti Retroviral
Therapy) hospital (in addition to its role as PMDT satellite). This means that prisoners living with HIV or TB-HIV that are located in surrounding Jakarta area will have easier access for ART.
• In Pengayoman Hospital all PLHIV presumed to suffer from TB were examined through Xpert (starting from April 2013). As of June 2013, the hospital had examined 51 presumptive TB cases.
• There are 31 prisons and detention centers (25 of them are TBCARE supported prisons) that have been exposed to information on PMDT and having linkage with PMDT hospitals & GeneXpert laboratories in 6 provinces (North Sumatera, Jakarta, West Java, Central Java, East Java and Banten).

30
• There are 4 prisons & 1 prisons hospital (Pengayoman Hospital), that were appointed and trained as PMDT prison satellites. Up to September 2013, Pengayoman Hospital already treated 10 MDR-TB patients from West Java & Jakarta inmates.
• Screening for inmates is running well, prisons and detention center staffs can perform sputum fixation, and recording and reporting system for TB and HIV has been established.
• PMDT and GeneXpert linkage has been established between prisons, detention centers, PMDT hospital and GeneXpert laboratories to ensure early diagnosis and prompt treatment.
5. In regards to low case notification and treatment success rates among patients living in remote areas • NTP released the Provincial Performance Report during the National TB Program M&E
meeting in Bali. Four (East Nusa Tenggara, Central Kalimantan, North Maluku, and Riau Islands) out of 5 provinces that received technical assistance from TB CARE I showed great improvement in performance rating (for both program and grant management aspects). The remaining province, West Nusa Tenggara is still listed as a low performing province.
6. To address the under-notification and misdiagnosis of pediatric TB • The National guideline for Childhood TB has been updated to be in line with the latest
WHO recommendations, including a chapter on pediatric MDR-TB management and guidelines for utilization of rapid TB diagnostic in pediatric TB cases
• The pilot implementation of intensified case finding approach has been carried out by the NTP in 5 provinces (North Sumatra, Central Java, East Java, East Kalimantan and West Nusa Tenggara) with support from TB CARE I and Indonesian Pediatric Association
• TB CARE I also provide support for the expansion of the initiatives through SSF phase 1 reprograming budget and the new SSF phase 2.
Challenges in Universal Access:
1. Cure rates of patients treated in hospitals are still relatively low and reached 50% in
private hospitals and 66% in public hospitals. Default rates (2011) in private hospitals were 14% and 13% in public hospitals.
2. A large majority of private providers are not yet engaged, while implementation of regulation (hospital accreditation and provider certification) requires time.
3. NTP’s support to prisons under GF has a limited budget for 200 prisons out of 434, besides, GF provides no budget for technical assistance. Most prisons/ detention centers need more intensive TA to implement TB including MDR and TB-HIV activities.
4. The updated Pediatric TB guidelines still need to disseminated to all provinces, not only in 10 provinces with GF funding. Diagnosis of TB in Children is still a big challenge as tuberculin tests are not available in all health facilities and many pediatricians do not follow the diagnostic algorithm.

31
2. Laboratory Strengthening In APA3, laboratory activities were implemented by four partners (JATA, KNCV, FHI 360 and MSH) in collaboration with JSI. In addition to support on laboratory readiness for National TB Prevalence Survey (NTPS), TB CARE I APA3 support for laboratory strengthening focused on 5 major challenges as following:
1. Low Coverage and inconsistent performance of external quality assurance (EQA) for smear microscopy examination. Support provided through: - Ensuring good quality of smear microscopy test at provincial reference laboratories - Supporting panel testing - Introducing computerized system for EQA - Introducing Lot Quality Assurance Sampling System (LQAS) guideline.
2. Low capacity and absence of a well-defined strategy to manage laboratory networking and expansion. - Facilitating coordination among TB laboratory working group members - Including the linkage of NRLs within the National Strategic Plan.
3. Lack of training capacity for lab technicians specifically on sputum microscopy and culture/drug sensitivity test (C/DST). Support provided through: - Recruiting an additional technical officer to strengthen technical leadership in Sub
directorate Microbiology and Immunobiology, Ministry of Health - Providing C/DST on-the-job training for national reference labs (NRLs) - Training of trainers for LQAS implementation
4. Limited number of certified C/DST laboratories. Support provided through: - Finishing renovation of C/DST reference laboratories - Providing critical equipment for C/DST labs - Supporting maintenance, calibration and reparation of Biological Safety Cabinets (BSCs) - Providing international and local technical assistance, training and panel tests
5. Slow roll out of rapid new diagnostics (in particular Xpert MTB/RIF) contributing to under-diagnosis of MDR-TB and TB in PLHIV. Support provided through: Site assessment to ensure readiness for implementation - On site training, installation, start up, supervision and monitoring - Operational research - International and local technical assistance for set up, implementation, including for
those in TB-HIV labs
Key Results Table 6. Laboratory Area Challenges and Key Results Challenges in APA2 Results achieved Low Coverage and inconsistent performance of external quality assurance (EQA) for smear microscopy examination
AFB microscopy panel was provided to 20 provincial laboratories National guidelines for EQA for smear microscopy were updated TB CARE I assisted 3 new provinces to implement LQAS for smear microscopy in addition to 8 existing provinces LQAS is being implemented in 2402 (42%) health care facilities compared to 2218 (39%) in previous year Three new provinces are implementing LQAS, bringing up the total number to 11 out of 33 provinces.
Low capacity and absence Six intermediate labs were established in Papua province

32
of a well-defined strategy to manage laboratory networking and expansion Limited number of certified C/DST laboratories
9 laboratories received panel test for DST in 2012. Six laboratories passed the EQA activity for first and second line DST For the first time in Indonesia two laboratories achieved 100% for all drugs except streptomycin. TBCARE I supports establishment of a new partnership with Beckon Dickinson in the efforts to promoting science, technology and innovation in Indonesia
Slow roll out of rapid new diagnostics (in particular Xpert MTB/RIF) contributing to under-diagnosis of MDR-TB and TB in people living with HIV (PLHIV)
All 17 GeneXpert machines have been installed and running for examination of MDR-TB suspects and TB suspects from PLHIV 3835 examinations were conducted, 1881 and 260 TB positive cases were found among MDR-TB suspects and people living with HIV, respectively, during APA3. Among them, 743 are Rif-resistant TB cases and 1398 are Rif-sensitive TB cases.
Challenges to Laboratory expansion and Xpert implementation:
1. Under-utilization of Xpert, due to low referral from peripheral health care centers (puskesmas), lack of screening and referral of HIV-positive presumptive TB cases and weak referral systems for patients and/or sputum samples in the three reference laboratories
2. Delays in Xpert roll-out, due to repeated stock out of cartridges and weak coordination between procurement and distribution of Xpert cartridges
3. Lack of confidence of clinicians to use the Xpert result for decision to start MDR-TB treatment in RIF resistant cases
4. Limited national human capacity to support Xpert trainings and supervision visits 5. Coverage of EQA for smear microscopy is relatively low: Not all microscopic centers are
consistently (quarterly) cross checked, and one third of these centers are not cross checked at all, or irregularly. There is a need to review the existing EQA system and develop a strategy/roadmap to accelerate, expand and improve the coverage and quality of EQA, including increasing the number of intermediate laboratories.
6. Limited GF and other funding available for renovation of culture/DST labs; available funding covers construction costs only. Most of the prospective provincial reference labs do not yet meet bio-safety standards: C/DST laboratories require complex infrastructures and annual maintenance checks.
7. There are no National Regulations for Laboratory Biosafety or for appropriate occupational health safety. Experience has shown that laboratories are not willing and/or able to implement and sustain the appropriate biosafety due to a lack of regulations/monitoring and proper funding – these are key issues which need to be addressed.
8. NRLs have been appointed by MoH but are not yet fully functioning due to limitation of their capacities
Table 7. Site GeneXpert training and machine installation timeline
On site training and installation period
Laboratory
APA2 • Microbiology Lab UI, Jakarta

33
• Persahabatan Hospital, Jakarta • Moewardi Hospital, Central Java • Hasan Sadikin Hospital, West Java • Soetomo Hospital, East Java
November 2012 • BBLK Surabaya, East Java • BLK Bandung, West Java
December 2012 • Syaiful Anwar Hospital, East Java • Microbiology Lab UGM, Yogyakarta
January 2013 • Labuang Baji Hospital, South Sulawesi • NHCR Lab, South Sulawesi • Sanglah Hospital, Bali
February – April 2013 • Adam Malik Hospital, North Sumatra • Kariadi Hospital, Central Java • BLK Jayapura, Papua • Cilacap Hospital, Central Java • Pengayoman Hospital, Jakarta
Figure 2. Placement of 17 GeneXpert machines across the country

34
Figure 3. Certified DST labs for confirmation of GeneXpert result
Figure 4. Xpert MTB/RIF tests conducted in MDR-TB suspects and PLHIV
Table 8. GeneXpert tests result in 17 sites during APA3
RS RR Neg Ind. Err. Inv. NR TOTAL
Positivity rate
Rif-resistant rate
MDR TB 1162 719 761 13 88 10 7 2760 71% 38% HIV TB 236 24 776 5 32 2 0 1075 25% 9% TOTAL 1398 743 1537 18 120 12 7 3835 58% 35%
13219 102 118
301428
10898
445
222433
765
888
625
0
200
400
600
800
1000
1200
1400
Q2 Q3 Q4 Q1 Q2 Q3 Q4
APA2 APA3
MDR
HIV

35
3. Infection Control The scope of this technical area is small compared with other technical areas. However TB Infection control is fully integrated in other technical areas in particular PMDT, Laboratory strengthening, PPM and TB-HIV. KNCV, FHI360 and WHO were working in this technical area during APA3, focusing on the development of TB infection control site specific SOPs in all existing PMDT sites, finishing renovation of 4 PMDT hospitals and 12 PMDT satellite sites, and assistance to Medical Services, MOH. Besides, socialization of TB IC guidelines as well as on the job training for TB IC was also conducted in PMDT sites.
Key Results
Notable results achieved during APA3 period include:
1. The number of facilities implementing TB IC measures with TB CARE I support increased from 11 to 52.
2. A thousand copies of TB IC manual for health care facilities as a basis for advocacy to Directorate of Medical Care for further policy development were printed and distributed to provinces. This manual is also has been accepted by National Committee for Hospital Accreditation (KARS) as one of reference in conducting accreditation for hospitals. This way, all health hospitals are expected to implement proper TB IC.
3. The generic TB IC SOP that was developed in the same year was adapted to site-specific SOPs in several prisons with TB CARE I assistance.
4. Availability and use of respirators and fit test equipment was ensured in all PMDT sites. 5. In preparation of PMDT satellite facilities, TB infection control measures are used as a
basic requirement for assessment and recommendation for improvement. By focusing on the managerial and administrative control (using simple check lists for assessment and also recommendation of improvement), it proved that the approach contributed to speeding up the decentralization of MDR TB patients to the nearest health facilities. As a result, during APA 3, 375 PMDT satellites are operational.
4. Programmatic Management of Drug Resistant TB (PMDT)
TB CARE I is highly committed to supporting the NTP in further scale-up of PMDT in line with the PMDT expansion plan aiming to cover the entire country by the end of 2014. NTP planned to establish PMDT services all together in 27 sites aiming to enroll 1800 MDR TB by the end of 2013. In addition to continue to support the existing 9 PMDT sites (including one site outside of TB CARE I-supported provinces), TB CARE I supported the establishment of PMDT sites in 7 provinces (2 within TB CARE I supported provinces, i.e. West Sumatra and Papua province, and remaining from outside of TB CARE I supported provinces). TB CARE I support for this establishment was:
- Conducting PMDT training for 7 provinces and providing only facilitators for trainings in the remaining 11 provinces, which was financially supported by GF
- Assisting all preparatory activities supported by GF (stakeholder meetings, coordination meetings, POA and SOP development, etc.) within those 18 provinces
- Supporting the implementation and monitoring of e-TB manager at the 9 existing sites plus 7 newly established sites planned in 2013

36
- Providing technical assistance to 11 others provinces
Field visit to a PMDT site during the Clinical Management of Drug Resistant Tuberculosis Course
Key Results 1. There was a 25% increase in number of notified MDR-TB cases compared with the previous
year. 2. The two provinces with biggest population coverage (East and West Java provinces covered
25% of country population) have finalized their long term PMDT plan with TB CARE I support and assistance.
3. Proposal and strategy for PMDT expansion plan 2014-2016 have been approved by GF, giving the supports and opportunities to the country to achieve >40% of estimated DR-TB cases by 2016.
4. SOPs to establish linkage between PMDT and HIV unit have been developed in 5 PMDT hospitals (Adam Malik, Persahabatan, Hasan Sadikin, Moewardi and Saiful Anwar Hospital.
5. TB CARE I has supported 18 prisons and detention centers in Jakarta, West Java, Central Java and East Java to screen 54 MDR suspects resulting in 11 MDR TB confirmed cases (8 inmates were MDR coinfected with HIV). Guideline for MDR Management in the prison setting was finalized and introduced to thirty-three prisons from 6 provinces (DKI Jakarta, West Java, Central Java, East Java, North Sumatra, Banten).
6. TB CARE I supported training of MDR TB Counseling for Health Worker in PMDT Facilities, conducting 2 batches of training for PMDT Referral hospitals in DKI Jakarta (Persahabatan Hospital), Solo (Moewardi Hospital), East Java (Dr. Soetomo Hospital) and South Sulawesi (Labuang Baji Hospital). About 40 ex/patients were trained for MDR TB counseling from 3 PMDT sites, which is expected to assist in providing psychosocial support to MDR TB patients.

37
Figure xx. PMDT expansion map in TB CARE I area
Figure 5. PMDT expansion realization in TB CARE I areas (up to 30 September 2013)
Figure 6. National PMDT expansion plan 2010-2014
West Sumatra
North Sumatra
Jakarta
West Java Central Java
South Sulawesi
Yogyakarta East Java (2 sites)
Papua
West Papua
38
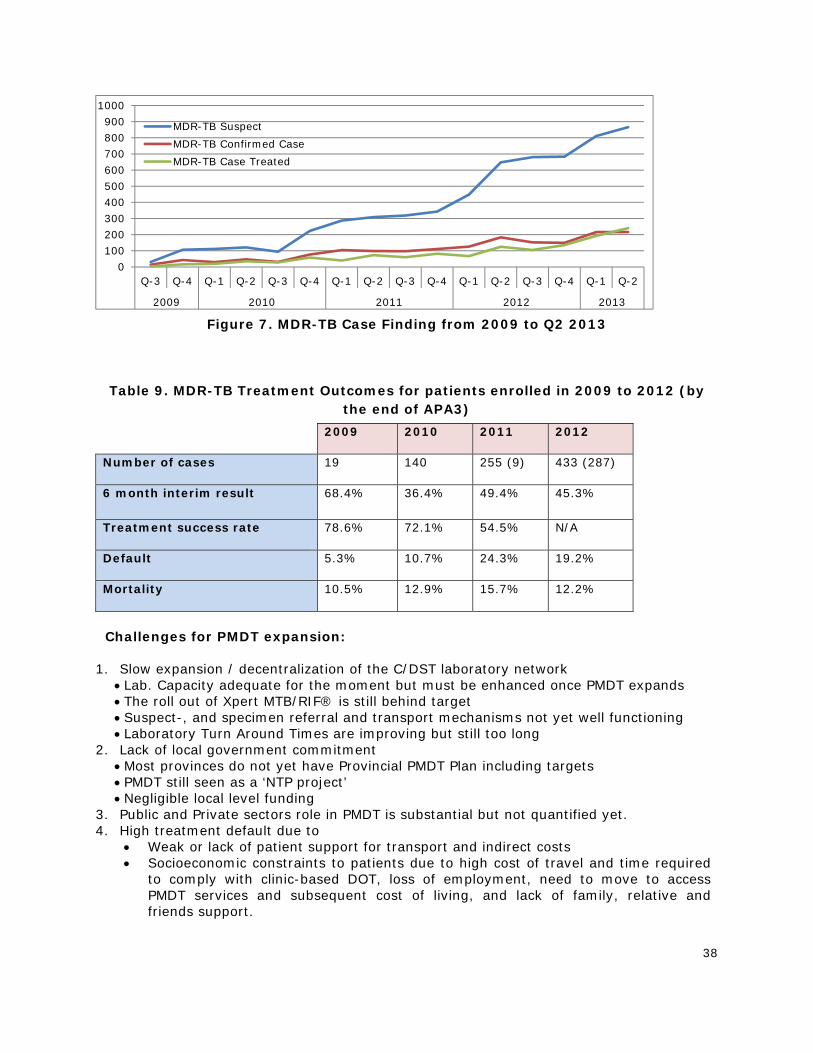
Figure 7. MDR-TB Case Finding from 2009 to Q2 2013
Table 9. MDR-TB Treatment Outcomes for patients enrolled in 2009 to 2012 (by the end of APA3)
2009 2010 2011 2012
Number of cases 19 140 255 (9) 433 (287)
6 month interim result 68.4% 36.4% 49.4% 45.3%
Treatment success rate 78.6% 72.1% 54.5% N/A
Default 5.3% 10.7% 24.3% 19.2%
Mortality 10.5% 12.9% 15.7% 12.2%
Challenges for PMDT expansion:
1. Slow expansion / decentralization of the C/DST laboratory network
Lab. Capacity adequate for the moment but must be enhanced once PMDT expands The roll out of Xpert MTB/RIF® is still behind target Suspect-, and specimen referral and transport mechanisms not yet well functioning Laboratory Turn Around Times are improving but still too long
2. Lack of local government commitment Most provinces do not yet have Provincial PMDT Plan including targets PMDT still seen as a ‘NTP project’ Negligible local level funding
3. Public and Private sectors role in PMDT is substantial but not quantified yet. 4. High treatment default due to
Weak or lack of patient support for transport and indirect costs Socioeconomic constraints to patients due to high cost of travel and time required
to comply with clinic-based DOT, loss of employment, need to move to access PMDT services and subsequent cost of living, and lack of family, relative and friends support.
0100200300400500600700800900
1000
Q-3 Q-4 Q-1 Q-2 Q-3 Q-4 Q-1 Q-2 Q-3 Q-4 Q-1 Q-2 Q-3 Q-4 Q-1 Q-2
2009 2010 2011 2012 2013
MDR-TB SuspectMDR-TB Confirmed CaseMDR-TB Case Treated

39
5. No systematic approach to identify poor treatment compliance and to develop corrective actions to solve these problems This will be addressed through regular analysis of patient compliance and quarterly problem analysis (early warning system). Secondly TB CARE I through technical assistance will support engagement of CBO’s and FBO’s to intensify the MDR-TB patient support at community level. Thirdly TB CARE will step up involvement of ex-patients for peer support.
6. Proportion of patients classified as retreatment is lower than expected cases
5. TB/HIV
FHI 360 had the overall technical lead on this technical area. There were two major areas in TB-HIV collaboration supported by TB CARE I:
1. The well functioning referral system between HIV and TB units, by ensuring that:
• All MDR-TB patients are tested for HIV • All TB patients who are suspected for HIV are tested for HIV. Confirmed HIV positive
cases are referred for ART • All HIV patients are screened for TB and referred for TB treatment if found positive • All HIV patients with confirmed TB are referred to MDR-TB diagnosis
2. TB CARE I supported TB-HIV and PMDT linkage within all TB CARE I supported PMDT sites by strengthening the management and follow up of TB-HIV and MDR-TB according to national guidelines and ensuring that:
• All TB-HIV patients with confirmed TB/ MDR-TB are enrolled on TB/ PMDT treatment and start ART as soon as possible
• TB treatment of TB-HIV patients is observed regularly and follow up is done according to national guidelines to ensure the high treatment success rate
Key Results • Isoniazid Preventive Therapy (IPT) for people living with HIV is not a policy in Indonesia,
yet. TB CARE I provided technical assistance to NTP and NAP during piloting implementation of IPT in four hospitals (Cipto Mangunkusumo, Persahabatan, Hasan Sadikin, and Marzoeki Mahdi). 205 participants were provided with IPT, of those: 167 (81%) completed regimen; 2 (1%) died; 7 (3%) stopped INH because of severe side effects; 24 (12%) defaulted; 1 (0.5%) failed (have TB); 4 (2%) stopped INH because of other reasons. All the results and lessons learned during initial IPT were used by NTP and NAP for developing the IPT policy
• TB-HIV facilitators in 27 provinces already being trained in 3 batches of ToT. These facilitators in the future can train health staffs in their provinces.
• SOPs to establish linkage between PMDT unit and HIV unit have been developed in 5 PMDT hospitals (Adam Malik, Persahabatan, Hasan Sadikin, Moewardi and Saiful Anwar Hospital)
• In PMDT hospitals, TB-HIV linkage already established. They have SOPs for diagnosing TB among HIV patients using GeneXpert and also for TB-HIV co-infected patients that are MDR TB suspects to be sent to GeneXpert Laboratory for MDR TB diagnosis. TB CARE I supported NTP and NAP to further introduce GeneXpert for TB/MDR TB diagnosis among HIV patients (in TBCARE I areas). TBCARE I also expanded screening for TB / MDR by creating linkages between the ART units and DOTS/PMDT unit in existing PMDT hospitals (Persahabatan, Moewardi, Hasan Sadikin, Syaiful Anwar, Soetomo, Jayapura). SOP for the linkage is still being developed.

40
Challenges • Some doctors in HIV care are still using the old ART guideline. TB CARE I will work
closely with NAP to disseminate the new ART guideline. • Coverage of HIV testing among TB patients is still low, TBCARE I has been working
closely with NTP to disseminate Permenkes 21/2013. • These two challenges will be solved in 75 districts implementing the Strategic Use of
ART, where all TB patients should be tested for HIV and all TB who have HIV should receive ART regardless of CD count level. This program will be implemented in 2014 and TB CARE I will strongly support the implementation in 55 districts, as indicated in APA 4 work plan
• The use of Xpert MTB/Rif to diagnose TB and Rifampicin resistance among PLHIV in PMDT hospitals is under utilized, let alone the use of Xpert in other ART hospitals. TB CARE I will promote the use of Xpert and link ART hospitals (those not yet involved in PMDT) to laboratories providing Xpert MTB/Rif service.
• There are barriers to scale up IPT. TBCARE I will support NTP and NAP for scaling up of IPT implementation.
6. Health System Strengthening (HSS)
In the health systems strengthening (HSS), TB CARE I (KNCV, WHO, MSH) supported the following areas: 1. Human resource development (HRD):
Support PMDT expansion and support to Leadership and Program Management Training in low DOTS performance provinces and districts. Technical assistance objectives include: a) Review existing training modules on TB-HIV, Pediatric TB and Laboratory using comprehensive training assessment checklist; b) Review progress on preparation of Provincial training team; c) Develop tools for MOH HRD department and NTP HRD unit to conduct mentoring to provincial team on TB HRD; d) Develop curricula for Provincial training coordinators (PTC) capacity building
2. ACSM Continue support capacity building and follow-up mentoring in TB CARE I supported provinces in order to increase local commitment to TB control program
3. TB Financing The project’s TB financing activities in APA 3 continued to focus on assisting the NTP to implement its sustainable financing strategy developed in APA2. The proposed activities and the relationships with the elements of the strategy are shown in Figure 1. The main elements of the project’s technical assistance plan are to assist NTP in developing a detailed roadmap, implement the elements of that roadmap, and monitor progress.
4. GFATM Support 5. Joint External Monitoring Mission (JEMM). TBCARE I supported planning and
implementation of the JEMM conducted in February 2013

41
Figure 8. Provincial and district health staffs participating in Advanced Course for DOTS
Acceleration (ACDA) training
Key Results JEMM TB CARE I contributed to successful preparation and implementation of the Joint External Monitoring Mission (JEMM) through various forms of support such as coordination, providing interpreters, transportation, and extensive technical assistance -concerning PMDT, TB financing, logistics, PPM (Public Private Mix), etc. during the mission. The JEMM team consisted of 21 international experts, 44 experts from the country STOP TB partners, non-governmental organizations, and the NTP. The report was finalized in March 2013 and the recommendation of the report formed the basis for the development of the request for renewal of the Global Fund Single Stream Funding (GF SSF) including development of the TB CARE I APA4 workplan and budget. TB Financing
‐ TB CARE I facilitated a national policy workshop on TB financing through government budgets and/or insurance as well as an international workshop on sustainable financing for TB that was attended by representatives from Myanmar, Thailand, Malaysia, Laos, Vietnam, The Philippines and China.
‐ TB CARE I assisted the MOH to prepare National Exit Strategy Guidelines that were widely circulated and presented at the national TB Monitoring and Evaluation meeting.
‐ Development and use of tools for costing TB and MDR-TB services and for estimating the economic burden of TB. These tools are being used by NTP and MOH for advocacy. Global Fund Phase 2 Renewal Process and Financial Management TB CARE I has successfully assisted PR MoH in the Phase 2 proposal development and grant negotiations for Grant Renewal Phase 2. All special terms & conditions and Conditions Precedent are now adequately addressed. TB CARE I contracted a Financial Management Expert to assist PR MoH to advise on the improvement of financial management. Within 6 weeks, the contracted expert delivered a comprehensive plan and budget for strengthening the financial management of the GF

42
principal recipient and sub-recipients. Implementation of this plan will be supported by TB CARE I and GFATM (Phase 2).
7. Monitoring & Evaluation, Surveillance and OR WHO coordinated the technical area of M&E, Surveillance and Operational Research. Implementing partners responsible for activities in this area are: WHO, KNCV, FHI360, and MSH. Activities focused on several areas as following: 1) Development of TB information system:
TBCARE continued assistance to support a fully functional integrated information system (SITT), linking activities on one platform to produce accurate information on a continuous pro-active basis for all levels of the health system, to be used for strategic interventions and programmatic decision-making. TBCARE I also assisted scaling up of e TB Manager in all new PMDT sites and provided human resources in selected sites to ensure timely and accurate data entry.
2) M&E capacity building 3) Survey and surveillance
TB CARE I supported NTP in National TB Prevalence Survey, MDR-TB surveillance among TB patients through implementation of sentinel MDR-TB surveillance as an input to routine MDR-TB surveillance system, and assisted NTP for TB-HIV surveillance system implementation.
4) OR Activities in this area also include the completion of ongoing researches in batch 7-8 and implementation of new researches proposed in APA2 (batch 9). Batch 7-8 consists of research in topics of MDR-TB, TB/HIV, Pediatric TB, ACSM and TB management by private practitioners. Support will be provided until the researches are disseminated.
Key Results TB information system development and implementation
• TB CARE I assisted the M&E team of NTP together with a selected software developer to create software for Integrated TB Information System (SITT phase 2). This assistance will continue in APA4 for implementation of phase 2. The software was introduced to Provincial TB managers in May and July 2013. At the national level, trainer team consisted of TB CARE I partners (FHI 360, KNCV, WHO) and an M&E team of the NTP was established. This training team will assist Provincial TB managers to prepare the District TB managers for the official implementation of SITT phase 2 starting from January 2014.
• SITT phase 1 has been implemented in 33 provinces, with 88% of districts across the country now utilizing it to report of TB data since its introduction in June 2012. However, challenges were found during the process:
• Based on lessons learned during transition from excel-based register to SITT phase 1, the critical point during the transition from SITT 1 to SITT 2 will be in adoption of the system at district level. Using SITT phase 2 will change the overall data collection process. Therefore, proper mentoring and continued technical assistance to district TB managers should be assured to help them in the transition process.
• TBCARE supported the review of the National TB Guidelines in line with WHO revised definitions and reporting framework for TB was released. These will impact the implementation of SITT, therefore TB CARE I will continue assistance to ensure the smooth transition of SITT phase 2.

43
Figure 9. TB CARE I staff assisting provincial TB managers in SITT assistance and
consultation session National TB Prevalence Survey (NTPS) TB CARE I consultants provided technical assistance to prepare the data management system, including the IT systems. A designated full time data management staff for NTPS joined in May 2013. TB CARE I provided successful assistance to NTP for the National TB Prevalence Survey (NTPS) laboratory procurement for 26 items of equipment and consumables that was concluded only in 4 months. NTPS was officially launched on April 14, 2013. The process and progress of NTPS is closely monitored by the Global Task Force on TB prevalence survey through Dr. Ikushi and team. To date, 38 clusters had finished data collection, 12 clusters had their smear microscopy results, 9 clusters had their GeneXpert results and 7 clusters had their culture results. This survey included a sample of 11,947 persons which comprised 88.1% of the eligible population. Operational Research Five operational research projects were supported and assisted by TB operational research group and TB CARE I. Topics include:
validation of the pediatric TB scoring chart for diagnosis of TB in children, Factors influencing low MDR-TB treatment coverage in Persahabatan hospital,
Jakarta, Indonesia, TB and HIV collaboration model: An implementation in Hasan Sadikin Hospitals, Association between Credit Points (PCP) awarded to Private Practitioners and
participation in TB Cases Finding in Denpasar, Bali Indonesia Health Education Intervention Delivered by Mobile Telephone Short Message Service
(SMS) to Improve Adherence of TB Patients in Central Java Hospitals, The OR Batches 7-8 were completed and results have been disseminated. One of the researches has resulted in an article that has been accepted by an international journal. TB

44
CARE I assisted in developing the guideline for a national ‘’Call for proposals’’ and will be used by NTP for OR funded by GF SSF phase 2.
8. Drug supply and management The emphasis in drug supply and management has moved from immediate drug availability issues to longer-term initiatives to enhance best practice throughout the supply chain. In summary, these included promoting good storage practice, systems development, integrated logistics initiatives between the programs and enhanced staff capacity building, using updated support materials. Priority was targeted to national level support, PMDT sites, and TB sites using FLD.
Key Results • During APA3 there were no stock outs of FLD and SLD reported at central level and at
MDR-TB Referral hospital level. • e-TB Manager is being implemented in all PMDT sites system, providing valid,
consistent, and accurate data on SLD stocks in sites equipped with data manager. All PMDT sites have been trained in management of SLD to ensure availability of stocks.
• Logistics guidelines and modules for training on logistic management have been updated and finalized as reference documents for logistic management in Indonesia.
• TB CARE I assisted with development of the Procurement and Supply Management Plan for Global Fund Phase 2 (Pharmaceutical, Health product, Health equipment, services cost and non health products) with a total budget of more than USD 11.000.000.
• TB CARE I in collaboration with JSI, and BINFAR conducted warehouse assessments in all TB CARE I supported provinces identifying major issues to be followed up in APA4. A Central Warehouse Assessment report was developed.
• TB CARE I collaborated with USP to finalize SOPs for drug QA. These SOPs will be implemented in APA4.
Challenges:
• Incoming shipment of SLD TB despite high stock levels in the country. • SLD fore casting needs to be improved, to be based on realistic achievement of
targets. There is a disconnect between reports (of drug stock/consumption) and placement of orders for pharmaceuticals resulting in over supply and possible expiry of large quantities of SLD.
• FEFO is often not followed at the district or facility level. • E-TB manager issues: In sites without a dedicated data officer, data quality and
availability is problematic, in particular timely updating of information on SL drug stocks and usage.
• Frequency and quality of data analysis and reporting does not seem to be adequate and timely. Action not taken on data that are available. Stock monitoring and reporting frequency needs to be increased (from 6 monthly to quarterly or monthly).
• Partners and NTP to look more closely at the data being captured. An interdisciplinary team (PMDT-PSM) supported by TBCARE will be established to conduct monthly monitoring of program data and quarterly analysis and updating of drug stocks, usage and shelf life including adjustments of drug need forecasts.