tax competition and foreign direct investment · tax competition and foreign direct investment 5...
TRANSCRIPT

No 2003 – 17December
Tax Competition and Foreign Direct Investment_____________
Agnès Bénassy-QuéréLionel Fontagné
Amina Lahrèche-Révil
Tax Competition and Foreign Direct Investment_____________
Agnès Bénassy-QuéréLionel Fontagné
Amina Lahrèche-Révil
No 2003 – 17 December

Tax Competition and Foreign Direct Investment
3
TABLE OF CONTENTS
SUMMARY..............................................................................................................................................4
ABSTRACT..............................................................................................................................................5
RÉSUMÉ..................................................................................................................................................6
RÉSUMÉ COURT....................................................................................................................................7
1. INTRODUCTION ...........................................................................................................................8
2. EMPIRICAL STRATEGY.............................................................................................................11
2.1. FDI data ......................................................................................................................................112.2. Tax variables ..............................................................................................................................112.3. Control variables .......................................................................................................................122.4. Econometric methodology ......................................................................................................14
3. BASELINE ESTIMATION RESULTS ...........................................................................................14
4. TAX COMPETITION...................................................................................................................19
4.1. Tax schemes ...............................................................................................................................194.2. Asymmetries ..............................................................................................................................224.3. Non linearities............................................................................................................................23
5. CONCLUSION.................................................................................................................................26
APPENDIX.............................................................................................................................................28
BIBLIOGRAPHY...................................................................................................................................31
LIST OF WORKING PAPERS RELEASED BY CEPII ..........................................................................34
CEPII, Working Paper No 2003 - 17
4
TAX COMPETITION AND FOREIGN DIRECT INVESTMENT
SUMMARY
The tax competition literature has long been stating that increasing international integrationmight impose a growing pressure on tax policies, as increasing taxes on a mobile base (suchas capital) in one country creates an incentive for tax payers to relocate abroad. Because taxbase relocation is proportionally more important in small countries than in large ones, thisliterature further shows that small countries have stronger incentives than large ones to cuttaxes, and that they can initiate a “race to the bottom”.
However, perfect capital mobility does not necessarily mean high sensitivity of capitalmovements (and especially FDI) to tax differentials. In particular, imperfect competitionmodels show tax competition to be consistent with persistent tax discrepancies: trade costsinduce a home-market bias if they combine with scale economies, leading multinationalfirms to locate in the largest countries. Location incentives are consequently higher in“large” countries, which can then impose higher tax rates than “small” countries withoutloosing attractiveness. Such conclusions are reinforced in the light of the new economicgeography literature, which points out that, due to size effects and agglomerationeconomies, corporate tax competition need not lead to a “race to the bottom”, becauseattractive countries might exploit their location rent to maintain higher taxation rents.
In this paper, we empirically explore the sensitiveness of foreign direct investment (FDIthereafter) to tax differentials across countries. The analysis is run on bilateral FDI flowsacross 11 OECD countries over the 1984-2000 period, using panel econometrics. Theempirical framework is a gravity equation for FDI, and taxation is identified by fourdifferent variables (namely, statutory, ex-post effective, and ex-ante average and marginaltax rates).
We show that high relative corporate taxation does discourage FDI inflows, even whengravity factors and the provision of public goods are controlled for. Therefore, althoughmarket potentials do matter, corporate tax differentials also play a significant role in drivingFDI flows. This result can be qualified in two ways.
First, this impact is not symmetric to the sign of tax discrepancies: while lower tax rates inthe recipient countries fail to significantly attract FDI, higher taxes tend to discourage newFDI inflows. Second, the impact of positive tax differentials is not homogeneous regardingthe tax scheme in operation in the investing country. In total, while narrow tax differentialsdo not much discourage inward FDI, large tax discrepancies produce proportionally moreimportant FDI outflows.
These results bear several policy implication. First, although tax differentials do matter forFDI flows, this should not lead to a “race to the bottom”, because market potential andpublic investment also matter, and because FDI reacts asymmetrically to positive and to
Tax Competition and Foreign Direct Investment
5
negative tax differentials so that the incentive to cut taxes essentially falls on high taxcountries. Second, because there is an asymmetry in FDI stemming from countries applyingexemption or credit to repatriated profits, the incentive for tax competition should dependon the tax schemes in investing countries: FDI is discouraged by higher taxes elsewherewhen the investing country applies an exemption scheme, but not when a credit scheme isoperated.
ABSTRACT
Using a panel of bilateral FDI flows for 11 OECD countries over 1984-2000, we showthat, although agglomeration-related factors are strong determinants of FDI, taxdifferentials also play a significant role in understanding foreign location decisions. Wefurther investigate non-linearities in the impact of tax differentials, and explore the role oftax schemes. We show that the reaction of FDI inflows to tax differentials is non-linear: itdepends on the magnitude of the tax gap, on the sign of this gap, and on the nature ofbilateral tax schemes in operation (credit vs. exemption). Our results are consistent with theimperfect competition literature which underscores the possibility of tax differentials acrosscountries in equilibrium.
J.E.L. classification: F21, H25, H87Keywords: Tax competition, Foreign Direct Investment, corporate tax, OECD
CEPII, Working Paper No 2003 - 17
6
CONCURRENCE FISCALE ET INVESTISSEMENT DIRECT ETRANGER
RÉSUMÉ
La littérature sur la concurrence fiscale a longtemps conclu que l’intégration internationaledevait limiter l’autonomie des politiques fiscales, puisque les bases mobiles (comme lecapital) sont incitées à se délocaliser lorsque la fiscalité augmente dans un pays. Et dans lamesure où la délocalisation des bases fiscales est proportionnellement plus importante dansles petits pays que dans les grands, il apparaît en outre que les petits pays sont davantageincités à réduire les taux de taxation, et qu’il peuvent donc mettre en place une course au« moins disant fiscal » .
Cependant, la mobilité parfaite des capitaux n’implique pas nécessairement une fortesensibilité des flux de capitaux (et en particulier des investissements directs étrangers – lesIDE) aux écarts de taux. En particulier, les modèles de concurrence imparfaite montrent quela concurrence fiscale peut s’accompagner d’écarts de taux d’imposition persistants : lescoûts de transport sont à l’origine d’un biais en faveur du marché domestique dès lors qu’ilsse combinent à des économies d’échelle, ce qui conduit les firmes multinationales às’implanter dans les grands pays, plus attractifs, et qui peuvent donc imposer des taux defiscalité plus élevés que les « petits » sans perdre de capitaux. Ces conclusions convergentavec celles de la nouvelle économie géographique, qui souligne que la concurrence fiscaleen présence d’économies d’agglomération ne conduit pas nécessairement à une course au« moins disant fiscal », les pays attractifs pouvant exploiter leurs rentes de localisations etmaintenir des taux de fiscalité élevés.
Dans cet article, on étudie empiriquement la sensibilité des flux bilatéraux d’IDE aux écartsde taux d’imposition des sociétés (IS) entre pays. L’analyse porte sur 11 pays de l’OCDE,sur la période 1984-2000. Les flux d’IDE sont expliqués par une équation de gravité(estimée en panel) dans laquelle on introduit quatre mesures alternatives de fiscalité(nominale, effective ex post, effective et marginale ex ante).
On montre qu’une fiscalité sur les sociétés relativement élevée décourage les entrées d’IDE,même lorsque les variables de gravité et la fourniture de biens publics sont prises encompte. Par conséquent, bien que les potentiels de marché jouent un rôle, l’IS est unélément significatif expliquant les flux d’IDE. Ce résultat doit cependant être nuancé auregard de deux éléments.
D’abord, cet effet est asymétrique et dépend du signe de l’écart de taux : des taux d’ISmoins élevés dans les pays récepteurs n’attirent pas l’IDE de manière significative, tandisque des taux plus élevés tendent à décourager les nouvelles entrées d’IDE. Ensuite, l’impactde différentiels de taux dépend du régime fiscal en place dans les pays d’origine(crédit/exemption). Enfin, tandis que de faibles écarts de taux ne découragent pas l’IDE,des écarts élevés produisent des flux d’IDE proportionnellement plus importants.

Tax Competition and Foreign Direct Investment
7
Ces résultats ont plusieurs implications de politique économique. D’abord, bien que l’ISjoue un rôle dans la détermination des flux d’IDE, il est peu probable qu’il conduise à unecourse au « moins disant fiscal », car le potentiel de marché et l’investissement publicjouent un rôle important, et car l’IDE réagit de manière asymétrique aux écarts de tauxnégatifs et positifs, de telle sorte que les incitations à réduire la fiscalité pèsent surtout surles pays à forte imposition. Ensuite, en raison de l’asymétrie de comportement des IDE enfonction du régime fiscal appliqué par le pays investisseur, l’incitation à la concurrencefiscale dépend de la composition géographique des sources d’IDE : l’IDE est réduit par unefiscalité plus élevée dans le pays d’accueil lorsque le pays investisseur applique un systèmed’exemption, mais non lorsqu’il applique un système de crédit.
RÉSUMÉ COURT
Nous étudions les flux bilatéraux d’investissements directs étrangers entre 11 pays del’OCDE sur la période 1980-2000. Bien que les facteurs d’agglomération soient desdéterminants importants de l’IDE, il apparaît que les écarts de fiscalité jouent un rôlesignificatif dans la compréhension des décisions d’investissement. Nous montronségalement que la réaction des IDE entrants aux écarts de taux n’est pas linéaire : elledépend de l’ampleur du différentiel de fiscalité, de son signe, et de la nature des régimes dedouble imposition en vigueur (crédit vs. exemption). Nos résultats sont cohérents avec lalittérature de concurrence imparfaite, qui souligne la possibilité des écarts de tauxpersistants soient une situation d’équilibre.
J.E.L.: F21, H25, H87Mots-clés: concurrence fiscale, investissement direct étranger, impôt sur les sociétés,
OCDE
CEPII, Working Paper No 2003 - 17
8
TAX COMPETITION AND FOREIGN DIRECT INVESTMENT*
Agnès Bénassy-Quéré, University of Paris X (THEMA) and CEPII,Lionel Fontagné, CEPII and TEAM
Amina Lahrèche-Révil, CEPII, TEAM and CRIISEA #
1. INTRODUCTION
The tax competition literature has long been stating that increasing international integrationmight lead to a growing pressure on tax policies (see Wilson, 1999, for a survey): for agiven provision of public goods, increasing taxes on a mobile base (such as capital) in onecountry creates an incentive for tax payers to relocate abroad (Tiebout, 1956; Zodrow andMieszkowski, 1986). Conversely, cutting taxes can have limited impact on tax receipts dueto the relocation of tax bases in the home country. Hence, in the Nash equilibrium, tax ratesare set too low compared to their socially optimal level. This is the standard result of the taxcompetition literature. Because tax base relocation is proportionally more important insmall countries than in large ones, this literature further shows that small countries havestronger incentives than large ones to cut taxes, and that they can initiate a “race to thebottom” (Bucovetski, 1991; Wilson, 1991). For instance, perfect international capitalmobility can lead to a zero taxation of capital earnings (Razin and Sadka, 1991).
However the fear of tax competition is justified only if (i) mobile bases do respond to taxcuts through relocation (ii) tax cuts produce a loss in fiscal receipts at least in somecountries, and (iii) this revenue loss needs to be compensated for by a welfare-decreasingtax increase on other, less mobile bases, likely (non-qualified) labor. In this paper, weinvestigate the first point. More specifically, we study the sensitivity of foreign directinvestment (FDI hereafter) to tax differentials across countries.
Perfect capital mobility does not necessarily mean high sensitivity of capital movements totax differentials. This is especially the case for FDI, for a number of reasons.
Firstly, transfer pricing and intra-firm debt contracting allow firms to locate profits wheretaxation is lowest, and to disconnect the location of activity and profit (Hines and Rice,1996). Such practices, which translate into discrepancies in export unit values (seeFontagné et al., 1998) and are directly evidenced by Swenson (2001b), allow profit shiftingto substitute at least partly for capital mobility (see also Gresik, 2001, pp. 808-810, for ashort review of this litterature).
* We are grateful to Thierry Mayer and Daniel Mirza for providing market potential and distance data, and
to Robert Baldwin, Philippe Jean-Pierre, Thierry Mayer, Gaetan Nicomède, Serge Svizzero, CharlesWyplosz and to two anonymous referees for helpful comments on an early draft of this paper. All errorsremain ours.# Mail to Amina Lahrèche-Révil, CEPII, 9 rue Georges Pitard, F-75015 Paris, [email protected].
Tax Competition and Foreign Direct Investment
9
Secondly, a tax increase may not impact on FDI inflows once general equilibrium effectsare accounted for. This is because a fall of the after-tax return in the host country (due to atax increase) induces a rise in the before-tax return through falling domestic investment.The tax increase can even raise FDI inflows from countries applying a credit scheme to thetaxation of repatriated profits, as investors from these countries would enjoy higher before-tax returns while being partially reimbursed of the inflated taxes in the host country(Scholes and Wolfson, 1990).
Thirdly, since Tiebout (1956), it has been recognized that tax bases will move depending onthe combination of taxes and the provision of public goods offered by the various countries.Efficient governments, that raise low taxes while providing a high level of public goods,will be preferred. Among efficient governments, each tax payer will move to the placeproviding the combination closest to his (her) own preferences. Hence, there may not be aclear, negative link between tax rates and FDI inflows.
Finally, imperfect competition models show tax competition to be consistent with persistenttax discrepancies. Indeed, trade costs induce a home-market bias if they combine with scaleeconomies, leading multinational firms to locate in the largest countries (Haufler andWooton, 1999). As a consequence, location incentives are higher in “large” countries,which can then impose higher tax rates than “small” countries: large countries will stayattractive with reasonable tax discrepancies.
The new economic geography literature1 reinforces such conclusions, arguing that
agglomeration forces translate into hysteresis in the location of mobile factors. As aconsequence, mobile factors may be insensitive to limited tax-rate changes if they arelocked in an industrial cluster (Andersson and Forslid, 1999). Tax differentials can surviveeven in a highly integrated economy, since agglomeration creates rents for the mobilefactor that can be taxed (Baldwin and Krugman, 2000, 2002; Ludema and Wooton, 2000).Thus, it is not straightforward whether tax differentials could still matter compared toagglomeration forces.
Given the ambiguous conclusions of the theoretical analysis, there is room for empiricalinvestigation to arbitrate between diverging conclusions. The empirical literature on theimpact of tax discrepancies on FDI has been comprehensively reviewed by Hines (1999)and de Mooij and Ederveen (2001). Estimates of the tax elasticity of FDI vary acrossempirical studies, depending on the geographic coverage of empirical analysis, the timesample, the definition of tax rates and the econometric methodology. According to themeta-analysis by de Mooij and Ederveen (2001) based on 371 individual estimates, thesemi-elasticity of FDI to tax rates varies from –22.7 to +13.2, with a mean of –3.3 or –4.0,depending on whether non significant estimates are included or not into the sample. As faras the elasticity of FDI to tax rates is concerned, it is usually estimated to be negative, withan order of magnitude of about -0.6 on time series samples, while cross-sectional estimatesprovide a wider range of estimates (from –1.0 to -2.8, see Desai and Hines, 2001).
1 See Krugman (1991), Krugman & Venables (1996) for seminal papers.

CEPII, Working Paper No 2003 - 17
10
These empirical results have been qualified in several ways. For instance, the tax elasticityis often shown to differ for the various components of FDI: reinvested earnings versusdirect transfers (Hartman, 1984, Slemrod, 1990, for instance) or mergers and acquisitionsversus new plants and plant extensions (Swenson, 2001a). Alternatively, Desai and Hines(2001) show US FDI to be sensitive not only to profit taxes, but also to indirect (non-income) taxes, opening the way for a wider definition of tax competition.
A series of papers also underline the potential impact of tax schemes, as the foreign incomeof multinationals can be affected by double taxation which arises when the investingcountry sets residence-based taxes while the recipient country applies a source-basedsystem. In order to avoid this problem, the investing country can apply a credit or anexemption scheme. The impact of such tax schemes on international capital movements hasbeen theoretically studied by Hamada (1966) and Musgrave (1969), the latter arguing thatcredit schemes tend to increase FDI outflows. On the empirical side, investigation is not soclear about the empirical relevance of such mechanisms. For instance, Slemrod (1990) failsto find a significant difference in the foreign investment behavior of firms according totheir domestic tax scheme, when investment in the US is considered. Auerbach and Hasset(1993) show that investors from foreign tax credit countries did not react to the Tax ReformAct of 1986 in the US, contrasting with Swenson (1994) who evidences some reactivity offirms from tax credit countries to changes in the after-tax cost of capital after the 1986reform. Based on aggregated multinational data, Gropp and Kostial (2000) find that creditcountries invest less abroad than exemption ones. However their use of an additive dummyto characterize double taxation schemes does not allow to conclude on differences in taxsensitiveness of FDI linked to tax schemes.
Finally, some studies find no or negligible impact of taxes on FDI, which they explain bythe leading role of agglomeration economies compared to tax incentives (Wheeler andMody, 1992, Head et al., 1999). For instance, Hubert and Pain (2002) fail to find anysignificant impact of tax-related determinants for German FDI to the EU, whereasagglomeration economies and public expenditure are shown to matter.
In this paper, we estimate the semi-elasticity of FDI to corporate tax differentials, forbilateral FDI flows across 11 OECD countries over the 1984-2000 period. Morespecifically, we use panel data econometrics to relate bilateral FDI flows to bilateral taxdifferentials over time. This strategy of estimation allows to work on a large number ofobservations and to provide results that are not country-specific. Thus, this paper departsfrom a series of studies that focus either on aggregate FDI, or on bilateral inflows oroutflows for a single country. In addition, it explores possible non-linearities in the effect oftax differentials on FDI, as a result of tax schemes or imperfect competition.
Section 2 details our estimation strategy. Section 3 presents the estimation results togetherwith some robustness analysis. Non-linear effects of tax differentials are analyzed inSection 4, and Section 5 concludes.

Tax Competition and Foreign Direct Investment
11
2. EMPIRICAL STRATEGY
2.1. FDI data
Our sample includes nine European countries2, plus Japan and the United States, and coversthe 1984-2000 period with an annual frequency.
The endogenous variable is the logarithm of the bilateral FDI inflow from country i (theinvestor) to country h (the host), measured at constant price and excluding reinvestedearnings (source: Eurostat).3
2.2. Tax variables
Measuring tax rates is not an easy task, and there is now an extensive empirical literature onthis issue. The most obvious and readily available measure is the statutory tax rate.However this first measure can be misleading since a high statutory rate in one country canbe compensated by a broader tax base.
4 The apparent tax rate, which is the ratio between
observed receipts and the observed tax base at the individual or at the aggregate level,accounts for such compensation. This measure bears the additional advantage of accountingfor any possible exemption. It nevertheless has the drawback of being an ex post measure ofthe tax burden: if multinational firms locate in tax-friendly countries, taxation could appearheavier ex post than ex ante in those countries (Hines and Rice, 1994). In addition,Nicodème (2001) shows the apparent corporate tax rate to be cyclical, which means thatchanges in apparent tax rates could be endogenous to FDI inflows.
To tackle these difficulties, a series of papers inspired by King and Fullerton (1984) havecomputed effective, marginal or average tax rates on the basis of tax codes and of a set ofassumptions especially concerning the financing of investment (retained earnings, debt orequity). Compared to statutory or ex post measures, these ex ante measures correctly reflecttax incentives, and are better candidates to gauge the impact of taxation of FDI decisions byfirms. This paper uses the most recent data computed by Devereux and Griffith (2003), whoprovide calculations of average and marginal ex ante tax rates based on this methodologyfor 16 OECD countries over the 1982-2001 period.
According to Devereux et al. (2002), discrete location decisions by firms should beinfluenced by the statutory and/or the average effective tax rate, whereas the decision toincrease existing capital in one country should be influenced by the marginal effective taxrate. Given that macro-economic FDI flow data do not allow to disentangle between bothFDI motives, we run our estimates with each tax measure successively.
2 EU12 less Portugal and Greece, Belgium and Luxembourg being treated together.
3 Except for the US and Japan, for which there were too many missing observations. But the gap in data
definitions is contrelled through the use of fixed-effects in the panels estimates.
4 Indeed, Devereux and Griffith (2002) show that there has been partial compensation between statutory tax
cuts and base broadening in most OECD countries over the 1990s.

CEPII, Working Paper No 2003 - 17
12
When the empirical analysis is run on a single recipient or exporting country, the taxincentive is caught through the tax rate of the partner country. Since we are working on amultinational panel, we use tax differentials between the host and the investor country.
Tax differentials are computed as simple differences between the corporate-tax rates in thehost country (h) and in the investing country (i). This calculation is carried out on a set offour tax variables for the whole time period:
- statutory tax rates (TShit);
- average effective tax rates (TAhit);
- marginal effective tax rates (TMhit);
- apparent effective tax rates (TEhit).
The first three series of tax rates are taken from Michael Devereux’s home page (seeAppendix). The last measure is inspired from Mendoza et al. (1994). It is computed as theratio between corporate tax revenues and the operating surplus, using OECD data. In orderto overcome the possible endogeneity of the apparent tax rate, we also instrument apparenttax differentials with their lagged value or by the statutory tax differential. All variables anddata sources are detailed in the Appendix.
2.3. Control variables
Gravity variables
We use an adapted version of the gravity model. In the latter, bilateral trade flows areexplained by the size of the two countries and by impediments to trade which are generallyproxied by geographic distance. This framework has been applied to FDI flows for instanceby Eaton and Tamura (1994), Wei (2000), Bloningen and Davies (2000, 2002), Stein andDaude (2001, 2003). The gravity framework here is refined by using an original measure ofthe host country market.
When considering a foreign output location, a multinational does not evaluate the size ofthe host domestic market, but also its density, i.e. the concentration of domestic demandaround the main productive centers. The main decision variable is therefore the marketpotential associated to each possible location, i.e. the distance-weighted average of nationalregions. This variable, labeled LPOTht, is inspired from Harris (1954).5 As long as firmsfocus regional demand (as opposed to national demand), they can also select a recipientcountry on the ground of its potentialities in terms of using it as a beachhead for exportingto neighboring countries. For this reason, we also provide an estimate using this latter“enlarged market potential” (LEPOTht) variable in order to catch the importance of regionaldensity (see Appendix for both definitions).
5 Therefore, the market potential accounts for transportation costs supported when shipping output of the
affiliate within the host market.

Tax Competition and Foreign Direct Investment
13
An increase in the market potential is expected to have a positive impact on inward FDI. Itcan be argued that market potential is partly endogenous to FDI. As a robustness check, were-run the estimations while lagging the market potential variable.
Concerning the size of the investing country, we use the traditional GDP measure convertedinto purchasing power standards (LGDPit) in order to cancel out the impact of nominalexchange rate fluctuations: large countries have a greater potential than small countries forinvesting abroad. A positive sign is expected for this variable.
Gravity models underline the role of distance (proxying transportation, transaction or moregenerally information costs) as a crucial determinant of trade flows. However the impact ofdistance on FDI is debated and relies on the dual effect of economies of scale andtransportation costs. Increasing returns place a limit on the efficient number of plants, whiletransportation costs, and more generally all impediments to trade, have the opposite effect(Brainard, 1997). Hence, when plant fixed costs are limited compared to trade costs, amultinational will disseminate its units of production close to its markets, and FDI will be asubstitute for trade: in this case, higher distance between the investor and the host raisesFDI at the expense of trade. However geographic distance also stands for transaction costs,cultural distance, information costs. In this other meaning, distance is as detrimental to FDIas it is to trade. Furthermore, since FDI inflows generally involves additional imports(investment goods, imported inputs), distance can be thought detrimental to FDI justbecause it is detrimental to trade. In this case, trade and FDI are complements rather thansubstitutes (see Fontagné, 1999). In brief, the coefficient on the investor-to-host distancevariable (LDISThi) introduced in the regression could be either positive or negative.
Finally, consistent with a number of studies using gravity equations, a common languagedummy (CLNGhi) is introduced in the analysis. This dummy is designed to catch culturalfactors that significantly contribute to international trade and financial linkages betweencountries, for instance through network externalities.
Other variables
Previous studies have proved relatively hard to evidence a negative impact of relative laborcosts on FDI flows. For instance, Devereux and Griffith (1998) show unit labor costs to benon-significant as determinants of the location choices of US multinationals in theEuropean Union. They explain this result by the insufficiently disaggregated measure ofproductivity which does not reflect the heterogeneity of firms within each industry. Analternative explanation may relate to the cyclical behavior of unit costs. In fact, few authorsinclude cost differentials in the estimations.
6 Here, we successively use bilateral relative
unit labor costs (LULChit, source: OECD) and bilateral real exchange rates in level (LRERhit,source: CEPII-CHELEM) to check for the robustness of our baseline results.
The theoretical literature on tax competition accounts for the provision of public goods thatstems from tax receipts. We explore this by including two variables: the amount of total
6 Young (1999) in an exception, who finds a negative impact of higher aggregated costs in the UK on total
(domestic and foreign) investment in the country.

CEPII, Working Paper No 2003 - 17
14
public expenses in the host country (LPEXPht) and the share of public investment in totalpublic expenses (ISHAREht). The former variable catches the size of the public sector. Thelatter one accounts for the composition of public expenses. We expect a higher share ofpublic investment to be an attracting factor for FDI, as this proxy is likely to be closer to thebuilding of public goods.
2.4. Econometric methodology
Panel estimations are carried out with fixed effects on investors and host countries, withfixed coefficients. Note that the number of fixed effects (20) is much lower than the numberof investor-host couples (110), which in principle allows the distance variable to catchsome of the variance despite it is constant over time.
3. BASELINE ESTIMATION RESULTS
We start with the baseline specification where the FDI flow from country i to country h isexplained by gravity variables as well as tax differentials. The baseline estimation is thefollowing :
hitihhihiiththithit wCLNGLDISTLGDPLPOTTAXLFDI ευααααα +++++++= 54321 (1)
where TAXhit is the general expression for tax differentials between the host and theinvestor; this variable is computed using all four definitions of the tax burden.
The results are provided in Table 1. All coefficients bear the expected sign, and they aregenerally significant.
The market potential has a positive impact on inward FDI. Remind that this effect isobtained through considering not only the domestic market, but also the concentration ofdemand within the country.
As expected, the size of the parent country has a positive impact on its outward investment,which reflects a supply effect, large countries having a greater potential for investingabroad. The coefficient on investor-to-host distance is negative, but non significant atstandard levels of confidence (the p-value is around 7%), confirming the ambiguitybetween the “proximity-concentration trade-off”, which involves FDI to be a substitute fortrade, and the documented complementarity between trade and FDI.
The coefficient on tax discrepancies is negative and highly significant, highlighting theadverse effect of higher corporate tax differentials on FDI inflows. For the statutory taxdifferential, the semi-elasticity is –4.22, meaning that a 1 point rise in the host statutory raterelative to the investor’s one reduces FDI inflows by 4.22%. The semi-elasticity is verysimilar for the average effective tax differential. It is smaller (-2.89) for the marginaleffective tax differential, but much higher for the apparent tax differential (-9.39), adifference that stems from the lower value in absolute level of this measure of taxation.

Tax Competition and Foreign Direct Investment
15
Table 1: Baseline estimation
(1) (2) (3) (4)
Intercept -29.07**[3.97]
-28.10**[3.99]
-27.84**[4.02]
-23.51**[3.70]
Statutory tax differential TShit -4.22**[0.97]
- - -
Average effective tax differential TAhit - -4.23**[.94]
- -
Marginal effective tax differential TMhit - - -2.89**[.72]
Apparent effective tax differential TEhit - - - -9.40**[1.18]
Market potential LPOT ht 2.31**[.61]
2.48**[.61]
2.53**[.62]
4.09**[.59]
Size of investor country LGDPi t 4.23**[0.71]
4.04**[.71]
3.99**[.72]
2.98[.68]
Investor-to-host distance LDISThi -.14[.09]
-.15[.09]
-.15[.09]
-.13[.09]
Common language CLNGhi .61**[.16]
.61**[.16]
.61**[.16]
.55**[.14]
Number of observations - 1163 1163 1163 1307
Adjusted R² - .472 .473 .540 .471
Hausman test - χ²(5)=141.43p=[.000]
χ²(5)=144.86p=[.000]
χ²(5)=187.71p=[.000]
χ²(5)=157.18p=[.001]
F test - F(9,1139)=36.99p=[.000]
F(9,1139)=36.69p=[.000]
F(10,1281)=36.26p=[.000]
F(11,837)=4.794p=[.000]
Breusch-Pagan LM test - χ²(1)= 1321.36p=[.000]
χ²(1)= 1361.01p=[.000]
χ²(1)= 1471.43p=[.000]
χ²(1)= 1346.29p=[.000]
Note : standard errors in brackets. **,* : significant at the 1%, 5% respectively.
In sum, Table 1 shows that, even when imperfect-competition related determinants areintroduced in the estimation, tax differentials play a significant role in the locationdecisions of multinational firms. This result suggests that the fear for tax competition is notcompletely unfounded, as FDI flows do react to tax differentials. However tax differentialscan also compensate for differences in market potentials: according to Column (1)estimates, a host country suffering from a 10% disadvantage in terms of market potential(compared to other host countries) can offset this handicap through a lower statutory taxrate by 5 percentage points.
Several robustness checks are provided in Tables 2a and 2b, concentrating on the averageeffective tax differential which Young (1999) and Devereux and Griffith (2002) point out tobe the most relevant measure for the location decision of a multinational.
7 In Table 2a, two
potential sources of reverse causality are accounted for. In Column (1), the market potentialis lagged to account for a possible impact of FDI on market. The coefficient on the lagged
7 The conclusions of the robustness check are the same for the three other measures of tax differentials.

CEPII, Working Paper No 2003 - 17
16
market potential is highly significant (and positive), and other coefficients are virtuallyunchanged. In column (2), the apparent tax differential is instrumented by its lagged value.In Column (3), it is instrumented by the statutory differential. In both cases, the coefficienton tax differentials remains highly significant, while other coefficients are rather stable.
Column (4) addresses a different issue, by substituting the enlarged market potential (whichtakes into account the market potential of the neighbors of the recipient – see Appendix fordetails) for the market potential of the host. This allows to measure the impact ofmultinational firms focusing region-wide demand. The estimated coefficient on this newvariable is much larger than the one on the host country market potential, while the size ofthe investor country is no longer significant. This is probably due to the fact that bothvariables are collinear by construction, which prevents to catch their respective impact onFDI independently. The coefficients on tax differentials are unchanged however.
Table 2a : Robustness : tracking reverse causality and accounting for enlarged marketpotential
Lagged marketpotential
TE instrumented byTE(-1)
TE instrumented byTS
Enlarged marketpotential
(1) (2) (3) (4)
Intercept -22.25**[4.35]
-20.02**[3.94]
-28.134**[4.23]
-15.07*[6.02]
Average effective tax differential TAhit -4.49**[.94]
- - -4.09**[.93]
Apparent effective tax differential TEhit - -11.57**[1.56]
-14.29**[3.44]
-
Enlarged market potential LEPOTht 5.45**[1.16]
Lagged market potential LPOTh,t-1 2.86**[.65]
- - -
Market potential LPOTht - 4.01**[.61]
2.65**[.65]
-
Size of investor country LGDPi t 3.08**[.77]
2.46**[.72]
3.99**[.75]
1.36[1.16]
Investor-to-host distance LDISThi -.13[.09]
-.13[.09]
-.15[.09]
-.16[.09]
Common language CLNGhi .59**[.16]
.54**[.15]
.67**[.16]
.61**[.16]
Number of observations - 1105 1237 1091 1163
Adjusted R² - .448 .512 .473 .475
Hausman test χ²(5)=98.16p=[.000]
χ²(5)=120.78p=[.000]
χ²(5)=134.11p=[.000]
χ²(5)=178.83p=[.000]
F test F(9,1081)=34.54p=[.000]
F(10,1211)=34.77p=[.000]
F(9,1067)=32.90p=[.000]
F(9,1139)=33.00p=[.000]
Breusch-Pagan LM test χ²(1)=1452.51p=[.000]
χ²(1)=1230.21p=[.000]
χ²(1)=120.78p=[.000]
χ²(1)=866.78p=[.000]
Note: standard errors in brackets. **, * : significant at the 1%, 5% respectively. p refer to p-values.

Tax Competition and Foreign Direct Investment
17
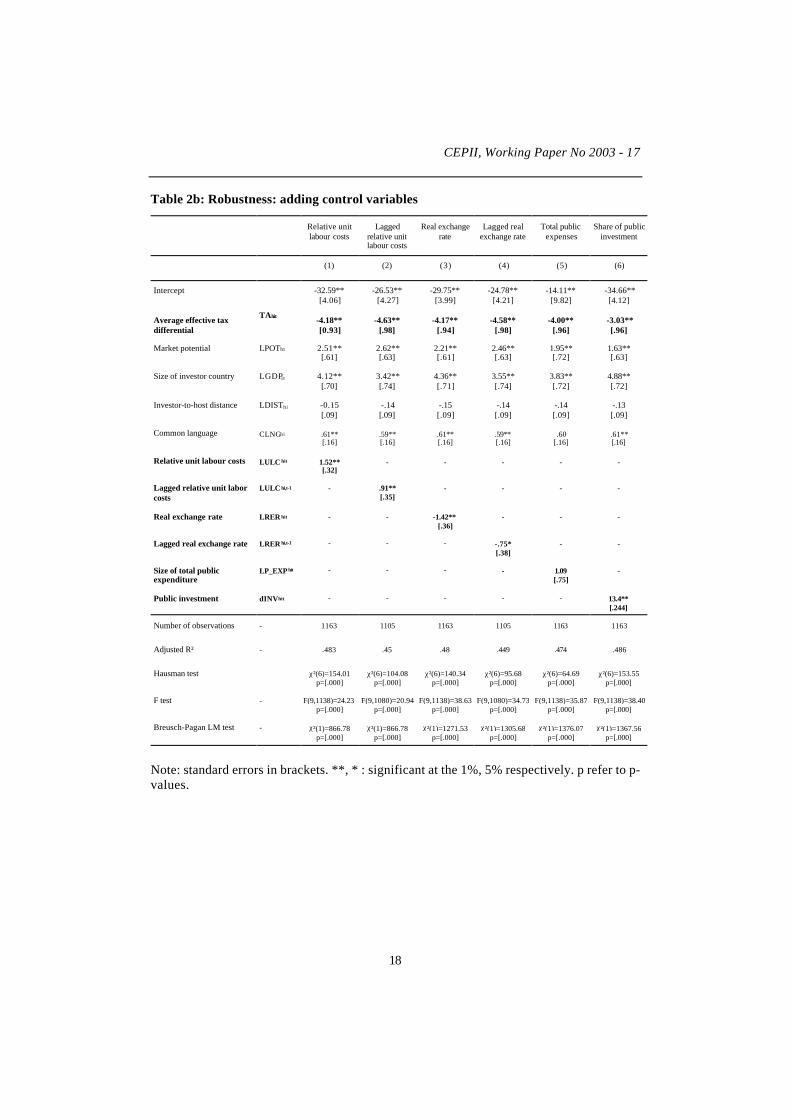
Table 2b investigates the robustness of the results when adding other control variables.Firstly, cost variables, either bilateral relative unit labor costs (Column (1)) or bilateral realexchange rates (Column (3)) are added to the estimated equation. The impact of othervariables, including the tax differential, remains unchanged. As to cost variable, they have asignificant, but counter-intuitive, impact, since higher costs attract more FDI. It can beargued that cost variables are collinear to GDP (and to market potential). One reason maybe the Balassa-Samuelson effect, which links the real exchange rate to GDP per capita, onboth the cross-section and the time-series dimensions. Another potential source ofcollinearity is the cyclical pattern of relative costs stemming from the Phillips curve. A finalexplanation can be that unit labor costs are positively related to the quality of labor. Thislast interpretation cannot be tested here, however. To tackle this potential collinearity, were-run the estimations while lagging relative unit labor costs and real exchange rates. Whilethe results, reported in Columns (2) and (4), are not affected qualitatively, the impact ofcost differentials is much lowered, which seems to confirm our interpretation. Thecoefficient on tax differentials is unaffected.
Secondly, public expense variables are introduced, either through the amount of total publicexpenses (Column (5)) or through the share of public investment in total public expenses(Column (6)).
As to public expenses, our empirical results show that higher public expenses do not impacton the amount of bilateral FDI (the estimated coefficient is not significant). However, whilethere seems to be no scale effect of public expenses, the composition effect appears highlysignificant: a higher share of investment in the host country increases inward FDI flows.This result tends to confirm that a higher provision of public goods increases theattractiveness of a country for FDI, and suggests that higher taxes can be partiallycompensated by an increase in the building up of public infrastructures, consistent withTiebout’s intuition.
Notice that including the composition of public expenditure leads to a weakening of bothagglomeration and tax estimates: the semi-elasticity of FDI to tax differentials is cut byaround 25% (from -4 to –3 approximately), which highlights that a higher tax rate can becompensated for by higher attractiveness in terms of public goods provision. The same istrue as far as market potential is concerned, since the estimated coefficient falls fromaround 2.5 to 1.6.
CEPII, Working Paper No 2003 - 17
18
Table 2b: Robustness: adding control variables
Relative unitlabour costs
Laggedrelative unitlabour costs
Real exchangerate
Lagged realexchange rate
Total publicexpenses
Share of publicinvestment
(1) (2) (3) (4) (5) (6)
Intercept -32.59**[4.06]
-26.53**[4.27]
-29.75**[3.99]
-24.78**[4.21]
-14.11**[9.82]
-34.66**[4.12]
Average effective taxdifferential
TAhit -4.18**[0.93]
-4.63**[.98]
-4.17**[.94]
-4.58**[.98]
-4.00**[.96]
-3.03**[.96]
Market potential LPOTht 2.51**[.61]
2.62**[.63]
2.21**[.61]
2.46**[.63]
1.95**[.72]
1.63**[.63]
Size of investor country LGDPi t 4.12**[.70]
3.42**[.74]
4.36**[.71]
3.55**[.74]
3.83**[.72]
4.88**[.72]
Investor-to-host distance LDISThi -0.15[.09]
-.14[.09]
-.15[.09]
-.14[.09]
-.14[.09]
-.13[.09]
Common language CLNGhi .61**[.16]
.59**[.16]
.61**[.16]
.59**[.16]
.60[.16]
.61**[.16]
Relative unit labour costs LULC hit 1.52**[.32]
- - - - -
Lagged relative unit laborcosts
LULC hi,t-1 - .91**[.35]
- - - -
Real exchange rate LRER hit - - -1.42**[.36]
- - -
Lagged real exchange rate LRER hi,t-1 - - - -.75*[.38]
- -
Size of total publicexpenditure
LP_EXP hit - - - - 1.09[.75]
-
Public investment dINVhit - - - - - 13.4**[.244]
Number of observations - 1163 1105 1163 1105 1163 1163
Adjusted R² - .483 .45 .48 .449 .474 .486
Hausman test χ²(6)=154.01p=[.000]
χ²(6)=104.08p=[.000]
χ²(6)=140.34p=[.000]
χ²(6)=95.68p=[.000]
χ²(6)=64.69p=[.000]
χ²(6)=153.55p=[.000]
F test - F(9,1138)=24.23p=[.000]
F(9,1080)=20.94p=[.000]
F(9,1138)=38.63p=[.000]
F(9,1080)=34.73p=[.000]
F(9,1138)=35.87p=[.000]
F(9,1138)=38.40p=[.000]
Breusch-Pagan LM test - χ²(1)=866.78p=[.000]
χ²(1)=866.78p=[.000]
χ²(1)=1271.53p=[.000]
χ²(1)=1305.68p=[.000]
χ²(1)=1376.07p=[.000]
χ²(1)=1367.56p=[.000]
Note: standard errors in brackets. **, * : significant at the 1%, 5% respectively. p refer to p-values.
Tax Competition and Foreign Direct Investment
19
4. TAX COMPETITION
The first set of estimates strongly confirms the sensitivity of FDI to tax differentials,whatever the definition of tax rates, and the alternative specifications of the empiricalmodel. As long as the international investment behavior of firms leads them to react to taxincentives, there might be room for tax competition. In this section, we provide furtherinvestigations that allow to conclude on the possible shape and outcomes of tax competitionand on policy implications.
Indeed, the literature on tax competition does not limit itself to investigating the impact oftax levels or tax differentials on the location strategies of firms, and consequently on theoptimal tax level a government should set. Three related items are addressed in this section,that contribute to clarify both qualitatively and quantitatively the impact of tax differentialson FDI flows. These are tax schemes; asymmetries according to the sign of taxdiscrepancies; and potential non linearities in the reaction of FDI flows to tax differentialsaccording to the magnitude of these differentials. Once again, the emphasis is put oneffective average tax differentials, but the results are robust to the use of alternative taxmeasures.
4.1. Tax schemes
The literature on the impact of double taxation rules on FDI has been reviewed by Gresik(2001) for the theoretical side, and Desai and Hines (2001) for the empirical part of it. Inorder to avoid double taxation of repatriated profits, tax authorities can adopt two kinds oftax rules. Under credit schemes, multinationals are allowed to deduce taxes paid abroad bytheir foreign affiliates from their domestic tax bill, which de facto means bearing thedomestic tax rate on these profits. Consequently, when a credit scheme is in operation,domestic investors could be less reactive to tax differentials, since they can theoreticallytake no benefit from lower taxes abroad, although they do suffer from higher foreign taxes(since the credit is de facto limited to the amount of taxes due to the domestic taxauthority). Conversely, under exemption schemes, repatriated profits from foreign affiliatesonly bear the foreign-country tax rate, and they are exempted from domestic taxation. Sucha tax rule could provide a strong incentive to locate where taxes are the lowest.
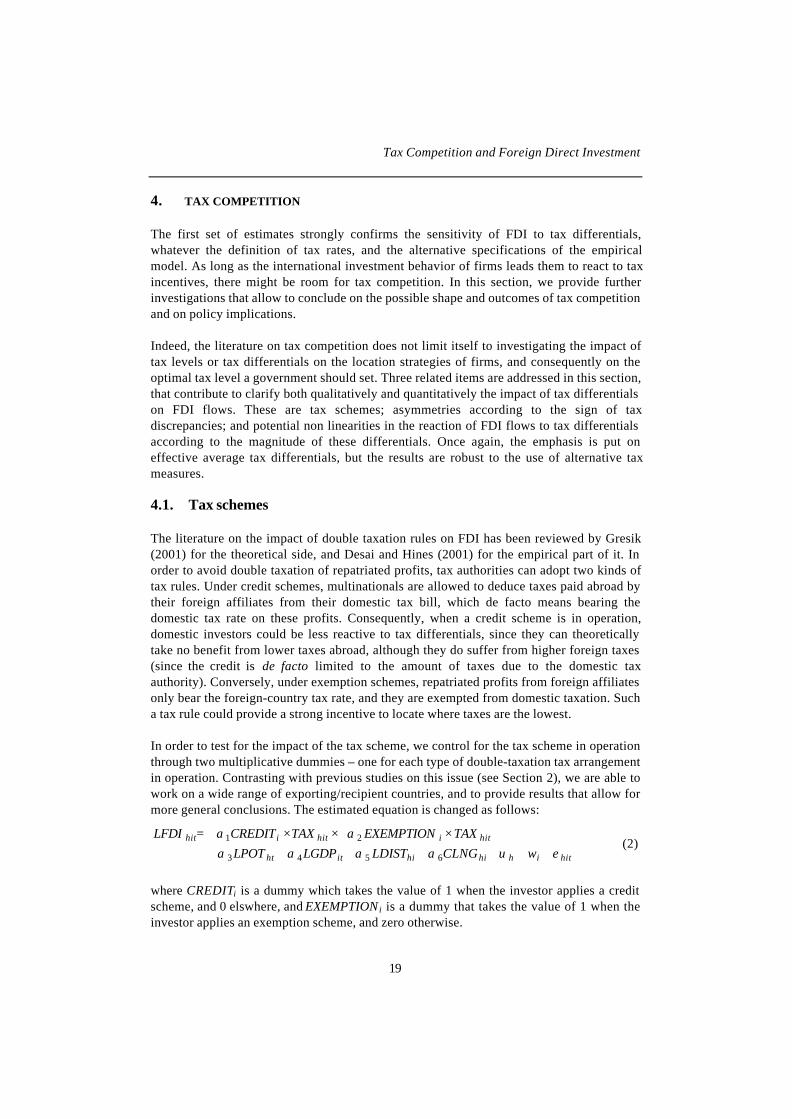
In order to test for the impact of the tax scheme, we control for the tax scheme in operationthrough two multiplicative dummies – one for each type of double-taxation tax arrangementin operation. Contrasting with previous studies on this issue (see Section 2), we are able towork on a wide range of exporting/recipient countries, and to provide results that allow formore general conclusions. The estimated equation is changed as follows:
hitihhihiitht
hitihitihit
wCLNGLDISTLGDPLPOTTAXEXEMPTIONTAXCREDITLFDI
ευαααααα
+++++++×+××=
6543
21 (2)
where CREDITi is a dummy which takes the value of 1 when the investor applies a creditscheme, and 0 elswhere, and EXEMPTION i is a dummy that takes the value of 1 when theinvestor applies an exemption scheme, and zero otherwise.

CEPII, Working Paper No 2003 - 17
20
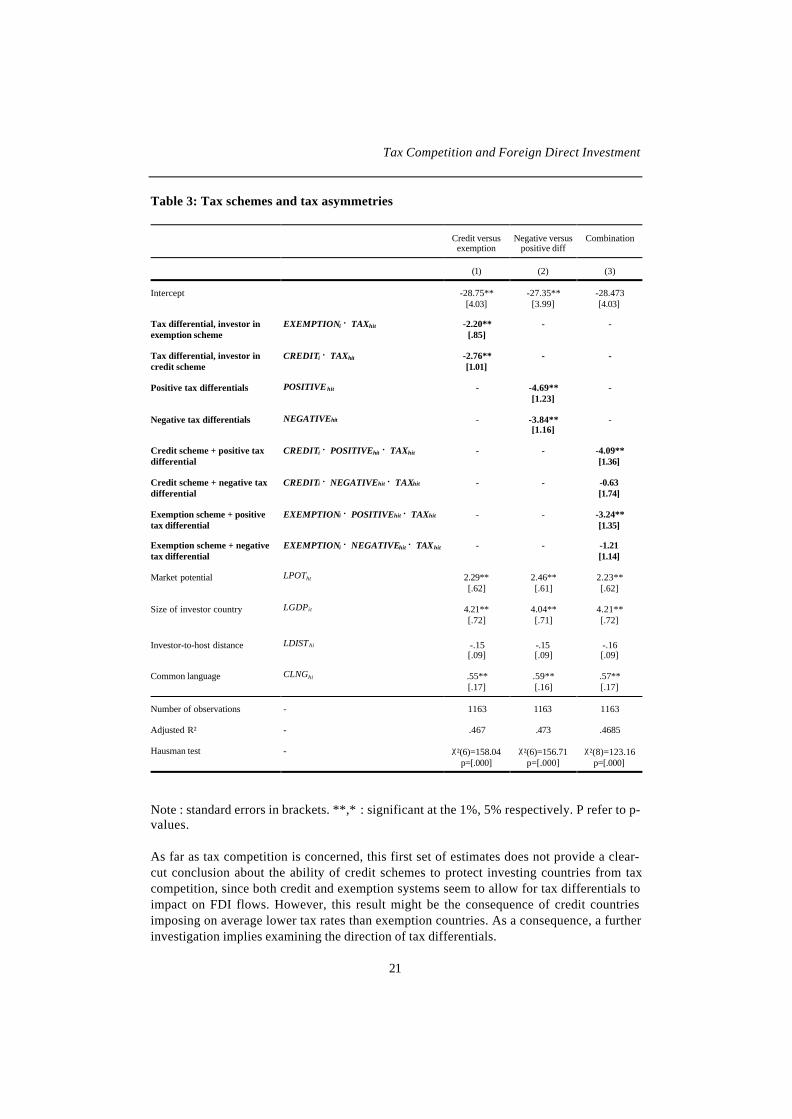
As shown in Table 3 (column (1)), the semi-elasticities to tax differentials are significantfor both credit and exemption countries. Both coefficients are negative, but contrasting tothe intuition, FDI flowing from countries operating under credit scheme seems to be moresensitive to tax differentials than FDI flowing from exemption-scheme countries (althoughthe difference is not statistically significant). A similar result was found by Hines and Rice(1996), working on the FDI behavior of US multinationals in tax havens, who showed thatfirms submitted to tax credits can be willing to invest in low tax countries even thoughthere is no immediate incentive for that. One explanation for our result could be thatcountries applying credit schemes (with the exception of Japan) generally display relativelylow taxation rates. Since multinationals are not refunded for excess taxation paid abroad,they do react to the level of taxes in the host country.
Tax Competition and Foreign Direct Investment
21
Table 3: Tax schemes and tax asymmetries
Credit versusexemption
Negative versuspositive diff
Combination
(1) (2) (3)
Intercept -28.75**[4.03]
-27.35**[3.99]
-28.473[4.03]
Tax differential, investor inexemption scheme
EXEMPTIONi × TAXhit -2.20**[.85]
- -
Tax differential, investor incredit scheme
CREDITi × TAXhit -2.76**[1.01]
- -
Positive tax differentials POSITIVE hit - -4.69**[1.23]
-
Negative tax differentials NEGATIVEhit - -3.84**[1.16]
-
Credit scheme + positive taxdifferential
CREDITi × POSITIVEhit × TAXhit - - -4.09**[1.36]
Credit scheme + negative taxdifferential
CREDITi × NEGATIVEhit × TAXhit - - -0.63[1.74]
Exemption scheme + positivetax differential
EXEMPTIONi × POSITIVEhit × TAXhit - - -3.24**[1.35]
Exemption scheme + negativetax differential
EXEMPTIONi × NEGATIVEhit × TAXhit - - -1.21[1.14]
Market potential LPOTht 2.29**[.62]
2.46**[.61]
2.23**[.62]
Size of investor country LGDPit 4.21**[.72]
4.04**[.71]
4.21**[.72]
Investor-to-host distance LDIST hi -.15[.09]
-.15[.09]
-.16[.09]
Common language CLNGhi .55**[.17]
.59**[.16]
.57**[.17]
Number of observations - 1163 1163 1163
Adjusted R² - .467 .473 .4685
Hausman test - χ²(6)=158.04p=[.000]
χ²(6)=156.71p=[.000]
χ²(8)=123.16p=[.000]
Note : standard errors in brackets. **,* : significant at the 1%, 5% respectively. P refer to p-values.
As far as tax competition is concerned, this first set of estimates does not provide a clear-cut conclusion about the ability of credit schemes to protect investing countries from taxcompetition, since both credit and exemption systems seem to allow for tax differentials toimpact on FDI flows. However, this result might be the consequence of credit countriesimposing on average lower tax rates than exemption countries. As a consequence, a furtherinvestigation implies examining the direction of tax differentials.
CEPII, Working Paper No 2003 - 17
22
4.2. Asymmetries
In the baseline estimation, investor and host countries are treated symmetrically as far asthe direction of tax differentials is concerned. However, since investors operating undercredit schemes are not refunded for excess taxes paid abroad, this introduces someasymmetry in their reaction to tax variations: they should be more affected by a taxvariation in the host country when taxation is already higher in the latter. This is in fact theempirical evidence that emerges from Head et al. (1999), who conclude that Japaneseinvestments in the US are indeed diverted by high tax rates, but not much attracted by lowtax rates.
In order to test for asymmetric incentives, we disentangle (through a multiplicative dummy)positive tax differentials (i.e. cases where the host tax rate exceeds the investor’s one) fromnegative ones.
The estimated equation is the following, where POSITIVEhit is a dummy which takes thevalue of 1 when taxation is higher in the host (h) than in the investing (i) country, andNEGATIVEhit is a dummy that takes the value of 1 when taxation is lower in the host than inthe investing country.
hitihhihiitht
hithithithithit
wCLNGLDISTLGDPLPOTTAXNEGATIVETAXPOSITIVELFDI
ευαααααα
+++++++×+×=
6543
21 (3)
The results are reported in the second column of Table 3. The coefficient for positivedifferentials is larger (in absolute value) than that on negative discrepancies, meaning that ahigher tax rate in the host country is more harmful to inward FDI than a lower tax rate isattractive for foreign capital. This conclusion provides a first qualification as regards thestrength of tax incentives in determining FDI flows: FDI seems to be less sensitive to taxincentives than to tax disincentives. As a consequence, increasing FDI inflows through taxcuts could prove a more productive choice for high-tax countries than for low-tax ones,since cutting taxes when the tax pressure is already low does not attract as much FDI aswhen this policy is implemented by a high-tax country.
One argument for investors to react more to higher taxes than to lower taxes abroad is that,whenever they operate under credit schemes, they cannot be refunded for excess taxes paidabroad. As a consequence, a careful assessment of the impact of positive and negative taxdifferentials should also control for the tax scheme in operation in the investing country.
A final estimate is therefore performed, which combines both dimensions throughmultiplicative dummies. The estimated equation is the following,
hitihhihiitht
hithitihithiti
hithitihithitihit
wCLNGLDISTLGDPLPOT
TAXNEGATIVECREDITTAXPOSITIVECREDITTAXNEGATIVEEXEMPTIONTAXPOSITIVEEXEMPTIONLFDI
ευαααααα
αα
+++++++××+××+
××+××=
6765
43
21(4)
The results are reported in Table 3, Column (3). They show that countries applying a creditscheme do react to the level of tax differentials when these differentials are positive (i.e.

Tax Competition and Foreign Direct Investment
23
when taxation is higher in the host than in the investor country), whereas they do not reactto the level of the tax differential when it is negative, confirming that credit countries feelan asymmetric incentive. Exemption countries display the same asymmetric behavior, butto a lesser extent (although the difference with credit schemes is not statisticallysignificant).
On the whole, our results suggest that attracting FDI through low taxation might not provea very efficient policy, as the sensitivity of inward FDI to lower taxes abroad is notsignificant. On the opposite, higher tax rates are harmful to inward FDI, meaning that thereshould be a strong incentive for high-tax recipient countries to lower the tax burden if theyintend to attract FDI. The observed asymmetry in the tax sensitivity of FDI has importantimplications for tax competition. Indeed, when they already display relatively low tax rates,recipient countries face little incentive to further cut taxes, whereas high taxation countriesshould feel a strong incentive to cut taxes. Along these lines, tax competition should notnecessarily end up racing to the bottom. The underlying force behind the competition forattracting FDI could rather produce a convergence in tax rates, lead by cuts in high taxcountries. These two features (limited race to the bottom, convergence in tax rates) areconsistent with the stylized facts of the last ten years (see, for instance, Devereux et al.,2002, p. 464)
Finally, while the new economic geography justifies the persistence of tax differentials bythe existence of taxable rents that agglomeration economies provide to large countries, ourresults suggests that the range of equilibrium tax discrepancies might be narrowed by theasymmetry of FDI behavior as regards tax incentives.
4.3. Non linearities
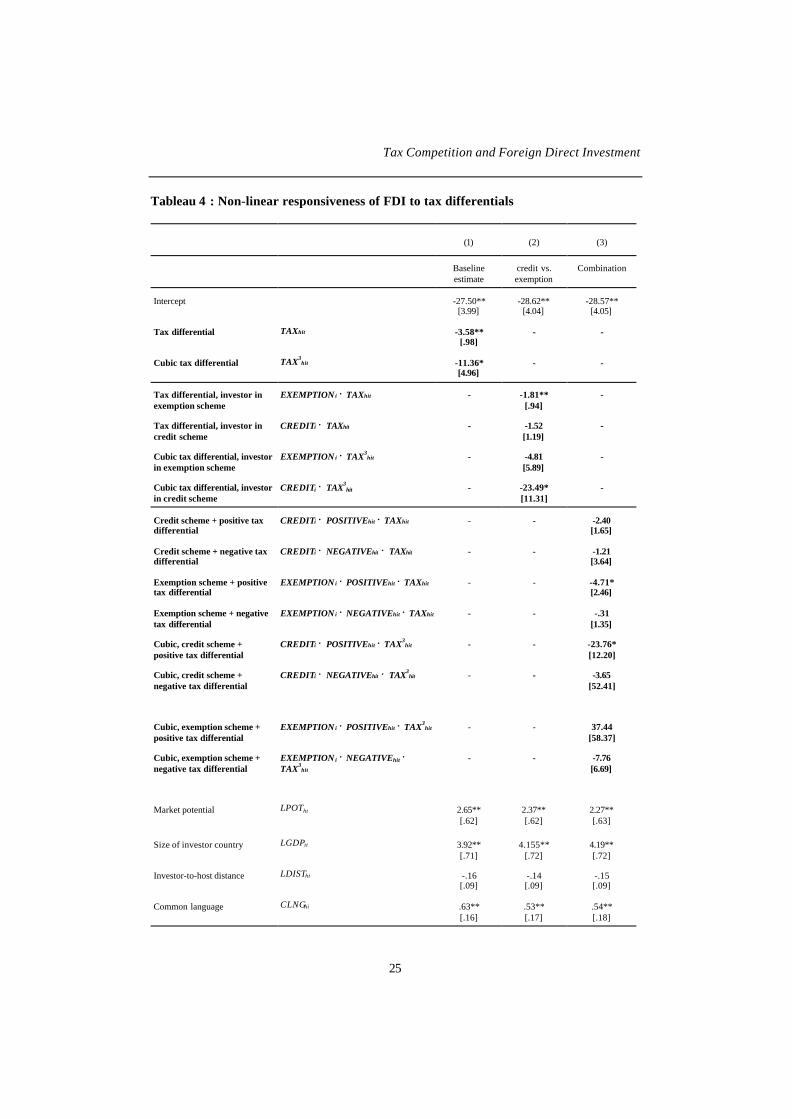
Given the complexity and instability of tax codes, information about taxation should bethought as highly imperfect. In addition, relocating from one country to another is costly. Insuch a framework, large discrepancies should matter more than small ones. Hence therelationship between tax differentials and FDI may be non-linear, large tax differentialshaving relatively more impact than small ones. We test for non-linearities by includingcubic tax differentials in the estimation
8, expecting a negative sign on both differentials and
cubic differentials. We also further investigate the impact of tax schemes on thesensitiveness of FDI to tax differentials, by once more introducing multiplicative dummiescatching for the sign of the tax differentials (negative vs. positive) and the combination ofsign and tax scheme. Three equations are therefore estimated, the results being displayed inTable 4:
hitihhihiiththithithit wCLNGLDISTLGDPLPOTTAXTAXLFDI ευαααααα ++++++++= 65433
21 (5)
8 Because they are always positive, squared differentials were not included.

CEPII, Working Paper No 2003 - 17
24
hitihhihiitht
hitihiti
hitihitihit
wCLNGLDISTLGDPLPOT
TAXEXEMPTIONTAXCREDIT
TAXEXEMPTIONTAXCREDITLFDI
ευαααα
αα
αα
+++++++
×+××+
×+××=
8765
34
33
21
(6)
hitihhihiitht
hithitihithiti
hithitihithiti
hithitihithiti
hithitihithitihit
wCLNGLDISTLGDPLPOT
TAXNEGATIVECREDITTAXPOSITIVECREDIT
TAXNEGATIVEEXEMPTIONTAXPOSITIVEEXEMPTION
TAXNEGATIVECREDITTAXPOSITIVECREDIT
TAXNEGATIVEEXEMPTIONTAXPOSITIVEEXEMPTIONLFDI
ευαααα
αα
αα
αα
αα
+++++++
××+××+
××+××+
××+××+
××+××=
1211109
38
37
36
35
43
21
(7)
The first column in Table 4 provides a first confirmation that FDI inflows do react to taxdifferentials in a non-linear manner: larger discrepancies have relatively more impact onFDI flows.
Decomposing the reaction of FDI according to tax schemes provides an interesting resultabout the sensitivity of investors to the tax scheme in operation in their home country(Column 2). Indeed, while investors submitted to exemption schemes react to taxdifferentials in a linear manner (the coefficient on the cubic tax differential, while negative,is not significant), investors submitted to credit schemes are only reactive to large taxdifferentials (the coefficient on the tax differential becomes non-significant, whereas thecoefficient on the cubic differential is significantly negative). These estimates are consistentwith the features of credit schemes that allow excess taxes paid abroad to be reimbursedonly if they are of limited amount, whereas in the exemption scheme, any excess taxes paidabroad is lost for the investor.
Introducing asymmetries like in Section 4.2 reinforces our previous conclusions (seeColumn 3). First, only positive tax differentials matter, confirming that tax disincentives aremore powerful on investment decisions than tax incentives. Second, when the investor isapplied an exemption scheme, it reacts to tax differentials in a linear manner, which can beexplained by the fact that it must support any excess tax burden. When the investor isapplied a credit scheme, its sensitivity to tax differentials is non-linear, suggesting thatlimited positive tax differentials are not excessively harmful.
As a consequence of this asymmetric behavior of FDI from credit and exemption countries,the impact of a change in tax differential should be conditioned to the geographiccomposition of inward FDI: for low level of tax differentials, the loss essentially stemsfrom exemption scheme countries. Investors submitted to credit scheme significantly reactto tax differentials at larger tax differentials. Turning back to the possible shape of taxcompetition, these results would suggest a more complete convergence in tax rates wheninward FDI mainly stems from exemption countries, whereas limited tax differentials couldwell survive whenever investors mainly stem from countries applying credit schemes.
Tax Competition and Foreign Direct Investment
25
Tableau 4 : Non-linear responsiveness of FDI to tax differentials
(1) (2) (3)
Baselineestimate
credit vs.exemption
Combination
Intercept -27.50**[3.99]
-28.62**[4.04]
-28.57**[4.05]
Tax differential TAXhit -3.58**[.98]
- -
Cubic tax differential TAX3hit -11.36*
[4.96]- -
Tax differential, investor inexemption scheme
EXEMPTION i × TAXhit - -1.81**[.94]
-
Tax differential, investor incredit scheme
CREDITi × TAXhit - -1.52[1.19]
-
Cubic tax differential, investorin exemption scheme
EXEMPTION i × TAX3hit - -4.81
[5.89]-
Cubic tax differential, investorin credit scheme
CREDITi × TAX3hit - -23.49*
[11.31]-
Credit scheme + positive taxdifferential
CREDITi × POSITIVEhit × TAXhit - - -2.40[1.65]
Credit scheme + negative taxdifferential
CREDITi × NEGATIVEhit × TAXhit - - -1.21[3.64]
Exemption scheme + positivetax differential
EXEMPTION i × POSITIVEhit × TAXhit - - -4.71*[2.46]
Exemption scheme + negativetax differential
EXEMPTION i × NEGATIVEhit × TAXhit - - -.31[1.35]
Cubic, credit scheme +positive tax differential
CREDITi × POSITIVEhit × TAX3hit - - -23.76*
[12.20]
Cubic, credit scheme +negative tax differential
CREDITi × NEGATIVEhit × TAX3hit - - -3.65
[52.41]
Cubic, exemption scheme +positive tax differential
EXEMPTION i × POSITIVEhit × TAX3hit - - 37.44
[58.37]
Cubic, exemption scheme +negative tax differential
EXEMPTION i × NEGATIVEhit ×TAX3
hit
- - -7.76[6.69]
Market potential LPOTht 2.65**[.62]
2.37**[.62]
2.27**[.63]
Size of investor country LGDPit 3.92**[.71]
4.155**[.72]
4.19**[.72]
Investor-to-host distance LDISThi -.16[.09]
-.14[.09]
-.15[.09]
Common language CLNGhi .63**[.16]
.53**[.17]
.54**[.18]
CEPII, Working Paper No 2003 - 17
26
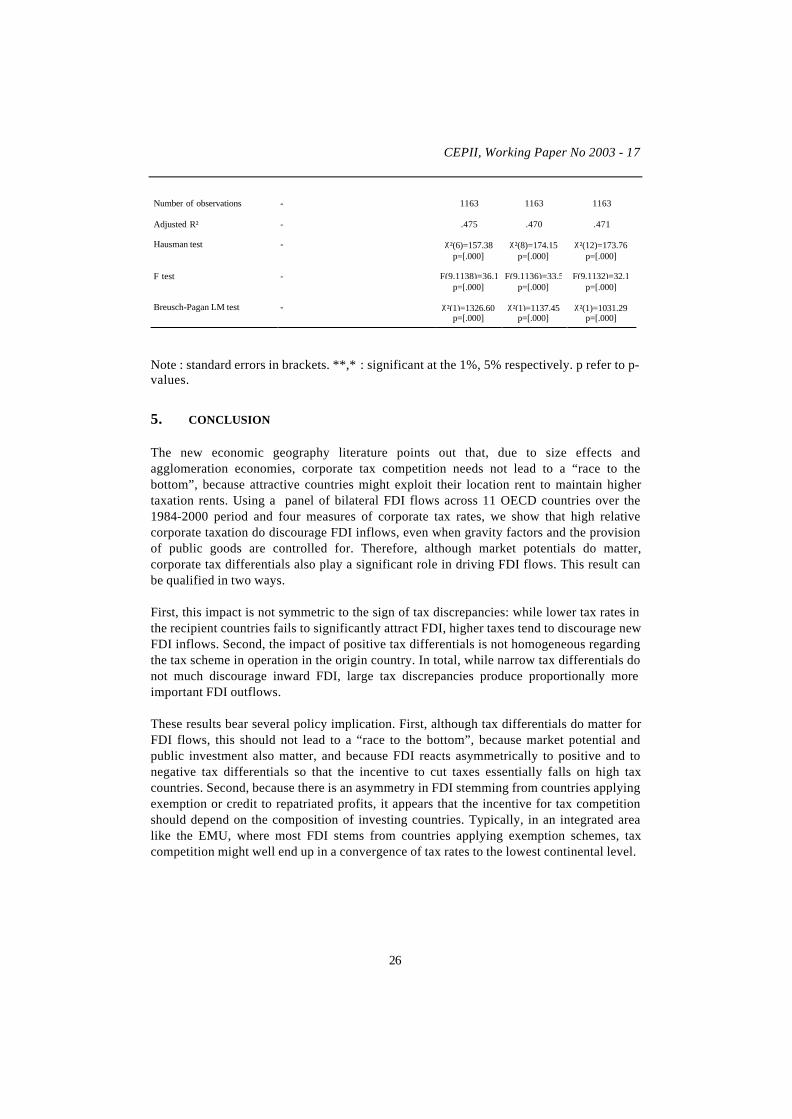
Number of observations - 1163 1163 1163
Adjusted R² - .475 .470 .471
Hausman test - χ²(6)=157.38p=[.000]
χ²(8)=174.15p=[.000]
χ²(12)=173.76p=[.000]
F test - F(9,1138)=36.1p=[.000]
F(9,1136)=33.5p=[.000]
F(9,1132)=32.1p=[.000]
Breusch-Pagan LM test - χ²(1)=1326.60p=[.000]
χ²(1)=1137.45p=[.000]
χ²(1)=1031.29p=[.000]
Note : standard errors in brackets. **,* : significant at the 1%, 5% respectively. p refer to p-values.
5. CONCLUSION
The new economic geography literature points out that, due to size effects andagglomeration economies, corporate tax competition needs not lead to a “race to thebottom”, because attractive countries might exploit their location rent to maintain highertaxation rents. Using a panel of bilateral FDI flows across 11 OECD countries over the1984-2000 period and four measures of corporate tax rates, we show that high relativecorporate taxation do discourage FDI inflows, even when gravity factors and the provisionof public goods are controlled for. Therefore, although market potentials do matter,corporate tax differentials also play a significant role in driving FDI flows. This result canbe qualified in two ways.
First, this impact is not symmetric to the sign of tax discrepancies: while lower tax rates inthe recipient countries fails to significantly attract FDI, higher taxes tend to discourage newFDI inflows. Second, the impact of positive tax differentials is not homogeneous regardingthe tax scheme in operation in the origin country. In total, while narrow tax differentials donot much discourage inward FDI, large tax discrepancies produce proportionally moreimportant FDI outflows.
These results bear several policy implication. First, although tax differentials do matter forFDI flows, this should not lead to a “race to the bottom”, because market potential andpublic investment also matter, and because FDI reacts asymmetrically to positive and tonegative tax differentials so that the incentive to cut taxes essentially falls on high taxcountries. Second, because there is an asymmetry in FDI stemming from countries applyingexemption or credit to repatriated profits, it appears that the incentive for tax competitionshould depend on the composition of investing countries. Typically, in an integrated arealike the EMU, where most FDI stems from countries applying exemption schemes, taxcompetition might well end up in a convergence of tax rates to the lowest continental level.

Tax Competition and Foreign Direct Investment
27
APPENDIX: VARIABLES AND DATA SOURCES
Endogenous variable
FDI data is extracted from the Eurostat data-base Cronos. The first chain ownershipconcept (as opposed to the ultimate beneficial owner concept) is applied in order to identifythe source country. We consider total FDI in all sectors, excluding reinvested earnings forall countries except the US and Japan, this difference in data definition being controlled forby the use of fixed effects for investing and host countries. Germany includes EastGermany from 1991. Flows are recorded in current ECU millions at market values. Theyare converted into constant dollars using IMF exchange rates and prices of investment inthe host country.
FDI flows are transformed through natural logarithms (our dependent variable LFDIhit),which excludes null and negative observations. 398 FDI values are missing, and 268negative or zero values are skipped from the analysis. Preliminary estimations carried outon FDI levels showed that working on logarithms (without null and negativevalues) does not introduce a selection bias.
Control variables
Market potential
We use a measure of market potential which accounts for transportation costs within thehost country. In a second stage, we also account for transportation costs between the hostcountry and the regional market, including internal transportation costs in each foreignmarket.
The first step is to compute distances weighted by regional GDPs. The average distancebetween countries i and h (dih) is calculated as the weighted average of distances betweeneach region of i and each region of h: (with i=h in the case of internal distances):
h
kk
i
kk
kkkik hk
kkkih
GDPGDP
zGDPGDP
z
dzdzd
''
''
''
;
k'andkregionsbetweendistance;
≡≡
=
= ∑ ∑
∈ ∈
We are grateful to Thierry Mayer for providing us ready-to-use average distances.
In a second step, the market potential of country h is defined as the ratio of its GDP to itsaverage internal distance:
hh
htht d
GDPPOT =

CEPII, Working Paper No 2003 - 17
28
Finally, in the case of the European Union, an enlarge market potential is defined as theweighted sum of European GDPs, where the weights correspond to the distance betweenthe host country and each European market:
Europe if
Europe if
∉=
∈+= ∑∈
hPOTEPOT
hd
GDP
dGDP
EPOT
htht
Europej hj
jt
hh
htht
The GDPs used in this calculation are in purchasing power parity (source: CEPII-CHELEM). We use the logarithm of the host market potential (LPOTht) and the logarithmof the enlarged market potential (LEPOTht).
Size of the investing country
LGDPit is the logarithm of the GDP of the investing country, in USD using PPP exchangerates (CHELEM-CEPII database). It is used as a proxy for the size of the investing country.
Transportation costs
LDISThi is the logarithm of the great arc-cycle distance between i and h economic centers.We are grateful to Daniel Mirza for providing the data.
Common language
CLNGhi is a dummy controlling for potential network externalities provided by the sharingof a common culture. It takes the value of one when countries use the same language.
Cost variables
LRERhit is the logarithm of the bilateral, real exchange rate between the host country h andthe investor country i, defined as the relative price level of the investor country vis-à-vis thehost (hence, a rise in LRERhit points to a real appreciation in country h). It is constructedwith the CEPII-CHELEM database, where data are all expressed as relative prices againstthe US. which allows for both geographic and time variance in real exchange rates..
Unit labor costs (ULC) are taken from the OECD, and converted into a common currency(the dollar) using IMF exchange rates. Relative unit labor costs are computed as thedifference in the (natural logarithm of) host against the invrestor ULC, and are labelledLULChit.
Public expenses
Public consumption data in volume are provided by the OECD, line CGV. Publicinvestment data come from the same source, line IGV. When necessary, these variables areconverted into a common currency (the US dollar) using IMF (International financialStatistics) data. Two alternative variables are used in order to catch both the relative amountof total public expenses and its composition.
Tax Competition and Foreign Direct Investment
29
- The size of total public expenses. Denoting public consumption by PC andpublic investment by PI, both in volume and current US dollar, this variable isdesigned as follows: )ln( hththt PIPCLPEXP += .
- The composition of public expenses. Using the same notations, this variable is
defined as follows:
+
=htht
htht PCPI
PIISHARE .
Corporate tax differentials
Tax differentials are calculated as simple differences between the corporate-tax rates in thehost country (h) and in the investing country (i). This calculation is carried out on a set offour tax variables:
- statutory tax rates (TShi);- average effective tax rates (TAhi);- marginal effective tax rates (TMhi);- apparent effective tax rates (TEhi).
Statutory, average effective and marginal effective tax rates are taken from Michael Devereux’shome page (http://www2.warwick.ac.uk/fac/soc/economics/staff/faculty/devereux/ ).
Apparent effective tax rates are calculated as the ratio between corporate tax revenues andthe operating surplus, using OECD data, namely taxes on corporate income as a % of GDP(Line 12 OECD, Financial and Fiscal Affairs, Compendium), available for the whole timesample; GDP in local currency (OECD, national accounts); Operating surplus in localcurrency (OECD, national accounts).
All tax rates are in percentage.
Note that other location incentives such as subsidies or exemptions granted by localauthorities should be considered too. However, reliable data is missing especially on amulti-country basis, and there is some evidence that these policies are implementedeverywhere and thus are likely to at least partially offset each other.
Number of observations
The theoretical number of observations for bilateral FDI is 1870 (11 investors x 10 hosts x17 years). However there are 398 missing values, and 268 negative or zero values need tobe excluded since we are working on the logarithm of FDI flows.
There are also missing values among explanatory variables. In particular, Denmark ismissing in the Devereux and Griffith database. This leaves us with 1163 observations whenthe Devereux and Griffith database is used, and to 1307 observations when apparenttaxation is used.
CEPII, Working Paper No 2003 - 17
30
BIBLIOGRAPHY
Andersson, Frederik, and Rikard Forslid. (1999). “Tax Competition and EconomicGeography”. CEPR Discussion Paper, 2220.
Auerbach, Alan J., and Kevin A. Hassett. (1993). “Taxation and Foreign Direct Investmentin the United States: a Reconsideration of the Evidence”. In Alberto Giovannini,Glenn R. Hubbard and Joel Slemrod (eds.), Studies in International Taxation ,Chicago, Chicago University Press, 119-144.
Baldwin, Richard, and Paul Krugman. (2002). “Agglomeration, Integration and TaxHarmonization”. NBER Working paper No. 9290, October. Forthcoming in theEuropean Economic Review.
Bloningen, Bruce A., and Ronald B. Davies. (2000). “The Effect of Bilateral Tax Treatieson US FDI Activity”. NBER Working Paper No. 7929.
Bloningen, Bruce A., and Ronald. B. Davies. (2002). “Do Bilateral Tax Treaties PromoteForeign Direct Investment?”. NBER Working paper No. 8834, March.
Brainard Lael S. (1997). “An Empirical Assessment of the Proximity-Concentration Tradeoff between Multinational Sales and Trade”. American Economic Review, 87 (4),520-44.
Desai, Mihir A., and James R. Hines. (2001). “Foreign Direct Investment in a World ofMultiple Taxes”. NBER Working paper no. 8440, August.
Devereux, Michael P., and Rachel Griffith. (1998). “Taxes and the Location of Production:Evidence from a Panel of US Multinationals”. Journal of Public Economics, 68, 335-367.
Devereux, Michael P., and Rachel Griffith. (2003). “Evaluating tax policy for locationdecisions”. International Tax and Public Finance, 10 (2), 107-126.
Devereux, Michael P., Rachel Griffith. and Alexander Klemm. (2002). “Corporate IncomeTax Reforms and International Tax Competition”. Economic Policy, 35, 449-496.
Eaton, Jonathan, and Akiko Tamura (1996). “Japanese and US Exports and Investment asConduits of Growth”. In Takatoshi Ito and Anne O. Kueger (eds), FinancialDeregulation and Integration in East Asia, Chicago and London : University ofChicago Press, 51-72.
Fontagné, Lionel, Michael Freudenberg, and Nicolas Péridy. (1998). “Intra-Industry Tradeand the Single market: Quality Matters”. CEPR Discussion Paper No. 1959.
Fontagné, Lionel. (1999). “Foreign Direct Investment and International Trade:Complements or Substitutes?”. STI Working Papers, 1999-3, OECD-DSTI.
Tax Competition and Foreign Direct Investment
31
Gresik, Thomas. (2001). “The taxing task of taxing multinationals”. Journal of EconomicLiterature, vol. XXXIX, 800-838.
Gropp, Reint, and Kristina Kostial. (2000). “The Disappearing Tax Base: Is Foreign DirectInvestment Eroding Corporate Income Taxes?”. IMF Working Paper, WP/00/173.
Harris, Chauncy. (1954). “The Market as a Factor in the Localization of Industries in theUnited States”. Annals of the Association of American Geographics, 64, 315-348.
Hartman, David G. (1984). “Tax Policy and Foreign Direct Investment in the UnitedStates”. National Tax Journal 37, 475-488.
Haufler, Andreas, and Ian Wooton. (1999). “Country Size and Tax Competition for ForeignDirect Investment”. Journal of Public Economics, 71, 121-139.
Head, Kieth, John Ries, and Deborah Swenson. (1999). “Attracting Foreign Manufacturing:Investment Promotion and Agglomeration”. Regional Science and Urban Economics(29), 197-218.
Hines, James R. (1996). “Tax Policy and the Activities of Multinational Corporations”.NBER Working Paper No. 5586, May.
Hines, James R., and Eric M. Rice. (1996). “Fiscal Paradise: Foreign Tax Heavens andAmerican Business”. Quarterly Journal of Economics 109 (1), 149-182.
Hines, James R. (1999). “Lessons from Behavioral Responses to International Taxation”.National Tax Journal, 52, (2), 305-323.
Hubert, Florence, and Nigel Pain (2002). “ Fiscal Incentives, European Integration and theLocation of Foreign Direct Investment ”. Manchester School, 70(3), 336-63.
King, Mervin A. and Don Fullerton. (1984). The Taxation of Income from Capital.Chicago: The University of Chicago Press.
Krugman, Paul. (1991) “Increasing returns and economic geography”. Journal of PoliticalEconomy, 99, (3), 483-499.
Krugman, Paul, and Anthony J. Venables. (1996). “Integration, specialization andadjustment”. European Economic Review, (40), 959-967.
Mendoza, Enrique G., Assaf Razin, Linda L. Tesar, (1994). “Effective tax rates inmacroeconomics: cross-country estimates of tax rates on factor incomes andconsumption”. Journal of Monetary Economics, 34, 297-323.
de Mooij, Ruud.A., and Sjef Ederveen. (2001). “Taxation and Foreign Direct Investment: ASynthesis of Empirical Research”, CPB Discussion Paper No. 003, November.
CEPII, Working Paper No 2003 - 17
32
Nicodème, Gaetan. (2001). “Computing effective corporate tax rates: comparisons andresults”, Economic Papers, 153, June.
Scholes, Myron, and Mark A. Wolfson. (1990). “The Effects of Changes in Tax Law onCorporate Reorganization Activity”. Journal of Business 63, S141-S164.
Slemrod, Joel. (1990). “Tax Effects of Foreign Direct Investment in the United States:Evidence from Cross-Country Comparison”. In Assaf Razin and Joel Slemrod (eds.),Taxation in a Global Economy , Chicago, Chicago University Press, 79-117.
Stein, Ernesto, and Christian Daude. (2001). “Institutions, Integration and the Location ofForeign Direct Investment”. Mimeo, Inter-American Development Bank.
Stein, Ernesto, and Christian Daude. (2003). “Longitude Matters : Time Zones and theLocation of FDI”. Mimeo, Inter-American Development Bank.
Swenson, Deborah. (1994). “The Impact of US Tax Reform on Foreign Direct Investmentin the United States”. Journal of Public Economics, 54, (2), 243-266.
Swensson, Deborah. (2001). “Transaction type and the effect of taxes on the distribution offoreign direct investment in the United States”. In James. R. Hines (ed.), InternationalTaxation and Multinational Activity, University of Chicago Press.
Swensson, Deborah. (2001). “Tax reforms and evidence of transfer pricing”. National TaxJournal , vol. LIV No. 1.
Tiebout, Charles M. (1956), “A Pure Theory of Local Expenditures”. Journal of PoliticalEconomy 64, 416-24.
Wei, Shang-Ji. (2000). “How Taxing is Corruption on International Investors ?”. TheReview of Economics and Statistics, LXXXII (2), 1-11.
Wheeler, David, and Ashoka Mody. (1992). “International Investment Location Decisions,the Case of US Firms ”. Journal of International Economics, 33, 57-76.
Wilson, John D. (1991). “Tax Competition with Interregional Differences in FactorEndowments”. Regional Science and Urban Economics 21(3), 423-51.
Wilson, John D. (1999). “Theories of Tax Competition”. National Tax Journal, LII, (2),263-304.
Young, Garry, (1999), “The influence of foreign factor prices and international taxation onfixed investment in the UK”. Oxford Economic Papers 51, 355-373.
Zodrow, George, and Peter Mieszkowski (1986), “Pigou, Tiebout, property taxation and theunderprovision of local public goods”. Journal of Urban Economics, 19, 356-370.
Tax Competition and Foreign Direct Investment
33
LIST OF WORKING PAPERS RELEASED BY CEPII1
No Title Authors
2003-16 Commerce et transfert de technologies : les cascomparés de la Turquie, de l’Inde et de la Chine
F. Lemoine &D. Ünal-Kesenci
2003-15 The Empirics of Agglomeration and Trade K. Head & T. Mayer
2003-14 Notional Defined Contribution: A Comparison of theFrench and German Point Systems
F. Legros
2003-13 How Different is Eastern Europe? Structure andDeterminants of Location Choices by French Firms inEastern and Western Europe
A. C. Disdier & T.Mayer
2003-12 Market Access Liberalisation in the Doha Round:Scenarios and Assessment
L. Fontagné, J.L.Guérin & S. Jean
2003-11 On the Adequacy of Monetary Arrangements in Sub-Saharian Africa
A. Bénassy-Quéré &Maylis Coupet
2003-10 The Impact of EU Enlargement on Member States : aCGE Approach
H. Bchir, L. Fontagné& P. Zanghieri
2003-09 India and the World Economy : TraditionalSpecialisations and Technology Niches
S. Chauvin &F. Lemoine
2003-08 Imination Amongst Exchange-Rate Forecasters :Evidence from Survey Data
M. Beine,A. Bénassy-Quéré &
H. Colas
2003-07 Le Currency Board à travers l’expérience del’Argentine
S. Chauvin & P. Villa
2003-06 Trade and Convergence : Revisiting Ben-David G. Gaulier
2003-05 Estimating the Fundamental Equilibrium Exchange-Rate of Central and Eastern European Countries theEMU Enlargement Perspective
B Egert &A. Lahrèche-Revil
2003-04 Skills, Technology and Growth is ICT the Key toSuccess
J. Melka, L. Nayman,S. Signano &
N. Mulder
1 Working papers are circulated free of charge as far as stocks are available; thank you to send your request
to CEPII, Sylvie Hurion, 9, rue Georges-Pitard, 75015 Paris, or by fax : (33) 01 53 68 55 04 or by [email protected]. Also available on: \\www.cepii.fr. Working papers with * are out of print. They cannevertheless be consulted and downloaded from this website.1 Les documents de travail sont diffusés gratuitement sur demande dans la mesure des stocks disponibles.
Merci d’adresser votre demande au CEPII, Sylvie Hurion, 9, rue Georges-Pitard, 75015 Paris, ou parfax : (33) 01 53 68 55 04 ou par e-mail [email protected]. Egalement disponibles sur : \\www.cepii.fr.Les documents de travail comportant * sont épuisés. Ils sont toutefois consultable sur le web CEPII.

CEPII, Working Paper No 2003 - 17
34
2003-03 L’investissement en TIC aux Etats-Unis et dansquelques pays européens
G. Cette & P.A. Noual
2003-02 Can Business and Social Networks Explain the BorderEffect Puzzle?
P.P. Combes,M. Lafourcade &
T. Mayer2003-01 Hyperinflation and the Reconstruction of a National
Money: Argentina and Brazil, 1990-2002J. Sgard
2002-18 Programme de travail du CEPII pour 2003
2002-17 MIRAGE, a Computable General Equilibrium Modelfor Trade Policy Analysis
M.H. Bchir,Y. Decreux,
J.L. Guérin & S. Jean2002-16 Evolutions démographiques et marché du travail : des
liens complexes et parfois contradictoiresL. Cadiou, J. Genet &
J.L. Guérin
2002-15 Exchange Rate Regimes and Sustainable Parities forCEECs in the Run-up to EMU Membership
V. Coudert &C. Couharde
2002-14 When are Structural Deficits Good Policies? J. Chateau
2002-13 Projections démographiques de quelques pays del’Union Européenne (Allemagne, France, Italie,Royaume-Uni, Pays-Bas, Suède)
R. Sleiman
2002-12 Regional Trade Integration in Southern Africa S. Chauvin &G. Gaulier
2002-11 Demographic Evolutions and Unemployment: anAnalysis of French Labour Market with WorkersGenerations
J. Château, J.L. Guérin& F. Legros
2002-10 Liquidité et passage de la valeur P. Villa
2002-09 Le concept de coût d’usage Putty-Clay des biensdurables
M.G. Foggea &P. Villa
2002-08 Mondialisation et régionalisation : le cas des industriesdu textile et de l’habillement
M. Fouquin, P. MorandR. Avisse G. Minvielle
& P. Dumont2002-07 The Survival of Intermediate Exchange Rate Regimes A. Bénassy-Quéré &
B. Coeuré2002-06 Pensions and Savings in a Monetary Union : An
Analysis of Capital FlowA. Jousten & F. Legros
2002-05 Brazil and Mexico’s Manufacturing Performance inInternational Perspective, 1970-1999
N. Mulder, S. Montout& L. Peres Lopes
2002-04 The Impact of Central Bank Intervention onExchange-Rate Forecast Heterogeneity
M. Beine,A. Benassy-Quéré,
E. Dauchy &R. MacDonald
2002-04 The Impact of Central Bank Intervention on Forecast M. Beine,

Tax Competition and Foreign Direct Investment
35
Heterogeneity A. Benassy-Quéré,E. Dauchi &
R. MacDonald2002-03 Impacts économiques et sociaux de l’élargissement
pour l’Union européenne et la FranceM.H. Bchir &
M. Maurel
2002-02 China in the International Segmentation of ProductionProcesses
F. Lemoine &D. Ünal-Kesenci
2002-01 Illusory Border Effects: Distance MismeasurementInflates Estimates of Home Bias in Trade
K Head & T. Mayer
2001-22 Programme de travail du CEPII pour 2002
2001-21 Croissance économique mondiale : un scénario deréférence à l’horizon 2030
N. Kousnetzoff
2001-20 The Fiscal Stabilization Policy under EMU – AnEmpirical Assessment
A. Kadareja
2001-19 Direct Foreign Investments and Productivity Growthin Hungarian Firms, 1992-1999
J. Sgard
2001-18 Market Access Maps: A Bilateral and DisaggregatedMeasure of Market Access
A. Bouët, L. Fontagné,M. Mimouni &
X. Pichot
2001-17 Macroeconomic Consequences of Pension Reforms inEurope: An Investigation with the INGENUE WorldModel
Equipe Ingénue
2001-16* La productivité des industries méditerranéennes A. Chevallier &D. Ünal-Kesenci
2001-15 Marmotte: A Multinational Model L. Cadiou, S. Dees,S. Guichard,A. Kadareja,
J.P. Laffargue &B. Rzepkowski
2001-14 The French-German Productivity ComparisonRevisited: Ten Years After the German Unification
L. Nayman &D. Ünal-Kesenci
2001-13* The Nature of Specialization Matters for Growth: AnEmpirical Investigation
I. Bensidoun,G. Gaulier
& D. Ünal-Kesenci
2001-12 Forum Economique Franco-Allemand - Deutsch-Französisches Wirtschaftspolitisches Forum, PoliticalEconomy of the Nice Treaty: Rebalancing the EUCouncil and the Future of European AgriculturalPolicies, 9th meeting, Paris, June 26th 2001
2001-11 Sector Sensitivity to Exchange Rate Fluctuations M. Fouquin, K. Sekkat,J. Malek Mansour,

CEPII, Working Paper No 2003 - 17
36
N. Mulder &L. Nayman
2001-10* A First Assessment of Environment-Related TradeBarriers
L. Fontagné, F. vonKirchbach &M. Mimouni
2001-09 International Trade and Rend Sharing in Developedand Developing Countries
L. Fontagné &D. Mirza
2001-08 Economie de la transition : le dossier G. Wild
2001-07 Exit Options for Argentina with a Special Focus onTheir Impact on External Trade
S. Chauvin
2001-06 Effet frontière, intégration économique et 'ForteresseEurope'
T. Mayer
2001-05 Forum Économique Franco-Allemand – Deutsch-Französisches Wirtschaftspolitisches Forum, TheImpact of Eastern Enlargement on EU-LabourMarkets and Pensions Reforms between Economicand Political Problems, 8th meeting, Paris, January 162001
2001-04 Discrimination commerciale : une mesure à partir desflux bilatéraux
G. Gaulier
2001-03* Heterogeneous Expectations, Currency Options andthe Euro/Dollar Exchange Rate
B. Rzepkowski
2001-02 Defining Consumption Behavior in a Multi-CountryModel
O. Allais, L. Cadiou &S. Dées
2001-01 Pouvoir prédictif de la volatilité implicite dans le prixdes options de change
B. Rzepkowski
2000-22 Forum Economique Franco-Allemand - Deutsch-Französisches Wirtschaftspolitisches Forum, TradeRules and Global Governance: A long Term Agendaand The Future of Banking in Europe, 7th meeting,Paris, July 3-4 2000
2000-21 The Wage Curve: the Lessons of an Estimation Over aPanel of Countries
S. Guichard &J.P. Laffargue
2000-20 A Computational General Equilibrium Model withVintage Capital
L. Cadiou, S. Dées &J.P. Laffargue
2000-19 Consumption Habit and Equity Premium in the G7Countries
O. Allais, L. Cadiou &S. Dées
2000-18 Capital Stock and Productivity in French Transport:An International Comparison
B. Chane Kune &N. Mulder

Tax Competition and Foreign Direct Investment
37
2000-17 Programme de travail 2001
2000-16 La gestion des crises de liquidité internationale :logique de faillite, prêteur en dernier ressort etconditionnalité
J. Sgard
2000-15 La mesure des protections commerciales nationales A. Bouët
2000-14 The Convergence of Automobile Prices in theEuropean Union: An Empirical Analysis for thePeriod 1993-1999
G. Gaulier & S. Haller
2000-13* International Trade and Firms’ Heterogeneity UnderMonopolistic Competition
S. Jean
2000-12 Syndrome, miracle, modèle polder et autresspécificités néerlandaises : quels enseignements pourl’emploi en France ?
S. Jean
2000-11 FDI and the Opening Up of China’s Economy F. Lemoine
2000-10 Big and Small Currencies: The Regional Connection A. Bénassy-Quéré &B. Coeuré
2000-09* Structural Changes in Asia And Growth ProspectsAfter the Crisis
J.C. Berthélemy &S. Chauvin
2000-08 The International Monetary Fund and the InternationalFinancial Architecture
M. Aglietta
2000-07 The Effect of International Trade on Labour-DemandElasticities: Intersectoral Matters
S. Jean
2000-06 Foreign Direct Investment and the Prospects for TaxCo-Ordination in Europe
A. Bénéssy-Quéré,L. Fontagné &
A. Lahrèche-Révil
2000-05 Forum Economique Franco-Allemand - Deutsch-Französisches Wirtschaftspolitisches Forum,Economic Growth in Europe Entering a NewArea?/The First Year of EMU, 6th meeting, Bonn,January 17-18, 2000
2000-04* The Expectations of Hong Kong Dollar Devaluationand their Determinants
B. Rzepkowski
2000-03 What Drove Relative Wages in France? StructuralDecomposition Analysis in a GeneralEquilibrium Framework, 1970-1992
S. Jean & O. Bontout
2000-02 Le passage des retraites de la répartition à lacapitalisation obligatoire : des simulations à l’aided’une maquette
O. Rouguet & P. Villa
2000-01* Rapport d’activité 1999

CEPII, Working Paper No 2003 - 17
38
1999-16 Exchange Rate Strategies in the Competition forAttracting FDI
A. Bénassy-Quéré,L. Fontagné &
A. Lahrèche-Révil
1999-15 Groupe d’échanges et de réflexion sur la Caspienne.Recueil des comptes-rendus de réunion (déc. 97- oct.98)"
D. Pianelli &G. Sokoloff
1999-14 The Impact of Foreign Exchange Interventions: NewEvidence from FIGARCH Estimations
M. Beine,A. Bénassy-Quéré &
C. Lecourt
1999-13 Forum Economique Franco-Allemand - Deutsch-Französisches Wirtschaftspolitisches Forum,Reduction of Working Time/Eastward Enlargment ofthe European Union, 5 th meeting, Paris, July 6-7 1999
1999-12* A Lender of Last Resort for Europe M. Aglietta
1999-11* La diversité des marchés du travail en Europe :Quelles conséquences pour l’Union Monétaire ;Deuxième partie : Les implications macro-économiques de la diversité des marchés du travail
L. Cadiou, S. Guichard& M. Maurel
1999-10* La diversité des marchés du travail en Europe :Quelles conséquences pour l’Union Monétaire ;Première partie : La diversité des marchés du travaildans les pays de l’Union Européenne
L. Cadiou &S. Guichard
1999-09 The Role of External Variables in the ChineseEconomy; Simulations from a macroeconometricmodel of China
S. Dees
1999-08 Haute technologie et échelles de qualité : de fortesasymétries en Europe
L. Fontagné,M. Freudenberg &
D. Ünal-Kesenci
1999-07 The Role of Capital Accumultion, Adjustment andStructural Change for Economic Take-Off: EmpiricalEvidence from African Growth Episodes
J.C. Berthélemy &L. Söderling
1999-06 Enterprise Adjustment and the Role of Bank Credit inRussia: Evidence from a 420 Firm’s QualitativeSurvey
S. Brana, M. Maurel &J. Sgard
1999-05 Central and Eastern European Countries in theInternational Division of Labour in Europe
M. Freudenberg &F. Lemoine
1999-04 Forum Economique Franco-Allemand – EconomicPolicy Coordination – 4 th meeting, Bonn, January 11-12, 1999
1999-03 Models of Exchange Rate Expectations: A. Bénassy-Quéré,S. Larribeau &

Tax Competition and Foreign Direct Investment
39
Heterogeneous Evidence From Panel Data R. MacDonald
1999-02 Forum Economique Franco-Allemand – LabourMarket & Tax Policy in the EMU
1999-01 Programme de travail 1999

CEPII, Working Paper No 2003 - ? ?
CEPIIDOCUMENTS DE TRAVAIL / WORKING PAPERS
Si vous souhaitez recevoir des Documents de travail,merci de remplir le coupon-réponse ci-joint et de le retourner à :
Should you wish to receive copies of the CEPII’s Working papers,just fill the reply card and return it to:
Sylvie HURION – PublicationsCEPII – 9, rue Georges-Pitard – 75740 Paris – Fax : (33) 1.53.68.55.04
M./Mme / Mr./Mrs ................................................................................................................................
Nom-Prénom / Name-First name .........................................................................................................
Titre / Title ...............................................................................................................................................
Service / Department..............................................................................................................................
Organisme / Organisation .....................................................................................................................
Adresse / Address...................................................................................................................................
Ville & CP / City & post code .............................................................................................................Pays / Country...................................................................... Tél. ...........................................................
Désire recevoir les Document de travail du CEPII n° :
Wish to receive the CEPII’s Working Papers No: ..........................................................................
...................................................................................................................................................................
...................................................................................................................................................................
...................................................................................................................................................................
...................................................................................................................................................................
...................................................................................................................................................................
...................................................................................................................................................................
...................................................................................................................................................................
c Souhaite être placé sur la liste de diffusion permanente (pour les bibliothèques)Wish to be placed on the standing mailing list (for Libraries).