tawiah gabriel tetteh review on solar utilization in …
TRANSCRIPT
TAWIAH GABRIEL TETTEH
REVIEW ON SOLAR UTILIZATION IN
GHANA
Technology and Communication 2014

VAASAN AMMATTIKORKEAKOULU UNIVERSITY OF APPLIED SCIENCES International Energy Technology and Management Program ABSTRACT
Author Gabriel Tetteh Tawiah Title A Review on Solar Energy Utilization in Ghana Year 2014 Language English Pages 67 + 1 Appendix Name of Supervisor Adebayo Agbejule The objective of the study was to review the barriers of the implementation of so-lar energy and solar home systems (SHS) in Ghana. This research focused on us-ing financial mechanism such as subsidy as a means of promoting SHS and use the payback period to explore into off-grid solar home system (SHS) as an alterna-tive source of energy. The research method included both literature review and case analysis of a house-holder in Ghana. The study investigated the role of financing mechanism such as subsidy in making SHS more affordable. In this particular work a load require-ments of all electrical appliances from a household leaving in Dawenya a suburb of Tema in Greater Accra Region, with the help of solar radiation database on PVGIS was used to determine the payback period. A sensitivity analysis was fur-ther carried out and the result revealed that a modest subsidy of 10% would be result in a payback period of about 12 years. Keywords Renewable energy, Ghana, barriers, solar financing, solar home sys-tem.

5
TABLEOFCONTENTS1 INTRODUCTION ............................................................................................ 8
1.1 Research Objectives .................................................................................. 9
1.2 Research Questions ................................................................................... 9
1.3 Methodology of the Research ................................................................... 9
1.4 Limitations of the Research ...................................................................... 9
1.5 Outline of the Study .................................................................................. 9
2 REVIEW OF RENEWABLE ENERGY SOURCES ..................................... 11
2.1 Solar Energy ............................................................................................ 11
2.2 Wind Energy ........................................................................................... 15
2.3 Bioenergy ................................................................................................ 16
2.4 Hydropower ............................................................................................ 16
2.5 Geothermal Energy ................................................................................. 17
2.6 Benefits of Renewable Energy ................................................................ 17
2.7 Power Quality and Reliability ................................................................. 18
2.8 Problems Related to the Use of Conventional Energy Sources .............. 19
3 REVIEW ON SOLAR ENERGY USAGE. ................................................... 21
3.1 Barriers of Implementing Renewable Energy. ........................................ 25
3.2 Barriers in Solar Energy Usage. .............................................................. 26
3.2.1 Barriers in Solar Energy Usage in Nigeria .................................. 26
3.2.2 Barriers in Solar Energy Usage in China .................................... 27
3.2.3 Barriers for Solar Energy Usage in Hong Kong ......................... 28
3.3 Framework for Promoting Renewable Energy ....................................... 29
4 ENERGY USAGE IN GHANA ..................................................................... 32
4.1 Solar Potential in Ghana ......................................................................... 34
4.2 Current Level of Solar Energy Usage in Ghana. .................................... 36
4.3 Barriers in Promoting Solar Energy in Ghana ........................................ 37
4.4 Financing of Solar Home System ........................................................... 38
4.5 Financing SHS ........................................................................................ 39
4.6 Case: Role of Financing in Promoting of Solar Home System .............. 40
4.7 Payback Period with No Subsidy ............................................................ 46
5 CONCLUSION AND RECOMMENDATION ............................................. 50
6 REFERENCES ............................................................................................... 52
LIST OF FIGURES AND TABLES
Figure 1.Sample of solar cell. ............................................................................... 13
Figure 2.Solar panel on roof of SHS. .................................................................... 14
Figure 3 Sample of wind power. ........................................................................... 15
Figure 4 Bio-mass sample ..................................................................................... 16
Figure 5 Conventional energy source. .................................................................. 19
Figure 6 Emmission of CO2. ................................................................................. 20
Figure 7 PV solar electrical potential in European countries. ............................... 22
Figure 8 Installed solar capacities in Europe. ....................................................... 23
Figure 9 Africa Solar map. .................................................................................... 24
Figure 10. Dissemination of PV system in Africa. ............................................... 25
Figure 11 Geographical map of Ghana. ................................................................ 32
Figure 12. Solar map of Ghana. ............................................................................ 35
Figure 13.photovoltaic Geographical information system. ................................... 44
Figure 14.performance of grid connected PV system. .......................................... 45
Table 1.Advantatages of solar energy. 12
Table 2.Framework condition on renewable energy. ............................................ 30
Table 3 Installed electrical generation capacity since 2004. ................................. 33
Table 4. Energyresources in Ghana. ..................................................................... 34

7
Table 5. Solar intensity in Ghana. ......................................................................... 36
Table 6.Solar istallations and their capacities. ...................................................... 37
Table 7. Breakdown of a solar home system. ....................................................... 41
Table 8Cost of solar components parts. ................................................................ 42
Table 9. Load requirement of a household............................................................ 42
Table 10.Calulation of payback for PV SHS for a period of 20 years with no
subsidy. .................................................................. Error! Bookmark not defined.
Table 11. Calculation of a payback period when the initial investment cos is
subsidies by 5%. ..................................................... Error! Bookmark not defined.
1 INTRODUCTION
The word energy was extracted from the Greek word ‘energeia’ and it certainly
appeared for the first time in the word of Aristotle, in the 4th century. The idea of
energy originated from living force and is defined as the product of the mass of an
object and its velocity squared. In addition, every living things or organism de-
pends on an external source of energy and therefore the radiation of the sun, so as
every fast growing economy of a country depends on energy./1/ The Sun is very
reliable and is also non-polluting, inexhaustible and always renewed by nature.
With the increase in energy prices, pollutions over the environment, depletion of
resources and environment degradation and limited resources is on the rise and it
needs critical attention.
The utilization of fossil fuels causes greenhouse effect and is a main contributor to
global warming experienced on the earth today, the burning of fossil fuels also
emits of carbon-dioxide (CO2) and sulphur dioxide that creates acid rain. , . /2/
Natural gas causes unpleasant odor and pose some problems with its transporta-
tion, and crude oil also causes environmental hazards, such as it spillage, and it
also contains toxic chemicals which render air pollutants when combusted.
Due to the negative effect on the environment and other related problems associ-
ated with fossil fuel it has forced many countries like Germany, USA, Spain etc.
to change into environmental friendly alternatives that are renewable to sustain
the rising energy demand, /3/ therefore solar energy is the way forward with the
least negative effect on the environment. Photovoltaic as name implies is a means
of converting sunlight directly into electricity./4/. Producing electricity by means
of solar panels causes no threat to the environment and it has no rotating parts and
causes no material depletion. Photovoltaic can be used in diverse ways, e.g. to
operate water pumps, household’s electrical gadgets, equipment and appliances
and also communication equipment. It can also be used in urban and rural electri-
fications and also use to power industries and also for commercial purposes. De-
spite the potential of PV in proving access to electricity, there is less usage in
Ghana.

9
1.1 Research Objectives
The aim of thesis was to review the solar energy utilization in Ghana and the bar-
riers associated with the solar energy usage in Ghana.
Ghana’s energy supply depends largely on hydropower and dual fired power
plant. Yet deprived communities and villages do not have access to the national
grid mean while there is a huge range of solar energy potential that can supply
electricity to the remote areas by off-grid connection. , In this regards this thesis is
to reveal the current solar usage as already stated, also deep into the barriers that
is hindering the usage of solar energy in Ghana.
1.2 Research Questions
This research question will critically look into the current usage and the barriers
preventing solar energy usage in Ghana. The research questions utilized were:
1. What is the current level of PV solar energy usage in Ghana?
2. What are the barriers in PV solar energy usage in Ghana?
3. What is the role of financing in the promotion of solar home systems in Ghana?
1.3 Methodology of the Research
The study on solar energy utilization in Ghana is based on desktop research and
literature review, and a case study of a householder in Ghana.
1.4 Limitations of the Research
This research was limited to desk top research and literature review due to lack of
financial resources to conduct a large scale survey of households in Ghana.
1.5 Outline of the Study
Chapter 2 describes the literature review stating the theoretical aspect of the thesis
by gathering information from existing articles, with a brief description on the re-
view of renewable energy sources. It also provides a review on solar energy, its

usage and barriers generally and finally a literature review on a current level of
solar energy utilization in Ghana and also the barriers preventing its usage in
Ghana.
Chapter 3 describes barriers of implementing renewable energy, and highlights on
framework for promoting RE. The role of financing in promotion of solar home
system is presented in Chapter 4 with an analysis on the payback period of a solar
home system. Conclusions and recommendations are presented in Chapter 5.
11
2 REVIEW OF RENEWABLE ENERGY SOURCES
This chapter describes the review of renewable energy sources. As of now the
demand for energy is at its peak due to the expansion of economy and also an in-
crease in population. As a result of this it will further increase in the near future if
nothing is done to curb this problem by seeking an alternative.
Renewable energy is made of resources that are replenished naturally, like wind,
solar, geothermal, biomass, and hydropower. It is also known as clean energy or
green power because it does not pollute air or water. The types of renewable ener-
gy sources that can be harnessed in different ways are: solar energy, wind energy,
biomass energy, hydropower and geothermal energy.
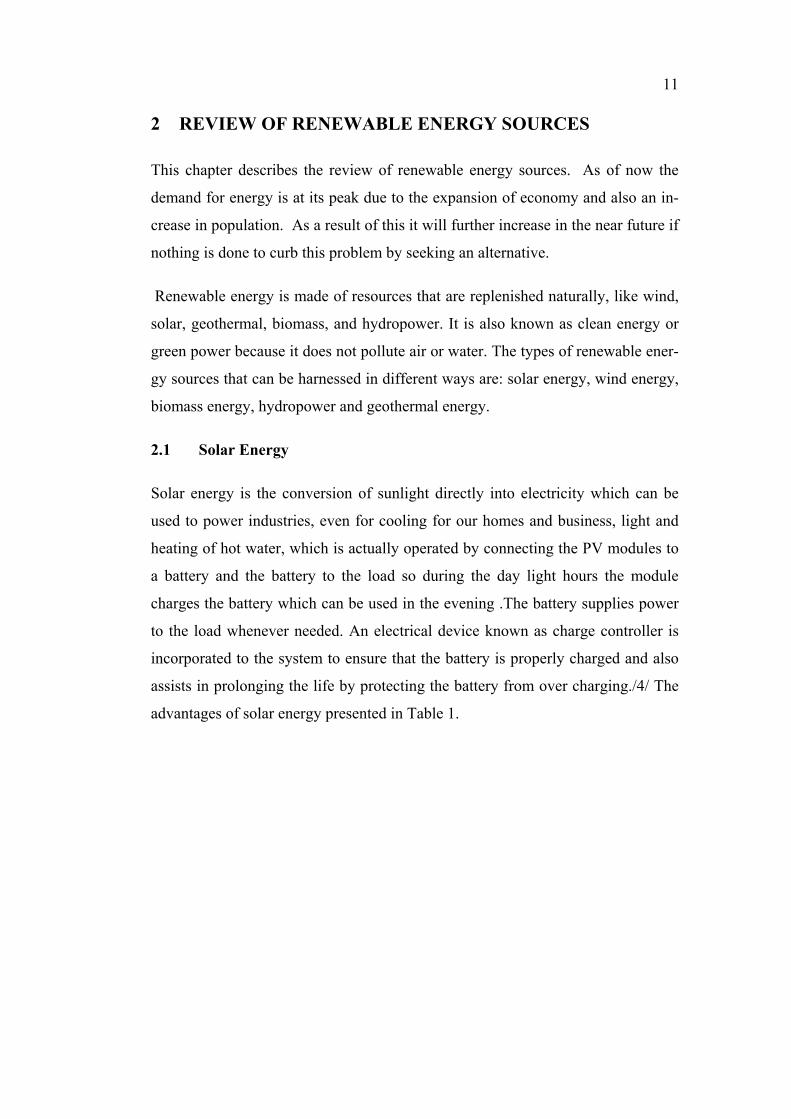
2.1 Solar Energy
Solar energy is the conversion of sunlight directly into electricity which can be
used to power industries, even for cooling for our homes and business, light and
heating of hot water, which is actually operated by connecting the PV modules to
a battery and the battery to the load so during the day light hours the module
charges the battery which can be used in the evening .The battery supplies power
to the load whenever needed. An electrical device known as charge controller is
incorporated to the system to ensure that the battery is properly charged and also
assists in prolonging the life by protecting the battery from over charging./4/ The
advantages of solar energy presented in Table 1.
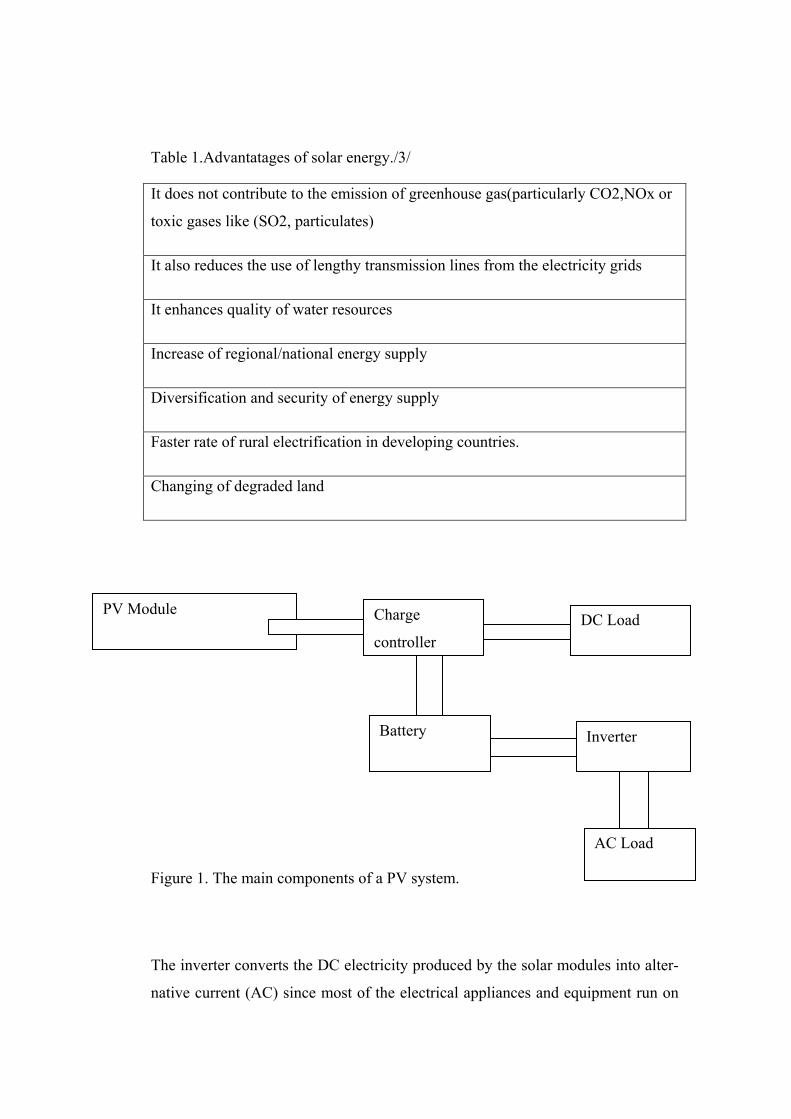
Table 1.Advantatages of solar energy./3/
It does not contribute to the emission of greenhouse gas(particularly CO2,NOx or
toxic gases like (SO2, particulates)
It also reduces the use of lengthy transmission lines from the electricity grids
It enhances quality of water resources
Increase of regional/national energy supply
Diversification and security of energy supply
Faster rate of rural electrification in developing countries.
Changing of degraded land
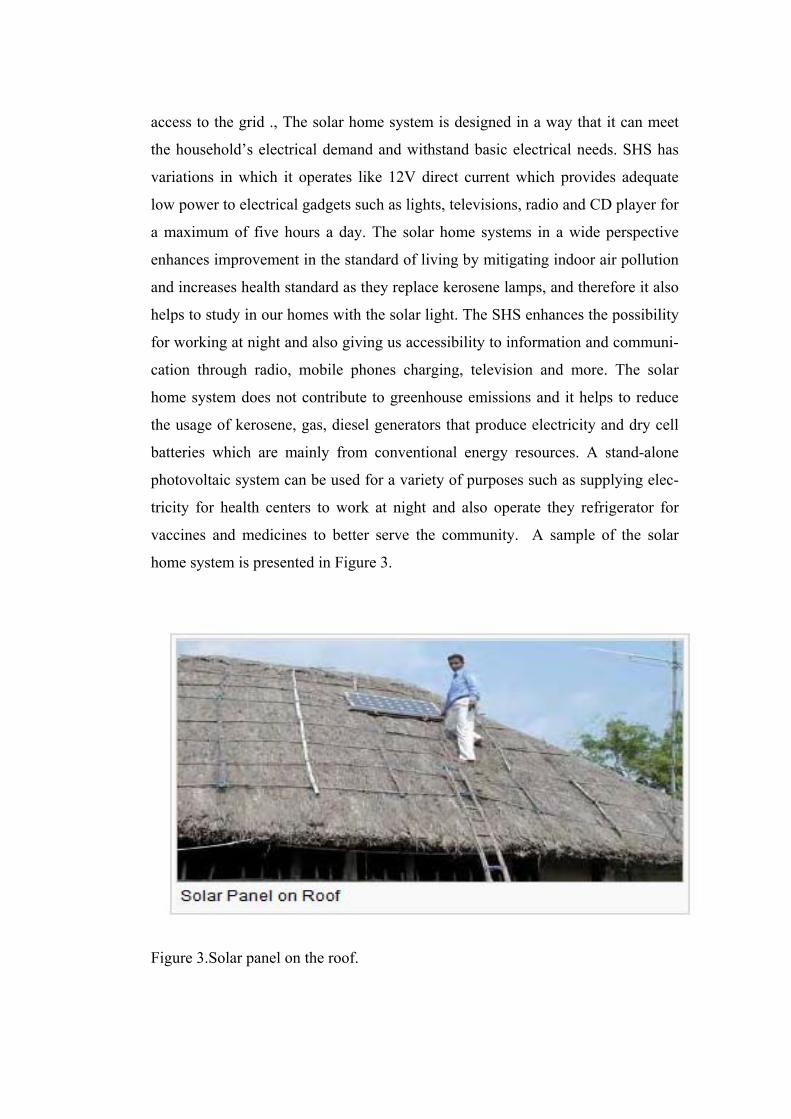
Figure 1. The main components of a PV system.
The inverter converts the DC electricity produced by the solar modules into alter-
native current (AC) since most of the electrical appliances and equipment run on
Charge
controller
DC Load
Battery Inverter
AC Load
PV Module

13
AC electricity and is also synchronized with utility power whenever the electrical
grid is distributing electricity.
A battery-stores energy when there is an access coming in and distributes it back
out when there is a demand. Meanwhile the PV panels always ensure that the bat-
teries are maintained and charged every day. The utility meter is automatically
provided to at night and during the day when the demand exceeds your solar elec-
tric production. A charge controller prevents the battery from overcharging and
thus prolongs the service life of the battery of the PV system. The sample of solar
power cell is presented in Figure 2.
Figure 2.Sample of solar cell. /21/
Due to the effects about the climate change, and a rise in energy consumption rate
it is the concern of the international agreement to mitigate the greenhouse gas
emissions and also to think about the alternative ways substitute the conventional
energy with solar energy. , Countries all around the world are establishing nation-
al goals to generate electricity from renewable sources and trying to implement
diverse solar energy policies in various countries.
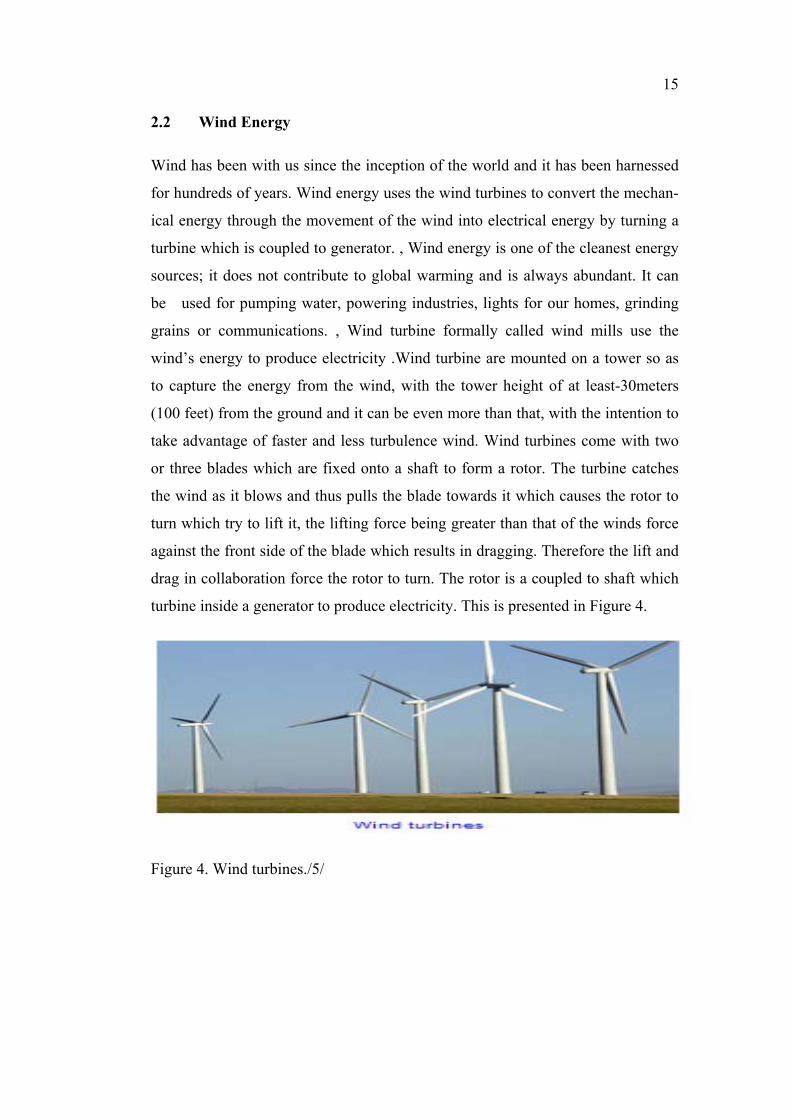
This thesis focuses on Solar Home System (SHS). SHS (see Figure .3 below) is a
stand-alone photovoltaic cell that supplies power for lighting and households ap-
pliances. It is generally used in a remote areas or rural areas where there is no
access to the grid ., The solar home system is designed in a way that it can meet
the household’s electrical demand and withstand basic electrical needs. SHS has
variations in which it operates like 12V direct current which provides adequate
low power to electrical gadgets such as lights, televisions, radio and CD player for
a maximum of five hours a day. The solar home systems in a wide perspective
enhances improvement in the standard of living by mitigating indoor air pollution
and increases health standard as they replace kerosene lamps, and therefore it also
helps to study in our homes with the solar light. The SHS enhances the possibility
for working at night and also giving us accessibility to information and communi-
cation through radio, mobile phones charging, television and more. The solar
home system does not contribute to greenhouse emissions and it helps to reduce
the usage of kerosene, gas, diesel generators that produce electricity and dry cell
batteries which are mainly from conventional energy resources. A stand-alone
photovoltaic system can be used for a variety of purposes such as supplying elec-
tricity for health centers to work at night and also operate they refrigerator for
vaccines and medicines to better serve the community. A sample of the solar
home system is presented in Figure 3.
Figure 3.Solar panel on the roof.
15
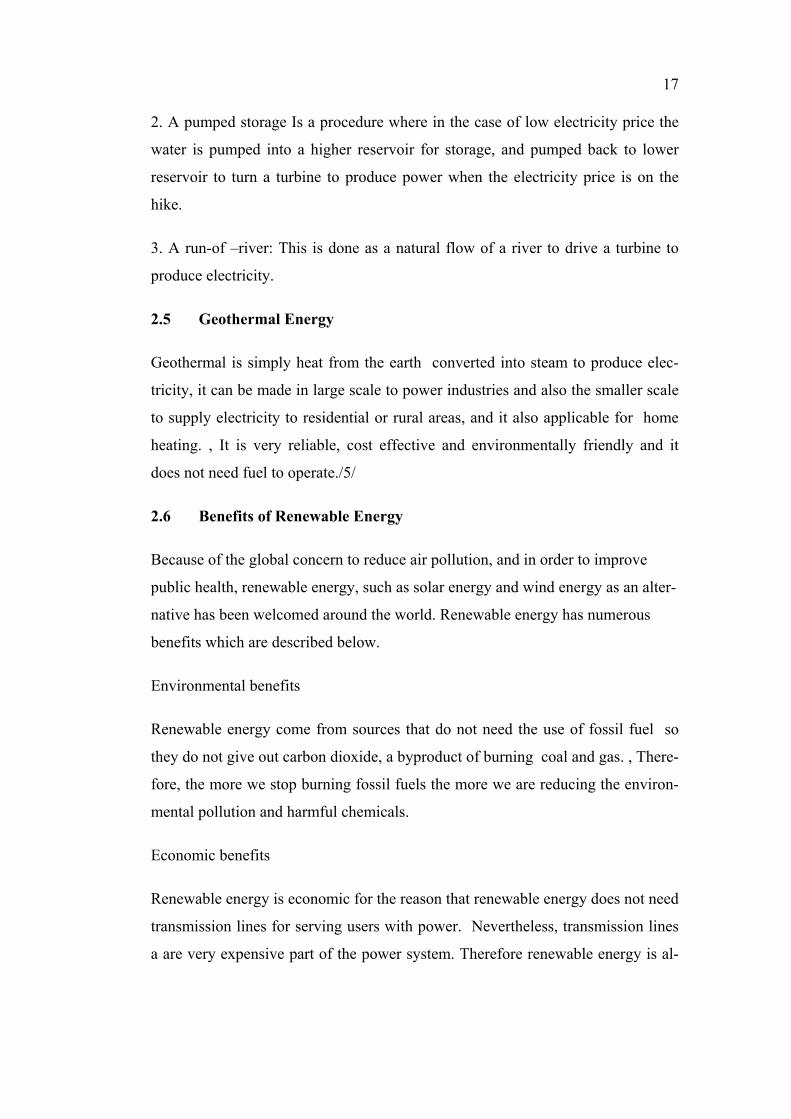
2.2 Wind Energy
Wind has been with us since the inception of the world and it has been harnessed
for hundreds of years. Wind energy uses the wind turbines to convert the mechan-
ical energy through the movement of the wind into electrical energy by turning a
turbine which is coupled to generator. , Wind energy is one of the cleanest energy
sources; it does not contribute to global warming and is always abundant. It can
be used for pumping water, powering industries, lights for our homes, grinding
grains or communications. , Wind turbine formally called wind mills use the
wind’s energy to produce electricity .Wind turbine are mounted on a tower so as
to capture the energy from the wind, with the tower height of at least-30meters
(100 feet) from the ground and it can be even more than that, with the intention to
take advantage of faster and less turbulence wind. Wind turbines come with two
or three blades which are fixed onto a shaft to form a rotor. The turbine catches
the wind as it blows and thus pulls the blade towards it which causes the rotor to
turn which try to lift it, the lifting force being greater than that of the winds force
against the front side of the blade which results in dragging. Therefore the lift and
drag in collaboration force the rotor to turn. The rotor is a coupled to shaft which
turbine inside a generator to produce electricity. This is presented in Figure 4.
Figure 4. Wind turbines./5/

2.3 Bioenergy
Bio-energy is an energy derived from biomass which includes woods, energy
crops, agriculture residues, food waste, or industrial waste and by-products to
produce electricity, fuel, and gas. It can be used in producing heat through the
process of bio heat: , combined use of bio heat and power is used to produce elec-
tricity for industrial, commercial and cooling purposes through the use biomass.
Bio -energy is increasingly attractive choice due to high fossil fuel price, and also
due to national energy independence, concerns about the use of conventional en-
ergy and global climate change. Bio-energy is one of renewable energies or clean
energies because its production does not contribute to environmental pollution or
emission of CO2. The biomass is presented in Figure 5.
Figure 5 Bio-mass in a form trees and plants./5/
2.4 Hydropower
Hydropower is renewable energy where the flow of water turns a turbine which is
coupled to a generator to produce electricity. , It is a reliable energy source and is
environmentally friendly: energy from hydropower has been exploited for centu-
ries. It is a cheap way to generate electricity, its source is free and clean fuel that
is renewed by snow or rain. Its power can be harnessed in three methods:
1. By storage is water stored in reservoir is released to a dam to turn a turbine to
produce electricity.
17
2. A pumped storage Is a procedure where in the case of low electricity price the
water is pumped into a higher reservoir for storage, and pumped back to lower
reservoir to turn a turbine to produce power when the electricity price is on the
hike.
3. A run-of –river: This is done as a natural flow of a river to drive a turbine to
produce electricity.
2.5 Geothermal Energy
Geothermal is simply heat from the earth converted into steam to produce elec-
tricity, it can be made in large scale to power industries and also the smaller scale
to supply electricity to residential or rural areas, and it also applicable for home
heating. , It is very reliable, cost effective and environmentally friendly and it
does not need fuel to operate./5/
2.6 Benefits of Renewable Energy
Because of the global concern to reduce air pollution, and in order to improve
public health, renewable energy, such as solar energy and wind energy as an alter-
native has been welcomed around the world. Renewable energy has numerous
benefits which are described below.
Environmental benefits
Renewable energy come from sources that do not need the use of fossil fuel so
they do not give out carbon dioxide, a byproduct of burning coal and gas. , There-
fore, the more we stop burning fossil fuels the more we are reducing the environ-
mental pollution and harmful chemicals.
Economic benefits
Renewable energy is economic for the reason that renewable energy does not need
transmission lines for serving users with power. Nevertheless, transmission lines
a are very expensive part of the power system. Therefore renewable energy is al-
ways connected to the distribution network and therefore nearer to the load which
results in saving cost and reducing power loss.
2.7 Power Quality and Reliability
Renewable energy allows the operators to have absolute control on the system
voltage because it is always made closer to the load centers. Renewable energy
comes from the sun’s heat, the amount of heat that is being emitted by the sun, is
is high enough to replace fossil fuels such as coal, gas and oil. Solar energy can
be harnessed through the use of photovoltaic solar panels at a farm or on a roof
top, therefore because they are renewable they protect and extend the life of the
limited sources.
Human health
Flue gases emitted by combustion of fossil fuels pollute the atmospheres which
result in diseases, such as asthma and even cancer. , With the use of renewable we
can do always with these harmful substances in the air.
Cost and Supply
Renewable sources are virtually free after the initial costs, after wind turbines has
been erected a and solar panels are installed. /6/
19
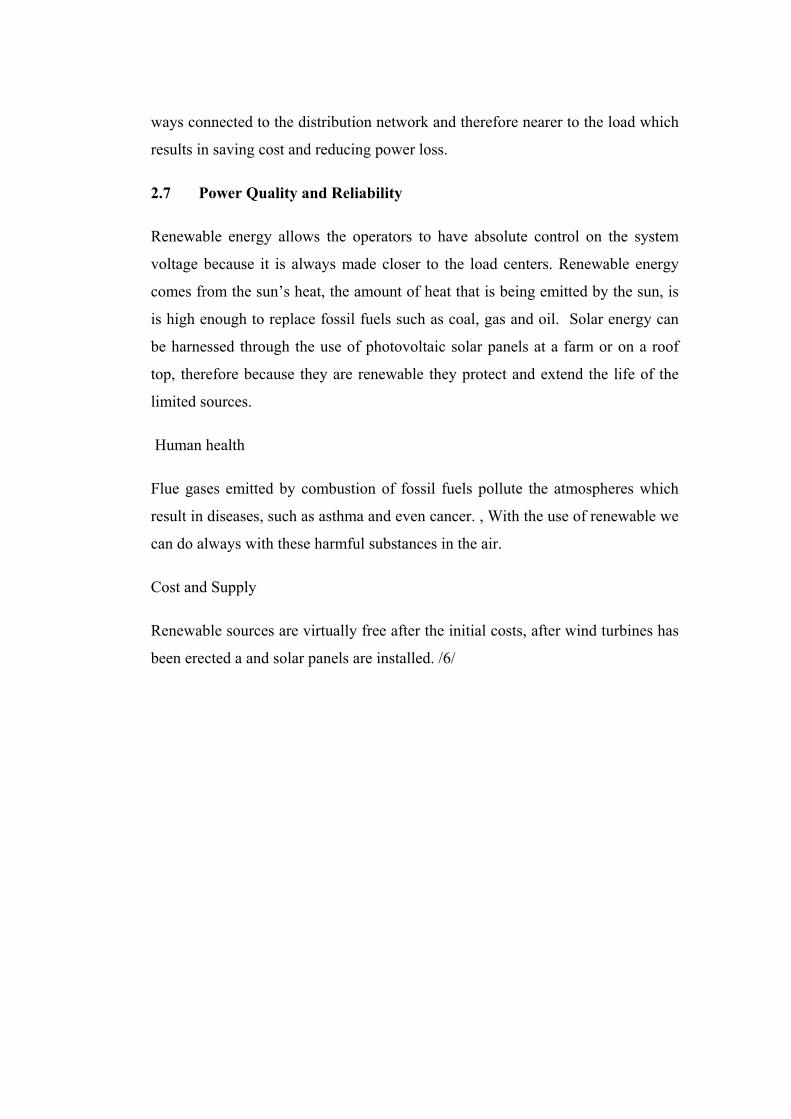
2.8 Problems Related to the Use of Conventional Energy Sources
The section describes the emission of CO2.
Figure 6. Power plant using conventional energy source.
The problems associated with the use of fossil fuels are::
a). Environmental Hazard: This mainly refers to pollution due to the use of fossil
fuels, emission of carbon dioxide, rise in temperature of the earth, which causes
melting of polar ice caps.
b) Rising prices: As because fossil fuels are exhaustible source they will one day
run out. , Therefore, OPEC always monitors the volume of oil consumed and posi-
tion itself to its production in order to maintain the barrel price which always re-
sults in price fluctuations, according to the U.S. Department of Energy.
c) Acid Rain: Burning of fossil fuels always emit sulphur dioxide gas which
causes acidic rain. This destroys lands, crops, marbles and water bodies. There is
a threat to aquatic life due to the transportation crude oil which at times causes
spillage over the sea.
d) Threat to human health: Burning of fossil fuels destroys causes the ozone layer
to thin as a result of the emission of greenhouse gases. The hole in the ozone layer
allows the harmful UV rays come directly to the earth surface. This causes diseas-
es, e.g. skin cancer.
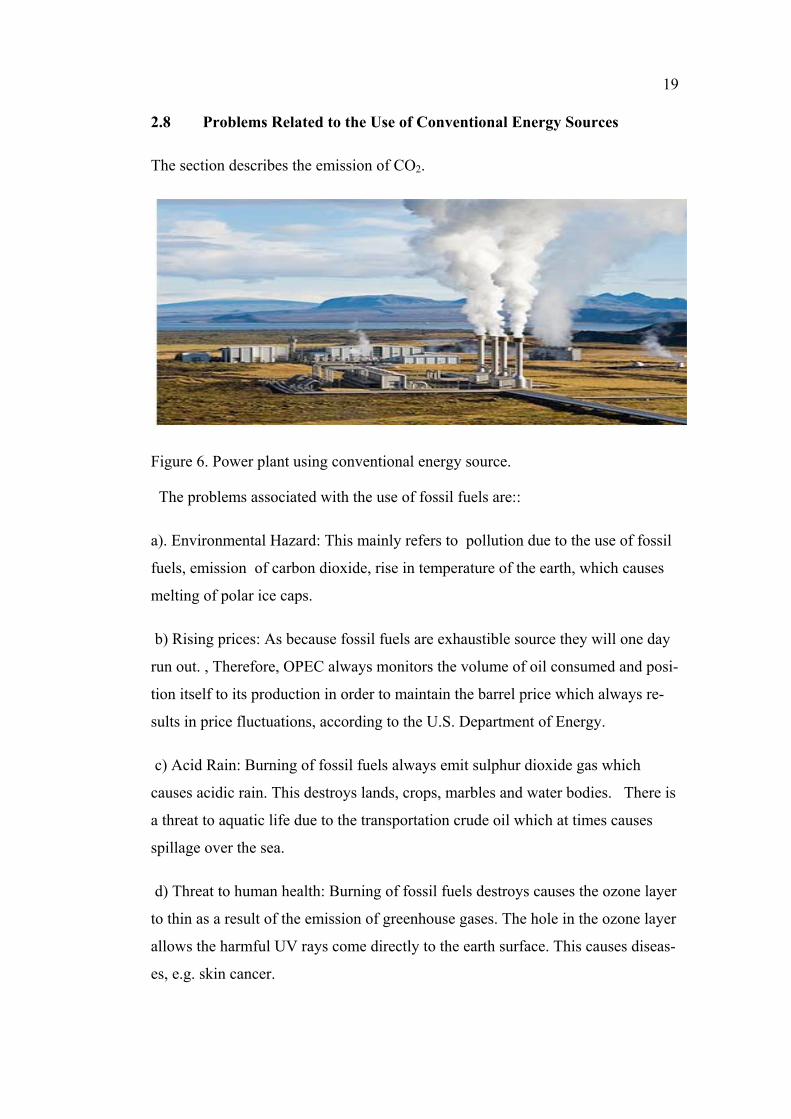
The threat mentioned above have forced many countries to formulate policies to
search for an alternative source which will not deplete the ozone layer, emit car-
bon dioxide, sulphur dioxide and are environmentally friendly. , Below is the ex-
ample of the emissions from conventional energy (Figure 6)./7/
Figure 7. Emission of CO2.
21
3 REVIEW ON SOLAR ENERGY USAGE.
Solar energy an alternative source which is clean and also in abundance and can
be harnessed in so many ways. This chapter will look at its usage globally. Solar
energy, being the cleanest source of energy that does not contribute to environ-
mental pollution or global warming, is the radiant heat and light energy emitted by
the sun that is converted into electricity. , The earth receives 175 petawatt (PW) of
solar radiation and even at the upper part of atmosphere at least 30% is reflected
back to the air and most of it is absorbed by the clouds. The total amount of sun-
light getting to the earth surface is more abundant and so vast in one year, it will
be as double as much as will ever be acquired from all the earth’s non-renewable
resources, such as coal, oil, natural gas and mined uranium put together. 2010 BP
Statistical Energy Survey shows that the world cumulative installed capacity of
solar energy was 22928.9MW as at 2009, which made up an increase of 46.9%
compared to 2008./8/
As from 2007 United State of America has increased it solar energy capacity by
17% making a total capacity of 8775megawatts (MW). , The USA has also in-
stalled another 342 photovoltaic panels (PV) of 139 thermal megawatts (MW) of
solar heating, 762 MWTh of pool heating, and 21MWTh of solar space heating
and cooling. /10/
At the end of 2007 Germany’s installed solar PV capacity was 3.8GW, making
Germany the world leader in solar installation. Spain has also been another coun-
try with abundant solar radiation, and in 2008 its solar energy installed capacity
was 3500MW, compared to France has solar energy capacity of 100 MW and
pledged to multiply it by 400 WM in 12 years’ time./9/
China also been a country with a lot of sun shine and has installed solar energy
capacity of 5GW targets to 70GW by 2015. Pakistan also has installed capacity of
23000MW with daily solar insulation of 5-7kwh/m2/day. The potential solar of
Europe is presented in Figure 8./11/
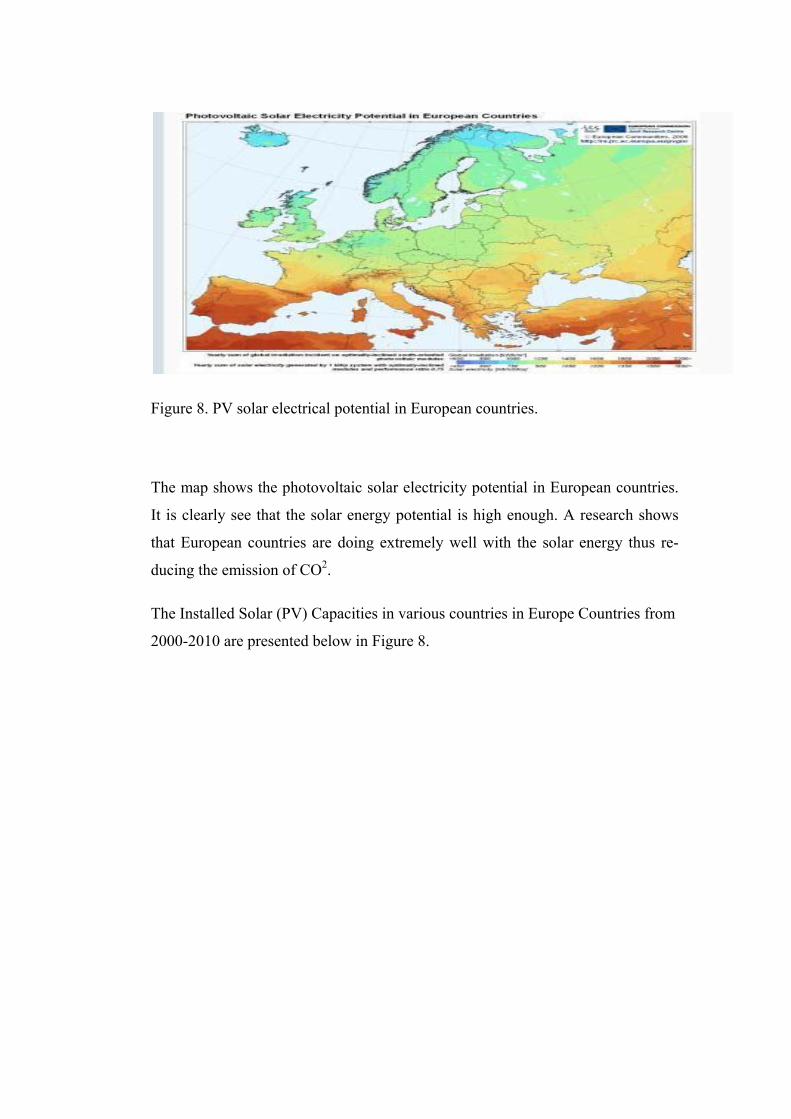
Figure 8. PV solar electrical potential in European countries.
The map shows the photovoltaic solar electricity potential in European countries.
It is clearly see that the solar energy potential is high enough. A research shows
that European countries are doing extremely well with the solar energy thus re-
ducing the emission of CO2.
The Installed Solar (PV) Capacities in various countries in Europe Countries from
2000-2010 are presented below in Figure 8.
23
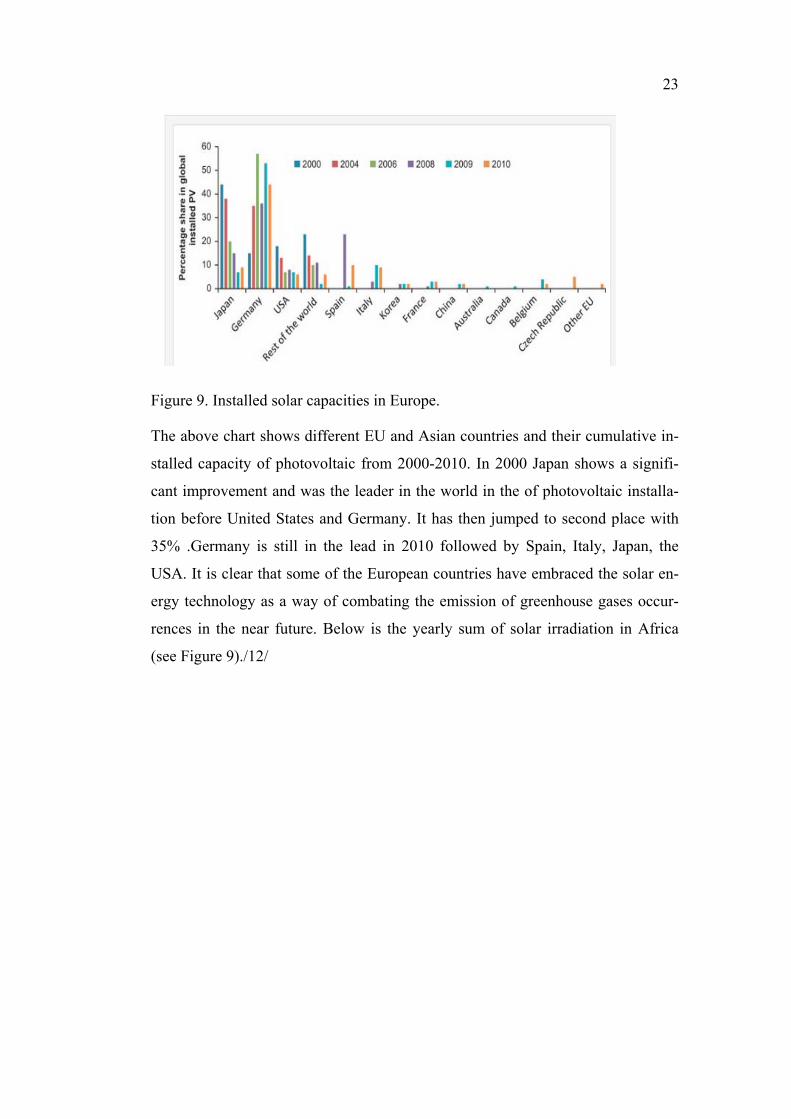
Figure 9. Installed solar capacities in Europe.
The above chart shows different EU and Asian countries and their cumulative in-
stalled capacity of photovoltaic from 2000-2010. In 2000 Japan shows a signifi-
cant improvement and was the leader in the world in the of photovoltaic installa-
tion before United States and Germany. It has then jumped to second place with
35% .Germany is still in the lead in 2010 followed by Spain, Italy, Japan, the
USA. It is clear that some of the European countries have embraced the solar en-
ergy technology as a way of combating the emission of greenhouse gases occur-
rences in the near future. Below is the yearly sum of solar irradiation in Africa
(see Figure 9)./12/

Figure 10. Solar radiation in Africa.
African has enormous solar radiation which can be harnessed in many ways to
solve their energy crisis and stop relying on fossil fuels. Based on the country lev-
el, Africa’s share of globally installed capacity of PV is less than 1%, meanwhile
the world solar map clearly reveals that the African continent receives the highest
amounts of solar radiation between 300 and 350 W/m2 annually. This even shows
that Africa continent is suitable for solar energy projects. In spite of all this high
solar potential, the continent makes the least in the usage of solar energy, thus re-
ferred to as the Dark Continent. Kenya and South Africa were in the lead with
barely 150,000 installed PV systems each, followed by Zimbabwe. The graph be-
low shows the usage of PV systems in South Africa, Kenya and Zimbabwe and
the rest of the Africa countries (see Figure 10).

25
Figure 11. Distribution of PV system in Africa.
The table above illustrates that Kenya and Zimbabwe are doing better economical-
ly on the PV development than Ghana. Ghana’s PV industry moved into PV de-
velopment during the 1990s, while Kenya and Zimbabwe took off quickly in the
1960s and 1970s. Through the mid- 1980s in Ghana the growth of solar energy
development was unstable./13/
3.1 Barriers of Implementing Renewable Energy.
The main barriers preventing renewable energy from expanding are high initial
cost, technical, economic and market institutional and also the size of the cost of
RE technologies. The growth of renewable energy may also come as a result of
Governmental policies and support, at least those that decline investment costs. ,
Governmental policies and risks are the main obstacles hunting the future growth
in world renewable energy use. Getting electricity from RE energy largely de-
pends on the commercialization of a large-scale solar energy technologies that
will bring down the investment costs and risks., Generating large quantity of en-
ergy from RE for future use also largely depends on Governmental climate change
policies, and research, development and demonstration by private and public sec-
tors interventions. Costs and pricing are other barriers for renewable energy.
Many people seem to think that renewable energy costs more than other energy
sources and this is seen in cost-driven decisions and policies that reject renewable
energy. In the other circumstances it is the fact that initial capital cost of a re-
newable energy technology are always higher on a cost-per-unit base as $/kw,
therefore allowing public subsidies may eventually reduce the costs of competing
fuels.
Numerous policies try to compensate for cost related barriers by giving out addi-
tional subsidies to assists renewable energy to expand, such as tax credits or in-
centives, and also implementing policies for special pricing and power purchasing
rules and lastly reducing transaction costs. Subsidies for competing fuels where
bigger institutions, such as World Bank and the International Energy Agency
have given fossil fuels more attention by putting global annual subsidies on con-
ventional energy sources(fossil fuels), as much as $1 trillion in buying of fossil
fuels annually. So giving large public subsidies on fossil fuels reduces final ener-
gy price thus putting renewable energy under disadvantage if it is not also treated
equally. High initial capital costs is also underpinning the growth of renewable
energy which makes it unable to give high installed capacity to the initial dollar
invested compared to the conventional energy sources. It is therefore clear that
renewable energy in its entirety needs more finance for the same capacity of con-
ventional energy sources. /14/
3.2 Barriers in Solar Energy Usage.
Solar energy technology is gaining less popularity due to some certain barriers,
therefore this section will highlight on the overview of the barriers contributing to
its usage in developing countries.
3.2.1 Barriers in Solar Energy Usage in Nigeria
This section will highlight the barriers affecting solar energy usage in Nigeria. Ni-
geria is one of the biggest countries located in West Africa, with annual daily av-
erage solar radiation estimated to vary from about 12.6MJ/m2/day
(3.2kwh/m2/day- 25.2MI/m2/day (7.0kwh/m2/day) . , A series of barriers under-
pinning the expansion of solar energy include:
Variability and intermittency of radiation: ; the minimum duration of sun-
shine in the southern part and northern part of the country is estimated to

27
vary from 4h to 9hrs/day , therefore the availability of sunshine fluctuate
and also not consistent.
Grid unreliability: this poses a serious threat to solar energy because as of
now the transmission grid in Nigeria operates at a maximum of 132 and
330KV.
Lack of awareness and information: the information about the develop-
ment and benefit of PV are inadequate.
High initial investment cost: this is one of the barriers that underpin the
development of PV in a developing country like Nigeria, and there are no
incentives on the import of PV devices for the local manufacturers in the
country.
Operation and maintenance costs: as a result of inadequate technical
skilled personnel the operation and maintenance cost is appreciably high.
Government policy and incentives: policies implemented by the govern-
ment on energy favored only conventional energy sources by supporting
them with subsidies leading to a low patronage in PV system.
Cost reduction measures: development of solar energy in Nigeria is pos-
sible but the finance of the project is not available. Financial institutions
can be made to grant loan to retailers at a low rates so as to enable them to
develop the solar energy technology.
Competition with land uses: land issues are very critical for PV projects
as land owners or the communities are preventing the release of their lands
for fear of total destruction of the heritage.
Consistent awareness creation: solar energy can be implemented success-
fully in a large scale with the support of public./23/
3.2.2 Barriers in Solar Energy Usage in China
China has solar energy in abundance in the north western area which occu-
pies approximately 2/3 of the territory. This solar energy can be amounted to
1,7 x 10⁻⁶ million tons of coal equivalent, but the barriers which prevent so-
lar energy form expanding includes:

Lack of market base: proper stable market must be established for
the PV which cannot be disturbed be improper actions.
The unbalanced development of regional economy: as a result of
excessive emphasis on the economy benefit, a series of regional
development has become urgent.
The scale barrier of renewable industry: due to a low feed-in tar-
iff the power generation from PV has declined, which adversely af-
fects the manufacturers to develop solar energy.
The lagged construction of power grid: the lagged construction of
the power grid has made it extremely difficult to interregional trade
and transmission which prevents the implementation of PV./24/
3.2.3 Barriers for Solar Energy Usage in Hong Kong
Hong Kong has enormous solar energy potential which is estimated to be
5944GWh per year and can be equated as 16% of the annual electricity
consumption, . However the average solar radiation available on the hori-
zontal surface is estimated to 1.28MWh/m2. The barriers underpinning
the development of solar PV are presented below;
o Long payback period: this is considered as the second biggest bar-
rier to development to use of solar system, and also the high cost of
the raw material, for example the pure silicon, and the fabrication
product contributed to the long duration of the payback period.
o High initial and repair costs: this has to do with PV panels,
mounting hardware, circuit breakers and inverters and cables.
o Inadequate installation space and service infrastructure: In Hong
Kong 50% of the electricity is consumed by air condition during
the summer time, however the installation and positioning of PV
panel have to face the south and north hemisphere at an angle
equivalent to the latitude of the location, therefore due to anomalies
a solar system cannot be installed in the building in Hong Kong.
29
o Lack of stakeholder/community participation in energy choices:
incentives given to private sector and utility companies are very
small; this leads to low development of the PV system.
o Legal and regulation constrains: clearer legislation is needed
concerning the various impacts, for example, possible direct/ indi-
rect ,short-/ long term reversible effects of using solar energy./25/
In summary, the barriers for solar energy usage can be described as follows:
High initial cost is the main barrier to PV
Difficult to finance, the system needs easy accessibility and approach to
financing.
Lack of training: more qualified experts will be needed for the installation
of the PV system.
Inadequate communication, the prospective consumer must be given the
adequate information about the advantage in using PV system.
Lack of credibility: the PV system must be given a full credible endorse-
ment so that consumers can have confidence in it.
Failure to account for full value: value for PV must be emphasized, for
example, value for homes with PV, status and environmental value.
Insufficient governmental support for the purchase of solar power.
Relatively there is more abundance of conventional energy sources.
Assurance of credit is being given to the export of conventional energy.
Consumers are unaware of PV system
Inability to get on board energy providers in PV deployment.
Subsidies supporting conventional energy interests, meanwhile solar PV
does not have equal assistance.
Lack of marketing: manufacturers lack of the necessary market about the
solar PV and also lack the nonfinancial benefit of PV. /26/
3.3 Framework for Promoting Renewable Energy
This section will highlight on framework conditions for promoting renewa-
ble energy. It will therefore be suggested that policy and legal framework,

energy sector competition and bias, market performance, and financing are
the critical factors required to promote renewable energy technologies such
as the solar home system. The framework is presented below in Table 2.
Table 2.Framework condition on renewable energy./31/
Policy and legal Framework: It will be important that putting in place imple-
mentation of policy and legal frame will allow renewable energy to grow and
compete with the conventional energy sources, in fact without these policies, it
will be difficult for investors like Independence Power Producers to go into re-
newable energy and thereby sell their power to the grid or a third party under the
auspices of power purchase agreement. This situation creates a lot discomfort for
project developers to plan and finance projects. Transmission access is one of
31
the key factors of renewable energy producers as the power produce must be
transmitted or distributed to the end consumer which more or less depends on the
location and which utilities disallows transmission access to renewable energy
producers or charged high prices for this.
Energy sector competition and bias: Low cost of conventional sources are made
possible because more attention is paid to fossil fuels than renewable energy
sources because of large public subsidies such as direct budgetary transfer, tax
incentives, research and development spending, liability insurance, leases, land
right way and waste disposal are the assurances given to fossil fuels to reduce pro-
jecting finances. , As renewable energy does not have access to these incentives, it
has a competitive disadvantage.
Market performance: Lack of information on renewable energy makes difficult
for project developers to source finance from the banks because it is unknown
whether the utilities will allow long term power purchase agreements to buy the
power.
Financing: Due to high risks associated with renewable projects without any
available compensation it scares financiers to invest into because renewable ener-
gy is considered to be unattractive to consumers it depends on the country, for ex-
ample, in the United States loans are made available for all sectors, and it has a
low interest rate is also given for renewable energy to promote it.
In this study, the focus is on SHS, and thus it is explored how financing can be
used to promote the use of solar home system in Ghana. The next chapter de-
scribes the energy usage in Ghana and the expected role of solar SHS./31/
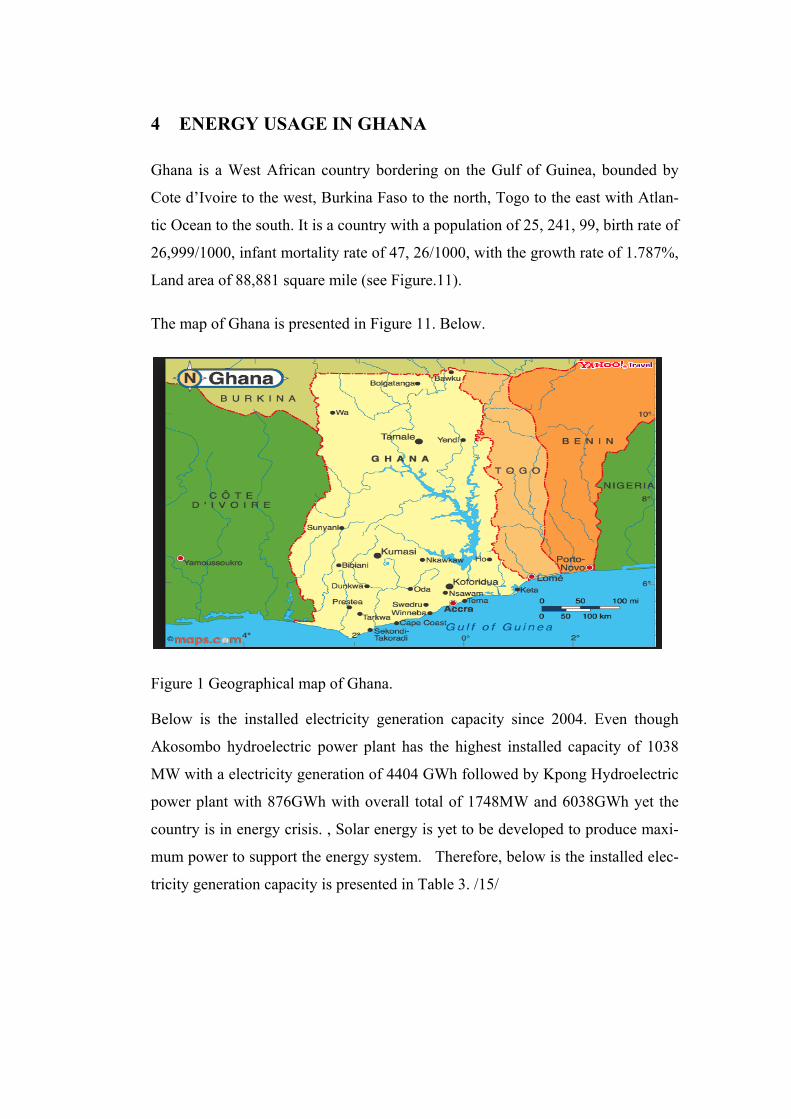
4 ENERGY USAGE IN GHANA
Ghana is a West African country bordering on the Gulf of Guinea, bounded by
Cote d’Ivoire to the west, Burkina Faso to the north, Togo to the east with Atlan-
tic Ocean to the south. It is a country with a population of 25, 241, 99, birth rate of
26,999/1000, infant mortality rate of 47, 26/1000, with the growth rate of 1.787%,
Land area of 88,881 square mile (see Figure.11).
The map of Ghana is presented in Figure 11. Below.
Figure 1 Geographical map of Ghana.
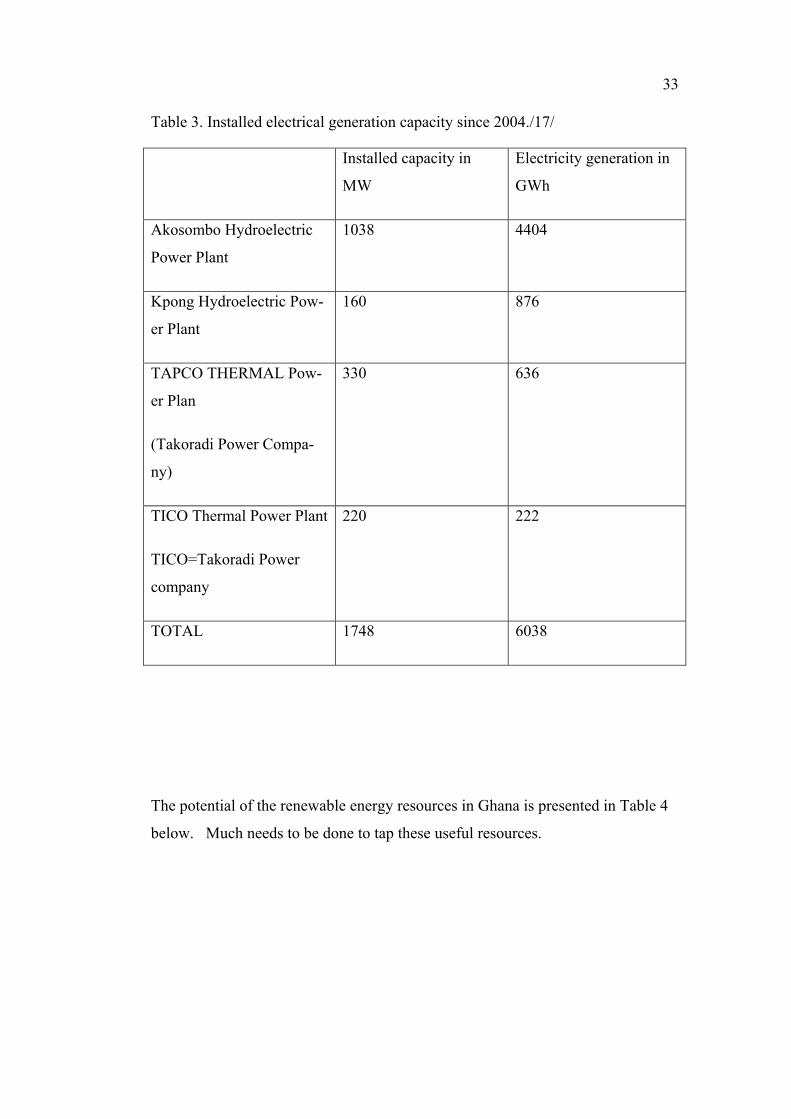
Below is the installed electricity generation capacity since 2004. Even though
Akosombo hydroelectric power plant has the highest installed capacity of 1038
MW with a electricity generation of 4404 GWh followed by Kpong Hydroelectric
power plant with 876GWh with overall total of 1748MW and 6038GWh yet the
country is in energy crisis. , Solar energy is yet to be developed to produce maxi-
mum power to support the energy system. Therefore, below is the installed elec-
tricity generation capacity is presented in Table 3. /15/
33
Table 3. Installed electrical generation capacity since 2004./17/
Installed capacity in
MW
Electricity generation in
GWh
Akosombo Hydroelectric
Power Plant
1038 4404
Kpong Hydroelectric Pow-
er Plant
160 876
TAPCO THERMAL Pow-
er Plan
(Takoradi Power Compa-
ny)
330 636
TICO Thermal Power Plant
TICO=Takoradi Power
company
220 222
TOTAL 1748 6038
The potential of the renewable energy resources in Ghana is presented in Table 4
below. Much needs to be done to tap these useful resources.

Table 4. Energy resources in Ghana./16/
Resources Value Units Rank Period Sources
Wind Po-
tential
1,124 Area(km2)
Class 3-7 Wind
at 50m
59 1990 NREL
Solar Poten-
tial
706,055,035 MWh/year 73 2008 NREL
Coal Re-
serves
Unavailable Million Short
Tons
N/A 2008 EIA
Natural Gas
Reserves
22,650,000,000 Cubic Meters
(cu m)
76 2010 CIA World
Factbook
Oil Re-
serves
15,000,000 Barrels(bbl) 87 2010 CIA World
Factbook
Source: Energy commission (year 2010) /17/
Ghana has been experiencing a series of power crises for more than two decades
because of the over reliance on hydroelectric power which mainly depends on rain
fall pattern of the country. Studies shown by Energy Commission of Ghana 2006,
show, that grid electricity demand will go up about 6,900GWh between 2000 and
2015 and is also likely to increase again to 24,000GWh by the end of 2020. For
the country to ensure stable power supply by the year 2020, an additional source
must be tapped to generate electricity to assist the existing. Ghana government has
targeted 10% energy generation from renewable energy which will mainly come
from solar energy. /16/
4.1 Solar Potential in Ghana
This section presents the potential of solar energy in Ghana. The solar radiation
map is presented in Figure 12. The red part is the three northern regions, namely
Northern region, Upper east and Upper west which the most solar energy potential

35
is followed by Greater Accra region with a lot of solar possibilities but not as
much as the three northern regions. The deep yellow and the light yellow repre-
sent the region with least solar energy possibilities (See Figure 12).
Figure 13. Solar map of Ghana.
Solar energy resource is potentially high in Ghana with 4.5kwh/m2-5.6kwh/m2 of
daily solar irradiation range with sunshine duration of between 1,800 and 3,000
hours per annum. Below is the solar energy intensity in Ghana is presented in the
table below (See table 5)./17/
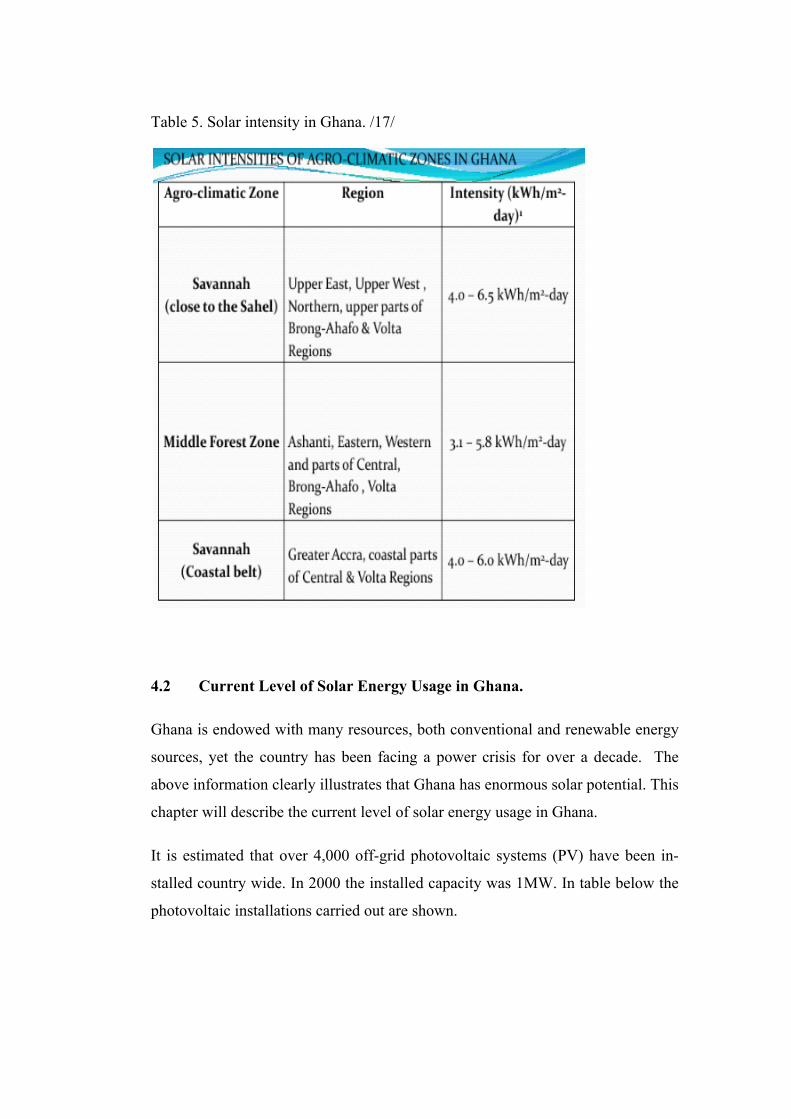
Table 5. Solar intensity in Ghana. /17/
4.2 Current Level of Solar Energy Usage in Ghana.
Ghana is endowed with many resources, both conventional and renewable energy
sources, yet the country has been facing a power crisis for over a decade. The
above information clearly illustrates that Ghana has enormous solar potential. This
chapter will describe the current level of solar energy usage in Ghana.
It is estimated that over 4,000 off-grid photovoltaic systems (PV) have been in-
stalled country wide. In 2000 the installed capacity was 1MW. In table below the
photovoltaic installations carried out are shown.

37
Table 6.Solar installations and their capacities./17/
Solar Capacity Location
4kwp Kwame Nkrumah University of Science
and Technology.
4kwp Energy Commission
50kwp Ministry of Energy
155MW Nzemaa District(Aiwaiso)
2MW Navrongo
4.3 Barriers in Promoting Solar Energy in Ghana
The literature highlighted various barriers preventing the implementation and use
of solar energy in various developing countries. Similarly, solar energy developers
and installers are facing the same problem in Ghana. The main problems that pre-
vent the use of solar energy in Ghana are presented below:
High cost components, leading to high system cost.
Lack of financing for consumers.
Lack of financing for service providers and installers.
Perception of high cost of solar PV by the public.
Unresponsiveness of potential market groups: for example the real estate
industry.
Awareness creation; another barrier that has underpinned the development
of PV in Ghana. At least consumer demands will increase once the
awareness is built up and PV market will also grow: The low level of ed-
ucation on PV is due to over dependence on the national grid.
Government policy direction on energy: There are numerous barriers pre-
venting expansion of solar energy usage: The government of Ghana’s ex-

penditure on the national grid over the years has been more or less consid-
erably compared to PV. grid extension to rural areas is one of the prime
drivers of low wide spread of PV as compare to another developing coun-
tries./29/
4.4 Financing of Solar Home System
There is a very high potential of solar energy in Ghana but little is done to tap this
energy into use. As of now there is no financial aid for PV development. In de-
veloped countries such as United States, Germany etc., there are subsidies for PV
but the government of Ghana has not provided any subsidies for this enormous
system. Also the interest rates are very high as a result the local financial institu-
tions feeling reluctant to offer loans to project developer. The great public also
thinks that the PV technology is immature. International financial bodies like
World Solar Programme and Global Environmental Facility are yet to be estab-
lished in Ghana. It will be in the best interest that financing of this system is car-
ried out in two ways: by financing the end consumer as a way of enabling the sys-
tem to be more affordable and secondly financing the retailers and also the service
providers to boost their activities. The cash price for a fundamental DC SHS is
between 500 USD to 1200 USD, which actually depends on the size, and also the
quality of the components. Taking into account the taxes and duties of that coun-
try, the cost of installation for a SHS domestic system is from 7 USD. In certain
countries, (for example in Indonesia, 1994) to 26 USD. (For example in Kenya,
1993). The cost of PV module has decreased from 20 USD.wp-1as in 1980 to the
current price of 5 USD.wp and it is expected to reduce more as a result of econo-
mies of scale.
Of course PV technology is known to be maintenance free, but the operational
cost of the SHS over the life time is made to be added to the purchase price. ,
Typically, a monthly payment of 5 USD to 10 USD is made to by the consumer.
In comparing the SHS and conventional grid extension in economy wise, the price
of transmission line to the rural community is approximately 10000 USD.kw, and
also the traditional energy sources, for example kerosene and candles causes a lot
smoke which is not good for human health. It is therefore clear the SHS stands
39
economical for the purpose of rural areas, meanwhile the cost of grid extension
electricity on a small scale is amounted between 2 USD.kw to 10 USD.kw, whilst
PV electricity to the rural community cost between 1 USD .kw to 3 USD.kw.
4.5 Financing SHS
The target group for SHS in the study is a per-urban and rural household. Studies
have shown that these households have different incomes that can affect the pur-
chase of solar home systems. For example, Photovoltaic Power Systems Program
stated the factors influencing the willingness to pay for SHS as:
Operational problems: Although operational problems exist in large numbers,
consumers have realized in a short period that the SHS system is not maintenance
free. Balance of system (BOS), for example battery and fluorescent lamps (with
electronic ballast), and also BUC, are the main problems of the SHS system. The
earlier failure of the battery can be addressed by efficient information on its life
span which also has to do with for example, the type, the size, the brand and also
the quality of it usage pattern and required maintenance. , For the BCU and the
fluorescent lamps, it has not come to the notice of the consumer but its poor per-
formance has become recently known is due to absent of technical standard which
has not checked systematically. As a matter of fact the major challenge to the SHS
for the future is the battery, BCU and the fluorescent is due to its quality that is
not assured, which deter the public from accepting the SHS. Of course high quali-
ty comes with durability and high price, so the consumers have to choose whether
to buy low quality with a cheap product or choosing to go with the one that is ex-
pensive and durable./30/
Awareness of system´s capacity: Another issue that to do with the consumer’s
knowledge is the awareness the limited capacity of the SHS he/ she owns. The
limitation of electricity supply of the installed SHS may be regarded as second
class power, but the issue of limiting the consumer SHS is actually easier said
than done: , electrical appliances are made in a precision to the consumer expecta-
tion and choices and not the other way round. The expected generating capacity of
the SHS needs from the consumer a more or less static consumption behavior , not
adding extra loads to the system when required. The expansion of the SHS needs
additional panels which come with additional investment and operational costs.
Electricity consumption in a newly electrified community for the first month after
grid connection is between 0.5kwh-1.0kwh per day per household, consumption
cannot be satisfied with this type of standard SHS installed.
Political disincentives: Political disincentive has been one of the major draw-
backs into a low credit recovery, and is due to how the credit services are ruined
and managed. So in the case of SHS the government has been the major stake-
holder and to a large extent shows how the credit are established, so the interven-
tion of the government in this sector illustrates the direct target of the pro-
grammes on regional terms. In normal circumstances a huge chunk of funds stem
from government sources and come with special conditions, and at every time
with direct subsidies to utilities, or intermediaries or at time directly subsidizing
the SHS consumers. As the consumer became aware that the government has to
bear the total costs of installation of the SHS, . So in short special incentives has
to be implemented so as to enable the public to patronize the use of solar energy
which intend can enhance the increase of the SHS. /30/
Subsidies: Subsidies has always been the issue for SHS. The difference is made
between good, bad, smart, and bad subsidies. Subsidies are very much important
for banks, dealers and private sector manufacturers who are trying to enter into
PV business. Other benefits that subsidies have are as follows: employment ef-
fects, education of banks and political decision makers, training of technician of
dealers and utilities. ./30/
4.6 Case: Role of Financing in Promoting of Solar Home System
The financial analysis of Solar Home System is carried out based on the infor-
mation gathered from a household in Dawenya a suburb of Tema in Greater Accra
region. The cost of this system is taken from the investment point of view and also
yearly stand point and how the provision of subsidy can influence the purchase
41
and payback period of SHS. Below is the financial indicator which is used to look
into the potential of the solar home system.
b) The Payback Period
c) Net Present value
Payback period- is the time at which the initial cash flow of an investment is
made to recover from the cash inflows generated by the investment excluding
debt payment, therefore the formula to calculate the payback period is presented
below. : In this thesis the focus will be specifically on the payback,
Payback Period = Initial investment
Cash Inflow per period
Net present value is simply the sum of the present values of the individual cash
flows. The mathematical expression is presented below:
NPV = Total present value of the net
Amount to be invested
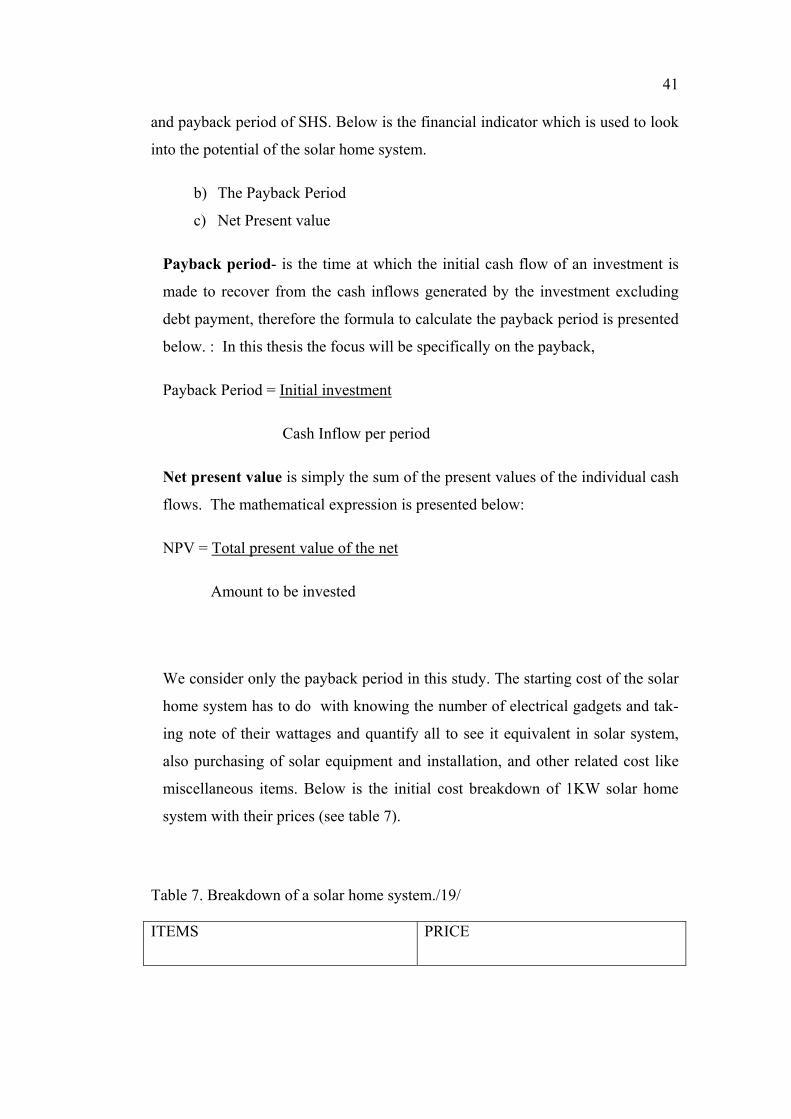
We consider only the payback period in this study. The starting cost of the solar
home system has to do with knowing the number of electrical gadgets and tak-
ing note of their wattages and quantify all to see it equivalent in solar system,
also purchasing of solar equipment and installation, and other related cost like
miscellaneous items. Below is the initial cost breakdown of 1KW solar home
system with their prices (see table 7).
Table 7. Breakdown of a solar home system./19/
ITEMS PRICE

Solar Panel Pma x 1080w $ 06-0.8 per watt
Inverter output 1000W $ 89.00
Charge controller 48V, 30A $ 133.00
Battery capacity 48V, 400AH $ 13-19.00
This section is high lighting the calculation of monthly and annual saving on
SHS. Below is the Load Requirement based on an interview with a household liv-
ing in Dawenya-Ghana, see Table 8. Table 8 should the daily consumption of the
householder and the electricity bill paid. A proposed SHS of 1kW is to be pur-
chased by the householder. A 1kW solar system presented in Table 9 consists of
load requirement of a household.
Table 8. Cost of solar components parts./19/
Solar Component Cost
Solar Panels $ 829.6
Inverter $ 31.52
Charge controller $ 31.5
Battery $ 94.7
Table 9. Load requirement of a household.
LOAD REQUIREMENTS
APPLIANCES QUANTITY WATTAGES HOURS
USED
TOTAL
KWH

43
Television 1 300 3 900
Fridge 1 200 24 4800
CD player/ radio 1 120 24 4800
Cell phones 3 5 2 30
Electric iron 1 1600 1 1600
Standing fan 1 65 2 260
Ceiling fan 1 120 8 960
Electric stove 1 1500 1 1500
Bathroom bulb 1 15 1 15
Washroom bulb 1 15 1 15
Kitchen bulb 1 10 5 50
Outside bulbs 3 34 5 510
Bedroom bulb 1 5 4 20
Corridor bulbs 2 5 4 40
TOTAL 15500
Amount paid/month
(electricity bill)
Ghc
160.00
The payback period of a PV solar home system is presented in the steps below.
STEP 1: Determine the monthly electricity bill. This amount was obtained from
the electricity bill of the householder, in this case, GHc 160.00.
STEP 2: Determine the kilowatt used by the householder. Kilowatt hours per
month is 465kwh, which is the daily consumption of 15.5 multiplied by 30 days
and is expressed below:
15.5*30 = 465 kilowatt-hours per month.
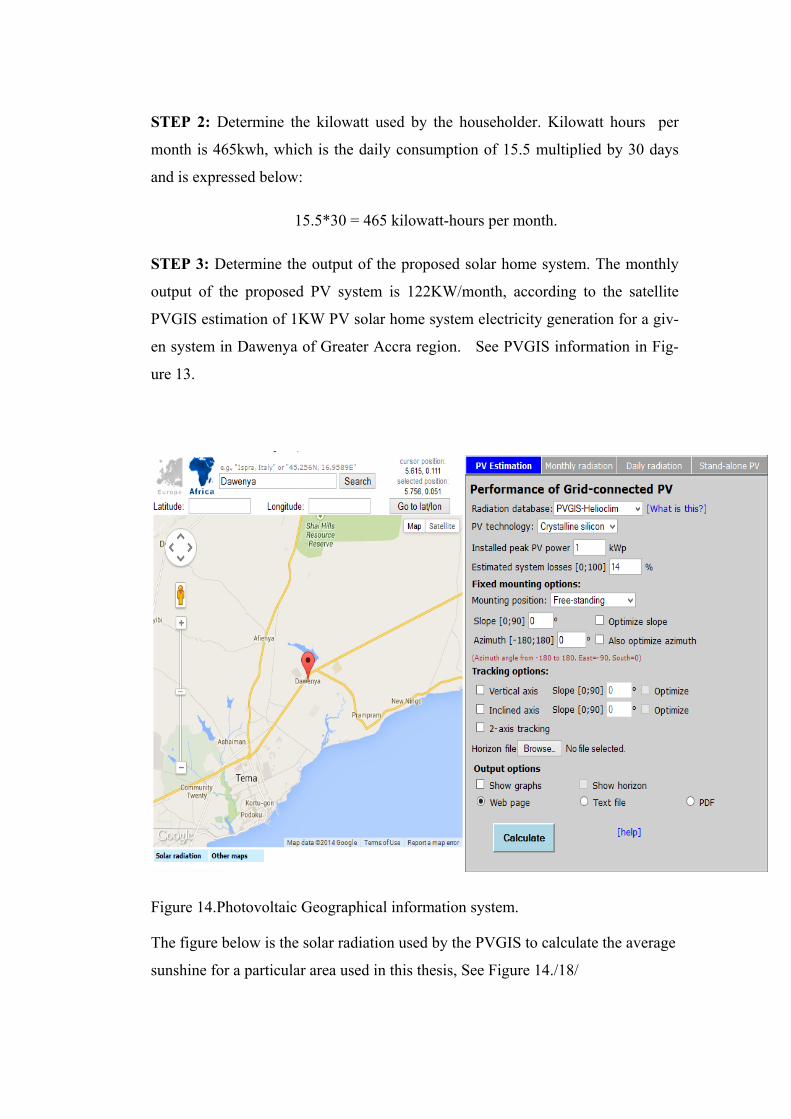
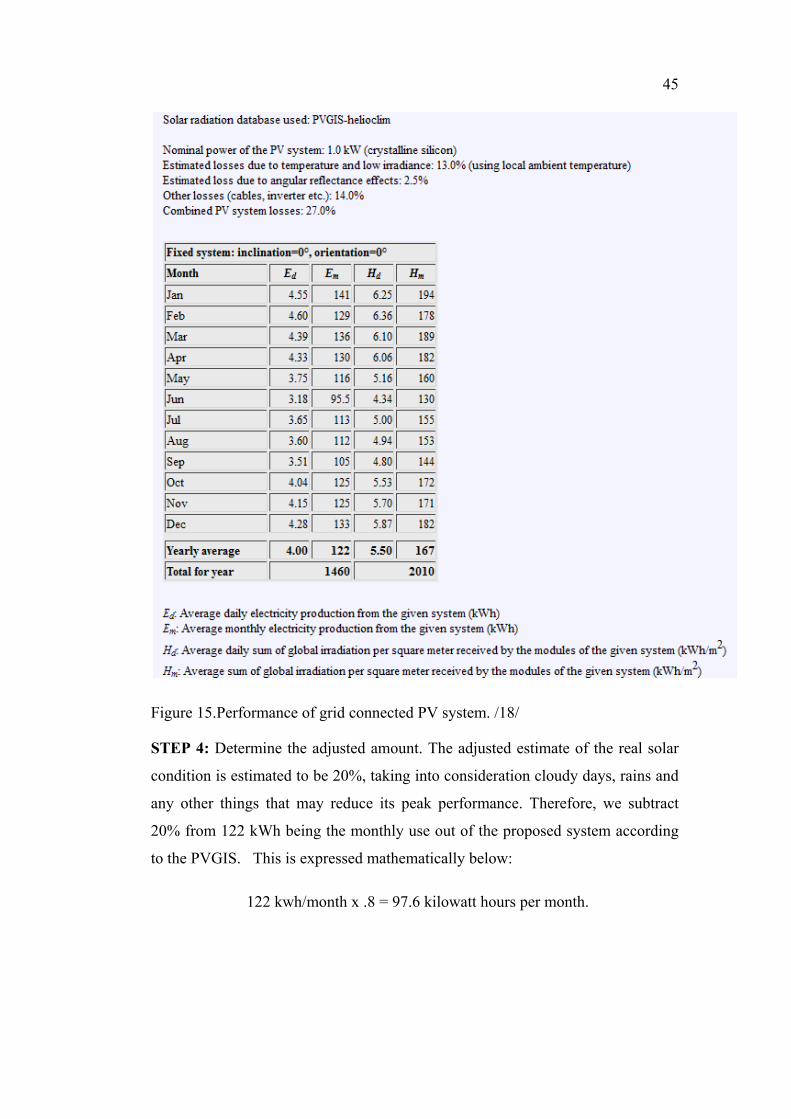
STEP 3: Determine the output of the proposed solar home system. The monthly
output of the proposed PV system is 122KW/month, according to the satellite
PVGIS estimation of 1KW PV solar home system electricity generation for a giv-
en system in Dawenya of Greater Accra region. See PVGIS information in Fig-
ure 13.
Figure 14.Photovoltaic Geographical information system.
The figure below is the solar radiation used by the PVGIS to calculate the average
sunshine for a particular area used in this thesis, See Figure 14./18/
45
Figure 15.Performance of grid connected PV system. /18/
STEP 4: Determine the adjusted amount. The adjusted estimate of the real solar
condition is estimated to be 20%, taking into consideration cloudy days, rains and
any other things that may reduce its peak performance. Therefore, we subtract
20% from 122 kWh being the monthly use out of the proposed system according
to the PVGIS. This is expressed mathematically below:
122 kwh/month x .8 = 97.6 kilowatt hours per month.
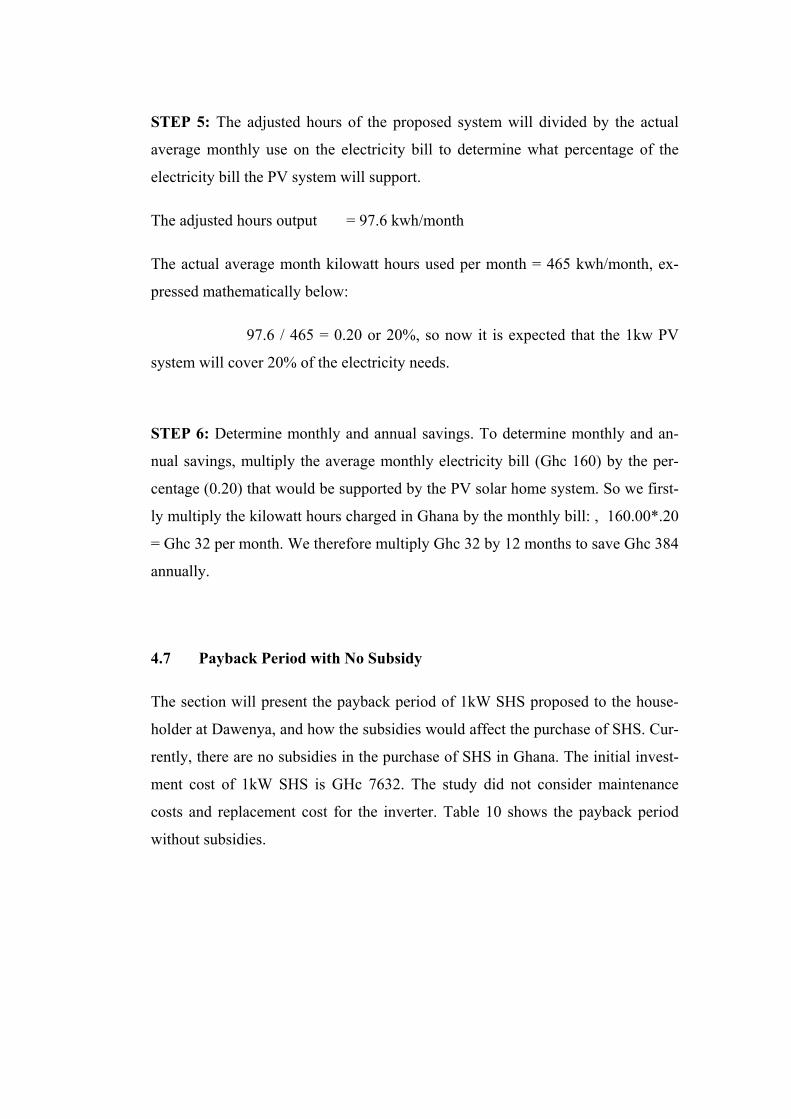
STEP 5: The adjusted hours of the proposed system will divided by the actual
average monthly use on the electricity bill to determine what percentage of the
electricity bill the PV system will support.
The adjusted hours output = 97.6 kwh/month
The actual average month kilowatt hours used per month = 465 kwh/month, ex-
pressed mathematically below:
97.6 / 465 = 0.20 or 20%, so now it is expected that the 1kw PV
system will cover 20% of the electricity needs.
STEP 6: Determine monthly and annual savings. To determine monthly and an-
nual savings, multiply the average monthly electricity bill (Ghc 160) by the per-
centage (0.20) that would be supported by the PV solar home system. So we first-
ly multiply the kilowatt hours charged in Ghana by the monthly bill: , 160.00*.20
= Ghc 32 per month. We therefore multiply Ghc 32 by 12 months to save Ghc 384
annually.
4.7 Payback Period with No Subsidy
The section will present the payback period of 1kW SHS proposed to the house-
holder at Dawenya, and how the subsidies would affect the purchase of SHS. Cur-
rently, there are no subsidies in the purchase of SHS in Ghana. The initial invest-
ment cost of 1kW SHS is GHc 7632. The study did not consider maintenance
costs and replacement cost for the inverter. Table 10 shows the payback period
without subsidies.
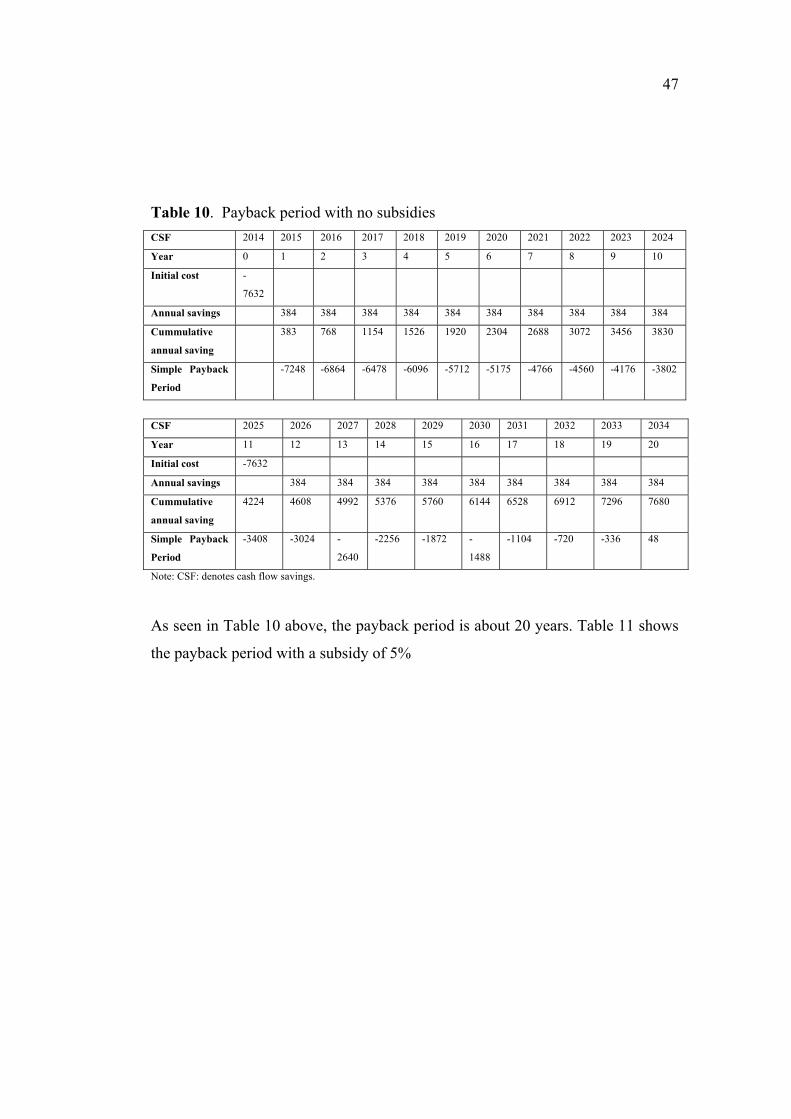
47
Table 10. Payback period with no subsidies
CSF 2014 2015 2016 2017 2018 2019 2020 2021 2022 2023 2024
Year 0 1 2 3 4 5 6 7 8 9 10
Initial cost -
7632
Annual savings 384 384 384 384 384 384 384 384 384 384
Cummulative
annual saving
383 768 1154 1526 1920 2304 2688 3072 3456 3830
Simple Payback
Period
-7248 -6864 -6478 -6096 -5712 -5175 -4766 -4560 -4176 -3802
CSF 2025 2026 2027 2028 2029 2030 2031 2032 2033 2034
Year 11 12 13 14 15 16 17 18 19 20
Initial cost -7632
Annual savings 384 384 384 384 384 384 384 384 384
Cummulative
annual saving
4224 4608 4992 5376 5760 6144 6528 6912 7296 7680
Simple Payback
Period
-3408 -3024 -
2640
-2256 -1872 -
1488
-1104 -720 -336 48
Note: CSF: denotes cash flow savings.
As seen in Table 10 above, the payback period is about 20 years. Table 11 shows
the payback period with a subsidy of 5%

Table 11. Payback Period with 5% subsidy
CSF 2014 2015 2016 2017 2018 2019 2020 2021 2022 2023 2024
Year 0 1 2 3 4 5 6 7 8 9 10
Initial cost -
7250
Annual savings 384 384 384 384 384 384 384 384 384 384
Cummulative
annual saving
384 768 1152 1536 1920 2304 2688 3072 3456 3840
Simple Payback
Period
-6866 -6482 -6096 -5714 -5330 -4946 -4562 -4178 -3794 -3410
CSF 2025 2026 2027 2028 2029 2030 2031 2032 2033 2034
Year 11 12 13 14 15 16 17 18 19 20
Initial cost -7256
Annual savings 384 384 384 384 384 384 384 384 384 384
Cummulative
annual saving
4224 4608 4992 5376 5760 6144 6528 6912 7296 7680
Simple Payback
Period
-3026 -
2642
-2258 -
1874
-1490 -
1106
-722 -338 46 430
As seen in the Table 11 above, the payback period is above 19 years. Table 12
shows a subsidy of 10%

49
Table 12. Payback Period with 10% subsidy
CSF 2014 2015 2016 2017 2018 2019 2020 2021 2022 2023 2024
Year 0 1 2 3 4 5 6 7 8 9 10
Initial cost -
6868
Annual savings 384 384 384 384 384 384 384 384 384 384
Cummulative
annual saving
384 768 1152 1536 1920 2304 2688 3072 3456 3840
Simple Payback
Period
-6484 -6100 -5716 -5332 -4948 -4564 -4180 -3796 -3412 -3028
CSF 2025 2026 2027 2028 2029 2030 2031 2032 2033 2034
Year 11 12 13 14 15 16 17 18 19 20
Initial cost -6868
Annual savings 384 384 384 384 384 384 384 384 384
Cummulative
annual saving
4224 4608 4992 5376 5760 6144 6528 6912 7296 7680
Simple Payback
Period
-2644 -2260 -
1878
-1492 -
1108
-724 -340 44 428 812
The payback period shown in Table 12 has also started from year 18 because the
investment cost has further reduced by 10%. Of course it will be of more ad-
vantage if the government will review their renewable energy policy by providing
direct subsidies to the purchase of SHS. Another approach could be ensuring ade-
quate sales taxes and duties on the importation of solar generation systems so as to
encourage the public to choose renewable energy and solar energy as an alterna-
tive source.
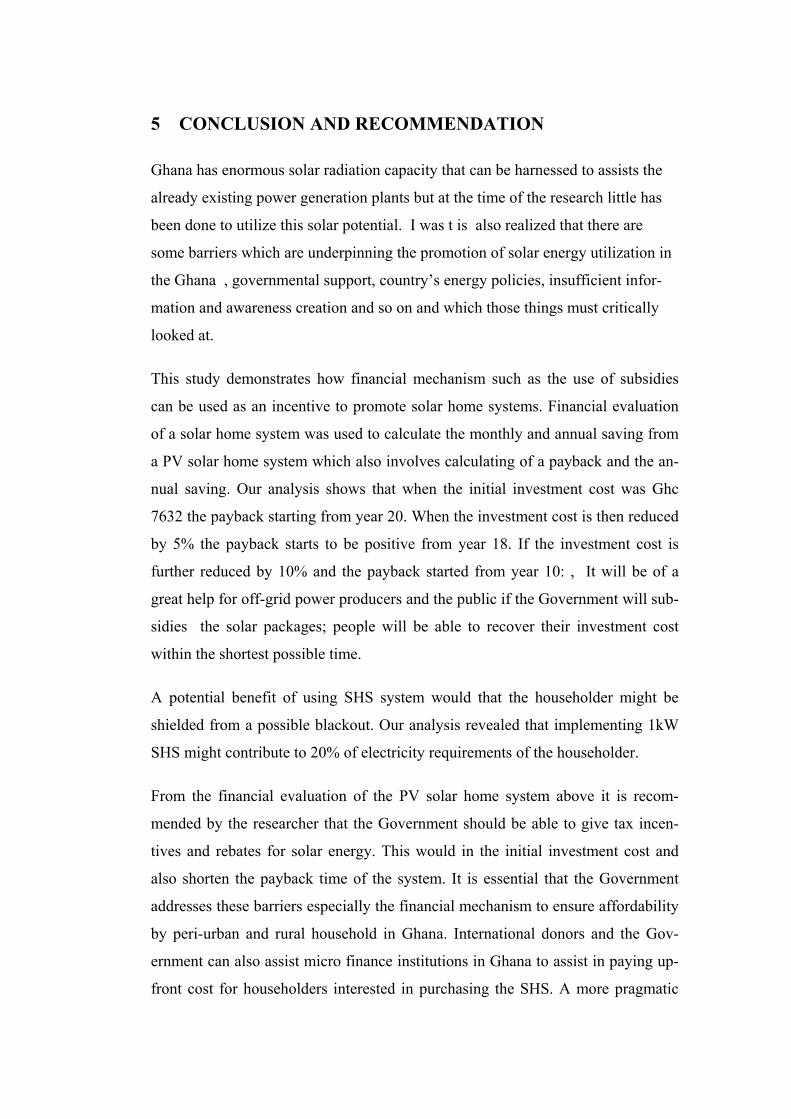
5 CONCLUSION AND RECOMMENDATION
Ghana has enormous solar radiation capacity that can be harnessed to assists the
already existing power generation plants but at the time of the research little has
been done to utilize this solar potential. I was t is also realized that there are
some barriers which are underpinning the promotion of solar energy utilization in
the Ghana , governmental support, country’s energy policies, insufficient infor-
mation and awareness creation and so on and which those things must critically
looked at.
This study demonstrates how financial mechanism such as the use of subsidies
can be used as an incentive to promote solar home systems. Financial evaluation
of a solar home system was used to calculate the monthly and annual saving from
a PV solar home system which also involves calculating of a payback and the an-
nual saving. Our analysis shows that when the initial investment cost was Ghc
7632 the payback starting from year 20. When the investment cost is then reduced
by 5% the payback starts to be positive from year 18. If the investment cost is
further reduced by 10% and the payback started from year 10: , It will be of a
great help for off-grid power producers and the public if the Government will sub-
sidies the solar packages; people will be able to recover their investment cost
within the shortest possible time.
A potential benefit of using SHS system would that the householder might be
shielded from a possible blackout. Our analysis revealed that implementing 1kW
SHS might contribute to 20% of electricity requirements of the householder.
From the financial evaluation of the PV solar home system above it is recom-
mended by the researcher that the Government should be able to give tax incen-
tives and rebates for solar energy. This would in the initial investment cost and
also shorten the payback time of the system. It is essential that the Government
addresses these barriers especially the financial mechanism to ensure affordability
by peri-urban and rural household in Ghana. International donors and the Gov-
ernment can also assist micro finance institutions in Ghana to assist in paying up-
front cost for householders interested in purchasing the SHS. A more pragmatic

51
approach and more relevant solar widespread strategy need to be adopted to assist
the current power crisis the country is facing. It will also be of more use to im-
plement motivations towards solar energy promotion from a long term focused
sustainability point of view rather than from a default option associated with the
need to expand the country’s electrical capacities. It will also be of importance to
implement a stable and legal framework which is complete and transparent before
a long term investment can be attracted. , Barriers hindering the expansion of solar
energy should be identified and dealt with, solar market should be structured or
designed so as to determine the wide dissemination of small scale installation. ,
The development of local manufacturing industries should be one way or the other
be supported by a strong political will.
6 REFERENCES
1. Alireza Bahadori and Chikezi Nwaoha-Renewable and Sustainable Energy Re-views.(February 2013)http://www.sciencedirect.com/science/article. Accessed 20th Janu-ary 2014
2. Alireza Bahadori, Chikezie Nwaoha (Renewable sustainable energy reviews 18(2013) 1-5. Accessed 19 November 2014
3. Benefit s of Renewable Energy. http://www.ucsusa.org/clean_energy/our-energy-choices/renewable-energy/public-benefits-of-renewable. Accessed 20th November 2013
4. Country Ghana. Wikipedia. http://en.wikipedia.org/wiki/Ghana Accessed 10th August 2013
5. Complete panels cost guide involves payback period. http://www.solarpanelscostguide.com/-Accessed 20th April 2013
6. Energy. Wikipedia. http://en.wikipedia.org/wiki/Energy/1 Accessed 15th June, 2014
7. Energy and calculating of payback http://www.energybible.com/solar_energy/calculating_payback.html) Accessed 21 June 2014
8. Financing Mechanisms for Solar Home Systems in Developing Countries, Report IEA-PVPS T9-01:2002
9. Financing renewable energy, Strategies, Approaches, December 2005,kfw. Accessed 12 November 2014
10. Ghana Energy Resources. http://en.openei.org/wiki/Ghana .Accessed 19th November 2013
11. Jyoti Prasad painuly, Jorgen Villy Fenhan. Implementation of Renewable Energy Technologies- Opportunities and Barriers, UNEP collaborating Centre on Energy Envi-ronment, Riso National Laboratory, 2002. Accessed 17th August 2014
12. Mawuli Tse, Paper presented at the Expert/Stakeholder Workshop on Renewable En-ergy in Ghana, 15-17 August 2000
13. Nathan .G. John, Kenneth M. Bryden (1, July 2012) Energy supply and use in a rural West African (sciencedirect.com) Accessed 23rd February 2013
14. Olayinka S. Ohunakin a,n, Muyiwa S. Adaramola b,nn, Olanrewaju. M. Oyewola c, Richard O. Fagbenle(Available online 31 January 2014) Solar energy applications and development in Nigeria: Drivers and barriers.www.sciencedirect.com/. Accessed 10th march, 2014
15. Photovoltaic System. Wikipedia. http://en.wikipedia.org/wiki/Photovoltaic. Accessed 14th September 2013
53
16. Problems associated with the use of fossil fuel. http://www.conserve-energy-future.com/Disadvantages_FossilFuels. Accessed 19th December 2013
17. Photovoltaic Geographical Information System. Performance of grid- connected PV http://re.jrc.ec.europa.eu/pvgis/apps4/pvest.php?map=africa Accessed 17th January 2014.
18. Solar Photovoltaic Technology, national renewable energy laboratory http://www.nrel.gov/learning/re_photovoltaics.html /Accessed 3rd October 2014
19. Solar Energy. Wikipedia. http://en.wikipedia.org/wiki/Solar_energy Accessed 15th July 2014
20. Solar Energy Germany. Wikipedia. http://en.wikipedia.org/wiki/Renewable_energy_in_Germany Accessed 12th April 2013
21. Solar Power US. Wikipedia. http://en.wikipedia.org/wiki/Solar_power_in_the_United_States Accessed 12th April 2013
22. Solar Power In China. Wikipedia. http://en.wikipedia.org/wiki/Solar_power_in_China Accessed 25th January 2014.
23. Solar Power by Country. Wikipedia. http://en.wikipedia.org/wiki/Solar_power_by_country Accessed 13th June 2014
24. Strategic National Energy Plan Main report (2006-2020) . Energy Commission, Ghana. Accessed 12th October 20213
25. Solar energy for home systems. http://www.solar-energy-at-home.com/solar-cell.html Accessed 11 October 2013
26. Renewable Energy Source. Wikipedia .http://en.wikipedia.org/wiki/Renewable ener-gy Accessed 15th March 2014
27. Renewable energy resource Potentials in Ghana http://www.energymin.gov.gh/ Ac-cessed 10th September 2013
28. R.Margoli and J.Zuboy(September 2006) Barriers to Solar Energy use; Review of recent literature NREL/TP-520-40116.sciencedirect.com/ Accessed 15th April, 2014
29. Xiaoling Zhang,Liyin Shen. Sum Yee Chan (dx.doi.org/10.1016/j.enpol.2011.10.043) energy policy. Accessed 15th February, 2013
30. Zhao Xin-gang, Feng Tian-tian, Cui Lu n, Feng Xia (Available online 12 November 2013) The barriers and institutional arrangements of the implementation of renewable portfolio standard: A perspective of China.sciencedirect.com/ Accessed 13th June, 2014


LIITE 1 1(1)


LIITE 2 1(1)