task force on school cost reduction prepared for the eplc finance symposium friday, november 16,...
TRANSCRIPT
Task Force on School Cost Reduction
Prepared for the EPLC Finance SymposiumFriday, November 16, 2007
Task Force Background
Special Session Act 1 of 2006 to: Evaluate spending trends Budgetary pressures driven by external
mandates and cost factors Composed of members of
School Boards Teachers’ unions School Business Officials Other Experts
School Cost Categories, Trends and Mandates
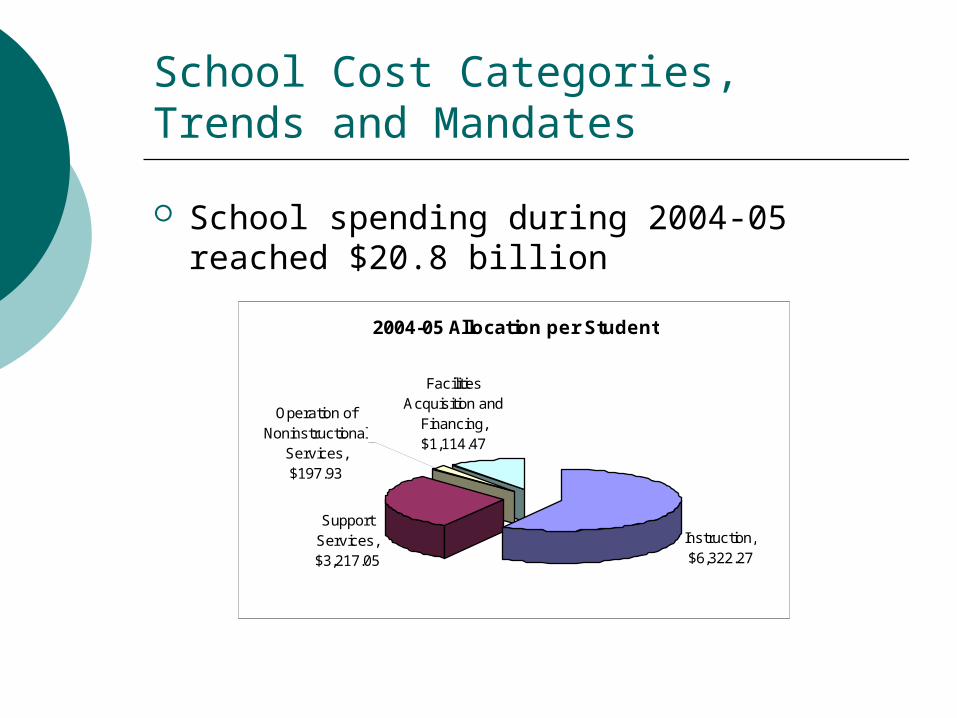
School spending during 2004-05 reached $20.8 billion
2004-05 Allocation per Student
Instruction, $6,322.27
Support Services, $3,217.05
Operation of Noninstructional
Services, $197.93
Facilities Acquisition and
Financing, $1,114.47

Cost Drivers Instructional Expenditures – responsible for 54%
of total cost growth since 1995-96 Special and Gifted education – 97% increase Regular education – 35% increase Employee Benefits – 132% increase Charter School - $364 million statewide annually
Increase in Major Expenditure Categories by ADM as Compared to the CPI
49% 45%52%
45%
78%
0%
20%
40%
60%
80%
100%
Tot
alE
xpen
ditu
res
Inst
ruct
ion
Sup
port
Ser
vice
s
Ope
ratio
n of
Non
inst
ruct
iona
lS
ervi
ces
Fac
ilitie
sA
cqui
sitio
n an
dF
inan
cing
Incr
ease
s 19
95-9
6 to
200
4-05
CPI

Cost Drivers (continued)
Support Services – responsible for 30% of total cost growth since 1995-96
Student Transportation – 58% increase Administrative Services – 42% increase Tax Collection - $78.8 million statewide
Facilities and Financing – responsible for 14% of total cost growth since 1995-96
Debt Services - 90% increase Non-instructional Services – responsible for 2% of total
cost growth since 1995-96 Increased by 48% increase Largely driven by student activities
Federal and State Mandates NCLB IDEA
Task Force Focus
Tax Collection Health Care School Construction and Green Building Special Education Transportation Charter and Cyber Charter Schools Shared Services Mandate Waivers
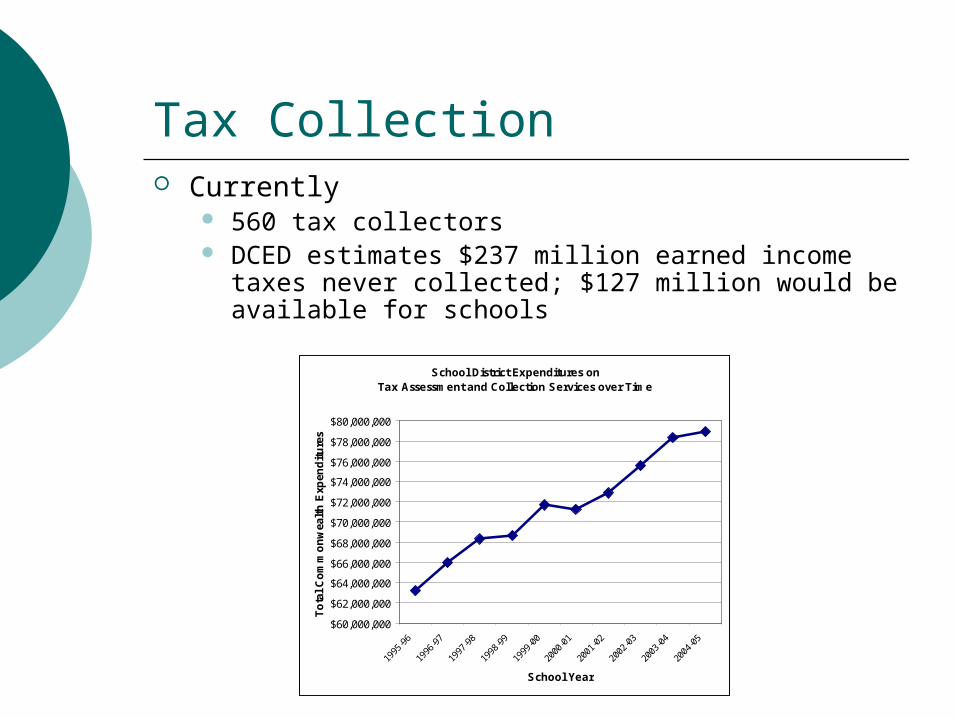
Tax Collection Currently
560 tax collectors DCED estimates $237 million earned income taxes
never collected; $127 million would be available for schools
School District Expenditures on Tax Assessment and Collection Services over Time
$60,000,000
$62,000,000
$64,000,000
$66,000,000
$68,000,000
$70,000,000
$72,000,000
$74,000,000
$76,000,000
$78,000,000
$80,000,000
1995
-96
1996
-97
1997
-98
1998
-99
1999
-00
2000
-01
2001
-02
2002
-03
2003
-04
2004
-05
School Year
To
tal
Co
mm
on
wea
lth
Exp
end
itu
res
Tax Collection Recommendations
Consolidate collection of Earned Income Tax, employing fewer tax collectors and clarifying withholding rules for employers. Consolidate to 66 countywide tax collectors Uniform rules, regulations, forms and codes All EIT would be withheld by the employer Businesses would only need to remit to the
county in which their payroll operation is located.
Estimated Savings - $127 million
Health Care
PASBO estimated that health care premiums rose by 24% between 2003 and 2005.
PEBTF’s premium increases averaged 5.6% between 2003 and 2006.
Health Care Recommendations
Establish a statewide system for all school districts to jointly purchase health care benefits When school districts maximize their
purchasing power, the commonwealth will use tax dollars more efficiently while protecting the health care benefits that teachers and other school district employees receive.
Estimated Savings – believed to reach hundreds of millions of dollars according to some analysts.
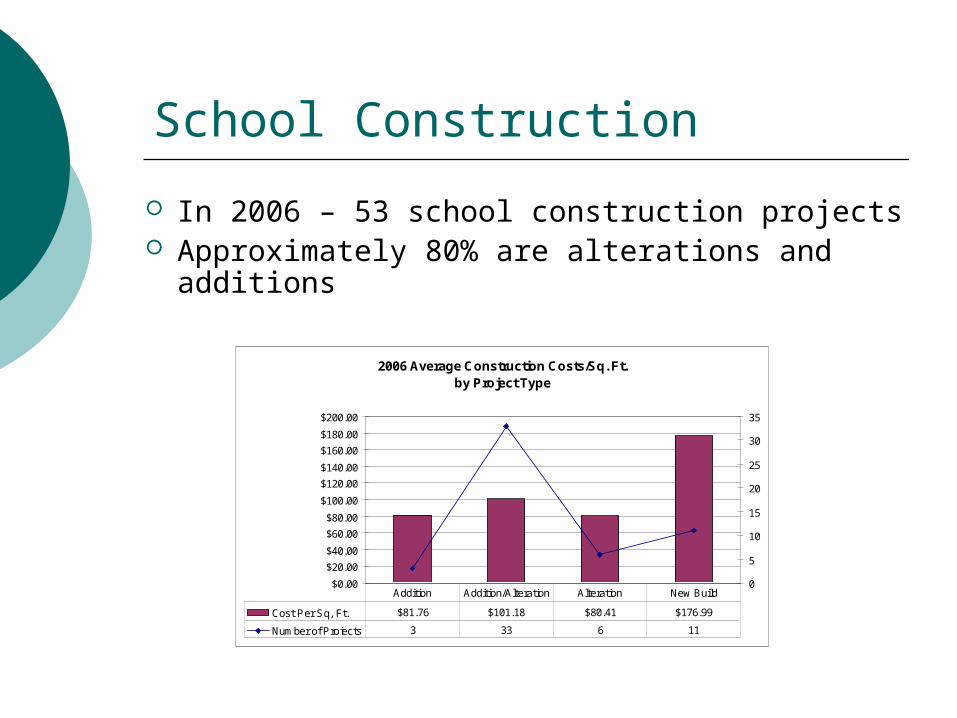
School Construction
In 2006 – 53 school construction projects Approximately 80% are alterations and
additions
2006 Average Construction Costs/Sq. Ft. by Project Type
$0.00
$20.00
$40.00
$60.00
$80.00
$100.00
$120.00
$140.00
$160.00
$180.00
$200.00
0
5
10
15
20
25
30
35
Cost Per Sq, Ft. $81.76 $101.18 $80.41 $176.99
Number of Projects 3 33 6 11
Addition Addition/Alteration Alteration New Build
School Construction (continued)
PDE provides reimbursement through the Plan Con process
Act 34 of 1973 20-year rule Contracting Thresholds Prevailing Wage Multiple Prime Contracting
School Construction Recommendations
Increase and index limiting thresholds for construction-related expenses in line with their original intent. Work done by school personnel from $4,000 to
$25,000 Projects done by school personnel and costing
between $10,000 and $25,000 would require three quotes
Projects of $25,000 or more require schools to advertise and solicit bids
Provide school districts with flexibility related to prime contracting
School Construction Recommendations (continued)
Increase assistance to school districts to more strongly encourage green building
Increase PDE technical assistance to districts throughout the many phases of the construction process, including releasing information on actual school construction costs
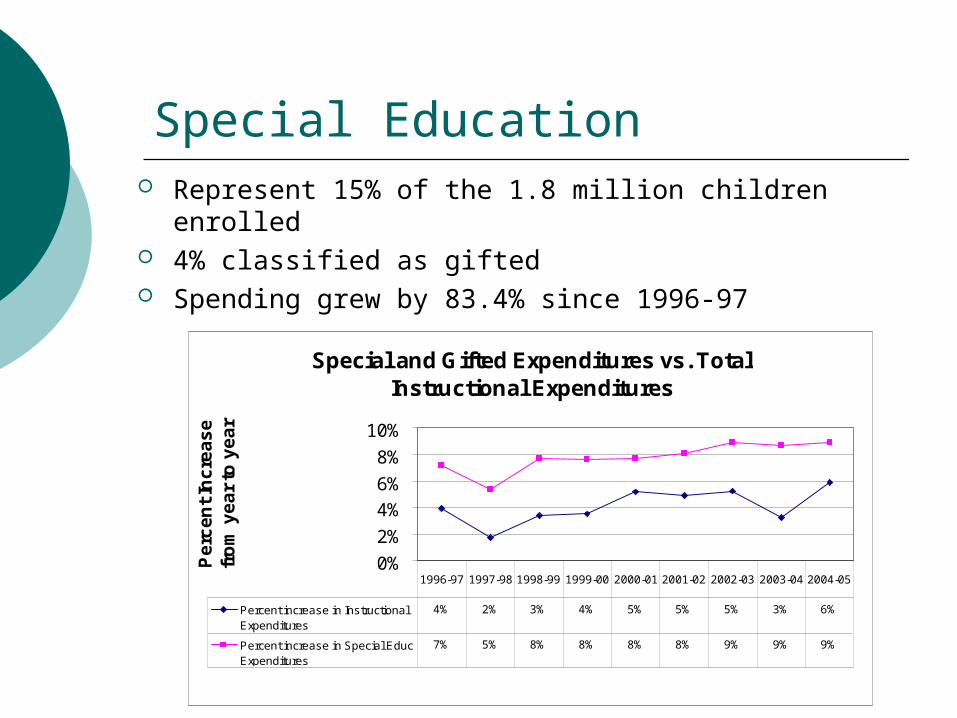
Special Education Represent 15% of the 1.8 million children enrolled 4% classified as gifted Spending grew by 83.4% since 1996-97
Special and Gifted Expenditures vs. Total Instructional Expenditures
0%
2%
4%
6%
8%
10%
Pe
rce
nt
Inc
rea
se
fr
om
ye
ar
to y
ea
r
Percent increase in InstructionalExpenditures
4% 2% 3% 4% 5% 5% 5% 3% 6%
Percent increase in Special EducExpenditures
7% 5% 8% 8% 8% 8% 9% 9% 9%
1996-97 1997-98 1998-99 1999-00 2000-01 2001-02 2002-03 2003-04 2004-05
Special Education (continued)
State Special Education Funding Base Supplement Inflation Index Supplement Minimum 2% increase
Additional Funding Contingency Funds Core Services Institutionalized Children’s Program
Special Education Recommendations
Alter the state special education formula to provide funding on a tiered system based on the services a student receives
Provide increased state funding for high quality early childhood education in the elementary grades
Develop best practices in moving students out of special education programs
Redo the charter school special education formula to enable the resident school district to better align funding with charter school special education costs.

Transportation
Approximately $1 billion annually (5% of the total statewide expenditures)
Increased by 58%
Average Transportation Expenditures Per Student Transported
YearPublic
Transportation*Non-Public
TransportationAverage Per
Student**Non-Public as % of
Average
1995-96 $485.21 $566.56 $495.64 117%
1996-97 $501.20 $535.13 $505.58 107%
1997-98 $516.52 $533.69 $518.72 103%
1998-99 $533.72 $523.66 $532.44 98%
1999-00 $548.16 $549.03 $548.27 100%
2000-01 $578.50 $566.70 $576.99 98%
2001-02 $625.84 $612.65 $624.16 98%
2002-03 $653.74 $647.37 $652.95 99%
2003-04 $688.25 $827.02 $704.85 120%
2004-05 $728.01 $971.49 $756.04 133%
Transportation Recommendations
Eliminate the requirement to bus students outside district boundaries and only require districts to transport on days when public school is in session.
Optimize fuel cost management to slow long term growth costs
Encourage district to adopt transportation best practices
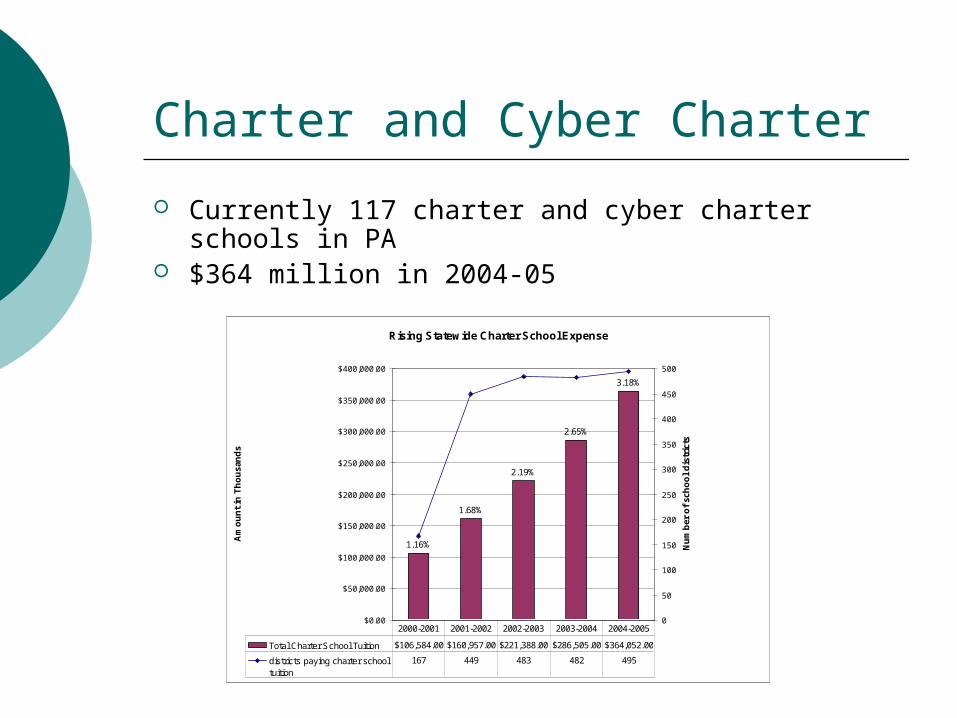
Charter and Cyber Charter
Currently 117 charter and cyber charter schools in PA
$364 million in 2004-05
Rising Statewide Charter School Expense
1.68%
1.16%
2.19%
2.65%
3.18%
$0.00
$50,000.00
$100,000.00
$150,000.00
$200,000.00
$250,000.00
$300,000.00
$350,000.00
$400,000.00
Am
ou
nt
in T
ho
usa
nd
s
0
50
100
150
200
250
300
350
400
450
500
Nu
mb
er o
f sc
ho
ol
dis
tric
ts
Total Charter School Tuition $106,584.00 $160,957.00 $221,388.00 $286,505.00 $364,052.00
districts paying charter schooltuition
167 449 483 482 495
2000-2001 2001-2002 2002-2003 2003-2004 2004-2005
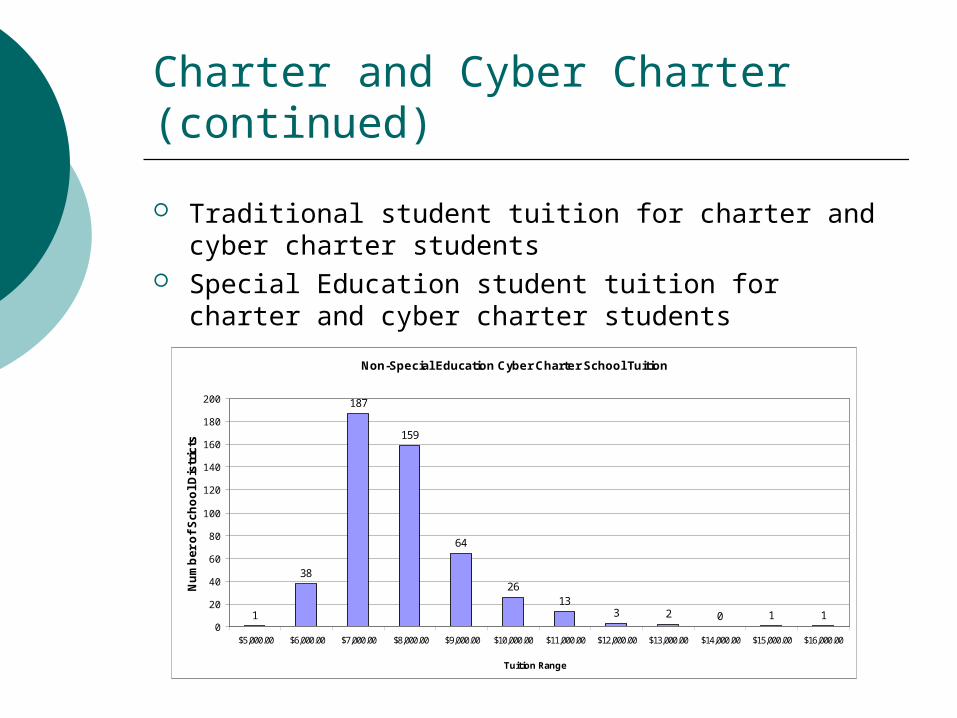
Charter and Cyber Charter (continued)
Traditional student tuition for charter and cyber charter students
Special Education student tuition for charter and cyber charter students
Non-Special Education Cyber Charter School Tuition
1
38
187
159
64
2613
3 2 0 1 10
20
40
60
80
100
120
140
160
180
200
$5,000.00 $6,000.00 $7,000.00 $8,000.00 $9,000.00 $10,000.00 $11,000.00 $12,000.00 $13,000.00 $14,000.00 $15,000.00 $16,000.00
Tuition Range
Nu
mb
er
of
Sc
ho
ol
Dis
tric
ts
Charter and Cyber Charter (continued)
Additional concerns Truancy Competitive Grants
Charter and Cyber Charter Recommendations
Primarily Brick and Mortar Change charter school law to include grants in
the list of items exempt in calculations of charter school tuition rate.
Permit school districts to weigh fiscal impact as a criterion when considering new and expanded charter schools.
Align the budgeting process of school districts with enrollment planning for charter schools
Charter and Cyber Charter Recommendations (continued)
Primarily Brick and Mortar Provide best practices and guidance to
school districts that will support them in creating effective truancy monitoring partnerships with their charter schools
Increase guidance to school districts throughout the charter drafting process to ensure a high-quality charter agreement
Charter and Cyber Charter Recommendations (continued)
Cyber Charter Establish a single, statewide tuition rate
to be applied to all cyber charter schools.
Continue to collect and analyze data on the cost of cyber education
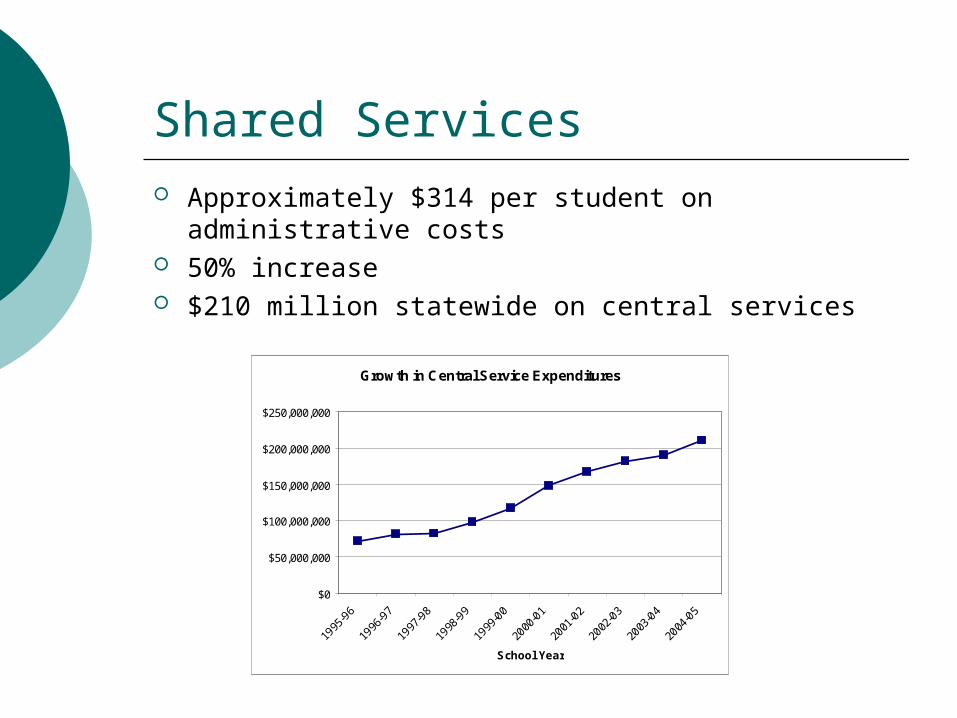
Shared Services Approximately $314 per student on
administrative costs 50% increase $210 million statewide on central services
Growth in Central Service Expenditures
$0
$50,000,000
$100,000,000
$150,000,000
$200,000,000
$250,000,000
1995
-96
1996
-97
1997
-98
1998
-99
1999
-00
2000
-01
2001
-02
2002
-03
2003
-04
2004
-05
School Year
Shared Services Recommendation
Expand the approach of shared services to include a variety of entities including districts, intermediate units, counties and other local governments
Draft a report of best practices that shows districts how cost savings can occur through consortia.

Mandate Waivers
Education Empowerment Act, Act 16 of 2000
Effective for three years Districts must submit an evaluation Annual report from PDE to the
chairmen and minority chairmen of the House and Senate Education Committees
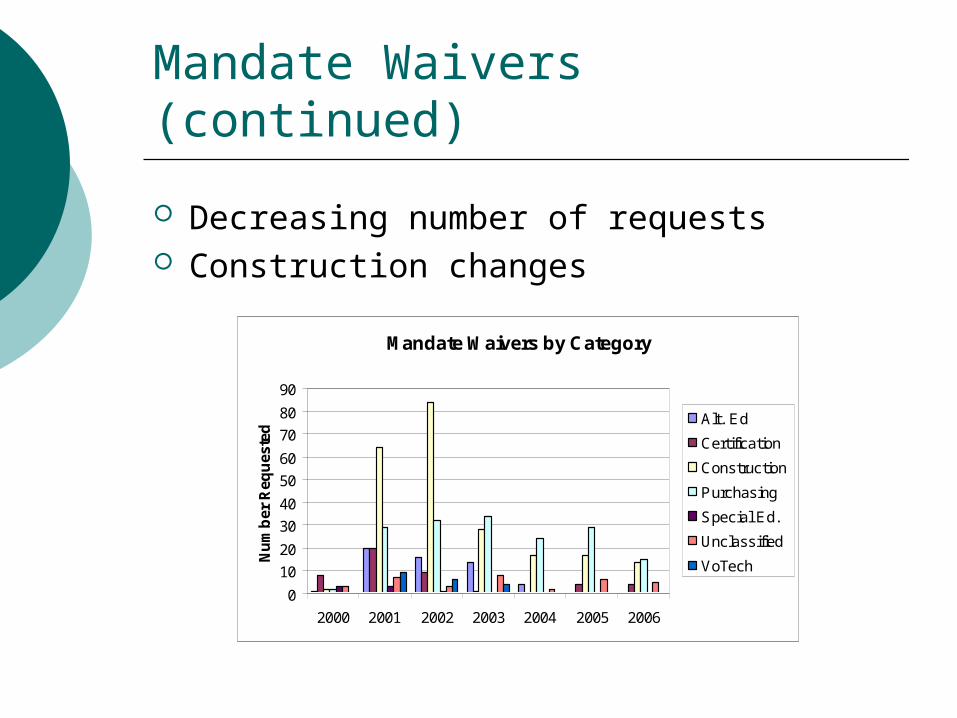
Mandate Waivers (continued)
Decreasing number of requests Construction changes
Mandate Waivers by Category
0
10
20
30
40
50
60
70
80
90
2000 2001 2002 2003 2004 2005 2006
Nu
mb
er R
equ
este
d
Alt. Ed
Certification
Construction
Purchasing
Special Ed.
Unclassified
VoTech
Mandate Waiver Recommendation
Increase the quality of the Pennsylvania Department of Education’s communication regarding Mandate Waivers, to include strategic information about the experiences of school districts in achieving cost savings.
Next Steps
Tax Collection Health Care School Construction and Green Building Special Education Transportation Charter and Cyber Charter Schools Shared Services Mandate Waivers