sglt-2 inhibitors: cvd reduction through diuresis sglt-2 inhibtors - cvd reductio… · sglt-2...
TRANSCRIPT

SGLT-2 INHIBITORS: CVD REDUCTION THROUGH DIURESIS
KCS Symposium, 30th June, 2017Sarova Whitesands, Mombasa
Dr. Kirtida AcharyaNational chair, Diabetes KenyaConsultant Endocrinologist/Diabetologist, MP Shah Hospital

Disclosures
I have received honoraria from the following pharmaceutical companies for lectures and participation on advisory boards:• Novartis• Eli Lilly• Sanofi• Zawadi Healthcare• Servier• Astra Zeneca• Novo Nordisk• Merck

2040 71.1 million
Europe
The Epidemiological impactGlobal prevalence of diabetes (2015 and 2040)
Estimated number of people with diabetes worldwide and per region in 2015 and 2040 (20–79 years)
2015 59.8 million
North America and Caribbean2015 44.3 million
2040 60.5 million
Middle East and North Africa2015 35.4 million
2040 72.1 million
Western Pacific2015 153.2 million
2040 214.8 million
South-East Asia2015 78.3 million
2040 140.2 million
Central and South America
2015 29.6 million
2040 48.8 million
Africa2015 14.2 million
2040 34.2 million
World2015 415 million2040 642 million
No data were collected from Greenland or SvalbardAdapted from International Diabetes Federation. IDF Diabetes Atlas, 7th edition. Brussels, Belgium: International Diabetes Federation, 2015. http://www.diabetesatlas.org

0
1
2
3
CV death All-causemortality
Haz
ard
rat
io (
95
% C
I) (
dia
bet
es v
s n
o
dia
bet
es)
CVD is the leading cause of death in people with T2D
Mortality risk associated with diabetes (n=820,900)1
0
7
40 50 60 70 80 90
Age (years)
Year
s o
f lif
e lo
st
6
5
4
3
2
1
0
7
6
5
4
3
2
1
0
Men
40 50 60 70 80 900
Age (years)
Women
Non-vascular deaths
Vascular deaths
Years of life lost in people with diabetes* compared with non-diabetes peers1
1. Seshasai et al. N Engl J Med 2011;364:829-41; 2. Centers for Disease Control and Prevention National Diabetes Fact Sheet 2011. http://www.cdc.gov/diabetes/pubs/pdf/ndfs_2011.pdf; 3. International Diabetes Federation. IDF Diabetes Atlas, 7th edition. Brussels, Belgium: International Diabetes Federation, 2015. http://www.diabetesatlas.org
*Information on diabetes type (i.e., type 1 or 2) was generally not available, though the age of the participants suggests that the large majority with diabetes would have type 2. In high income countries, up to 91% of adults with diabetes have type 23
CVD, cardiovascular disease; CI, confidence interval; T2D, type 2 diabetes.

Higher HbA1c predicts higher CV risk
Reference category (hazard ratio 1.0) is HbA1c <6% with log linear scales.CV, cardiovascular; HbA1c, glycosylated haemoglobin; MI, myocardial infarction; PVD, peripheral vascular disease.Stratton IM et al. BMJ 2000;321:405–412.
Hazard
ratio
43% decrease per 1% reduction in HbA1c
Hazard
ratio
10
10
p<0.0001
1
Amputation/death from PVD
65 7 8 9
16% decrease per 1% reduction in HbA1c
p=0.021
Heart failure
65 7 8 9 10
10
1
10
114% decrease per 1% reduction in HbA1c
p<0.0001
Fatal & non-fatal MI
1065 7 8 9
12% decrease per 1% reduction in HbA1c
p=0.035
Fatal & non-fatal stroke10
1
65 7 8 9 10
Updated mean HbA1c concentration (%) Updated mean HbA1c concentration (%)

• Type 2 diabetes is estimated to affect 415 million people globally in 2015, with this number expected to rise to 642 million by 20401
• Cardiovascular disease is responsible for approximately half of deaths in people with type 2 diabetes2
• Higher HbA1c predicts higher cardiovascular risk3
• Intensive glucose-lowering regimens led to reduction of MI risk after 10 years of therapy4
Cardiovascular risk in type 2 diabetes
MI, myocardial infarction1. IDF Diabetes Atlas, 7 ed. Brussels, Belgium: International Diabetes Federation, 2015. http://www.diabetesatlas.org; 2. Morrish NJ et al. Diabetologia2001;44(Suppl 2):S14-S21; 3. Stratton IM et al. BMJ 2000;321:405–412; 4. Holman RR et al. N Engl J Med 2008;359:1577–1589.
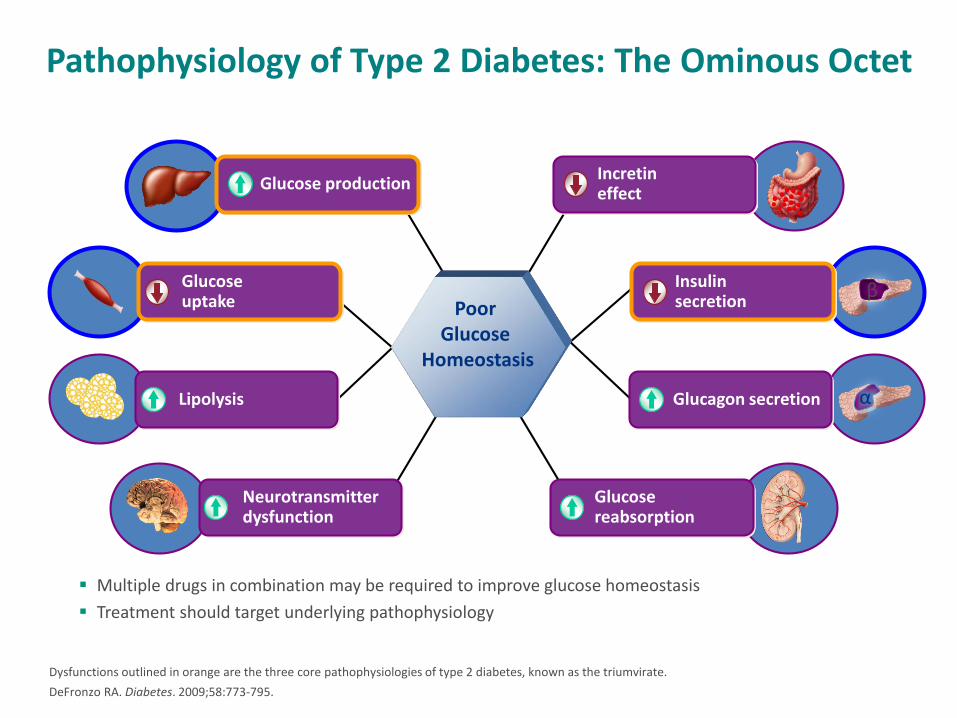
Pathophysiology of Type 2 Diabetes: The Ominous Octet
Dysfunctions outlined in orange are the three core pathophysiologies of type 2 diabetes, known as the triumvirate.
DeFronzo RA. Diabetes. 2009;58:773-795.
Multiple drugs in combination may be required to improve glucose homeostasis
Treatment should target underlying pathophysiology
Poor Glucose
Homeostasis
Neurotransmitter dysfunction
Glucose reabsorption
Glucagon secretion
Glucose production
Glucoseuptake
Lipolysis
Incretineffect
Insulinsecretion
α
β

Sodium Glucose Co-transporter 2 (SGLT2) Inhibitors
• SGLT are a family of glucose transporters
– SGLT1: found in the mucosa of the small intestine
– SGLT2: found in proximal tube of the nephron
• SGLT2 inhibitors prevent reabsorption of glucose from the kidney and reduce blood glucose levels
• Dapagliflozin
• Canagliflozin
• Empagliflozin
• Ipragliflozin
Singhal M, et al. Global Journal of Pharmacology. 2012;6(2):86-93.
8

SGLT1
(180 L/day) (900 mg/L)=162 g/day
10%
Glucose
No Glucose
S1
S3
Renal Handling of Glucose
SGLT2
90%

Major transporter of glucose in the kidney
• Low affinity, high capacity for glucose
• Nearly exclusively expressed in the kidney
• Responsible for ~90% of renal glucose reabsorptionin the proximal tubule
Hediger MA, Rhoads DB. Physiol. Rev. 1994;74:993-1026.
S1 Proximal Tubule
Na+
K+
ATP
ase
Glucose
GLUT2
Glucose
SGLT2
BloodLumen
Na+
SGLT2 Mediates GlucoseReabsorption in the Kidney

If plasma glucose levels get too high the glucose transporters cannot reabsorb all the glucose, leading to glucosuria
Adapted from Nair S & Wilding JPH. J Clin Endocrinol Metab 2010;95:34–42.
0 8.3
Plasma glucose (mmol/L)
Excretion threshold
13.3
Saturation threshold
250
1
2
Ra
te o
f g
luco
se
filt
ration
/
rea
bso
rption
/excre
tion
(m
mo
l/m
in)
3
Tubular
maximum for glucose
(TmG)
Glucosuria starts
to occur
Glucose filtration
rate normally
proportional to
plasma glucose
concentration
No excretion
Reabsorbed glucose

SGLT2 inhibitors:Benefits and potential concerns
• Potential advantages– Durable glucose lowering at
all stages of disease
– Can be used with wide range of oral glucose-lowering drugs and insulin
– Weight loss
– Blood pressure lowering
– Low risk of hypoglycaemia
• Questions– Increase in urinary tract
infections
– Increase in genital infections
– Potential for volume depletion
– Ketoacidosis
– Renal safety
– Effects on bone health
– Risk of CV disease (LDL increase; diuretic effect / volume depletion; BP lowering)

Dapagliflozin’s multiple benefits on HbA1c, weight and BP are consistent in RWE
Variables N
Baseline ≤6 months before ID
3 monthsafter ID
Difference
Pvalue
Total patients
HbA1c (%)826
8.5 (1.5) 7.8 (1.2)–0.8 (1.4)
<0.001
Bodyweight (kg)
268
102.7 (22.1)
100.4 (21.6)
–2.3 (4.8)
<0.001
SBP (mmHg)
471
137.0 (14.5)
134.8 (17.3)
–2.2 (17.6)
0.003
Variables N
Baseline ≤6 months
before ID6 monthsafter ID
Difference
Pvalue
Total patients
HbA1c (%)645
8.5 (1.6) 7.8 (1.2)–0.8 (1.5)
<0.001
Bodyweight (kg)
239
102.3 (22.5) 99.8 (22.1)–2.5 (7.1)
<0.001
SBP (mmHg)
388
137.7 (16.7) 135.4 (16.2)–2.3
(16.7)0.011
Specialty Ο General practitioner + Diabetologist
HbA1c reduction (%)
We
igh
t re
du
ctio
n (
kg)
Relationship between change in HbA1c (%) and body weight (kg) after 3 months in patients with T2DM initiating dapagliflozin treatment

Dapagliflozin CV meta-analysis showed no increase in CV risk
• Meta-analysis of 21 Phase 2b/3 trials, n=9339 (dapagliflozin n=5936; control n=3403)
*All Phase 2b and 3 Pool, ST + LT -30MU; Stratified by study; Only trials with at least one positively adjudicated event included in analysis; Cox Proportional Hazards model.
Sonesson C et al. Cardiovasc Diabetol. 2016;15:37.
DAPA meta-analysis*
FavoursDAPA ● Control
DAPAHR vs
Control (95% CI)2n/N
DAPA
Event rate/ 100
p–y Control
Event rate/ 100
p–y
MACE plus UA
95/5699 1.46 81/3240 2.150.79
(0.58, 1.1)
MACE 72/5418 1.15 62/3101 1.690.77
(0.54, 1.1)
CV death 20/3825 0.37 18/2200 0.590.70
(0.36, 1.36)
MI 30/5244 0.48 33/3014 0.910.57
(0.34, 0.95)
Stroke 25/4227 0.45 18/2412 0.571.00
(0.54, 1.86)
Hospitalization for heart failure
10/2576 0.15 16/1780 0.410.36
(0.16, 0.84)0.10 1.00 2.00

Meta-analysis data suggest a net protection against cardiovascular events with SGLT-2 inhibitors
MACE
Cardiovascular death
104/6396 2/3403
MACE plus
Canagliflozin
Non-fatal MI
Ipragliflozin
Empagliflozin
Canagliflozin
Dapagliflozin
Empagliflozin
Dapagliflozin
Empagliflozin
(12 =24%)
Empagliflozin
Canagliflozin
(12 =43%)
Canagliflozin
(12 =0%)
(12 =0%)
Relative risk
Favours SGLT2 inhibitor Favours control
0.5 1.0 1.5 2.0 0.5 1.0 1.5 2.0 2.5
Non-fatal stroke
Unstable angina
Heart failure*
All-cause death
(I2=0%)
Canagliflozin
Empagliflozin
Canagliflozin
Empagliflozin
Empagliflozin
(I2=0%)
(I2=0%)
(I2=0%)
Dapagliflozin
Canagliflozin
Empagliflozin
47/6396
50/4687
26/6396
133/4687
126/4687
37/5936
49/6177
278/7082
16/3327
60/2333
18/3327
66/2333
95/2333
24/3403
37/3262
201/3647
104/6396
213/4687
45/6396
490/4687
7/628
97/5936
621/7082
172/4687
21/6396
130/6395
73/5936
62/3403
121/2333
27/3327
282/2333
10/368
81/3403
359/3547
137/2333
16/3327
71/3327
62/3403
Favours SGLT2 inhibitor Favours control
Relative risk
SGLT2 inhibitor (n/N)
Control (n/N)
SGLT2 inhibitor (n/N)
Control (n/N)
2.5
0.67 (0.48–0.94)
0.84 (0.75–0.95)
0.95 (0.72–1.27)
0.87 (0.77–0.98)
0.85 (0.77–0.95)
0.68 (0.36–1.31)
0.62 (0.50–0.78)
0.63 (0.51–0.77)
0.87 (0.54–1.39)
0.88 (070–1.09)
0.88 (0.72–1.07)
1.02 (0.74–1.42)
0.69 (0.51–0.95)
0.86 (0.75–0.99)
0.41 (0.16–1.07)
Relative risk (95% CI)
1.30 (1.00–1.68)
1.53 (0.87–2.69)
1.24 (0.93–1.67)
0.75 (0.41–1.37)
1.00 (0.75–1.34)
0.65 (0.50–0.85)
0.71 (0.61–0.83)
0.95 (0.73–1.23)
0.65 (0.50–0.85)
0.88 (0.53–1.48)
0.70 (0.46–1.07)
0.69 (0.58–0.82)
Relative risk (95% CI)
Wu JH, et al. Lancet Diabetes Endocrinol 2016;4:411–9

Study objectives
Primary
• To compare the risk of HHF in patients with T2DM newly initiated on SGLT2 inhibitors versus other glucose-lowering drugs
Secondary
• To compare the risk of all-cause death between the two treatment groups
• To compare the risk of the composite of HHF or all-cause death between the two treatment groups

Inclusion/exclusion criteria
Inclusion criteria
• New users receiving SGLT2 inhibitors or other glucose-lowering drugs
• Established T2DM on or prior to the index date
• ≥18 years old
• >1 year* historical data available prior to the index date
Exclusion criteria
• Patients with type 1 diabetes
• Patients with gestational diabetes
*In Germany, >6 months

Patient population for all countries/databases combined
1,392,254
new users of SGLT2 inhibitor or other glucose-lowering
drug fulfilling the eligibility criteria
166,033
SGLT2 inhibitor
1,226,221
other glucose-lowering
drug
154,528
SGLT2 inhibitor
154,528
other glucose-lowering
drug
1,071,693 (87%) excluded
during 1:1 match process11,505 (7%) excluded during
1:1 match process1:1 propensity match

Baseline characteristics for the full propensity matched cohort
SGLT2 inhibitor*N=154,528
Other glucose-lowering drug*
N=154,528
Age (years), mean (SD) 56.9 (10.0) 57.0 (10.6)
Women 68,420 (44.3) 68,772 (44.5)
Established cardiovascular
disease†20,044 (13.0) 20,302 (13.1)
Acute myocardial infarction 3793 (2.5) 3882 (2.5)
Unstable angina 2529 (1.6) 2568 (1.7)
Heart failure 4714 (3.1) 4759 (3.1)
Atrial fibrillation 5632 (3.6) 5698 (3.7)
Stroke 6337 (4.1) 6394 (4.1)
Peripheral arterial disease 5239 (3.4) 5229 (3.4)
Frailty (yes)‡ 11,982 (7.8) 12,731 (8.2)
Microvascular disease 42,217 (27.3) 42,215 (27.3)

SGLT2 inhibitor*
N=154,528
Other glucose-lowering
drug*
N=154,528
Cardiovascular therapies
Antihypertensive therapy† 123,696 (80.0) 123,563 (80.0)
Loop diuretics 14,280 (9.2) 14,314 (9.3)
Thiazides 42,446 (27.5) 42,510 (27.5)
ACE inhibitors 66,812 (43.2) 67,067 (43.4)
ARBs 48,718 (31.5) 48,443 (31.4)
Statins 103,968 (67.3) 104,128 (67.4)
Diabetes therapies
Metformin 121,500 (78.6) 123,432 (79.9)
Sulfonylurea 59,406 (38.4) 59,788 (38.7)
DPP-4 inhibitor 51,400 (33.3) 50,088 (32.4)
Thiazolidinedione 13,650 (8.8) 12,970 (8.4)
GLP-1 receptor agonist 31,355 (20.3) 27,088 (17.5)
Insulin 45,573 (29.5) 45,097 (29.2)
*Data are n (%); †Includes angiotensin converting enzyme inhibitors, angiotensin receptor blockers, Ca2+ channel blockers, β-blockers, thiazides
Baseline characteristics for the full propensity matched cohort(continued)

Contribution of SGLT2 inhibitor: All countries combined
52.7%42.3%
45.3%
41.8%51.0% 49.1%
5.5% 6.7% 5.6%
0
10
20
30
40
50
60
70
80
90
100
HHF All-cause death HHF + all-causedeath
Pro
po
rtio
n o
f ex
po
sure
tim
e (%
)
Canagliflozin Dapagliflozin Empagliflozin

Hospitalization for heart failure or all-cause death primary analysis
P-value for SGLT2i vs other glucose-lowering drug: <0.001
Data are on treatment, unadjusted.
Heterogeneity p-value: 0.166
SENSITIVITY ANALYSES

CVD-REAL Nordic: Dapagliflozin compared to DPP4i
• Norhammar A, Bodegard J, Nystrom, T et al. Dapagliflozin is associated with lower risk of hospitalization for heart failure, major adverse cardiovascular events and all-cause death compared to DPP-4i in T2D patients: CVD-REAL Nordic. [poster] Presented at European Society of Cardiology - Heart Failure meeting; April 29 – May 2, 2017; Paris, France.
• Norhammar A, Eriksson JW, Bodegard J, et al. Dapagliflozin compared to DPP4i treatment is associated with lower risk of kidney disease, heart failure and all-cause death: CVD-REAL Nordic [poster]. Presented at the 77th Scientific Sessions of the American Diabetes Association meeting; June 9-13, 2017; San Diego, CA.

Study outcomes
• MACE
• All-cause death (ACD)
• Hospital events for heart failure (HHF; acute, chronic or unspecified)
• Hospital events for kidney disease (HKD; acute, chronic or unspecified)
• A combination of HKD or HHF

Study design and statistical analysis
• Patients were divided by index drug into two groups– New users of dapagliflozin
– New users DPP-4 inhibitors
• The groups were matched 1:3 by propensity score, calculated by using variables covering patient characteristics, co-morbidities and drug treatment
• Patients were followed from the index date until the index drug discontinuation, death or end of register
• Cox survival models estimated hazard ratio per country separately and presented by weighted averages

Patient flow chart
642,558
T2D patients during 2013-2016
19,662
Dapagliflozin
57,452
DPP-4 inhibitor
8582
Dapagliflozin
25,746
DPP-4 inhibitor
55%56%
77,074
New users of dapagliflozin or DPP-4 inhibitor

UK THIN database: Study design and methods
27
Data source: The Health Improvement Network (THIN) Database (UK)• Anonymized electronic patient records contributed by over 640 general practices• Study period: January 1, 2013 – September 1, 2015
Outcomes• Primary: all-cause mortality• Secondary: composite cardiovascular disease outcome (consisting of myocardial infarction, ischemic heart disease, stroke,
TIA, heart failure, or left ventricular dysfunction)• The composite analysis was restricted to the low-risk population
Patients • Registered at least 1 year at current practice• Exposed group
• 18+ years at index• Diagnosis of diabetes any time prior to index• Initiated dapagliflozin• Remained at their practice ≥3 months after dapagliflozin initiation (index date: 3 months post-initiation)
• Up to 4 unexposed controls were matched to each exposed patient based on sex, age at index, BMI, duration of diabetes, and smoking status

UK THIN database study: All-cause mortality
• Real-world evidence from an open cohort study of the THIN database suggests that dapagliflozin may be associated with a decrease in all-cause mortality irrespective of baseline CVD status
Toulis KA, et al. J Clin Endocrinol Metab 2017;[Epub ahead of print]
Control
Dapagliflozin
Analysis time
Low risk populationControl, n = 14,118
DAPA, n = 3,656
0 0.5 1 1.5 2
0.04
0.03
0.02
0.01
0
Total study populationControl, n = 17,680
DAPA, n = 4,4440.04
0.03
0.02
0.01
0
0 0.5 1 1.5 2
Cu
mu
lati
ve H
azar
d E
stim
ate
Analysis time

EMPA-REG: Empagliflozin reduced secondary endpoints of all-cause death and hospitalization for heart failure
7
0
6
5
4
3
2
1
Hospitalization for heart failure
HR=0.65 (95% CI: 0.50, 0.85)P=0.002
Placebo
Empagliflozin
0
Month
6 12 18 24 30 36 42 48
4687
2333
4614
2271
4523
2226
4427
2173
3988
1932
2950
1424
2487
1202
1634
775
395
168Placebo
Empagliflozin
No. at risk
Pat
ien
ts w
ith
eve
nt
(%)
0
15
10
5
Death from any cause
HR=0.68 (95% CI: 0.57, 0.82)P<0.001
Placebo
Empagliflozin
0
Month
6 12 18 24 30 36 42 48
Pat
ien
ts w
ith
eve
nt
(%)
4687
2333
4651
2303
4608
2280
4556
2243
4128
2012
3079
1503
2617
1281
1722
825
414
177Placebo
Empagliflozin
No. at risk
Zinman B, et al. N Engl J Med 2015;373:2217–2128

SGLT-2 INHIBITORS
• Weight loss: 1-4.5 kg observed • 1. Loss of calories from glycosuria and osmotic diuresis• 2. Potential for reduced insulin requirements • 3. Maintained past initial therapy period • Reduction in uric acid5,6,11,20• 1. Increased levels associated with HTN, CVD and renal disease • 2. 10-15% reduction in plasma uric acid levels • a. Clinical relevance unclear Cardiovascular Effect4,11,17,18,20-23 • 1. Modest reduction in blood pressure• a. 2014 Meta-analysis by Baker and colleagues• i. 27 unique RCT including 12,960 patients• ii. SBP: 4 mmHg drop consistent between SGLT-2 inhibitors• iii. DBP: 1.6 mmHg drop consistent between SGLT-2 inhibitors

• b. No increase in orthostatic hypotension • c. Reduces BP even in “non-dippers” i. Patients without nocturnal BP drop (“dip”) have an increased risk of CVD• d. BP reduction observed even in patients with CKD• 2. Reduction in arterial stiffness• a. Well established surrogate marker for CVD• b. 8-week open label prospective trial (n=42): T1DM with empagliflozin 25 mg vs placebo• i. Decreased carotid-radial pulse wave velocity (measure of arterial stiffness) under euglycemic and hyperglycemic
conditions• ii. Vagal tone and SNS activity not significantly changed • c. T2DM: Improved markers of arterial stiffness• i. Pulse pressure, myocardial oxygen consumption• 3. Proposed pathophysiology behind cardiovascular benefits: multifactorial• a. Proposed pathophysiology• i. Volume contraction 1. Unclear if volume contraction persists through treatment• ii. Weight loss correlation 1. Conflicting data between studies a. BP lowering independent of weight loss in
patients with CKD• iii. Neurohormonal changes-most are unlikely to play a significant role • 1. Increased plasma aldosterone, renin and angiotensin II and urinary angiotensinogen (vasoconstriction) • 2. Increased urinary ACE2 (vasodilation) a. Possible: requires further study • 3. SNS activity unchanged • iv. Reduced arterial stiffness b. Metabolic effects: weight loss, Increased fat oxidation, increased glucagon
secretion i. Unlikely to support reduction in CV death

Similarities and differences between SGLT2 inhibitor CVOTs (1)
• In addition to the EMPA-REG OUTCOME trial, two other SGLT2 inhibitors, canagliflozin and dapagliflozin, are investigating the same endpoints but in different (CANVAS in 2017) and also broader populations (DECLARE in 2019)
EMPA-REG1 (CANVAS+CANVAS-R)2 DECLARE3*
n 7020 (EMPA, 4687; PBO,
2333)
10,143 (CANA, 5794; PBO, 4349) 17,276
Interventions EMPA/PBO (1:1:1)
(10 mg, 25 mg, PBO)
CANA/PBO (1:1:1)
(100mg, 300mg, PBO)
DAPA/PBO (1:1)
(10mg, PBO)
Key inclusion
criteria
• HbA1c >7% and <10%
• eGFR >30 mL/min
• Age >18 years
• Secondary prevention (99%)
○Previous CV event
• HbA1c >7% and <10.5%
• eGFR >30 ml/min
• Primary prevention: ~35%
○ ≥2 CV risk factors
• Secondary prevention: ~65%
○ Established vascular
complications
• T2DM uncontrolled
• Primary prevention
○ Multiple risk factors
• Secondary prevention
○ Established vascular complications
Primary
endpoint
MACE (CV death, non-fatal
MI, non-fatal stroke)
Pooled MACE (CV death, non-fatal
MI, non-fatal stroke) from
CANVAS & CANVAS-R
MACE (CV death, non-fatal MI,
non-fatal ischemic stroke)
Co-primary: HHF + CV mortality
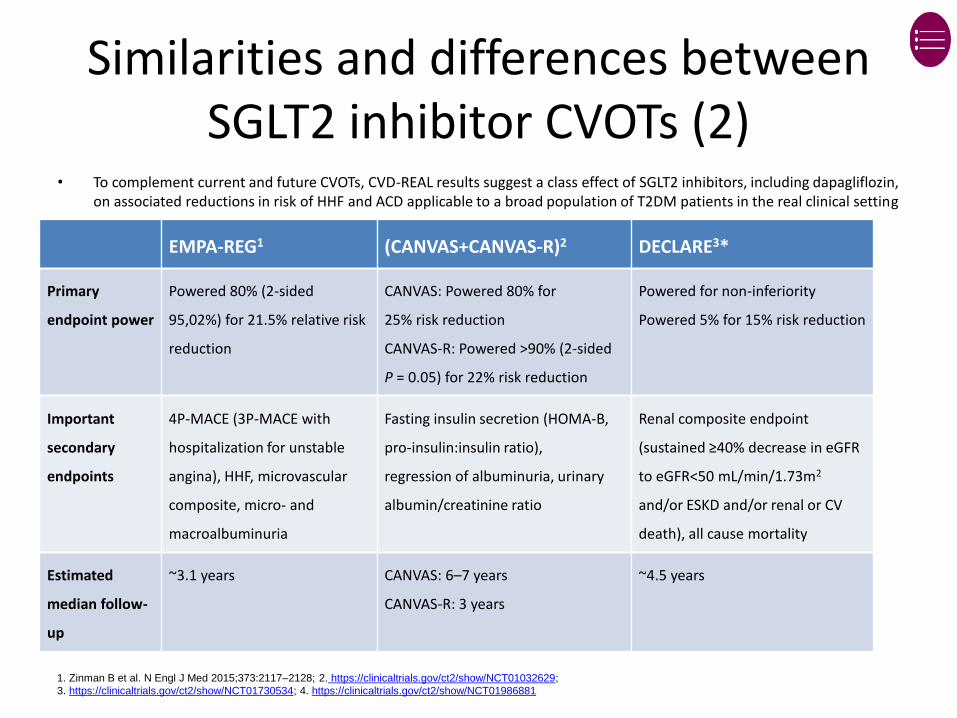
Similarities and differences between SGLT2 inhibitor CVOTs (2)
• To complement current and future CVOTs, CVD-REAL results suggest a class effect of SGLT2 inhibitors, including dapagliflozin, on associated reductions in risk of HHF and ACD applicable to a broad population of T2DM patients in the real clinical setting
EMPA-REG1 (CANVAS+CANVAS-R)2 DECLARE3*
Primary
endpoint power
Powered 80% (2-sided
95,02%) for 21.5% relative risk
reduction
CANVAS: Powered 80% for
25% risk reduction
CANVAS-R: Powered >90% (2-sided
P = 0.05) for 22% risk reduction
Powered for non-inferiority
Powered 5% for 15% risk reduction
Important
secondary
endpoints
4P-MACE (3P-MACE with
hospitalization for unstable
angina), HHF, microvascular
composite, micro- and
macroalbuminuria
Fasting insulin secretion (HOMA-B,
pro-insulin:insulin ratio),
regression of albuminuria, urinary
albumin/creatinine ratio
Renal composite endpoint
(sustained ≥40% decrease in eGFR
to eGFR<50 mL/min/1.73m2
and/or ESKD and/or renal or CV
death), all cause mortality
Estimated
median follow-
up
~3.1 years CANVAS: 6–7 years
CANVAS-R: 3 years
~4.5 years
1. Zinman B et al. N Engl J Med 2015;373:2117–2128; 2. https://clinicaltrials.gov/ct2/show/NCT01032629;
3. https://clinicaltrials.gov/ct2/show/NCT01730534; 4. https://clinicaltrials.gov/ct2/show/NCT01986881

Summary
• Dapagliflozin has demonstrated in RCTs to result in HbA1c lowering efficacy, weight loss and blood pressure reduction
– This has been consistently confirmed in the real-world clinical setting
• The CVD-REAL study was the first large, multinational, retrospective, observational study of CV outcomes in new users of SGLT-2 inhibitors compared with new users of other glucose-lowering drugs in a broad population of patients with T2DM, only 13% of whom had CVD
• The CVD-REAL primary analysis showed that in the real-world clinical setting, patients initiated on SGLT-2 inhibitors, including dapagliflozin, were associated with a 39% reduction risk of HHF and a 51% reduction in all-cause death compared with patients initiated on other glucose-lowering drugs
– The effect was consistent across countries, various sensitivity analyses and in patients with or without CVD
• Data from CVD-REAL Nordics demonstrated that new users of dapagliflozin were associated with risk reductions in hHF, MACE, ACD and HKD compared to new users of DPP-4 inhibitors
• In a secondary analysis of CVD-REAL, patients initiated on SGLT2 inhibitors, including dapagliflozin, were associated with a significant risk reduction in total hHF (new and recurrent) compared with those initiated on other glucose-lowering drugs
• The multiple benefits and CV profile of dapagliflozin are reinforced by data in the real-world clinical setting, further supporting the earlier use of SGLT-2 inhibitors in the treatment paradigm for T2DM

SGLT-2 inhibitors: My experience
• 95 patients at MP Shah hospital(hospital clinic and private) since August 2016
• 89 on Dapagliflozin(87 on 10mg 2 on 5mg) and 6 on Canagliflozin 100mg
• Excellent glycaemic control • Weight loss in all patients( average 3kg)• No UTI/ genital infections or DKA• 1 patient discontinued due to weight loss but restarted
this year after weight gain!• Good patient satisfaction• Patient education important