target price accuracy in equity research - fep.up.pt papers/489.pdf · we are indebted with sergio...
TRANSCRIPT

Target Price Accuracy in Equity Research
Stefano Bonini*
Università Commerciale “Luigi Bocconi”
Istituto di Amministrazione, Finanza e Controllo
Piazza Sraffa 11, 20122, Milan, Italy
Laura Zanetti
Università Commerciale “Luigi Bocconi”
Istituto di Amministrazione, Finanza e Controllo
Piazza Sraffa 11, 20122, Milan, Italy
Roberto Bianchini
Università Commerciale “Luigi Bocconi”
Istituto di Amministrazione, Finanza e Controllo
Piazza Sraffa 11, 20122, Milan, Italy
This draft: 25th
January 2006
JEL classification Codes: G11, G12, G14
Keywords: Target Prices, Analyst recommendation, security analysis.
The authors acknowledge financial support from MIUR-Università Bocconi Ricerca di Base 2005. We
also thank seminar participants at the EFMA Conference, Asian Finance Association conference, Bocconi
University. We are indebted with Sergio Venturini at IMQ, SDA Bocconi for invaluable support in
database structuring. We thank Borsa Italiana for providing additional data. The ideas expressed in the
paper do not necessarily reflect those of the authors’ affiliation. Any errors remain our own.
* corresponding author: E-mail: [email protected], Ph. +39 02 58363612; Fax +39 02
58363799

2
Target Price Accuracy in Equity Research
Abstract
Analysts’ target prices have received very limited attention in academic research. In this
paper we try to fill the gap by developing an innovative multi-layer accuracy metric that
we test on a novel database. Our analysis shows that forecasting accuracy is very
limited with a mean target price accuracy of 12%. Prediction errors are large (up to
46%) and significant, and positively correlated with research intensity. Controlling for
market and company factors, we still document large and consistent prediction errors.
Our results suggest that research activity may be used strategically by issuing firms to
artificially drive market prices.

3
Security research provides investors with information on the current and future
prospects of listed companies. Research is typically performed by high-status entities
like investment banks, consultancies or private research firms, whose reputation
influences investors’ behaviour significantly. Analysts make predictions on earnings
(earnings forecasts), forecast long-term stock prices trends (stock recommendations)
and try to anticipate future stock prices (target prices).
While a great deal of academic research and business press attention has been
devoted to the effect of analyst recommendation on stock returns or trading volumes,
and to the accuracy of stock recommendations, the ability of target prices to predict
future stock prices consistently has remained essentially unexplored.
Yet, we believe that understanding analysts’ forecasting accuracy is relevant for
three reasons: First, target prices are self-contained statements incorporating stock
recommendations and earnings forecasts, making them a more comprehensive
prediction.
Second, since gathering and managing information conveyed by research reports
is a delicate, costly and time-consuming process,1 target prices may be a simple and
practical way2 to create portfolio strategies by looking at the implicit returns embedded
in each target. Implicit returns, i.e. the difference between the predicted price and the
issuing date stock market price, convey a straightforward prediction of the potential
return for an investment, and intuitively this prediction is more attractive the higher the
reputation of the issuer and the lower the sophistication of the investor. Less informed
investors may also tailor their investment strategies on the information inferred from
target prices. Analysts therefore may have an incentive to shift risk from skilled and
informed investors to the less informed by issuing overstated target prices.
1 On average, over 50,000 reports are published every year worldwide. Scattered evidence on the cost of
gathering research shows that, when available, a report can be purchased at an average price of 30 USD. 2 Typically, information is spread in the market by means of simple statements such as “Morgan Stanley
analysts have set a medium-term upside target of 17,7 euro per share in Deutsche Telekom” (Frankfurter
Allgemeine Zeitung, January 13, 2005) or “Amazon.com: Shares of the online retailer rose 3.5 percent
after Bear Stearns raised its investment rating to ‘outperform’ from ‘peer perform’ saying it was poised
for a very strong fourth quarter [...] target price 57 dollars”, (Yahoo Finance, US stock watch, December
28, 2004).

4
Third, previous studies - Barber et al. (2001) and Jagadeesh et al. (2004) - have
shown a degree of differential ability among analysts in predicting earnings and
recommending stocks that have outperformed the market. No study, though, has
provided evidence of the accuracy of analysts in forecasting future market prices.
Limited evidence is shown by Asquith et al. (2005) who, adopting a simple binary
metric show that on average 46% of targets are not met. Evidence on this accuracy
could help draw a better picture of the security research industry, which is receiving
growing attention from regulators worldwide. In this spirit, more stringent information
disclosure rules and more effective requirements for granting independence of research
have been issued.3
Target prices should reflect, at or around the publication date, the analyst’s best
estimate of the company “intrinsic value”. At the issue date, each target price may differ
from the current market price for a number of reasons: First, the market is not yet
discounting the full company’s value emerging from the latest information available to
analysts. Second, the analyst is making assumptions on the company’s future cash flows
which differ from assumptions shared by the majority of investors and are implied in
the current market price. In both cases, which can also occur simultaneously, if markets
are sufficiently efficient, we can expect prediction errors to be, on average, not far from
zero, given that market prices should fully reflect investors’ strategies based on any
available information4 and that the market assigns a value to accurate predictions by
either increasing reputation for consistently anticipating price movements and/or linking
analysts compensation packages to some accuracy measure.
Surprisingly, empirical evidence by Stickel (1990,1992,1995) Cooper, Day and
Lewis (2001) and Bernhardt, Campello and Kutsoati (2004), show that both analysts’
3 In the US research activity regulation is based on SEC (Regulation analyst certification), NYSE (rule
472) and NASD (rule 2711) regulations. In 2002 the Sarbanes-Oxley Act established more stringent
requirements and obligations for analyst research and defined harsher penalties for rule breaches. The
main goal is to have firms fully disclose information about sell-side analyst remuneration policy, relevant
ties between analysts and companies and relationships between companies and other banking divisions.
Italian rules establish that if information is suitable for influencing prices of financial instruments, must
be released to the market by immediate publication on publicly accesible media.. 4 Thomson Financial data show that 92% of market trade is given by insititutional investors who are
generally the most active issuers of research reports.

5
ranking criteria by independent institutions5 and published compensation schedules by
banks, do not include target price accuracy as a factor in determining analysts’ salaries.
Target prices therefore, appear to be a powerful but largely unregulated
influence on driving investment decisions.
In this paper we argue that since forecasting target prices is an opaque activity,
research analysts (and the institutions they work for) have an incentive to use them
“strategically”, i.e. , by issuing target prices that, rather than conveying a fair estimate
of the future price, are consistently over/underestimated, as recently shown by
Bernhardt, Campello and Kutsoati (2005) on earnings’ forecasts. The rationale for this
behaviour is that since no monitoring occurs on this part of the research activity which
flows continuously to the market at large, analysts, independently or on behalf of the
companies they work for, may try to exploit the price effect associated with the release
of new information as documented, among others, by Abdel-Khalik and Ajinkya
(1982). For instance over-optimistic target prices can create positive momentum on
some stocks that firms can anticipate for rebalancing their own portfolios or transferring
risk from more informed to less informed investors by appropriate trading strategies. If
this behaviour holds, we should expect a consistent overestimation of target prices for
positive recommendations (buy/strong buy) and, conversely, a large underestimation for
negative ones (sell/strong sell). Furthermore, the magnitude of the over/under
estimation should increase with liquidity: since large caps are less sensitive to trading
activity, in order to generate a sizeable price effect on this asset class,
over/underestimation needs to be sufficiently large to induce a significant number of
investors to trade.
Measuring accuracy is not straightforward: Barber et al. (2001) check whether
analysts have superior forecasting ability by creating portfolios based on analyst
recommendations and comparing them with an investment in the index. Brown and
Mohd (2003) also try to measure analyst accuracy in forecasting earnings. Both
approaches share the characteristic of measuring relative performance at the end of a
fixed period (12 months or the release of actual earnings by companies). Unfortunately,
when dealing with target prices this approach would lead to biased results: a target price
5 See Institutional Investors All America research or Investar ranking.

6
is generally assumed to be a prediction that is realized within a specified period, not
necessarily at the end of that period. Since no similar studies testing target price
accuracy are available and given this peculiarity of target prices, we introduce a
comprehensive four-fold accuracy measure: we jointly measure the accuracy of price
forecast at the end of the forecasting period and at any moment in between. We then
compare this measure with the actual returns realized by each stock. Our results suggest
that the frequency of accurate prediction is surprisingly low and the size of the
prediction error is impressively large. Consistently with our expectation, liquidity is
positively related with the size of the error as well as with market momentum, with
mixed results for other industry variables. Our findings are consistent with Bradshaw
and Brown (2005) which recently addressed target price accuracy with a simpler
methodology.
An innovative part of this paper is the choice of the sample base: Italy requires,
since 1999, mandatory publication of research reports on the stock exchange website for
the purpose of granting investors access to price-sensitive information. Other countries
do not share similar regulations. Italy, therefore is an ideal testing ground for our
research. Since research publication is mandatory for all intermediaries authorized in the
market, if a strategic behaviour in issuing research exists, we expect firms to try to
avoid truthful disclosure by, for example, issuing research from foreign branches.
This hypothesis seems to be supported by our findings which show the largest
trading firms in the market issuing relatively less research, with some companies,
representing 10% of market turnover not publishing at all.
Finally, our research adds to the existing literature because we choose to study
prediction errors in every target price/report instead of focusing on aggregate measures
like consensus forecasts. This approach helps to support the hypothesis that research
activity is largely inefficient effort and is widely influenced by research firms’ strategic
choices.
The remainder of the paper is structured as follows: Section II reviews the
literature; Section III describes data collection; Section IV introduces variables and
research hypothesis; Section V presents results; Section VI concludes and introduces
future research agenda.
7
II Related research
Security analysts' research has received growing attention from both academics
and regulators. Early studies have mainly focused on market's reaction to analysts'
earnings forecasts, recommendations and revisions. Almost uniformly, these analyses
show non-zero, robust abnormal returns for earnings forecast revisions or new buy/sell
recommendations. Abdel-Khalik and Ajinkya (1982) find significant abnormal returns
around the publication week of revisions issued by Merrill Lynch analysts.
Analogously, Lys and Sohn (1990) and Stickel and Scott (1990) document an
information content associated with forecast revisions
The sign of abnormal returns was examined originally by Lloyd-Davies and
Canes (1978). Additional evidence is provided by Bjerring, Lakonishok and Vermaelen,
(1983); Elton, Gruber and Grossman, (1986); Liu, Smith and Syed, (1990); Beneish,
(1991); Stickel, (1995).
Womack (1996) documents a significant initial price and volume reaction: size
adjusted prices increase by 3% for buy recommendations and drop 4.7% for sell
recommendations in the event window. Furthermore he finds a significant post-
recommendations stock price drift in the direction forecast by the analysts: buy
recommendations earned an adjusted mean return of 2.4% for the first post-event
month, sell recommendations caused a post-recommendations drift of –9.1% over a
longer six-month post-event period.
Recent research investigates simultaneous changes in both earnings forecast and
recommendation revisions. Francis and Soffer (1997) show that both factors fail to fully
convey the information of the other signal. Their findings support the hypothesis that
investors rely more heavily in their investment decisions, on repeated signals like
revisions rather than an absolute forecast. Stickel (1995) performs similar tests also
controlling for the magnitude of the recommendation revision, the analyst's reputation,
the size of the analyst's firm and the company’s information. His results are consistent
with those of Francis and Soffer while both show low statistical significance.
Target prices have been included in academic research only in recent studies.
Bradshaw (2002) focuses on the joint publication of target prices and recommendations:
8
on a sample of 103 reports, finding that the publication of a target price is positively
correlated with more favourable recommendations. The paper closer in spirit to ours is
Bradshaw and Brown (2005), who provide evidence of a differential ability by analysts
in accurately predicting prices: Yet, as in Asquith et al. (2005), they look at the
analysts’ ability in predicting prices through a binary metric rather than developing a
quantitative metric for interpreting the size and sign of forecast errors.
Brav and Lehavy (2003) show that target prices significantly affect market
prices. The effect is unconditional on the simultaneous issuance of recommendations,
similarly to Francis and Soffer (1997).
The effects associated with a lack of independence are similar to those found in
Michaely and Womack (1999), which documents that mean excess returns around a buy
recommendation revision are lower when the recommendation is made by an
underwriter rather than by an unaffiliated brokerage.
Asquith, Mikhail and Au (2005) examine the complete text of a large sample of
actual analyst reports and provide information beyond earnings forecasts,
recommendations and price targets. They show that other information, such as the
strength of the analyst's justifications, is also important and when considered
simultaneously reduces, and in some models eliminates, the significance of the
information available in earnings forecasts and recommendation revisions. By
controlling for the simultaneous release of other information, they show that analyst
reports provide new and independent analysis to the market.
Jegadeesh, Kim, Krische and Lee (2004) investigates the source of the
investment value provided by analyst stock recommendations and changes in
recommendations. They also assess the extent to which sell-side analysts make full use
of available information signals in formulating stock recommendations. They find that
analysts do not fully take into account the ability of various stock characteristics to
predict returns. Moreover, their evidence shows that the direction of the bias in analyst
recommendations is in line with economic incentives faced by sell-side brokerage firms.
Evidence on the Italian Market shows similar results. Belcredi, Bozzi and
Rigamonti (2003) have studied stock market price and volume reaction following
9
upgrade (downgrade) recommendations. The authors observe abnormal returns around
stock recommendation release (+1;-1 days) but not in prior or subsequent period.
Barucci Bianchi and Passaporti (2003) document market reactions to the release
of new analyst recommendations. They show that positive/negative recommendations
(buy, strong buy/sell, strong sell) yield positive/negative abnormal returns.
Finally Cervellati (2004), documents potential conflicts of interest by non-
independent research analysts issuing research on recently listed companies. By
analyzing 1099 reports on 63 companies that went public in the period 1 January 2000 –
29 December 2001, he shows that IPOs recommended by independent analysts perform
better than those recommended by non-independent analysts.
III. Data Collection
A. Regulatory issues
We are motivated in the selection of a non-US sample of target prices by
observing that Italy is the only country to require mandatory publication of any research
issued by authorized financial intermediaries. Research activity is ruled by the TUF
(Testo Unico della Finanza) approved by the Italian Parliament in 1998. Section IV
(Comunicazioni al pubblico),6 article 114 states that all non-public information which, if
revealed to the market, may affect market prices of financial instruments, must be
compulsorily transmitted to the public. It also established that CONSOB (Italian Stock
Exchange Commission) must set and update, when necessary, rules concerning what is
considered to be “price sensitive” information.
In 1999, CONSOB issued regulation #11971. Article 69 states that research
reports on listed companies must be sent to CONSOB and to Borsa Italiana on the day
they are issued for immediate publication in full format on the Borsa Italiana website.
Exception is given to research privately produced for financial institutions or specific
customers which has to be transmitted to CONSOB and Borsa Italiana within 60 days of
the issuing date. This delay is granted in order to preserve value for clients who pay for
additional research.
6 Comunicazioni al pubblico i.e. “Information released to the market”.

10
This unique regulation provides a fertile testing ground for our research
hypothesis for two reasons: first, we should not expect a sample bias due to
discretionary disclosure of research activity by analysts. Second, given the existing
regulation, intermediaries not willing to reveal information to the market have an
incentive to circumvent the Stock Exchange requirement by publishing from overseas
branches. In contrast, publication of US research is generally provided through
agreements between research firms and non-financial institutions such as Thomson
Financial or Investar. Therefore the risk of incurring in significant selection bias would
be greater.
B. Database construction
We collected over 13,000 reports published from 1 January 2000 up to 31
December 2003, on the Borsa Italiana website. We then selected 9690 reports
published by 47 distinct research firms.7 Selected reports cover 98 companies listed on
the Milan Stock Exchange8 representing approximately 405.32 bn€ or 81.96% of the
overall market cap. Surprisingly, over 140 stocks are not covered or marginally covered
by research. This suggests that their representation in investors’ portfolios and the
relative trading activity is rather small.
Reports were included in the first sub sample of 9690 if they satisfied three
criteria: first each report accepted for inclusion in the database ought to represent
companies continuously listed in the whole period of analysis, therefore we have
excluded delisted companies’ reports. Second, reports focusing on firms that went
public later than January 1999 were excluded due to the potential for upward bias, as
showed by Michaely and Womack (1999) and Cervellati (2004). Third, for any research
firm, we exclude “single report companies”, i.e. companies for which only one report
has been published across the time interval of analysis. These three criteria resulted also
in the exclusion of all reports targeting companies listed in the technological stock
market “Nuovo Mercato”.
7 Consistently with previous studies we define research issuers as “firm(s)” and target companies as,
simply “companies” 8 Out of a total of 262 as of 31 December 2003.

11
We then applied two further filters: the first excluded from the database all
“damaged”9 reports and all “mirror”
10 reports, a total of 1825 reports or 18.83% of the
original set. The second filter was applied to generate an “informationally efficient”
sample aimed at solving quasi-duplications: whenever two reports on the same company
by the same research firm were available with publishing date less than or equal to 14
days, we excluded either the former or the latter according to the following principle: if
the two reports presented an identical recommendation and target price we excluded the
latter because we assumed a duplication or error in the publication; if the two reports
expressed different recommendations or target price, we excluded the former assuming
that an unanticipated, extraordinary event had occurred.11
This filtering excluded a
further 865 reports.
Jointly, the two filters reduced the sample to 7036 reports which we consider to
be a consistent representation of publicly available information for our research
perimeter.
Additional information about reported companies – such as market
capitalization, daily closing prices, daily trading volumes - has been collected by
Datastream. Industry classification is based on FTSE Global Classification system
“Economics group” level 3. Stock Market Index Composition was extracted from
Datastream.
Tables 1 provides details of the sample.
TABLE 1 PANEL A HERE
TABLE 1 PANEL B HERE
9 By damaged we mean: unreadable, empty, compiled in formats unsupported by standard readers such as
Acrobat, MS Word, Wordperfect etc. and/or with missing information. 10
Mirror reports have been defined as identical reports published twice under two different filenames or
classifications. 11
Some examples include: mistakes in publication, corrections in data originated and released by the
reported company.

12
Table 1, panel A shows descriptive statistics of the 98 companies included in the
database. Six companies total over 200 reports each, being the most represented in the
sample. The relative number of reports per company shows that the most-analysed
company, tops 225 reports, forming only 3,198% on the total sample, therefore allowing
us to exclude major concentration biases in sample representation.
Table 1, panel B shows summary statistics for reports distribution by companies
and industry. Companies are researched on average by 72 reports, but data on standard
deviation and median hint at some skewness in distribution. Standard deviation is high
66.08 and median is 46.5. At the Industry level, data show that Financials is the most
represented industry with 29 companies and 2109 reports; Cyclical industries are also
well represented both in terms of companies and reports. A measure of the thinness of
the Italian Stock Exchange is given by figures on Non-cyclical services and Resources
which, with only 2 and 3 firms respectively, show the highest mean coverage of the
sample.
Table 2 provides evidence on yearly and monthly reports distribution. Research
intensity steadily grows over the sampling horizon. Within each year, four accumulation
points exist around the months of March, May, September and November which
typically host major corporate events like shareholders’ meetings, dividend distribution
decisions or budget approval for future fiscal years. This pattern is consistent with the
hypothesis that analysts update research with the arrival of new information.
TABLE 2 PANEL A HERE
TABLE 2 PANEL B HERE
Selected reports have been classified according to the original recommendation
ranking adopted by each individual research firm. Since each firm adopts an individual
scale, we reclassified recommendations on a standard five-point scale: “strong sell-sell-
hold-buy-strong buy”, in order to perform comparative analysis. The conversion
criterion goes as follows: if the original scale is a five-steps scale with a central
recommendation indicating a “stand-by” on the investment (such as ‘neutral’ or ‘hold’)

13
we have converted the recommendation straightforwardly in our standard scale; if the
original scale is a three-steps scale we have converted the central recommendation into
a ‘hold’ and looked at both the recommendation and the target price for the upside and
downside indications. We convert a buy with an implicit return above 20% into a strong
buy and keep a buy for implicit returns below that level. Analogously we convert ‘sell’
recommendations into strong sells only when implicit loss is larger than -20%. Table 3
shows scales conversions.
TABLE 3 HERE
Table 4 provides recommendations transition matrix. Recommendations
considered are less than total recommendations because we have excluded the last
recommendation issued by each firm and reports published only once by a firm on a
company.
TABLE 4 HERE
Most reports (n=3845) reiterate the previous recommendation. Reiterations are
represented in bold on the diagonal of the matrix in Table 4. ‘Strong buy’ and ‘buy’
reiterated recommendations account for 56% of total unchanged reports. Upgrade
recommendations are defined as upward revisions of previous recommendations: they
include all reports below the matrix diagonal. Similarly, downgrades are defined as
downward revision of previous recommendations and include all reports above the
matrix diagonal.
The two tables show that upgrades and downgrades are most often towards near
recommendations: buy to hold (n=385), hold to buy (n=294), strong buy to buy (n=241)
and buy to strong buy (n=182). The relative transition matrix indicates that across all
recommendation classes, the most frequent update is a reiteration of the previous
recommendation. When positive recommendations (strong buy/buy) change, they are
often downgraded to the nearest-class recommendation (buy/hold) and, similarly, when

14
negative recommendations change it is most often an upgrade to the nearest superior
recommendation class.
IV. Accuracy metrics
Our analysis addresses the accuracy of analyst target prices.12
No previous
studies have developed a comprehensive methodology for assessing forecasting
accuracy. In a recent paper Asquith et al. (2005) test accuracy by a simple metric which
considers “accurate” a target if the underlying share price reaches or exceeds the target
at the end of the time horizon. In the same spirit, Bradshaw and Brown (2005) extend
the analysis by checking whether the price is met also at any time during the report time
horizon.
In this paper we aim to develop a multidimensional benchmarked metric for
testing accuracy. We first address the issue dealing with each analyst’s forecasting time
horizon. Analysts generally do not make explicit assumptions on the time required by
market prices to adjust towards the predicted target. Most of the time, when an explicit
time is provided, it is equal to 12 months from the report’s issue date. A second concern
is whether we should adjust time horizons for target price revisions. If a new report is
issued before the end of the (implicit or explicit) time horizon, two options are available
for defining time horizons: time horizons can be left unchanged, and accuracy measured
on two partially overlapping periods or time horizons can be reset i.e. stopping the
initial accuracy measure at the time of update and generating a new measurement
adopting the update’s new time horizon (again, implicit or explicit). In our analysis we
have opted for the second approach for the following reason: a rational individual would
revise his/her prediction only if new information arrives implying a consistent change in
his/her judgment. If this translates into a new price forecast, rational investors have the
12
Throughout this paper we are interested in trying to understand the predictive ability of each research
firm. We therefore analyze every recommendation as a stand alone investment indicator. We exclude,
differently from other papers, investment strategies based on either static portfolio diversification or a
fortiori dynamic portfolio allocation. Clearly, any consensus-driven or deep-diversified investment
strategy reduces the non-systematic risk for any investor but risk reduction actions are out of the scope of
this research. We believe this approach to be more consistent with small, uninformed investors’ strategies
which are more subject to sub-optimal diversification and to be driven in their allocation decisions by
analyst recommendations. Furthermore, results in terms of analyst’s individual performance are not
affected by this assumption.

15
option to adjust their portfolio holdings based on the new credible signal issued to the
market. Obviously, the former forecast loses any meaning both for the analyst and for
the investors. Accordingly, we believe that it would be misleading to measure accuracy
without adjusting for report updates.
We make then the following assumptions:
Assumption 1: If target prices are issued with an explicit time horizon we check
whether the market price reaches the target price at any moment between the issue date
and the time-horizon final date, unless a new report is issued. In this case we consider
the final prediction date to be the new report date minus three days.13
Assumption 2: if reports are issued without an explicit time horizon, we consider
the time horizon to be the lesser between 12 months or the following report update
minus three days.
A second issue is given by the very meaning of accuracy. Ex-ante target prices
convey an immediate performance prediction that we define “implicit return” which is
given by the algebraic difference between the target price and the current market price.
Formally, we define implicit return (IR) as:
IR = [TPt0/Pt0]-1
This prediction is met if at some point during or at the end of the time horizon,
the underlying share price reaches the target price. Market prices, though, may not
perfectly match the target;14
in this case the accuracy of a target price is given by the
degree of proximity of the share price to the target. To capture accuracy at this level we
develop two metrics, named “Ideal Strategy” (IS) variables, because it is dubious
whether this level of accuracy can be exploited by investors, since understanding when
a price is at its maximum level is almost impossible:
13
This last adjustment is made to take into account any possible information leakage around the new
report date. A second motivation is given by the fact that, as in Welch (2000) and Barucci et al. (2003),
analysts tend to concentrate publishing reports around the same date. This last evidence is also supported
by the data in Table, Panel A 14
And indeed we show that this is not typically the case.
16
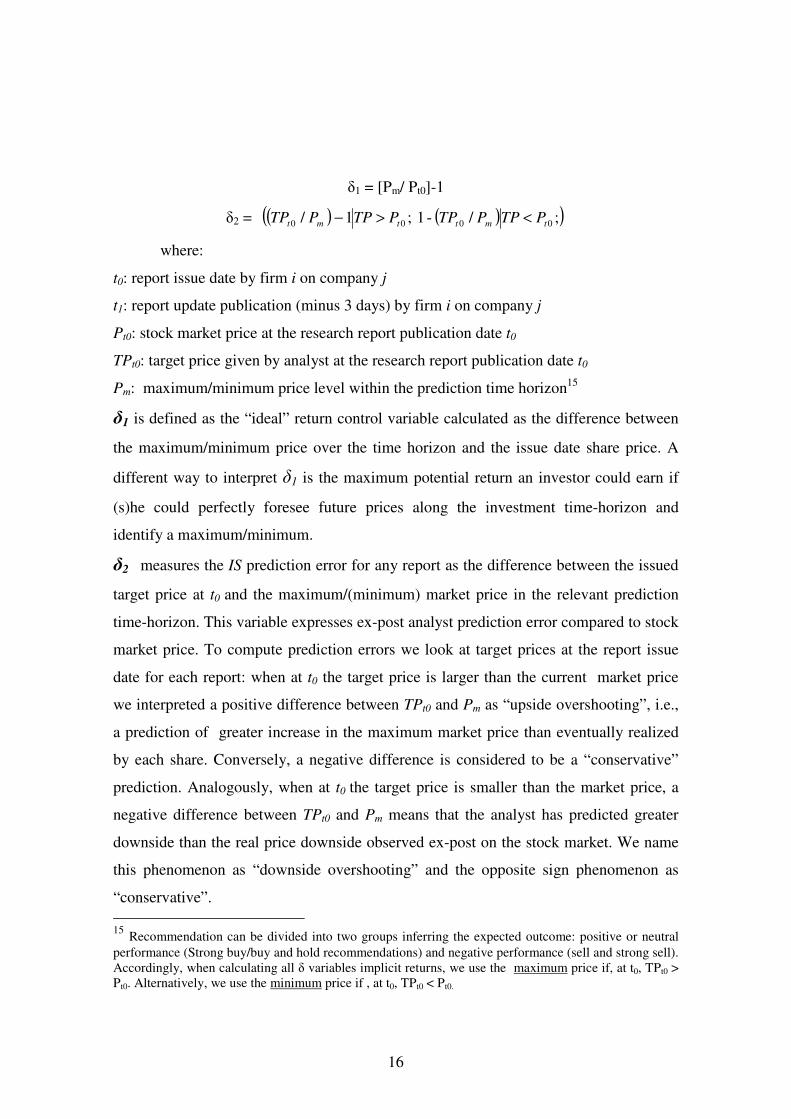
δ1 = [Pm/ Pt0]-1
δ2 = ( ) ( )( );/ -1 ;1/ 0000 tmttmt PTPPTPPTPPTP <>−
where:
t0: report issue date by firm i on company j
t1: report update publication (minus 3 days) by firm i on company j
Pt0: stock market price at the research report publication date t0
TPt0: target price given by analyst at the research report publication date t0
Pm: maximum/minimum price level within the prediction time horizon15
δ1 is defined as the “ideal” return control variable calculated as the difference between
the maximum/minimum price over the time horizon and the issue date share price. A
different way to interpret δ1 is the maximum potential return an investor could earn if
(s)he could perfectly foresee future prices along the investment time-horizon and
identify a maximum/minimum.
δ2 measures the IS prediction error for any report as the difference between the issued
target price at t0 and the maximum/(minimum) market price in the relevant prediction
time-horizon. This variable expresses ex-post analyst prediction error compared to stock
market price. To compute prediction errors we look at target prices at the report issue
date for each report: when at t0 the target price is larger than the current market price
we interpreted a positive difference between TPt0 and Pm as “upside overshooting”, i.e.,
a prediction of greater increase in the maximum market price than eventually realized
by each share. Conversely, a negative difference is considered to be a “conservative”
prediction. Analogously, when at t0 the target price is smaller than the market price, a
negative difference between TPt0 and Pm means that the analyst has predicted greater
downside than the real price downside observed ex-post on the stock market. We name
this phenomenon as “downside overshooting” and the opposite sign phenomenon as
“conservative”.
15
Recommendation can be divided into two groups inferring the expected outcome: positive or neutral
performance (Strong buy/buy and hold recommendations) and negative performance (sell and strong sell).
Accordingly, when calculating all δ variables implicit returns, we use the maximum price if, at t0, TPt0 >
Pt0. Alternatively, we use the minimum price if , at t0, TPt0 < Pt0.

17
Feasible investment strategies, though, do not allow investors to anticipate future
market prices. Assuming that investors cannot effectively predict when a
maximum/minimum price is achieved on the market, we model two alternative
“Feasible Strategy” (FS) variables:
δ3 =[ Pt1/ Pt0]-1
δ4 = ( ) ( )( );/ -1 ;1/ 010010 tttttt PTPPTPPTPPTP <>− ++
where:
Pt+1 : stock market price at the research report releasing date t1
δ3 is the second control variable measuring the “feasible” return as the difference
between the price at the end of the time horizon and the report’s issue date share price.
Analogously with δ1 we can interpret it as the return yielded to investors by a buy-and-
hold strategy in the share over the whole time horizon.
δ4 measures the FS prediction error for any report as the difference between the issued
target price and the stock market price at the end of the investment time-horizon.
Prediction error interpretation goes the same way as for δ2: when the target price is
bigger than the market price at t0 we interpreted a positive difference between TPt0 and
Pt1 as “upside overshooting”, i.e., a prediction of greater increase in market price than
eventually realized by each share at the end of the time horizon. Conversely, when the
target price is smaller than the market price at t0, a negative difference between TPt0 and
Pm is defined as “downside overshooting”.
Figure 1 gives a graphical representation of the four variables.16
INSERT FIGURE 1 HERE
16
The case represents a positive implicit return target price forecast.

18
Figure 2 shows variables’ sign interpretation: if TP is greater than market price
at t0 (top side of the graph), a positive sign for variables δ2 and/or δ4 means that the
issued TP has proved to be greater than the realized market price at the end of the time
horizon. We name this event as "overshooting". A negative sign means that the realized
market price has exceeded the issued TP: we define this recommendation to be
"conservative". For the bottom part of the graph (when TP is lower than current market
price at t0), overshooting occurs when we obtain a positive sign, i.e., when the issued TP
is lower than the realized market price.
INSERT FIGURE 2 HERE
In Table 5, we show summary statistics for these metrics. In column 1 we report
predicted implicit returns computed as the difference between target price and the
market price at the issue date. In Column 2 we report the quantitative change in Target
Price revisions measured as the percentage difference between a target price and its
closest revision. Columns 3 and 4 report figures for the ‘Ideal Strategy’ (IS) accuracy
control metric and variable respectively. Columns 5 and 6 report figures for the
‘Feasible Strategy’ (FS) accuracy control metric and variable respectively.
TABLE 5 HERE
Figures indicate that implicit returns are decreasing in recommendation classes,
ranging between 38.18% for ‘strong buy’ recommendations to -31.22% for ‘strong sell’
recommendations. This result is consistent with a rational approach to forecasting:
stocks that are less favourably recommended by qualitative measures are also expected
to grow less. Intuitively, both implicit expected returns and TP changes should decrease
the more unfavorable is the revision. Indeed, that is confirmed by our data which also
show that negative recommendations are associated with larger and more skewed target
price revisions.

19
Columns 3 and 4 report figures for the IS control metric and variable
respectively. Data show that, assuming a “hold” recommendation as the pivotal point,
an investment strategy driven by recommendations and target prices yield a
monotonically positive return in the level of recommendation with a maximum average
yield offered of 14.43%.17
Yet overshooting18
is statistically significant and large,
ranging from slightly less than 0% for “hold” recommendations, to 22.39% and 9.77%
respectively for “strong buy” and “strong sell”.
IS metrics assume that investments in stocks are undertaken at the report issue
date and liquidated once the price reaches its maximum level within the investment
time-horizon. Most of the time, though, as shown by columns 3 and 4, prices never get
reasonably close to the expected target price level,19
calling into question the hypothesis
that, on average, investors can discriminate between market prices and understand
which price represents a “real” maximum. Less informed investors in high
recommendation level stocks (strong buy/strong sell), still observing a large deal of
implicit return not yet reflected by market prices, are keener to wait for the price to
change.
To test for the predictive ability of market prices in a more realistic investment
strategy we constructed the FS variables which assume an investor to open the position
on any report issue date and close it at the end of the time horizon.20
FS data are reported in columns 5 and 6 and surprisingly, this strategy yields
consistently negative average returns across all recommendation level classes.
Overshooting is significantly larger with the same signs of IS variables. The highest
overshooting is for the ‘StrongBuy’ class with 46.81%. These results indicate a smaller
accuracy than those in Asquith et al. (2005) but are aligned with those in Bradshaw and
Brown (2005) and suggest that when reports are issued there is a significant effect on
17
Figures are non-annualized returns.. 18
In both directions: upwards and downwards according to the relevant recommendation. 19
Furthermore, several times the maximum price empirically calculated ex-post, is exactly the issuing
date market price That means that a particular share over the relevant time-horizon has shown a
monotonically decreasing (or increasing) market price. 20
If the end of the time horizon is a research update we consider the update release date minus three days
as explained in section 4.1

20
market prices which allow positive IS returns expressed by variable δ1.21
Eventually
though market prices reverse yielding a negative return on a buy-and-hold strategy
position opened at the report issue date and closed either at the first update or after 12
months, whichever comes first.
V. Do firms try to avoid publishing?
Table 6 panel A documents research diffusion across banks. The most actively
publishing firms are: Intermonte (815 reports), Euromobiliare (614), UBM (500) and
Deutsche Bank (455). All these firms contribute less than 11% to the full sample.
Preliminary analysis show the striking absence from the database of large, high status
firms like Morgan Stanley, HSBC or Barclays. Given the European market
composition, we classify firms into two groups Domestic and Foreign, assuming a firm
to be foreign if its headquarter is not incorporated in Italy and it does not have a
research team in Italy22
. We then cross check the number of reports published by
foreign firms with the same figure by Italian banks. Evidence shows that only slightly
more than one quarter of research has been published by foreign banks. Yet, rankings
data on underwriting and trading activity in Italy obtained from Bloomberg’s “Equity
Underwriting Rankings” for the period January 2000-December 2003, show that, the
apparent lack of research activity has not prevented foreign banks to occupy the top
places. We argue that this can be interpreted as an indication of the existence of a
strategic behaviour in publishing research: underwriting and trading best practices
generally require a reasonable amount of research to support the investment activity
therefore the absence or limited amount of research shown by some banks suggests that
research exists but has not been transmitted to the local authorities. To check in more
detail this hypothesis we have sorted banks according to the absolute value of
underwriting activity. In Table 6 Panel B, we have imposed three cutoffs (Top50%;
Top80%; Top90%) to measure the relative contribution to the relevant group.
21
This evidence can be interpreted as an indirect corroboration of previous studies on the effect on market
prices of research publication. 22
In our sample, the only foreign firm which ends up being classified as “Domestic” although being
foreign is Deutsche Bank, since its Italian research team is based in Italy where research is issued.

21
TABLE 6 PANEL B HERE
Looking at the “Top50%” cutoff, we have striking evidence of the expected
behaviour: foreign banks account for slightly less than 25% of the market, a figure very
close to that of Domestic banks; their research activity though, accounts for only 1.35%
of total publications, vis-à-vis a 17.68% figure for Domestic banks. Anecdotal evidence
and unreported analysis23
shows that, for many firms, research activity is indeed
considerably larger than that available in our database, suggesting that a good deal of
research has been published abroad and not transmitted to the Italian authorities. The
pattern is consistent across all three groupings as shown in Figure 3.
FIGURE 3 HERE
Since foreign firms are not obliged to submit research to the Italian authorities,
there is no breach of law in this behaviour but only a strong signal that avoiding public
disclosure is strongly preferred by issuers.
A caveat is the potential country bias in our data given by the legal requirement
to monitor and publish research on companies for which banks have been sponsors24
:
since domestic issuers may lean towards domestic advisors, this may generate an
overrepresentation of domestic banks vis-à-vis foreign ones.
To control for this risk we inspect the database composition,25
observing that the
total number of reports issued on nine companies included in our sample that returned
to the market26
between 1999 and 2003 is 765 or 10.87% of our final sample, with each
company representing 1,21% (1,08%) mean (median) reports out of the total sample.
Two companies appointed a bank that we have defined as “Foreign” as Sponsor or
23
We have checked Thomson Financial First Call database and required research statistics to banks to
control for the existence of reports by firms showing small or null figures for research publication. Due to
restrictions in data gathering we are still unable to fully disclose these information. 24
See CONSOB rule 11971, art.48. 25
These data are based on unreported analyses, available upon request from the authors. 26
We have not considered companies that went public in this time window for avoiding sample biases
documented by Michaely and Womack (2000), as specified in section III B.

22
Global Coordinator. The total amount of reports targeting these two companies is 268 or
3.81% of our sample. These figures are consistent with findings on the whole sample.
The risk for a country bias is therefore limited, although the small size of this sub-
sample suggests that the evidence may not be conclusive.
VI. How accurate are analysts?
To test accuracy we adopt a modified Asquith et al. (2005) approach, defining
accurate a target price if the underlying share price reaches the target price with an
accuracy tolerance of +/-5%, at the end of the forecasting period or anytime between the
issuing date and the end of the forecasting period, respectively for our δ2 and δ4 metrics.
We break down the analysis at three levels: the “Absolute” test measures the number of
accurate forecasts by one analyst over the total number of reports issued; “RelativeIN”
measures the ratio of accurate forecasts issued by one analyst over the total number of
forecasts issued by the same analyst; “RelativeHits” measures the ratio of accurate
forecasts by one analyst over the total number of accurate forecasts issued by any
analyst.
TABLE 7 HERE
Results reported in Table 7 show a surprisingly limited prediction ability by
analysts: only 23.05% of issued targets in our sample are eventually met by the
underlying share price, when looking at the δ2 metric; adopting the δ4 metric this number
drops to a tiny 12.06%. Looking at the RelativeIN variable, some firms seem to be
performing better than others. Yet, when we look at the normalized RelativeHits figure
this apparent superiority unravels: correlation between the two variables is negative and
large across the two metrics, suggesting that a good internal performance is not a signal
of general superior ability. Interpretation may more easily be that performing (and
eventually publishing) less research drives smaller prediction errors. This phenomenon
seem to contradict standard learning curve theory predictions. We try to further check
this surprising evidence by testing the relation between research intensity measured as

23
the absolute number of reports published by firm i on all companies and the magnitude
and sign of prediction errors for the δ2 and δ4 average error measures. We model our test
with in the following functional form:
Yi,j = α + β i,j N° reportj + εi,j
where Yi,j are the yearly averages of prediction errors for each firm i and j= (δ2;δ4)
indicates the type prediction error.
TABLE 8 HERE
Regressions results are reported in Table 8. IS errors (δ2) are reported in column
one, FS errors (δ4) in column two. Significance is high for both regression (F=22.192
and 192.122, one-tailed p<0.01) and coefficients and results indicate that a higher
degree of research activity is associated with larger prediction errors. This result
confirms the surprising intuition of the analysis reported in Table 7: there seem to be no
learning curve in the analysts’ target price forecasting activity. A possible interpretation
is that adopting as the independent variable the ‘overall coverage’ measure (i.e. total
reports published by one form over total amount of report published) leads to biased
results. Standard learning curve theory suggests that a deeper coverage of one specific
company should be negatively correlated with the size of prediction errors: the greater
the knowledge of a company’s activity the better the ability to correctly estimate value.
With respect to our analysis, this could yield to a double-signed relationship: positive
correlation between errors and absolute coverage by each firm (due to a “skills
dispersion” effect) and negative correlation between prediction errors and relative
coverage by each firm (due to a “knowledge effect”). Yet, unreported results fail to
confirm this interpretation, not showing evidence that a measure of relative coverage
has a negative effect on the size of prediction error. Furthermore, results significance is
extremely low. We therefore interpret these results as a confirmation of our strategic
behaviour hypothesis: if a firm cannot avoid to publish its research (thus preventing it

24
from exploiting private information), then it has an incentive in overshooting in order to
maximize the price effect associated with the publication of research.
If such a strategic behaviour exists and is reflected in increasing inaccuracy in
the volume of reports published, we should also expect to observe dispersion of ex-ante
implicit returns to be increasing in the amount of research published. The following test
aims at cross-checking the previous results by regressing implicit returns volatility
measured as standard deviation of the TP/P variable research intensity calculated as the
absolute amount of reports published by each bank.
Yi= α + β i N° report + εi
where Yi= standard deviation of TP/P for firm i.
Regression results reported in column three of Table 8 indicate that a lower
amount of reports is associated with a lower variance in Target Prices implicit returns as
expected. Signs are positive as expected and significance is large at 1% level.
Evidence then shows that when research is scarce, analyses are more
conservative, while, conversely, an increasing number of reports is associated with
larger prediction errors and greater dispersion of forecasts. These results seem to
support the strategic use of reports hypothesis: the scattered publication of a few reports
has, in fact, less chances of influencing market price. On the other hand, continuous
coverage and reiteration of extreme valuations can build more confidence on one firm’s
ability thus driving investor behaviour.
VII. What determines forecasts accuracy?
A. Recommendation classes and revisions
Brav and Lehavy (2003) showed that the informativeness of qualitative
recommendation is different among recommendation class. We test this effect relating
the predictive power of target prices to the relative recommendation class and
controlling for target price implicit return. Our goal is to understand whether accuracy is
affected more by qualitative valuations as recommendations or by the point measure of

25
expected return (or loss) expressed by the Target Price. The test regression takes the
following form:
Yi,j = α+ βi,j,1TP/Pi +βi,j,2 Strong buy + βi,j,3Buy + βi,j,4Sell + βi,j,5Strong sell + εi,j
where Yi,j are the yearly prediction errors for each firm i and j= (δ2;δ4), TP/Pi represents
the implicit return expressed by target price at the time of report publication and the
recommendation variables (Strongbuy; Buy; Sell; StrongSell) are dummies taking a
value of 1 if the Target Price is associated with a specific recommendation and 0
otherwise. Overall significance for regressions is high (F=682.548 and 161.284, one-
tailed p<0.01) with an adjusted R2 for the δ2 regression of 35.3% and 14.1% for the δ4
regression. Results show that the largest effect on accuracy is given by the implicit
return associated with each target price (0.541, t=39.271, one-tailed p<0.01): the greater
is the return and the smaller is accuracy. Since we measure the prediction errors a
positive sign indicates overshooting by the analyst. Furthermore, the more extreme is
the recommendation class and the larger is the effect on accuracy. These results are
consistent with Bradshaw and Brown (2005) which also documented a large and
negative effect of target price implicit returns on analysts accuracy, although adopting a
simpler metric.
TABLE 10 HERE
Francis and Soffer (1997) and Brav and Lehavy (2003) documented that
recommendation revisions have a non negligible effect on market abnormal returns. If
the market reacts to revisions, we should also expect prediction errors to be affected by
the evolution of judgment by analysts. To test target price sensitivity to
recommendation revisions, we regress prediction errors on two dummy variables
indicating whether a recommendation is an upgrade or a downgrade of previous
research on the same company by the same firm, controlling for target prices implicit

26
returns. The ‘reitaration’ class is excluded and captured by the intercept. The regression
takes the following form
Yi,j = α+ βi,j,1TP/Pi +βi,j,2 Upgrade + βi,j,3 Downgrade + εi,j
where Yi,j are the yearly are the prediction errors for each firm i and j= (δ2;δ4).
Regressions are significant (F=249.41 and 129.85, one tailed p<0.01) with
adjusted R2 of 12.8% and 8.6% for the δ2 and δ4 variables respectively. As expected the
implicit return coefficient is positive and highly significant indicating that a large part of
every target price forecast is systematically not met by eventual market prices. This
result holds for both variables with similar significance. More interestingly, we
document that recommendation revisions (on both sides, i.e. up and down) have a small
positive impact on accuracy. We interpret this result as a consequence of the consistent
overshooting by analysts: since an overwhelming majority of reports largely overshoots
target prices and most revisions are to nearest recommendation class, a recommendation
upgrade or downgrade strengthens the analyst indication expressed by the target price
delivering a valuable additional information to investors. Yet, regression coefficient are
small and non-significant for the second accuracy variable, thus making the absolute
value of this additional piece of information limited.
TABLE 11 HERE
B. Market factors
Investors are generally more attracted by large, high growth, highly liquid
stocks. To control for whether this attention is reflected in a different degree of
predictive power by analyst recommendation we run the following regressions:
δ2i = α + βMV+ γVOL + δMIB_30 + ηCOV.RATIO+ θMKT_INDX+φ TPt0/Pt0+ εi
δ4i = α + βMV+ γVOL + δMIB_30 + ηCOV.RATIO+ θMKT_INDX+φ TPt0/Pt0+ εi
where:

27
MV: company market value
VOL: volume of share transaction in the recommendation issuing day
MIB_30: dummy variable with value of 1 if company is included in MIB30 index
(index of 30 most capitalized Italian companies), 0 otherwise
COV.RATIO: number of reports issued on company i divided by total reports
considered
MKT_INDEX: market momentum variable given by (relative level of the market index
at any report issue date, divided by the average index value between 2000 and 2003.
TPt0/Pt0: target price issued on company divided by price at date issuing
TABLE 12 HERE
Results, are statistically highly significant and confirm the predicted signs, but
for the “MV” variable which appears to be somehow inconclusive across the two
regressions. Table 12 column one reports results for δ2. As expected, higher trading
volumes as well as inclusion in the stock market index (MIB_30) are associated with
higher prediction errors.
Market momentum (MKT_INDEX) influences prediction errors with the
expected sign but its magnitude is somehow small. Coverage ratio affects positively
analyst performance, i.e. reduces prediction errors, suggesting that a learning effect
exists and analysts seem to be increasingly accurate in the amount of research published
on one firm. Alternative explanations could also be given by the “herding” behaviour
documented by Welch (2000) and Barucci et al. (2003), which shows that analysts
concentrate not only on publication dates but also show increasingly converging
estimates the larger the volume of research published. Finally, the size of the expected
implicit return explains a large part of the prediction errors suggesting that overshooting
is a consistent and repeated phenomenon in the research industry.
Not surprisingly, results reported in Table 12 column two, for the δ4 variable are
aligned with previous analysis. The greatest change in parameters is in the market index

28
level variable which is consistent with previous evidence on the magnitude of prediction
errors.
Unreported graphical analysis of regression residuals doesn’t provide any
indication of a misspecification, thus further confirming the conclusions drawn from
previous results.
C. Recommendation class breakdown
Data and analysis’ results, seem to suggest that prediction errors are not
uniformly distributed across recommendation classes. This hypothesis seem to fit our
“strategic behaviour” model: if a change is needed for, say, rebalancing portfolios, then
it is reasonable to assume a recommendation to be issued as an upgrade (or downgrade)
to higher(lower) classes and with increasing expected implicit returns.
To test this implication we have run the multivariate regressions and the industry
and firms regression on two different sample groupings. We first sort recommendations
into three classes (Strong buy/buy), (Hold), (Sell, Strong Sell) to understand whether
positive, neutral or negative expectations have any differential effect on prediction
errors. We then constructed a second grouping criteria based on the prediction errors
realized sign, i.e. δi>0 and δi<0: since a positive sign in prediction errors represents
overshooting, we expect, consistently with our “strategic behaviour” hypothesis, results
to be more significant for positive prediction.
Results are presented in Table 12 and confirm our predictions: at any level of
breakdown, reports’ prediction errors are increasing in the recommendation class and
are strongly, positively correlated with the sign of the prediction errors. Regressions
results are stronger (F tests are all significant with one tailed p<0.01) and R2 generally
increase. Inspecting the ‘StrongBuy-Buy’ class we observe that significance results are
aligned with those of the general regression presented in Table 11 which is consistent
with the distribution of reports across classes presented in Table 2 Panel B. In particular
the VOL and MKT_INDEX variable are not significant. Differently, the same
parameters for the ‘Hold’ and ‘StrongSell-Sell’ classes show a high statistical
significance ((0.134, t=6.881, p<0.01 and -0.212, t=-5.403, p<0.01) suggesting that
accuracy for positive recommendation classes is not influenced by market movements.

29
Furthermore, ‘hold’ recommendation forecasts are generally upward biased and the size
of the prediction error is positively correlated with market momentum while negative
recommendation predictions are more accurate the stronger the market level. Implicit
return plays the largest role in driving accuracy across all recommendation classes and
also when breaking down the sample for error sign. The latter analysis show that when
target prices are conservative, the relative level of the market index plays a different
role in determining the absolute level of accuracy: the parameter is negative and
significant for both the accuracy metrics.
TABLE 12 HERE
VIII. Conclusions and future research agenda
Using a large and uniquely developed database of analyst recommendations
issued on companies listed on the Italian Stock Exchange, we examined the
effectiveness of target prices published in research reports to anticipate future market
prices efficiently. We expected target prices to be consistently biased predictions for a
number of reasons: first, publishing research is costly and means disclosing information
that is typically sold at a premium. Compulsory free publication, as mandated by Italian
law, results in a loss of value for firms which have an incentive to either publish less or
try to avoid compulsory publication by issuing research from overseas offices which fall
out of the scope of the law. Second, target prices have been shown to have a consistent
and significant short-term effect on market prices: since research issuers also have a
large equity stake invested and research needs to be compulsory shared with the market,
when a recommendation is issued, the target price effect on market prices is anticipated
by analysts by overshooting extreme recommendations. Consistent with our predictions,
we find that many firms apparently try to avoid publishing and that research intensity is
associated with increasing prediction errors. Prediction errors are large and statistically
significant, ranging from a minimum of 4% for the ‘sell’ recommendation class to
46.81% and 31.98% for the ‘strong buy’ and the ‘buy’ recommendation classes. We

30
also document a significant positive relationship between prediction errors and the ex-
ante implicit return expressed by target prices which suggests that strategic
overshooting may be playing a role in target price issuing.
We further argue that, since big investors have sizeable positions in large, highly
traded, high growth stocks, strategic report publication will result in prediction errors to
be positively related to some explanatory variables like: Market capitalization, Inclusion
in the Stock Market Index, Trading Volume and Size. Regressions results confirm our
hypotheses both in sign and significance suggesting that, indeed research activity
outputs are largely flawed and uninformative. Given the uniqueness of the Italian
regulation and the resulting database we have collected, we believe our analysis to be a
starting point for future research which will be addressing questions like: What is the
cross-section of firms’ predictive power? Are valuation techniques adopted by analysts
a driver in minimizing prediction errors? What is the effectiveness of target prices
issued by foreign firms and not disclosed according to the legal requirement? What is
the relationship between target price update and market price evolution: are target prices
lagged, are they “chasing” stock market prices or are they effectively anticipating a
price pattern? What is the relationship between prediction errors and firms’
”affiliation”? Are investors learning from analysts errors? IUs an investment strategy
based on Target Price forecasts profitable? We believe these to be interesting questions
for future research.

31
REFERENCES
Abdel-khalik R., Aijnkya B., Returns to informational advantages: the case of analysts’
forecast revisions, Accounting Review, 1982
Asquith, P., Mikhail M., Au A. Information Content of Equity Analyst Reports, Journal
of Financial Economics, Vol. 75, February 2005, Pages 245-282.
Barber B., Lehavy R., McNichols M., Trueman B., Can investor profit from the
prophets? Security analyst recommendations and stock returns, The Journal of Finance
2001.
Barucci E., Bianchi C., Passaporti A., Comportamenti imitativi tra gli analisti finanziari
nel mercato finanziario Italiano, Working Paper, 2003.
Barucci E., Bianchi C., Mancini S., L’effetto degli studi degli analisti finanziari sulle
serie storiche dei prezzi e dei volumi, Working Paper, 2003.
Belcredi M., Bozzi S., Rigamonti S., The impact of research reports on stock prices in
Italy, Working Paper, 2003.
Beneish M., Stock price and the dissemination of analyst recommendations, Journal of
Business, 1991.
Bernhardt D., Campello M., Kutsoati E., Analyst Compensation and Forecast Bias,
Working Paper No. 99-09, Tufts University, 2004.
Bernhardt D., Campello M., Kutsoati E., Who Herds, Journal of Financial Economics,
2005
Bjerring, J.H. – Lakonishok, J. – Vermaelen, T. Stock Prices and Financial Analysts’
Recommendations, Journal of Finance, 1983.
Bradshaw M., The use of target price to justify sell-side analyst’ stock
recommendations, Accounting Horizon, 2002.
Bradshaw M., Brown L., An examination of sell-side analysts’ abilities to predict target
prices, Unpublished Working Paper, Harvard University, 2002.
Brav A., Lehavy., An empirical analysis of analysts’ target prices: short term
informativeness and long term dynamics, The Journal of Finance, 2003.
Brown, L., Mohd, E., The Predictive Value of Analyst Characteristics, Journal of
Accounting, Auditing and Finance, 2003.

32
Cervellati E.M, Della Bina A.C.F., Analisti finanziari: conflitti di interesse o eccessivo
ottimismo. Evidenza empirica dal mercato italiano delle IPO, Banca, Impresa e Società.
XXIII, n. 2, pp.367-399, 2004.
Cooper, R.A., Day T.E., Lewis C.M., Following the leader: a study of individual
analysts’ earnings forecasts, Journal of Financial Economics, Vol. 61, 2001
Eakins S., Stansell S., Wertheim P., Institutional portfolio composition: an examination
of the prudent investment hypothesis, The Quarterly Review of Economics and Finance,
1997.
Elton E., Gruber M., Grossman S., Discrete Expectational data portfolio performance,
The Journal of Finance, 1986.
Falkenstein E., Preferences for stock characteristics as revealed by mutual fund
portfolio holdings, The Journal of Finance, 1996.
Francis J., Soffer L., The relative informativeness of analyst’ stock recommendations
and earning forecast revisions, Journal of Accounting Research, 1997.
Jegadeesh N., Kim J., Krische S., Lee C., Analizing the analysts: when do
recommendations add value?, The Journal of Finance, 2004.
Lloyd Davies P., Canes M., Stock price and the publication of second-hand information,
Journal of Business, 1978.
Lys T., Sohn S., The association between revisions of financial analysts’ earnings
forecasts and security-price changes, Journal of Accounting Economics, 1990.
Liu P., Smith S., Syed A., Stock price reaction to Wall Street Journal’s securities
recommendations, Journal of Financial and Quantitative Analysis, 1990.
Michaely R., Womack K., Conflict of Interest and Credibility of Underwriter Analyst
Recommendations, The Review of Financial Studies, 1999.
Stickel S.S., Scott E., Predicting individual analyst earning forecasts, Journal of
Accounting Research, 1990
Stickel, S., Reputation and Performance Among Security Analysts, Journal of Finance
47, 1811-1836, 1992.
Stickel, S.S., Reputation and Performance Among Security Analysts, The Journal of
Finance, 1995.
Welch I., Herding among security analysts, Journal of Financial Economics, 2000

33
Womack K., Do Brokerage analysts’ Recommendations Have Investment Value?, The
Journal of Finance, 1996.

34
Company Industry Company Industry
Aedes Financials 9 (0.13%) Gewiss General Industries 12 (0.17%)
Alitalia Cyclical services 26 (0.37%) Gruppo Coin Cyclical services 76 (1.08%)
Alleanza Financials 130 (1.85%) Gr. E. L'espresso Cyclical services 125 (1.78%)
Amga Utilities 33 (0.47%) Ifil General Industries 20 (0.28%)
Autogrill Cyclical services 128 (1.82%) Irce General Industries 13 (0.19%)
Autostrada To-Mi Cyclical services 36 (0.51%) It Holding Cycl. cons. goods 33 (0.47%)
Autostrade Cyclical services 170 (2.42%) Italcementi Basic Industries 105 (1.49%)
Banca Carige Financials 6 (0.09%) Italmobiliare Basic Industries 17 (0.24%)
Banca Fideuram Financials 107 (1.52%) Jolly Hotels Cyclical services 8 (0.11%)
Banca Intesa Financials 184 (2.62%) La Doria Non-Cycl. cons. goods 23 (0.33%)
Banca Lombarda Financials 37 (0.53%) Marcolin Cycl. cons. goods 10 (0.14%)
Banca Mps Financials 118 (1.68%) Marzotto Cycl. cons. goods 127 (1.81%)
Bnl Financials 143 (2.03%) Mediaset Cyclical services 219 (3.11%)
Bca.Ppo.Etruria Financials 7 (0.10%) Mediobanca Financials 13 (0.19%)
Bca.Ppo.Intra Financials 14 (0.20%) Mediolanum Financials 136 (1.93%)
Bca.Ppo.Lodi Financials 23 (0.33%) Merloni Cycl. cons. goods 74 (1.05%)
Bca.Ppo.Milano Financials 73 (1.04%) Milano Assic. Financials 20 (0.28%)
Benetton Cycl. cons. goods 172 (2.45%) Mirato Non-Cycl. cons. goods 37 (0.53%)
Beni Stabili Financials 58 (0.82%) Mondadori Ed Cyclical services 141 (2.00%)
Bonif.Ferraresi Non-Cycl. cons. goods 4 (0.06%) Navig. Montanari Cyclical services 18 (0.26%)
Brembo Cycl. cons. goods 87 (1.24%) Parmalat Non-Cycl. cons. goods 147 (2.09%)
Bulgari Cycl. cons. goods 218 (3.10%) Permasteelisa Basic Industries 55 (0.78%)
Buzzi Unicem Basic Industries 102 (1.45%) Pininfarina Cycl. cons. goods 43 (0.61%)
Capitalia Financials 109 (1.55%) Pirelli General Industries 146 (2.08%)
Carraro Cycl. Cons. goods 18 (0.26%) Poligrafici Ed. Cyclical services 13 (0.19%)
Cembre General Industries 13 (0.19%) Ras Financials 135 (1.92%)
Cementir Basic Industries 26 (0.37%) Rcs Mediagroup Cyclical services 68 (0.97%)
Class Editori Cyclical services 50 (0.71%) Recordati Non-Cycl. cons. goods 108 (1.54%)
Credito Emiliano Financials 61 (0.87%) Reno De Medici Basic Industries 20 (0.28%)
Cdt.Valtellines Financials 2 (0.03%) Rich. Ginori Basic Industries 12 (0.17%)
Cremonini Non-Cycl. cons. goods 57 (0.81%) Risanamento Financials 3 (0.04%)
Crespi Basic Industries 2 (0.03%) Sabaf General Industries 42 (0.60%)
Csp Intern. Cycl. cons. goods 13 (0.19%) Saes Getters General Industries 53 (0.75%)
Danieli General Industries 4 (0.06%) Saipem Resources 124 (1.76%)
Ducati Motor Hold. Cycl. cons. goods 92 (1.31%) San Paolo Imi Financials 168 (2.39%)
Edison Utilities 39 (0.55%) Sirti Information Technology 10 (0.14%)
Enel Utilities 210 (2.99%) Snai Cyclical services 10 (0.14%)
Enertad Cyclical services 7 (0.10%) Snia Ord Non-Cycl. cons. goods 55 (0.78%)
Eni Resources 225 (3.20%) Sogefi Cycl. cons. goods 23 (0.33%)
Erg Resources 106 (1.51%) Sol Basic Industries 10 (0.14%)
Ergo Previd. Financials 41 (0.58%) Stefanel Cycl. cons. goods 12 (0.17%)
Ericsson Information Technology 10 (0.14%) Stm Information Technology 97 (1.38%)
Fiat Cycl. cons. goods 204 (2.90%) Targetti General Industries 28 (0.40%)
Fin Part Cycl. cons. goods 5 (0.07%) Telecom Italia Non-cyclical services 219 (3.11%)
Finecogroup Financials 91 (1.29%) Telecom It. M. Information Technology 151 (2.15%)
Finmeccanica General Industries 116 (1.65%) Tim Non-cyclical services 233 (3.31%)
Fondiaria-Sai Financials 57 (0.81%) Trevi General Industries 17 (0.24%)
Gabetti Financials 6 (0.09%) Unicredito Financials 161 (2.29%)
Generali Financials 166 (2.36%) Unipol Financials 31 (0.44%)
Mean number or reports 71.8
Median 46.5
Standard deviation 66.1
Report N. and %
TABLE 1 PANEL A
Descriptive statistic of companies
Report N. and %
The table shows descriptive statistics for the 7036 report issued on 98 companies included in the sample. Companies industry classification is based on
FTSE classification at level 3. Report N° is the number of reports included in the final sample.

35
Industry Reports Companies Mean coverage
Basic Industries 349 9 39
Cycl. Cons. Goods 1131 15 75
Cyclical services 1095 15 73
Financials 2109 29 73
General Industries 464 11 42
Information Technology 268 4 67
Non Cycl. cons. Goods 431 7 62
Non Cyclical services 452 2 226
Resources 455 3 152
Utilities 282 3 94
703,6
9,8
Financials
Financials
Average number of report per industry
Average number of companies per industry
Most represented Industry by number of report
Most represented Industry by number of companies
TABLE 1 PANEL B
Summary statistics of reports by industry
This table presents reports’ descriptive statistics of the final sample sorted by industry
distribution. Mean coverage is the arithmetic mean coverage.

36
Month
January 322 (4,58%) 43 (4,36%) 100 (5,62%) 43 (2,31%) 136 (5,65%)
February 565 (8,03%) 93 (9,42%) 128 (7,20%) 107 (5,74%) 237 (9,85%)
March 706 (10,03%) 1593 (22,64%) 104 (10,54%) 233 (13,10%) 77 (4,13%) 292 (12,14%)
April 406 (5,77%) 48 (4,86%) 132 (7,42%) 77 (4,13%) 149 (6,20%)
May 864 (12,28%) 152 (15,40%) 221 (12,42%) 156 (8,36%) 335 (13,93%)
June 328 (4,66%) 1598 (22,71%) 3191 (45,35%) 39 (3,95%) 83 (4,67%) 95 (5,09%) 111 (4,62%)
July 594 (8,44%) 64 (6,48%) 139 (7,81%) 212 (11,37%) 179 (7,44%)
August 372 (5,29%) 38 (3,85%) 88 (4,95%) 135 (7,24%) 111 (4,62%)
September 985 (14,00%) 1951 (27,73%) 130 (13,17%) 278 (15,63%) 310 (16,62%) 267 (11,10%)
October 565 (8,03%) 78 (7,90%) 167 (9,39%) 163 (8,74%) 157 (6,53%)
November 998 (14,18%) 126 (12,77%) 160 (8,99%) 373 (20,00%) 339 (14,10%)
December 331 (4,70%) 1894 (26,92%) 3845 (54,65%) 72 (7,29%) 50 (2,81%) 117 (6,27%) 92 (3,83%)
Total 7036 (100,00%) 7036 (100,00%) 7036 (100,00%) 987 (100,00%) 1779 (100,00%) 1865 (100,00%) 2405 (100,00%)
2003
TABLE 2 PANEL A
Yearly and monthly report distribution
2000 2001 2002Monthly Quarterly Semester
We report research distribution breakdown by months., quarters, half-year and years. Reports considered are all the reports included in the final
database. The first three columns report absolute and percentage report distribution broken down by month, quarter and semester over the total
number of reports issued in the four years sampling period. Columns four, five, six and seven report absolute distribution for each year. Percentages
report the relative number of reports issued each month over the total number of reports issued the relevant year.

37
Strong buy 1075 (15,28%) 254 (25,73%) 327 (18,38%) 255 (13,67%) 239 (9,94%)
Buy 2803 (39,84%) 421 (42,65%) 644 (36,20%) 740 (39,68%) 998 (41,50%)
Hold 2430 (34,54%) 259 (26,24%) 618 (34,74%) 662 (35,50%) 891 (37,05%)
Sell 694 (9,86%) 51 (5,17%) 173 (9,72%) 204 (10,94%) 266 (11,06%)
Strong sell 34 (0,48%) 2 (0,20%) 17 (0,96%) 4 (0,21%) 11 (0,46%)
TOTAL 7036 (100,00%) 987 (100,00%) 1779 (100,00%) 1865 (100,00%) 2405 (100,00%)
2003
TABLE 2 PANEL B
Reports annual distribution per recommendation class
TOTAL 2000 2001 2002
This table shows total recommendations’ distribution and yearly recommendations’ distribution. The first column reports absolute and
percentage report distribution per recommendation class over the total number of reports issued. Columns two, three four and five report
absolute distribution for each year. Percentages report the relative number of reports issued per recommendation class over the total number
of reports issued each year.

38
Adopted Scale
Buy Buy Strong buy Strong buy
Outperform Accumulate/Add Buy Buy
Market perform Neutral/Hold Hold Hold
Underperform Reduce Sell Sell
Sell Sell Strong Sell Strong Sell
Original Scale Adopted Scale
(Tp-p)/p>0.2 Strong buy
Buy
(Tp-p)/p<0.2 Buy
Hold Hold
(Tp-p)/p<-0.2 Sell
Sell
(Tp-p)/p>-0.2 Strong Sell
Stock recommendation conversion scale
TABLE 3
Original Scale
FIVE STEPS SCALE CONVERSION CRITERION
THREE-STEPS SCALE CONVERSION CRITERION
We illustrate conversion criteria adopted for the database. If a recommendation has been issued according to a five-
steps scale conversion has been performed by the upper table conversion rule. If recommendation adopted a three-
step scale, conversion followed the rule presented in the lower table

39
FROM
Strong buy 567 (61,50%) 241 (26,14%) 96 (10,41%) 18 (1,95%) 0 (0,00%) 922 (100,00%)
Buy 182 (8,18%) 1574 (70,71%) 385 (17,30%) 85 (3,82%) 0 (0,00%) 2226 (100,00%)
Hold 56 (2,98%) 294 (15,66%) 1371 (73,04%) 152 (8,10%) 4 (0,21%) 1877 (100,00%)
Sell 7 (1,43%) 46 (9,41%) 115 (23,52%) 315 (64,42%) 6 (1,23%) 489 (100,00%)
Strong sell 0 (0,00%) 0 (0,00%) 1 (3,70%) 8 (29,63%) 18 (66,67%) 27 (100,00%)
TOTAL 812 2155 1968 578 28 5541 (100,00%)
Stock recommendations transition matrix
TABLE 4
TO
TOTALStrong sellSellHoldBuyStrong buy
We present the absolute and relative stock recommendation transitions. For each initial recommendation class (FROM), we identified
the revised recommendation (TO). Figures are then calculated as the ratio between the number of reports revised in the new
recommendation class (TO) over the total number of reports of the initial recommendation class (FROM).

40
FIGURE 1
Accuracy metrics
Time
Pri
ce
TP
Price at report
issuance
Report issue date
XXXXEnd of time horizon
δ1
δ2
δ3
δ4
MaxPrice
We graphically present the four accuracy measures we developed in this paper. δ1 is defined as the ‘Ideal
Strategy’ (IS) control variable which calculates the ideal return as the difference between the
maximum/minimum price over the time horizon and the issue date share price. δ2 measures the IS prediction
error for any report as the difference between the issued target price at t0 and the maximum/(minimum)
market price in the relevant prediction time-horizon. δ3 is the second control variable measuring the ‘Feasible
Strategy’ (FS) return as the difference between the price at the end of the time horizon and the report’s issue
date share price. δ4 measures the FS prediction error for any report as the difference between the issued target
price and the stock market price at the end of the investment time-horizon.

41
TP
(+)
Pmax/t+1
(-)TP
Time
TP
(-)
Pmin/t+1
(+)
TP
δ 2 ;δ 4
FIGURE 2
Variables' construction and sign interpretation
Strong Buy; B
uy; Positiv
e
Hold.
Strong Sell; S
ell; Negativ
e
Hold.
1max/
1max/
+
+−
t
t
P
PTP
1min/
1min/
+
+ −
t
t
P
TPP
Variables are constructed as follows: if TP is greater than market price at t0 (top side of the graph), a positive sign for variables δ2 δ4 means that TP has proved to be greater
than the realized market price at the end of the time horizon. We name this event as "overshooting". A negative sign means that the realized market price has exceeded the
issued TP: we define this recommendation to be "conservative". For the bottom part of the graph (when TP is lower than current market price at t0), overshooting occurs when
we obtain a positive sign i.e.when the issued TP is lower than the realzied market price.

42
[TPt0/Pt0]-1 [TPt1/TPt0]-1 δ1 δ2 δ3 δ4
Strong buy
Mean 38,18% 1,23% 14,43% 22,39% -0,26% 46,81%
Median 46,25% 0,00% 19,52% 32,68% -0,71% 37,42%
Std. Dev. 22,03% 20,92% 17,63% 20,89% 22,89% 46,55%
Max 247,49% 127,27% 156,92% 115,38% 132,43% 488,52%
Min -1,11% -89,29% 0,00% -51,46% -79,51% -46,34%
N° of obser. 1064 798
Buy
Mean 22,63% -0,70% 12,65% 10,09% -1,61% 31,98%
Median 28,45% 0,00% 16,30% 18,18% -0,36% 22,68%
Std. Dev. 15,05% 19,76% 15,91% 15,93% 21,13% 42,59%
Max 236,08% 166,67% 233,00% 198,53% 142,46% 462,43%
Min -38,27% -77,54% -36,47% -97,99% -77,32% -49,24%
N° of obser. 2595 1980
Hold
Mean 7,52% -6,31% 9,69% -0,63% -4,53% 18,67%
Median 6,25% 0,00% 6,43% -0,53% -2,18% 11,34%
Std. Dev. 15,64% 22,36% 15,97% 17,50% 21,72% 43,26%
Max 180,00% 179,17% 98,34% 146,36% 96,52% 460,98%
Min -48,85% -85,78% -59,93% -99,51% -79,62% -173,90%
N° of obser. 2050 1618
Sell
Mean -10,21% -13,50% -15,62% -12,78% -5,09% 4,08%
Median -1,91% -8,24% -3,32% -2,28% -4,17% 9,20%
Std. Dev. 14,93% 26,53% 18,28% 36,74% 21,72% 32,69%
Max 52,49% 126,67% 57,61% 48,05% 83,45% 79,42%
Min -63,33% -87,83% -84,02% -218,58% -74,49% -178,40%
N° of obser. 568 463
Strong Sell
Mean -31,22% -17,17% -16,85% 9,77% -8,88% 17,06%
Median -11,37% -11,35% -4,93% 18,77% -1,48% 17,31%
Std. Dev. 20,69% 31,59% 18,91% 41,93% 19,92% 33,07%
Max 1,15% 76,00% 0,00% 61,31% 14,05% 66,91%
Min -67,06% -71,88% -75,59% -123,21% -71,61% -57,62%
N° of obser. 32 28 32 26
Reports accuracy summary statistics
TABLE 5
2050 1547
568 391
1064 913
2595 1990
This table shows summary statistics for implicit returns, target price revisions and accuracy
metrics. In columns 1 we report predicted implicit returns computed as the difference between
target price and the market price at the issue date. In Column 2 we report the quantitative change
in Target Price revisions measured as the percentage difference between a target price and its
closest revision. Columns 3 and 4 report figures for the ‘Ideal Strategy’ (IS) accuracy control
metric and variable respectively. Columns 5 and 6 report figures for the ‘Feasible Strategy’ (FS)
accuracy control metric and variable respectively

43
Firm Nationality Firm Nationality
Abaxbank D 24 (0.34%) DKW F 124 (1.76%)
ABN AMRO F 95 (1.35%) Eptasim D 135 (1.92%)
Actinvest D 263 (3.74%) Euromobiliare D 614 (8.73%)
Axia D 1 (0.01%) Fortis bank F 24 (0.34%)
Banca Aletti D 9 (0.13%) Gestnord D 2 (0.03%)
Banca Finnat D 7 (0.10%) Goldman Sachs F 72 (1.02%)
Banca Leonardo D 281 (4.00%) Ideaglobal D 140 (1.99%)
Banca Mediosim D 5 (0.07%) IMI D 405 (5.76%)
Banca Sella D 7 (0.10%) ING F 39 (0.55%)
Banknord D 7 (0.10%) Intermonte D 815 (11.59%)
Bipielle/Santander D 119 (1.69%) Intesa D 338 (4.81%)
BNP Paribas F 121 (1.72%) JP Morgan F 3 (0.04%)
Borsaconsult D 2 (0.03%) Julius Baer F 187 (2.66%)
BP Bari D 6 (0.09%) Lehman brothers F 92 (1.31%)
BPM D 258 (3.67%) M. Mortari D 58 (0.82%)
Cazenove F 5 (0.07%) Mediobanca D 229 (3.26%)
Centrosim D 198 (2.82%) Merrill Lynch F 325 (4.62%)
Cheuvreux F 194 (2.76%) Metzler F 19 (0.27%)
Citigroup F 19 (0.27%) Rasfin D 171 (2.43%)
Cofiri D 41 (0.58%) SG F 133 (1.89%)
Consors D 31 (0.44%) UBM D 500 (7.11%)
Credit Lyonnais F 40 (0.57%) UBS F 304 (4.32%)
CSFB F 90 (1.28%) Uniprof D 29 (0.41%)
Deutsche bank D 455 (6.47%)
5150 (73.19%)
Total Foreign Firms (F) 1886 (26.81%)
Mean number of reports (full sample) 150
Median number of reports (full sample) 92
Max 815
Min 1
Total Domestic Firms (D)
Report N. and %
TABLE 6 PANEL A
Descriptive statistic of firms
Report N. and %
This table shows summary statistics for the 47 firms included in the sample and the absolute and relative number of report
issued by these firms. We classify firms into two groups Domestic (D) and Foreign (F), assuming a firm to be foreign if its
headquarter is not incorporated in Italy and it does not have a research team in Italy.

44
Firm Amount Frequency Report frequency Nationality
Top 50% Unicredito Italiano 20172,61 10,62% 7,11% D
Gruppo Intesa 18014,68 9,48% 4,81% D
JP Morgan 17765,84 9,35% 0,04% F
Banca IMI 14724,33 7,75% 5,76% D
Morgan Stanley 14372,8 7,56% 0,00% F
Lehman Brothers 14090,46 7,42% 1,31% F
Cumulated 99140,72 52,18% 19,03%
Cumulated Domestic 27,85% 17,68%
Cumulated Foreign 24,33% 1,35%
Top 80% Mediobanca 11320,24 5,96% 3,26% D
Merrill Lynch & Co 10490,79 5,52% 4,62% F
Citigroup 8048,09 4,24% 0,27% F
Deutsche Bank AG 6909,38 3,64% 6,47% D
Goldman Sachs & Co 5542,97 2,92% 1,02% F
UBS 5383,58 2,83% 4,32% F
BNP Paribas Group 4852,11 2,55% 1,72% F
Cumulated 151687,88 79,83% 40,71%
Cumulated Domestic 41,68% 27,41%
Cumulated Foreign 38,15% 13,30%
Top 90% Credit Suisse First Boston 4219,29 2,22% 1,28% F
ABN Amro Bank NV 4010,13 2,11% 1,35% F
MPS Finance BM 2566,49 1,35% 11,91% D
Banca di Roma 2103,64 1,11% 0,58% D
Abaxbank 1779,39 0,94% 0,34% D
HSBC 1755,21 0,92% 0,00% F
Banca Nazionale del Lavoro 1569,65 0,83% 0,00% D
Credit Agricole Indosuez 1535,78 0,81% 2,76% F
Cumulated 171227,46 90,11% 58,93%
Cumulated Domestic 45,90% 40,25%
Cumulated Foreign 44,22% 17,34%
Research intensity and nationality
TABLE 6 PANEL B
This table reports for each bank the million dollar amount of underwritten securities (equity, debt, equity-linked) on the
italian market between 1/1/2000 and 31/12/2003, and the relative frequency of research issued by the underwriter (report
frequency) measured as the amount of report issued by the underwriter divided by the total amount of report issued by all
researchfirms. Firms are sorted into Domestic and Foreign according to the nation of incorporation of the headquarter and
the existance of a research team based in Italy.

45
Research intensity and market activism
FIGURE 3
This figure exhibits the cumulative amount of research issued by firms paired with the same firms' level of investment
activity measured as the dollar value of securities underwritten in the 2000-2003 time horizon. We sort data by three cutoffs:
Top 50% compares the amount of research issued by firms representing 50% of the total underwriting in the time horizon;
Top 80% and Top 90% are analogously defined.
0,00%
10,00%
20,00%
30,00%
40,00%
50,00%
60,00%
70,00%
80,00%
90,00%
100,00%
Un
der
wri
tin
g
Rep
ort
Fre
qu
ency
Un
der
wri
tin
g
Rep
ort
Fre
qu
ency
Un
der
wri
tin
g
Rep
ort
Fre
qu
ency
Top 50% Top 80% Top 90%
Cu
mu
late
d u
nd
erw
riti
ng
Cumulated
Cumulated Domestic
Cumulated Foreign

46
Company Absolute RelativeIN Relative Hits Absolute RelativeIN Relative Hits
Abaxbank 0,11% 31,82% 0,49% 0,08% 30,77% 0,68%
ABN AMRO 0,27% 23,94% 1,18% 0,08% 9,76% 0,68%
Actinvest 1,04% 26,64% 4,53% 0,41% 10,64% 3,42%
Banca Aletti 0,02% 16,67% 0,07% - - -
Banca Finnat 0,02% 14,29% 0,07% - - -
Banca Leonardo 1,06% 23,57% 4,60% 0,68% 13,81% 5,65%
Banca Sella 0,06% 57,14% 0,28% - - -
Bipielle/Santander 0,30% 16,24% 1,32% 0,10% 6,49% 0,86%
BNP Paribas 0,50% 26,27% 2,16% 0,25% 14,46% 2,05%
BP Bari 0,02% 50,00% 0,07% - - -
BPM 0,95% 26,34% 4,11% 0,37% 10,91% 3,08%
Centrosim 0,48% 20,41% 2,09% 0,23% 10,58% 1,88%
Cheuvreux 0,63% 21,43% 2,72% 0,23% 8,73% 1,88%
Citigroup 0,05% 15,79% 0,21% 0,02% 33,33% 0,17%
Cofiri 0,22% 36,84% 0,97% 0,06% 12,00% 0,51%
Consors 0,14% 29,03% 0,63% - - -
Credit Lyonnais 0,10% 16,67% 0,42% 0,02% 6,25% 0,17%
CSFB 0,47% 34,94% 2,02% 0,19% 17,65% 1,54%
Deutsche bank 1,27% 21,88% 5,50% 0,91% 14,24% 7,53%
DKW 0,37% 23,96% 1,60% 0,10% 7,46% 0,86%
Eptasim 0,39% 18,90% 1,67% 0,17% 9,09% 1,37%
Euromobiliare 1,75% 18,08% 7,59% 1,01% 9,11% 8,39%
Fortis bank 0,13% 33,33% 0,56% 0,02% 7,69% 0,17%
Gestnord 0,02% 50,00% 0,07% - - -
Goldman Sachs 0,06% 15,38% 0,28% 0,04% 16,67% 0,34%
Ideaglobal 0,75% 34,81% 3,27% 0,39% 21,11% 3,25%
IMI 1,20% 23,01% 5,22% 0,68% 12,55% 5,65%
ING 0,16% 25,64% 0,70% 0,08% 12,50% 0,68%
Intermonte 3,07% 23,61% 13,30% 2,23% 14,79% 18,49%
Intesa 1,03% 21,19% 4,46% 0,50% 9,96% 4,11%
JP Morgan 0,02% 50,00% 0,07% - - -
Julius Baer 0,72% 25,14% 3,13% 0,23% 9,48% 1,88%
Lehman brothers 0,24% 16,48% 1,04% 0,25% 17,14% 2,05%
M. Mortari 0,24% 27,78% 1,04% 0,14% 16,28% 1,20%
Mediobanca 0,91% 28,08% 3,97% 0,50% 16,00% 4,11%
Merrill Lynch 0,72% 21,74% 3,13% 0,33% 9,64% 2,74%
Metzler 0,03% 14,29% 0,14% - - -
Rasfin 0,45% 18,18% 1,95% 0,12% 6,00% 1,03%
SG 0,30% 18,45% 1,32% 0,12% 9,38% 1,03%
UBM 1,65% 23,90% 7,17% 0,76% 9,97% 6,34%
UBS 1,04% 21,74% 4,53% 0,72% 14,17% 5,99%
Uniprof 0,08% 55,56% 0,35% 0,02% 50,00% 0,17%
Overall Accuracy 23,05% 12,06%
Mean 0,55% 26,65% 2,38% 0,35% 14,08% 2,94%
Median 0,34% 23,75% 1,46% 0,23% 11,45% 1,88%
Correlation In-Hits -22,41% -10,74%
δ4 Accuracy δ2 Accuracy
Table 7
Analysts comparative accuracy
We show descriptive statistics of the accuracy of target price predictions. A target price is considered to be accurate if the
underlying share price reaches the target price (with an accuracy tolerance of +/-5%) at the end of the forecasting period (δ4) or
anytime between the issuing date and the end of the forecasting period (δ2). RelativeIN is the ratio of accurate reports over total
reports issued by the bank; Absolute accuracy is the ratio between accurate reports over total reports issued by all banks; Relative
Hits is the ratio between accurate reports over total accurate reports issued by all banks. Missing data are due to lack of stock
market data on the last issued report.

47
Dependent Variable Coefficient T-stat Coefficient T-stat Coefficient T-stat
Intercept -0.005 -0.573 0.027*** 5,975 0.167 12.974
N° report 0.579 *** 4.711 0,910 *** 13,854 0.320** 2.192
Adj R2
0.320 0.823 0.081
Std. Error of Estimate 0.047 0.021 0.064
F-Statistic 22.192*** 191.922*** 4.807**
TABLE 8
δ2 δ4 Implicit return volatility
Accuracy and research intensity
We test the effect of research intensity on analysts' accuracy. Column 1 and 2 show estimates obtained by regressing
each firm yearly average δ2 and δ4 accuracy measure on the total amount of reports published by the firm in every
sample year. Column 3 shows estimates obtained by regressing the average volatility of implicit returns (TPt0 / Pt0)
embedded in target prices issued by each firm on the number of reports published by each bank. Significance at
10%,5% and 1% level is denoted by *,**,*** respectively.

48
Dependent Variable Coefficient T-stat Coefficient T-stat
Intercept -0.588*** -38.30 -0.559*** -14.184
TP/P 0.541*** 39.271 0.691*** 19.632
Strong buy 0.064*** 7.957 0.070*** 3.427
Buy 0.025*** 4.345 0.300** 2.035
Sell -0.026*** -2.938 -0.023 -0.947
strong sell 0.314*** 9.582 0.240*** 2.903
Adj R2
0.353 0.141
Std. Error of Estimate 0.181 0.412
F-Statistic (Significance Level) 682.548*** 161.284***
TABLE 9
Accuracy measures and recommendation classes
δ2 δ4
This table provides evidence on the effect on prediction errors of each recommendation class controlling for the
Implicit return effect. We regress δ2 and δ4 on 4 dummy variables representing the recommendation classes
'Strong Buy, 'Buy', 'Sell', 'Strong Sell' and on one variable representing the implicit return (TPt0/Pt0) expressed by
target price at the time of report publication. We exclude the “hold” class which is our control class. Significance
at 10%,5% and 1% level is denoted by *,**,*** respectively.

49
Dependent Variable Coefficient T-stat Coefficient T-stat
Intercept -0.490*** -20.962 -0.628*** -13.144
TP/P 0.504*** 26.078 0.764*** 19.540
Upgrade -0.027** -2.177 -0.027 -1.059
Downgrade -0.035*** -3.038 0.026 1.121
Adj R2
0.128 0.086
Std. Error of Estimate 0.296 0.545
F-Statistic (Significance Level) 249.41*** 129.85***
TABLE 10
Accuracy measures and recommendation revisions
δ2 δ4
In this table we test the effect on accurcay by recommendation revisions controlling for the implicit return effect.
We regress δ2 and δ4 on 2 dummy variables representing the recommendation revision types 'upgrade' and
'downgrade' and on one variable representing the implicit return (TPt0/Pt0) expressed by target price at the time of
report publication. We exclude the 'reiteration' class which is our control class. Significance at 10%,5% and 1%
level is denoted by *,**,*** respectively.

50
Dependent Variable Coefficient T-stat Coefficient T-stat
Intercept -0.640*** -36.042 -0.858*** -18.886
MV 0.070*** 4877 -0.060*** -3.238
VOL 0.004 0.302 0.039** 2.456
MIB30 0.025* 1.751 0.090*** 5.024
COV: RATIO -0.047*** -3.169 -0.034* -1.810
MKT_INDEX 0.006 0.559 0.122*** 8982
TPt0/Pt0 0.580*** 55.681 0.380*** 28.381
Adj R2
0.342 0.157
Std. Error of Estimate 0.183 0.410
F-Statistic (Significance Level) 533.032*** 149.731***
TABLE 11
Accuracy and market factors
δ2 δ4
This table provides results from regressing δ2 and δ4 errors on 6 variables related to: company status, market
momentum and research intensity. Regressors interpretation goes as follows: company market value (MV) is
measured at each report issuing date as the stock market capitalization in million euro,volume of share transaction
(VOL) is calculated at each recommendation issuing day as the average turnaround volume measured in million
euro; inclusion in the stock market index (MIB30) is treated as a dummy variable taking a value of 1 if, at the
report issue date, the company is included in the index; research intensity (COV: RATIO) is measured by the
company coverage ratio given by the number of reports issued on company i divided by total number of reports
issued, market momentum (MKT_INDEX) is measured as the relative level of the market index at any report
issuing date, divided by the average index value between 2000 and 2003; expected implicit return is measured as
the ratio between the target price and the share market price at t0 (TPt0/Pt0). Significance at 10%,5% and 1% level
is denoted by *,**,*** respectively.

51
Dependent Variable Coefficient T-stat Coefficient T-stat Coefficient T-stat Coefficient T-stat Coefficient T-stat
Intercept -0.754*** -38.358 -0.759*** -25.229 0.900*** 7.863 -0.272*** -20.451 -0.491*** -10.164
MV 0.119*** 7.188 0.039 1.488 0.062 1.061 0.039** 2.265 0.109*** 3.430
VOL 0.006 0.421 0.012 0.515 -0.033 -0.616 0.016 1.195 0.008 0.285
MIB30 0.047*** 2.822 0.055** 2.255 -0.153*** 2.914 0.060*** 3.642 -0.073** -2.335
COV: RATIO 0.068*** -3.900 -0.053** -2.116 0.125** 2.362 -0.080*** -4.501 0.050* 1.654
MKT_INDEX 0.005 0.393 0.134*** 6.881 -0.212*** -5.403 -0.011 -0.866 -0.079*** -3.245
TPt0/Pt0 0.711*** 59.399 0.545*** 28.739 -0.326*** -8.221 0.593*** 49.215 0.233*** 9.774
Adj R2
0.506 0.053 0.141 0.359 0.073
Std. Error of Estimate 0.130 0.168 0.346 0.120 0.211
F-Statistic (Significance Level) 610.566*** 19.639*** 17.285*** 418.524*** 22.881***
Dependent Variable Coefficient T-stat Coefficient T-stat Coefficient T-stat Coefficient T-stat Coefficient T-stat
Intercept -0.938*** -13.386 -0.966*** 10.075 0.707*** 5.749 -0.628*** -13.021 -0.419*** -5.599
MV -0.053** -2.160 -0.062** -1.811 -0.016 -0.226 -0.099*** -4.786 0.064 1.369
VOL 0.072** 3.497 -0.023 -0.762 -0.034 -0.515 0.047*** 2.634 -0.029 -0.726
MIB30 0.095** 3.962 0.110*** 3.495 -0.011 -0.167 0.097*** 4.803 0.024 0.535
COV: RATIO -0.062 -2.424 -0.006 -0.177 0.080 1.208 -0.043** -2.026 0.049 1.131
MKT_INDEX 0.169*** 9.594 0.108*** 4.265 -0.277*** -5.668 0.181*** 12-062 -0.246*** -6.871
TPt0/Pt0 0.338*** 19.158 0.319*** 12.923 -0.154*** -3.171 0.300*** 20.166 0.255*** 7.379
Adj R2
0.144 0.104 0.096 0.124 0.126
Std. Error of Estimate 0.412 0.412 0.312 0.397 0.219
F-Statistic (Significance Level) 80.973*** 30.361*** 8.305*** 95.834*** 19.425***
TABLE 12
Partial prediction error regression
PANEL A
(StrongSell-Sell) δ2>0 δ2<0(StrongBuy-Buy) (Hold)
PANEL B
(StrongBuy-Buy) (Hold) (StrongSell-Sell) δ4>0 δ4<0
This table provides results from regressing δ2 and δ4 partial errors previously sorted by 3 stock recommendations groups: Strong buy-Buy, Hold, Sell-Strong Sell and by 2 groups of sign of errors: positive δ2 ,δ 4
and negative δ2,δ4. Regressors are calculated as follows: company market value (MV) is measured at each report issuing date as the stock market capitalization in million euro,volume of share transaction
(VOL) is calculated at each recommendation issue date as the average turnaround volume measured in million euro; inclusion in the stock market index (MIB30) is treated as a dummy variable taking a value
of 1 if, at the report issue date, the company is included in the index; research intensity (COV: RATIO) is measured by the company coverage ratio given by the number of reports issued on company i divided
by total number of reports issued, market momentum (MKT_INDEX) is measured as the relative level of the market index at any report issuing date, divided by the average index value between 2000 and
2003; expected implicit return is measured as the ratio between the target price and the share market price at t0 (TPt0/Pt0). Panel A and B reports results for the δ2 and δ4 accuracy metric respectively.
Significance at 10%,5% and 1% level is denoted by *,**,*** respectively.