target corporation - climate change 2020
TRANSCRIPT

Target Corporation - Climate Change 2020
C0. Introduction
C0.1
(C0.1) Give a general description and introduction to your organization.
Minneapolis-based Target Corporation (NYSE:TGT) serves guests at 1,868 stores and via Target.com. Since 1946, Target has given 5 percent of its profit to communities. For more information about Target’s commitment to corporate responsibility, visit https://corporate.target.com/corporate-responsibility/.
CDP system functionality only allows for 365 days to be reflected in the start and end date fields below. The results contained in this CDP survey are for Target's fiscal year2019 (Feb. 3, 2019 through Feb. 1, 2020), which consisted of only 364 days.
Target considers multiple factors in evaluating risk. Target considers risks substantive when they are assessed to be high or critical using proprietary criteria. Importantly,something that has a "substantive financial or strategic impact on our business" is not necessarily "material" to investors as defined by the SEC.
Target’s answers to this questionnaire contain forward-looking statements, which are based on our current assumptions and expectations. These statements are typicallyaccompanied by the words "expect," "may," "could," "believe," "would," "might," "anticipates," or similar words. All such forward-looking statements are intended to enjoy theprotection of the safe harbor for forward-looking statements contained in the Private Securities Litigation Reform Act of 1995, as amended. Although we believe there is areasonable basis for the forward-looking statements, our actual results could be materially different. The most important factors which could cause our actual results to differfrom our forward-looking statements are set forth in our description of risk factors in Item 1A of our Form 10-K for the fiscal year ended February 1, 2020, which should beread in conjunction with the forward-looking statements in this report. Forward-looking statements speak only as of the date they are made, and we do not undertake anyobligation to update any forward-looking statement.
C0.2
(C0.2) State the start and end date of the year for which you are reporting data.
Start date End date Indicate if you are providing emissions data for past reportingyears
Select the number of past reporting years you will be providing emissions datafor
Reportingyear
February 32019
February 22020
No <Not Applicable>
C0.3
(C0.3) Select the countries/areas for which you will be supplying data.United States of America
C0.4
(C0.4) Select the currency used for all financial information disclosed throughout your response.USD
C0.5
(C0.5) Select the option that describes the reporting boundary for which climate-related impacts on your business are being reported. Note that this option shouldalign with your chosen approach for consolidating your GHG inventory.Operational control
C1. Governance
C1.1
CDP Page of 521

(C1.1) Is there board-level oversight of climate-related issues within your organization?Yes
C1.1a
(C1.1a) Identify the position(s) (do not include any names) of the individual(s) on the board with responsibility for climate-related issues.
Position ofindividual(s)
Please explain
Board-levelcommittee
Target's Board of Directors retains oversight responsibility over the Corporation's key strategic risks including those relating to corporate responsibility matters. The Nominating and GovernanceCommittee of the Board of Directors has overall oversight responsibility over corporate responsibility matters. Target recognizes that environmental, social and governance issues are of increasingimportance to many investors. The Vice President of Corporate Responsibility (CR) and the CR team work with functional leaders across the company to determine strategies, policies, and goalsrelated to sustainability and regularly report to and seek input from the Nominating and Governance Committee on those matters, including climate-related issues.
C1.1b
(C1.1b) Provide further details on the board’s oversight of climate-related issues.
Frequency withwhich climate-related issuesare a scheduledagenda item
Governancemechanisms intowhich climate-related issuesare integrated
Scope ofboard-leveloversight
Please explain
Scheduled – somemeetings
Reviewing andguiding strategyReviewing andguiding majorplans of actionReviewing andguiding riskmanagementpoliciesMonitoringimplementationand performanceof objectives
<NotApplicable>
The Board of Directors’ review of environmental and social topics is obtained through the updates it receives from the Nominating and Governance Committee.The Nominating and Governance Committee reviews environmental and social topics at least semi-annually. This happens independently of our financialreporting process, which includes economic topics, and is overseen throughout the year by the Audit and Finance Committee, which provides regular reports tothe Board of Directors. Target’s Vice President of Corporate Responsibility presents to the Nominating and Governance Committee semi-annually on corporateresponsibility related topics.
C1.2
(C1.2) Provide the highest management-level position(s) or committee(s) with responsibility for climate-related issues.
Name of the position(s) and/or committee(s) Reportingline
Responsibility Coverage ofresponsibility
Frequency of reporting to the board on climate-related issues
Other, please specify (VP Corporate Responsibility) <NotApplicable>
Both assessing and managing climate-related risks andopportunities
<Not Applicable> Half-yearly
Other, please specify (VP Property Management) <NotApplicable>
Both assessing and managing climate-related risks andopportunities
<Not Applicable> Half-yearly
Other, please specify (VP Responsible Sourcing &Sustainability)
<NotApplicable>
Both assessing and managing climate-related risks andopportunities
<Not Applicable> Half-yearly
C1.2a
CDP Page of 522

(C1.2a) Describe where in the organizational structure this/these position(s) and/or committees lie, what their associated responsibilities are, and how climate-related issues are monitored (do not include the names of individuals).
The Vice President of Corporate Responsibility oversees Corporate Responsibility initiatives across the enterprise. They report to the Executive Vice President and ChiefMarketing Officer at Target. The Corporate Responsibility (CR) team moved within the marketing pyramid back in 2017. This move has allowed the Corporate Responsibilityteam to engage directly with marketing and communications partners to help amplify the goals and key milestones of CR and Target's climate work. Within CR, the BusinessIntegration team engages directly with partners from across the enterprise to help drive and incorporate our key enterprise initiatives like climate into the core business.Specifically, our climate account manager within the Business Integration team works with a number of partners from Responsible Sourcing & Sustainability team and theEnergy team within Property Management to help coordinate and strategize on work. This climate account manager also leads the coordination and strategy behind ourclimate goals in tandem with business teams such as, Properties and Responsible Sourcing & Sustainability.
The Vice President of Property Management oversees the Property and Energy Management across Target. They report to the Senior Vice President of Properties at Target.The Property and Energy Management teams conduct critical work around our waste minimization efforts, store HVAC efficiencies, EV charging stations, and lead the workaround procuring renewable energy sources. The Property and Energy Management teams also drive a majority of the strategy behind our Scope 1 and 2 goals inconjunction with the Business Integration team within CR. On a bi-annual basis the Vice President of Property Management brings together their team along with other criticalpartners like Responsible Sourcing & Sustainability and CR to review progress on goals and understand key milestones.
The Vice President of Responsible Sourcing & Sustainability oversees our global commitment to manufacture our goods and services in a responsible and sustainablemanner. The Vice President of Responsible Sourcing & Sustainability reports to our SVP & President of Owned Brand Sourcing. Our Responsible Sourcing & Sustainabilityteam leads our Scope 3 climate commitment specifically, around the purchased goods and services category and inclusive of the strategy and implementation of our supplierfocused climate goal. Our supplier engagement initiatives that are tied to our climate goal are focused on engaging and helping our top 80% of suppliers by spend set theirown Scope 1 and 2 emission reduction targets. The Responsible Sourcing & Sustainability team also leads our supplier and factory engagements to drive more sustainableoperations via transparency and improved operational efficiencies. Key efforts of Responsible Sourcing & Sustainability include: manufacturing performance improvementprograms, training of suppliers on our energy and climate goals, as well as factory compliance audits across our global supply chain. These initiatives ladder up to our energyand climate goals within the Owned Brand Sourcing and Development team objectives and our overarching science-based emission reduction targets.
C1.3
(C1.3) Do you provide incentives for the management of climate-related issues, including the attainment of targets?
Provide incentives for the management of climate-related issues Comment
Row 1 Yes
C1.3a
(C1.3a) Provide further details on the incentives provided for the management of climate-related issues (do not include the names of individuals).
Entitled to incentive Type ofincentive
Activityinventivized
Comment
Energy manager Monetaryreward
Emissionsreduction projectEnergy reductionprojectEfficiency target
Progress toward Target's carbon reduction goal is included in applicable individuals' Goals and Objectives. Performance against these Goals andObjectives is a key factor in annual performance reviews and compensation adjustments.
Environment/Sustainabilitymanager
Monetaryreward
Emissionsreduction projectEmissionsreduction targetEnergy reductionprojectEnergy reductiontargetEfficiency targetSupply chainengagement
Progress toward the carbon reduction goal is included in individual Goals and Objectives; performance against Goals and Objectives is a key factor inannual performance reviews and compensation adjustments.
C2. Risks and opportunities
C2.1
(C2.1) Does your organization have a process for identifying, assessing, and responding to climate-related risks and opportunities?Yes
C2.1a
CDP Page of 523

(C2.1a) How does your organization define short-, medium- and long-term time horizons?
From (years) To (years) Comment
Short-term 0 5
Medium-term 5 10
Long-term 10 20
C2.1b
(C2.1b) How does your organization define substantive financial or strategic impact on your business?
Target considers multiple factors in evaluating risk. Target considers risks substantive when they are assessed to be high or critical using proprietary criteria. Importantly,something that has a "substantive financial or strategic impact on our business" is not necessarily "material" to investors as defined by the SEC.
Target’s answers to this questionnaire contain forward-looking statements, which are based on our current assumptions and expectations. These statements are typicallyaccompanied by the words "expect," "may," "could," "believe," "would," "might," "anticipates," or similar words. All such forward-looking statements are intended to enjoy theprotection of the safe harbor for forward-looking statements contained in the Private Securities Litigation Reform Act of 1995, as amended. Although we believe there is areasonable basis for the forward-looking statements, our actual results could be materially different. The most important factors which could cause our actual results to differfrom our forward-looking statements are set forth in our description of risk factors in Item 1A of our Form 10-K for the fiscal year ended February 1, 2020, which should beread in conjunction with the forward-looking statements in this report. Forward-looking statements speak only as of the date they are made, and we do not undertake anyobligation to update any forward-looking statement.
C2.2
(C2.2) Describe your process(es) for identifying, assessing and responding to climate-related risks and opportunities.
Value chain stage(s) coveredDirect operationsUpstreamDownstream
Risk management processA specific climate-related risk management process
Frequency of assessmentAnnually
Time horizon(s) coveredShort-termMedium-termLong-term
Description of processIn 2017, we introduced a new climate policy and goals, based on the latest climate science. We have set goals to reduce our greenhouse gas footprint, and continue towork with our industry partners, policymakers and other stakeholders to accelerate the transition to a low-carbon economy. While we are implementing projects in ourowned brand manufacturing facilities that will result in the avoidance of Scope 3 emissions, in 2019, we also developed and received approval on our Scope 3 goal. Thisapproved Scope 3 goal, coupled with our Scope 1 and 2 goal, will fulfill our commitment to the Science-Based Targets initiative. This initiative provides guidance for andchampions science-based target setting as a powerful way of boosting companies’ competitive advantage in the transition to the low-carbon economy. In December 2019,Supply Chain Dive awarded Target the 2019 Sustainability Plan of the Year, in recognition of our leadership in setting carbon-reduction goals for the entire supply chain. Wewill continue to evaluate both our climate risk mitigation plans & related goals and also look to the future as we build our climate resilience business plans, based on TCFDclimate risk findings and as we fulfill our commitment to the Science Based Targets initiative.
C2.2a
CDP Page of 524

(C2.2a) Which risk types are considered in your organization's climate-related risk assessments?
Relevance&inclusion
Please explain
Currentregulation
Relevant,alwaysincluded
Target operates in 50 states and the District of Columbia. As an end user of energy, we pay for existing renewable energy standard and carbon regulation policies that are implementedthrough regulated utility programs. Current regulations are the foundation of IEA’s WEO Current Policies Scenario, which was included in our scenario analysis.
Emergingregulation
Relevant,alwaysincluded
Target is tracking carbon regulation and related energy policy proposals at the U.S. federal and state levels. As a large consumer of energy, we evaluate how these proposals may impactenergy pricing, both negatively and positively. Emerging regulations are a key component of IEA’s WEO Sustainable Development Scenario, which was included in our scenario analysis.We looked at emerging regulation both in the near term and long term to help identify climate-related risks.
Technology Relevant,alwaysincluded
As a retailer, Target plays a key role in the roll out of potential carbon reducing consumer projects such as smart thermostats, efficient lighting, and other types of products. Target is alsoinstalling direct current (DC) fast electric vehicle charging stations at 100 sites by 2020. Target believes the retail sector can play a key role in developing the electric vehicle infrastructureneeded to transition the transportation sector to run on clean energy. Included in the pathways we used in our scenario analysis is an analysis of the various kinds of technology that will beneeded to achieve the end results. E.g. for IEA’s WEO Sustainable Development Scenario, various technologies are analyzed and assumed to be implemented in order to achieve 2degrees or lower of average temperature increase. The implications of these technologies on society, i.e. the cost to implement and changes in energy prices, is considered. Target alsoexamined technologies that may become more prevalent as climate change progresses, e.g. window air conditioners and fans in areas that are expected to see a high rise in averagetemperatures. These are areas that present an opportunity to Target to meet the increase in demand.
Legal Notrelevant,explanationprovided
Included in the scenario analysis was an examination of legal-related risks. However, it was found at this time that although Target is subject to regulatory and policy-related risks, Targetdoes not have strictly legal-related climate risks.
Market Relevant,alwaysincluded
We aim to leverage our size, scale and reach to positively impact the communities in which we serve and operate. Going beyond what we can achieve in our own operations and with oursuppliers, we collaborate with NGOs, governments, industry organizations and other businesses to innovate solutions to the most pressing issues we face today. Examining market riskswas a large part of the scenario analysis. We analyzed how the market would play out in different climate scenarios, e.g. the cost of energy (oil, natural gas, electricity) as well as how theoverall economy would react to climate change in the long-term. Through this process we were able to identify market-related climate risks.
Reputation Relevant,alwaysincluded
Since the company's formation in 1962 Target has invested in the communities we operated in and serve. Target's corporate responsibility team evaluates how our climate mitigationgoals, policy, and resiliency efforts impact our standing with local communities where we operate, with our NGO stakeholders and partners, and with third party industry analysts. Target'sexisting climate policy and goals are designed to set a leadership example within the retail industry and are accompanied by internal execution strategies and management plans to holdour team accountable to meeting the goals and maintaining our credible reputation in this space. Target commits to publicly reporting annually on our goal progress. Target understandsthat falling short of what climate science says is needed to mitigate the worst of the warming scenarios will damage our reputation. Reputational risks were considered in the scenarioanalysis from both a consumer standpoint and investor standpoint. Target identified both reputational risks and opportunities associated with climate change.
Acutephysical
Relevant,alwaysincluded
Target operates in many communities impacted by extreme weather events. In the past few years Target has experienced facility damages from extreme weather events such asHurricanes Harvey, Irma, and Maria, and wildfires across California. Repairing damaged stores and other facilities has direct costs to Target. Acute physical risks played a large role in thescenario analysis, as Target is already prone to climate-related acute weather events. As described above, Target has already experienced financial damage from weather-related events.
Chronicphysical
Relevant,alwaysincluded
Rising temperatures require longer run times on HVAC equipment in impacted stores. Longer HVAC run times incur additional energy costs to Target. Chronic physical risks played a largerole in the scenario analysis, as it is very likely that chronic risks associated with climate change will impact Target.
C2.3
(C2.3) Have you identified any inherent climate-related risks with the potential to have a substantive financial or strategic impact on your business?Yes
C2.3a
(C2.3a) Provide details of risks identified with the potential to have a substantive financial or strategic impact on your business.
IdentifierRisk 1
Where in the value chain does the risk driver occur?Upstream
Risk type & Primary climate-related risk driver
Market Uncertainty in market signals
Primary potential financial impactIncreased indirect (operating) costs
Climate risk type mapped to traditional financial services industry risk classification<Not Applicable>
Company-specific descriptionChanging prices for electricity and other fuels could significantly impact Target’s business. For example, higher fuel costs will lead to higher logistics costs. With almost2,000 stores in the US and nearly 40 distribution centers, Target relies heavily on a complex supply chain and logistics network. An increase in higher fuel costs will lead toa higher logistics cost for Target. Both the IEA WEO 2018 and the EIA Outlook 2019 project increases in fossil fuels costs under the BAU scenario through 2040. The 2025global oil price is projected at $101/ barrel and the 2025 US oil price is projected at $80/ barrel. The 2040 global oil price is projected at $137/ barrel and the 2040 US oilprice is projected at $105/ barrel.
Time horizonLong-term
LikelihoodVery likely
Magnitude of impactHigh
Are you able to provide a potential financial impact figure?
CDP Page of 525

Yes, an estimated range
Potential financial impact figure (currency)<Not Applicable>
Potential financial impact figure – minimum (currency)200000000
Potential financial impact figure – maximum (currency)300000000
Explanation of financial impact figureBy 2040, the cost of diesel used in heavy-duty trucks is expected to increase by roughly 75% compared to 2018. If this increase in fuel cost is passed down to Target fromits logistics suppliers, the potential financial impact could be $200,000,000 to $300,000,000 USD/year by 2040.
Cost of response to risk0
Description of response and explanation of cost calculationWe work closely with suppliers to determine the best ship points and delivery routes to reduce the number of transportation miles and to mitigate risk associated withtransportation of merchandise. We apply careful research and sophisticated optimization technology to choose the most efficient combination of transportation methods tocarry each shipment throughout our supply chain and continue to improve loading practices and efficiencies at our regional distribution centers.
Comment
IdentifierRisk 2
Where in the value chain does the risk driver occur?Upstream
Risk type & Primary climate-related risk driver
Emerging regulation Mandates on and regulation of existing products and services
Primary potential financial impactIncreased indirect (operating) costs
Climate risk type mapped to traditional financial services industry risk classification<Not Applicable>
Company-specific descriptionFederal, state or local efforts to regulate fuel-efficiency would impact Target’s business most significantly through changing prices for transportation costs. Although Targetmoves most of its merchandise via third-party transportation providers, domestic low-carbon fuel standards, fuel-economy requirements, equipment retrofit and otherrequirements impact our business associates. For example, increased logistics costs can arise from more stringent fuel-economy requirements. With almost 2,000 stores inthe US and nearly 40 distribution centers, Target relies heavily on a complex supply chain and logistics network. An increase in cost to operate logistics due to moreexpensive/higher upfront cost high efficiency trucks may lead to a higher logistics cost for Target. According to the EIA Outlook 2019, the steepest forecasted decline in theUS in energy intensity will occur in the transportation sector, with the level of energy used per highway vehicle-mile traveled declining by 32% from 2018 to 2050 as a resultof increasingly stringent fuel economy and energy efficiency standards for light- and heavy-duty vehicles. Policy developments in this space will increase transportationcosts to Target: California’s Zero-Emission Vehicle regulation, which nine additional states have adopted, requires a minimum percentage of vehicle sales of BEV andPHEV. In 2025, the year the regulation and new federal fuel economy standards go into full effect, projected sales of BEV and PHEV reach 1.3 million, or about 8% ofprojected total vehicle sales in the BAU case.
Time horizonLong-term
LikelihoodVery likely
Magnitude of impactHigh
Are you able to provide a potential financial impact figure?No, we do not have this figure
Potential financial impact figure (currency)<Not Applicable>
Potential financial impact figure – minimum (currency)<Not Applicable>
Potential financial impact figure – maximum (currency)<Not Applicable>
Explanation of financial impact figure
Cost of response to risk
Description of response and explanation of cost calculationWe work closely with suppliers to determine the best ship points and delivery routes to reduce the number of transportation miles and to mitigate risk associated withtransportation of merchandise. We apply careful research and sophisticated optimization technology to choose the most efficient combination of transportation methods tocarry each shipment throughout our supply chain and continue to improve loading practices and efficiencies at our regional distribution centers.
CommentThe financial impact of policy standards is difficult to quantify. We work with our third-party transportation and supply chain companies to understand changing operatingcosts in different manufacturing regions.
Identifier
CDP Page of 526

IdentifierRisk 3
Where in the value chain does the risk driver occur?Direct operations
Risk type & Primary climate-related risk driver
Technology Substitution of existing products and services with lower emissions options
Primary potential financial impactIncreased capital expenditures
Climate risk type mapped to traditional financial services industry risk classification<Not Applicable>
Company-specific descriptionWe aim to build and remodel intentional spaces that are designed with our long-term impact on the environment in mind. Target has built an energy efficient portfolio ofstores by continuously adopting new technologies and operating procedures. Building and equipment codes will continue to evolve toward higher efficiency and moresustainable operational models, which will lead to increased capital costs for new and existing stores. For example, increased CAPEX tied to local renewable energyrequirements and increased energy efficiency requirements will factor into future building decision-making.
Time horizonShort-term
LikelihoodVery likely
Magnitude of impactHigh
Are you able to provide a potential financial impact figure?Yes, an estimated range
Potential financial impact figure (currency)<Not Applicable>
Potential financial impact figure – minimum (currency)40000000
Potential financial impact figure – maximum (currency)60000000
Explanation of financial impact figureBy the end of this year Target will remodel more than 1,000 stores across the country. Target continues to open new stores, many of which will be part of existing buildingstock and in urban locations. Both projects require investments to comply with current and evolving energy efficiency codes. Code compliance is a requirement and Target'sinvestments in energy efficiency projects produce financial value to the company. Target also partners with utility energy efficiency programs, where available, to maximizethe impact and value of the company's energy efficiency projects. Our investments in both energy efficiency and renewable energy have positive paybacks and are a directfinancial benefit. Over the last seven years, we have invested over $290 million dollars in energy efficiency projects, many of which have a payback of fewer than threeyears.
Cost of response to risk0
Description of response and explanation of cost calculationWe believe that one way to address energy price risk is by making investments that will reduce our demand for high-carbon energy sources over time. Over the pastdecade, we made significant investments which reduced our energy-related expenditures on a pro-rata basis. We are working to reduce the carbon footprint of ourorganization through two primary means - energy efficiency and renewable energy; and will continue to do so to manage these risks. As a means to drive renewableenergy, we have installed solar energy systems at 516 locations across the U.S. At present, we are also exploring a number of ways to expand our renewable energyprograms as a key component of our carbon reduction strategy. These energy efficiency and renewable energy investments help us to mitigate the risk associated with thepotential for rising energy costs associated with increased legislation including a carbon tax, a cap and trade system, fuel taxes, and higher building efficiency standards.Target's Property Management teams partner on remodel and store design projects to meet energy codes and make smart efficiency investment decisions that go beyondcode where feasible. Target's Energy team works with internal asset teams and Target's electric utilities to maximize utility energy efficiency rebates where available.
CommentOur investments in both energy efficiency and renewable energy have positive paybacks and are a direct financial benefit. Over the last seven years, we have invested over$290 million dollars in energy efficiency projects, many of which have a payback of fewer than three years.
IdentifierRisk 4
Where in the value chain does the risk driver occur?Upstream
Risk type & Primary climate-related risk driver
Acute physical Increased severity and frequency of extreme weather events such as cyclones and floods
Primary potential financial impactDecreased revenues due to reduced production capacity
Climate risk type mapped to traditional financial services industry risk classification<Not Applicable>
Company-specific descriptionChanges in acute climate events will impact our suppliers and the products they provide. Increased flood occurrence can cause infrastructure damage, disrupt the supply
CDP Page of 527

chain and cause delays in distribution. Heat waves introduce negative impacts on livestock, leading to increase cost of beef and milk, e.g. higher cost to keep animals coolduring heat waves, reduced productivity in milking cows, livestock die offs, etc. Increased wildfire occurrence can cause infrastructure damage, disrupt the supply chain andcause delays in distribution.
Time horizonLong-term
LikelihoodVery likely
Magnitude of impactHigh
Are you able to provide a potential financial impact figure?No, we do not have this figure
Potential financial impact figure (currency)<Not Applicable>
Potential financial impact figure – minimum (currency)<Not Applicable>
Potential financial impact figure – maximum (currency)<Not Applicable>
Explanation of financial impact figureUncharacteristic or significant weather conditions can affect customer shopping patterns, particularly in apparel and seasonal items, which could lead to lost sales orgreater than expected markdowns. Natural disasters in states where our sales are concentrated could result in significant physical damage to our stores or distributioncenters, and cause delays in the distribution of merchandise, which could adversely affect our sales.
Cost of response to risk0
Description of response and explanation of cost calculationTarget monitors forecasts for extreme weather events and works with supply chain entities and store logistics teams to ensure necessity products (e.g. bottled water, non-perishable foods, baby supplies) are in stock for guests preparing for impending extreme weather events.
CommentUncharacteristic or significant weather conditions can affect consumer shopping patterns, particularly in apparel and seasonal items, which could lead to lost sales orgreater than expected markdowns and adversely affect our short-term results of operations. In addition, our three largest states by total sales are California, Texas andFlorida, areas where natural disasters are more prevalent. Natural disasters in those states or in other areas where our sales are concentrated could result in significantphysical damage to or closure of one or more of our stores, distribution centers or key suppliers, and cause delays in the distribution of merchandise from our suppliers toour distribution centers, stores, and guests, which could adversely affect our results of operations by increasing our costs and lowering our sales.
IdentifierRisk 5
Where in the value chain does the risk driver occur?Upstream
Risk type & Primary climate-related risk driver
Chronic physical Changes in precipitation patterns and extreme variability in weather patterns
Primary potential financial impactDecreased revenues due to reduced production capacity
Climate risk type mapped to traditional financial services industry risk classification<Not Applicable>
Company-specific descriptionChanges in chronic climate events will impact our suppliers and the products they provide. Increased frequency and length of droughts can cause infrastructure damage,disrupt the supply chain and cause delays in distribution. Water stress can lead to decreased agriculture production, leading to an increase in material cost such as cotton,and an increase in food and produce costs. Global sea-level rise can cause infrastructure damage, disrupt the supply chain and cause delays in distribution.
Time horizonLong-term
LikelihoodVery likely
Magnitude of impactHigh
Are you able to provide a potential financial impact figure?No, we do not have this figure
Potential financial impact figure (currency)<Not Applicable>
Potential financial impact figure – minimum (currency)<Not Applicable>
Potential financial impact figure – maximum (currency)<Not Applicable>
Explanation of financial impact figureUncharacteristic or significant weather conditions can affect customer shopping patterns, particularly in apparel and seasonal items, which could lead to lost sales or
CDP Page of 528

greater than expected markdowns. Natural disasters in states where our sales are concentrated could result in significant physical damage to our stores or distributioncenters, and cause delays in the distribution of merchandise, which could adversely affect our sales.
Cost of response to risk0
Description of response and explanation of cost calculationFor chronic local climate changes Target monitors guest shopping patterns at the macro level and assesses if changes in product assortments in apparel, home furnishing,grocery, and other product categories is needed as a result of chronic changing weather patterns.
CommentUncharacteristic or significant weather conditions can affect consumer shopping patterns, particularly in apparel and seasonal items, which could lead to lost sales orgreater than expected markdowns and adversely affect our short-term results of operations. In addition, our three largest states by total sales are California, Texas andFlorida, areas where natural disasters are more prevalent. Natural disasters in those states or in other areas where our sales are concentrated could result in significantphysical damage to or closure of one or more of our stores, distribution centers or key suppliers, and cause delays in the distribution of merchandise from our suppliers toour distribution centers, stores, and guests, which could adversely affect our results of operations by increasing our costs and lowering our sales.
IdentifierRisk 6
Where in the value chain does the risk driver occur?Downstream
Risk type & Primary climate-related risk driver
Reputation Shifts in consumer preferences
Primary potential financial impactDecreased revenues due to reduced demand for products and services
Climate risk type mapped to traditional financial services industry risk classification<Not Applicable>
Company-specific descriptionGuests' expectations could shift as a result of climate change – driving a need for new reputational leadership in the retail industry. Use of unsustainable materials (e.g.materials produced as a result of deforestation, materials that use a lot of water, etc.) in products could lead to losses in sales from reputational damage. Additional costscould relate to a decrease in share price or increased cost in restoring public relations.
Time horizonLong-term
LikelihoodMore likely than not
Magnitude of impactLow
Are you able to provide a potential financial impact figure?No, we do not have this figure
Potential financial impact figure (currency)<Not Applicable>
Potential financial impact figure – minimum (currency)<Not Applicable>
Potential financial impact figure – maximum (currency)<Not Applicable>
Explanation of financial impact figureGuests' preferences and expectations could shift as a result of climate change- driving a need for new merchandise offerings and base expectations of reputationalleadership in the retail industry. These types of incidents could have an adverse impact on perceptions and lead to tangible adverse effects on our business, includingconsumer boycotts and lost sales.
Cost of response to risk0
Description of response and explanation of cost calculationTarget is actively working on a number of projects to manage this risk and understand evolving guest attitudes and how our merchandise assortment meets those needs.For example, we have teams across the enterprise focused on understanding and improving attributes (including environmental) of our owned- and national-brand productassortment. This team is comprised of representatives from key departments within our merchandising, sourcing, and marketing divisions. The work of this team is helpingto inform and guide our merchandise strategy. In addition, the CR team works with hundreds of partners across the company to set goals, develop initiatives and monitorand report progress. LINK: https://corporate.target.com/_media/TargetCorp/csr/pdf/2019_corporate_responsibility_report.pdf Some of these goals include: By 2022, source100 percent sustainable cotton for owned-brand and exclusive national brand products; source all owned brand paper-based packaging from sustainably managed forestsby 2022; and in 2019, 45% of the palm oil covered by our commitment was certified via RSPO’s Mass Balance certification, 1% through Segregated certification, and theother 54% was covered by RSPO’s PalmTrace credits.
Comment
IdentifierRisk 7
Where in the value chain does the risk driver occur?Direct operations
Risk type & Primary climate-related risk driver
CDP Page of 529

Acute physical Increased severity and frequency of extreme weather events such as cyclones and floods
Primary potential financial impactIncreased capital expenditures
Climate risk type mapped to traditional financial services industry risk classification<Not Applicable>
Company-specific descriptionIncreased severity of extreme weather events may increase weather-related damage to Target stores and distribution centers, increasing Target's capital and insurancecosts. Increased flood occurrence can cause infrastructure damage of owned facilities, potential incurred costs for transporting workers post impacts, and temporaryclosures resulting in lost sales. Florida is a key market for Target. In this region, the combined effects of changing extreme rainfall events and sea level rise are alreadyincreasing flood frequencies, which impacts property values and infrastructure viability, particularly in coastal cities. Aqueduct shows that key locations for target are at riskfor flood occurrence: Miami, Minneapolis, Los Angeles (medium to high risk); Houston (high risk); Chicago (extremely high risk). Increased storms/ hurricane occurrencecan cause infrastructure damage of owned facilities, potential incurred costs for transporting workers post impacts, and temporary closures resulting in lost sales. Wildfirescould cause infrastructure damage of owned facilities, potential incurred costs for transporting workers post impacts, and temporary closures resulting in lost sales. Thecumulative forest area burned by wildfires has greatly increased between 1984 and 2015, with analyses estimating that the area burned by wildfire across the westernUnited States over that period was twice what would have burned had climate change not occurred. In Southwest (CA, AZ) Wildfire can threaten people and homes,particularly as building expands in fire-prone areas. Wildfires around Los Angeles from 1990 to 2009 caused $3.1 billion in total economic damages (unadjusted forinflation).
Time horizonLong-term
LikelihoodLikely
Magnitude of impactMedium-low
Are you able to provide a potential financial impact figure?Yes, an estimated range
Potential financial impact figure (currency)<Not Applicable>
Potential financial impact figure – minimum (currency)8000000
Potential financial impact figure – maximum (currency)55000000
Explanation of financial impact figureTarget tracks its costs in inventory and property damages from extreme weather events, such as hurricanes, lightning strikes, cyclones, rain and hail storms, wildfires,earthquakes, etc. Since 2011 through 2018, the cost to Target of inventory and property damage due weather-related events has been more than $170 million, with annuallosses ranging from about $8 million to about $55 million per year. The most significant costs have been the result of hurricanes, floods, and rain and hail storms. As thefrequency and severity of these types of extreme weather events are expected to increase in both the 2⁰C and 4⁰C scenarios, Target can expect that these costs willincrease over time.
Cost of response to risk
Description of response and explanation of cost calculationTarget monitors weather forecasts and works with store teams and Target's emergency management team to prepare the stores and prioritize team member and guestsafety.
Comment
IdentifierRisk 8
Where in the value chain does the risk driver occur?Direct operations
Risk type & Primary climate-related risk driver
Chronic physical Changes in precipitation patterns and extreme variability in weather patterns
Primary potential financial impactIncreased insurance claims liability
Climate risk type mapped to traditional financial services industry risk classification<Not Applicable>
Company-specific descriptionIncreased severity of chronic changes in climate may increase damage to Target stores and distribution centers, increasing Target's capital costs. Global sea-level rise cancause infrastructure damage of owned facilities and permanent closure of Target distribution centers and stores. Prolonged heat waves and overall higher averagetemperatures can cause higher cooling costs at owned facilities. Florida is a key market for Target. Warm nights associated with heat waves currently occur only a fewtimes per year across most of the region but are expected to become common events across much of the Southeast under a higher scenario.
Time horizonLong-term
LikelihoodVery likely
Magnitude of impact
CDP Page of 5210

High
Are you able to provide a potential financial impact figure?No, we do not have this figure
Potential financial impact figure (currency)<Not Applicable>
Potential financial impact figure – minimum (currency)<Not Applicable>
Potential financial impact figure – maximum (currency)<Not Applicable>
Explanation of financial impact figureAcross a chain of over 1,800 stores the overall magnitude of extreme events may be small but at a local market level the impacts may be larger.
Cost of response to risk
Description of response and explanation of cost calculationTarget monitors weather forecasts and works with store teams and Target's emergency management team to prepare the stores and prioritize team member and guestsafety.
Comment
IdentifierRisk 9
Where in the value chain does the risk driver occur?Upstream
Risk type & Primary climate-related risk driver
Market Increased cost of raw materials
Primary potential financial impactIncreased direct costs
Climate risk type mapped to traditional financial services industry risk classification<Not Applicable>
Company-specific descriptionHigher material costs from global suppliers due to slowing of global economy is a risk to Target's supply chain. Climate change is expected to cause substantial losses toinfrastructure and property and impede the rate of economic growth over this century. The continued warming that is projected to occur without significant reductions inglobal greenhouse gas emissions is expected to cause substantial net damage to the U.S. economy, especially in the absence of increased adaptation efforts. Thepotential for losses in some sectors could reach hundreds of billions of dollars per year by the end of this century. Additionally, the impacts of climate change beyond ourborders are expected to increasingly affect our trade and economy, including import and export prices and U.S. businesses with overseas operation and supply chains.
Time horizonLong-term
LikelihoodVery likely
Magnitude of impactHigh
Are you able to provide a potential financial impact figure?No, we do not have this figure
Potential financial impact figure (currency)<Not Applicable>
Potential financial impact figure – minimum (currency)<Not Applicable>
Potential financial impact figure – maximum (currency)<Not Applicable>
Explanation of financial impact figure
Cost of response to risk
Description of response and explanation of cost calculationTarget’s major suppliers are spread out geographically across the globe. Having a diverse supply chain geographically reduces Target’s risk of a localized climate-changerelated event greatly impacting our business.
Comment
IdentifierRisk 10
Where in the value chain does the risk driver occur?Downstream
Risk type & Primary climate-related risk driver
Reputation Increased stakeholder concern or negative stakeholder feedback
CDP Page of 5211

Primary potential financial impactIncreased credit risk
Climate risk type mapped to traditional financial services industry risk classification<Not Applicable>
Company-specific description827 investors are now requesting data from companies through CDP's climate change program. These investors represent over US $100tn. The expectation for corporateresponsibility reporting has grown significantly in the past 30 years. Over 93% of the G250 (world’s 250 largest companies by revenue based on the Fortune 500 ranking of2016) reported on corporate responsibility in 2016. If Target does not maintain its sustainable operations to limit climate change, there is a risk that it could lose investorsthat value ESG and sustainability within their portfolio companies.
Time horizonLong-term
LikelihoodLikely
Magnitude of impactHigh
Are you able to provide a potential financial impact figure?No, we do not have this figure
Potential financial impact figure (currency)<Not Applicable>
Potential financial impact figure – minimum (currency)<Not Applicable>
Potential financial impact figure – maximum (currency)<Not Applicable>
Explanation of financial impact figure
Cost of response to risk0
Description of response and explanation of cost calculationTarget is striving to improve its climate-related reporting, which included completing a scenario analysis following TCFD guidelines. Target will continue to report to CDPand aims to meet all of our environmental targets.
Comment
IdentifierRisk 11
Where in the value chain does the risk driver occur?Downstream
Risk type & Primary climate-related risk driver
Market Uncertainty in market signals
Primary potential financial impactDecreased revenues due to reduced demand for products and services
Climate risk type mapped to traditional financial services industry risk classification<Not Applicable>
Company-specific descriptionTarget regional markets may be dis-proportionally affected by climate change, leading to decreased sales in certain regions from decreased disposable income/purchasingpower of customers in those regions. Florida is one of Target’s key markets. In this region, by the end of the century, over one-half billion labor hours could be lost fromextreme heat-related impacts. Such changes would negatively impact the region’s labor-intensive agricultural industry and compound existing social stresses in rural areas.
Time horizonLong-term
LikelihoodVery likely
Magnitude of impactHigh
Are you able to provide a potential financial impact figure?No, we do not have this figure
Potential financial impact figure (currency)<Not Applicable>
Potential financial impact figure – minimum (currency)<Not Applicable>
Potential financial impact figure – maximum (currency)<Not Applicable>
Explanation of financial impact figure
Cost of response to risk
CDP Page of 5212

Description of response and explanation of cost calculationTarget is developing its ecommerce services. National online sales could dampen any disproportionate negative effect on income in one region of the US.
Comment
IdentifierRisk 12
Where in the value chain does the risk driver occur?Upstream
Risk type & Primary climate-related risk driver
Market Increased cost of raw materials
Primary potential financial impactIncreased direct costs
Climate risk type mapped to traditional financial services industry risk classification<Not Applicable>
Company-specific descriptionChanges in global electricity and oil prices would impact Target’s business. For example, increased electricity costs globally will lead to increased prices from suppliers.81% of Target's imports are from China, 5% from Vietnam, 5% from India, and the remaining 9% from other countries in Asia, Europe, Africa, and Central America.Suppliers are likely to pass their increased costs to customers. Global electricity prices are expected to rise by 15% in the EU and 13% in China by 2040 according to theIEA WEO 2018. Global oil prices impact the prices of materials that use petrochemicals as feedstocks, such as plastics, detergents, solvents, nylon, and polyester. Plasticpackaging affects the majority of Target's products, while textiles account for ~ 20% of sales on average.
Time horizonLong-term
LikelihoodVery likely
Magnitude of impactHigh
Are you able to provide a potential financial impact figure?No, we do not have this figure
Potential financial impact figure (currency)<Not Applicable>
Potential financial impact figure – minimum (currency)<Not Applicable>
Potential financial impact figure – maximum (currency)<Not Applicable>
Explanation of financial impact figure
Cost of response to risk
Description of response and explanation of cost calculationTarget is working with our suppliers to transition to renewable energy sources and implement our own emissions reductions projects. We are using post-consumer recycledplastic, such as in our Everspring brand product packaging. We are using recycled plastic for polyester in Target owned-brand apparel. Target is working to eliminateexpanded polystyrene from our owned-brand packaging by 2022, and we are pursuing the goals of the New Plastics Economy commitment by 2025.
Comment
IdentifierRisk 13
Where in the value chain does the risk driver occur?Upstream
Risk type & Primary climate-related risk driver
Market Increased cost of raw materials
Primary potential financial impactIncreased direct costs
Climate risk type mapped to traditional financial services industry risk classification<Not Applicable>
Company-specific descriptionA potential decrease in supply of raw materials due to climate change could lead to an increase in competition and prices. Globally, changes in the suitability of agriculture,increases in fire frequency and extent, the loss or migration of coastal wetlands, and the spatial relocation of natural vegetation will disrupt material supplies and their costs.Competition for resources will cause an increase in raw material prices and pose a risk to Target's supply chain.
Time horizonLong-term
LikelihoodVery likely
CDP Page of 5213

Magnitude of impactHigh
Are you able to provide a potential financial impact figure?No, we do not have this figure
Potential financial impact figure (currency)<Not Applicable>
Potential financial impact figure – minimum (currency)<Not Applicable>
Potential financial impact figure – maximum (currency)<Not Applicable>
Explanation of financial impact figure
Cost of response to risk
Description of response and explanation of cost calculationTarget is focused on taking the circular economy mainstream. Target established a goal that by the end of 2020 we would invest $1 million USD in textile recyclingtechnologies and as of March 2020 that goal was reached.
Comment
C2.4
(C2.4) Have you identified any climate-related opportunities with the potential to have a substantive financial or strategic impact on your business?Yes
C2.4a
(C2.4a) Provide details of opportunities identified with the potential to have a substantive financial or strategic impact on your business.
IdentifierOpp1
Where in the value chain does the opportunity occur?Direct operations
Opportunity typeEnergy source
Primary climate-related opportunity driverUse of lower-emission sources of energy
Primary potential financial impactReduced indirect (operating) costs
Company-specific descriptionMultiple federal and regional efforts have emerged that seek to put a price on carbon. Included in these proposals are federal and regional cap-and-trade programs, carbontaxes, and other proposals. The end objective of policymakers is to reduce the price disparity between carbon-based and alternative energy sources, establish increasedcertainty for future energy prices and regulations, reduce U.S. dependence on foreign energy sources, and incentivize organizations and individuals who act to reduce theirenergy use. In addition to the certainty that would come from the establishment of significant carbon regulations, we believe Target could benefit in two other ways. First,more than 10 years of substantial investments in energy efficiency will position Target to compete in an economy where energy costs increase. Strategies that de-coupleour business operations from carbon-based energy sources will reduce our exposure to price fluctuations and help the organization manage expense. Second, as wecontinue to invest in energy efficiency and renewable energy – there may be opportunities for Target to further monetize the value we create by reducing GHG emissionsthrough the sale of renewable energy certificates.
Time horizonLong-term
LikelihoodVery likely
Magnitude of impactMedium-low
Are you able to provide a potential financial impact figure?Yes, an estimated range
Potential financial impact figure (currency)<Not Applicable>
Potential financial impact figure – minimum (currency)35000000
Potential financial impact figure – maximum (currency)112000000
Explanation of financial impact figureBased on carbon pricing proposals introduced at the U.S. federal level, which have the price of carbon ranging between $15 and $52 per metric ton and covering varioussectors of the economy, Target estimates that a carbon price that is completely passed through by upstream energy providers could cost between $35 million and $112million per year.
CDP Page of 5214

Cost to realize opportunity0
Strategy to realize opportunity and explanation of cost calculationTarget has invested heavily in carbon reduction efforts over the past several years. Target is currently realizing financial value through the sale of Renewable EnergyCredits (RECs) in states with renewable energy standards and strong REC markets. When Target sells the RECs from a behind-the-meter solar energy installation, Targetdoes not make public claims to be solar powered nor does Target include the associated solar production in annual renewable energy or GHG reporting.
CommentOur investments in both energy efficiency and renewable energy have positive paybacks and are a direct financial benefit. Over the last seven years, we have invested over$290 million in energy efficiency projects, many of which have a payback of fewer than three years.
IdentifierOpp2
Where in the value chain does the opportunity occur?Direct operations
Opportunity typeResource efficiency
Primary climate-related opportunity driverMove to more efficient buildings
Primary potential financial impactReturns on investment in low-emission technology
Company-specific descriptionTarget has built a highly energy efficient portfolio of stores by continuously adopting new technologies and operating procedures. In addition, we have team membersdedicated to identifying financing and rebate opportunities for energy efficiency projects. This has allowed for increased investment in energy efficiency projects. Weanticipate continued opportunities to leverage third-party financing and rebate opportunities for implementing energy efficiency projects in the coming years.
Time horizonMedium-term
LikelihoodVirtually certain
Magnitude of impactLow
Are you able to provide a potential financial impact figure?Yes, a single figure estimate
Potential financial impact figure (currency)6000000
Potential financial impact figure – minimum (currency)<Not Applicable>
Potential financial impact figure – maximum (currency)<Not Applicable>
Explanation of financial impact figureIn 2019, Target received approximately $6 million in direct energy efficiency incentives from utilities for Target’s installation of energy efficiency projects. The energy costsavings from these energy efficiency projects is not reflected in this figure. By continually updating our energy-consuming assets, we have been able to take advantage ofcontinually improving energy efficiency standards and regulations. This has led to energy- related savings and we have team members dedicated to identifying financingand rebate opportunities for energy efficiency projects. This has allowed for increased investment in energy efficiency projects.
Cost to realize opportunity0
Strategy to realize opportunity and explanation of cost calculationWe have team members dedicated to identifying financing and rebate opportunities for energy efficiency projects. They work closely with internal partners as well as utilitiesto ensure we are taking advantage of as many opportunities as possible.
CommentThe cost associated with currently managing these risks is minimal. We utilize internal resources to manage programs and have some expenses related to these programs.However, these costs as a percentage of total costs are minimal.
IdentifierOpp3
Where in the value chain does the opportunity occur?Downstream
Opportunity typeProducts and services
Primary climate-related opportunity driverDevelopment and/or expansion of low emission goods and services
Primary potential financial impactIncreased revenues resulting from increased demand for products and services
Company-specific descriptionFrom how we build our stores to the products on our shelves, environmental sustainability at Target is integrated throughout our business. Our guests have come to expectattractive, functional, high-quality, and affordable merchandise as a part of our everyday assortment. With the growing awareness of environmental issues including climate
CDP Page of 5215

change and health and well-being, we see an opportunity to offer our guests additional choices within our product assortment that will drive top-line sales. We constantlyrevamp our assortment to make sure we're giving guests what they want. We are rethinking the design of products and packaging we sell to incorporate sustainableattributes - because it's the right thing to do and because it creates additional value for our guests. We measure our guests' preferences through surveys, trend research,sales patterns and product tests. In many departments within our stores, guests will find product choices that incorporate recycled materials, nontoxic chemicals or organicingredients, and packaging designs that minimize waste and incorporate recyclable or other preferable materials. In addition to top-line sales growth opportunities – thereare opportunities to drive improved margin through a greater focus on product and packaging design. The elimination of excess material and energy costs from productmanufacturing and transportation can translate into lower cost of goods sold.
Time horizonShort-term
LikelihoodLikely
Magnitude of impactHigh
Are you able to provide a potential financial impact figure?No, we do not have this figure
Potential financial impact figure (currency)<Not Applicable>
Potential financial impact figure – minimum (currency)<Not Applicable>
Potential financial impact figure – maximum (currency)<Not Applicable>
Explanation of financial impact figureTarget has seen success with lower-carbon products in the past. We are using recycled content in our polyester sourcing as well as in our Everspring product line.Everspring paper products use at least 50 percent recycled pulp, and Everspring bottle packaging uses 100 percent post-consumer recycled content for Everspring roomspray, foaming hand soap, liquid hand soap, dish soap and spray cleaning products and 50 percent post-consumer recycled content in laundry bottles. All of the post-consumer recycled plastic is sourced domestically. In total, we estimate we will use almost 700,000 lbs. of recycled plastic annually. There are several additional initiativesunderway to expand the provision of goods with a reduced carbon footprint. Target has not yet conducted a full analysis of the opportunity and its magnitude.
Cost to realize opportunity
Strategy to realize opportunity and explanation of cost calculationTarget has measures & plans to offer sustainable products and reduce life-cycle impacts of products (e.g. water efficient products, sustainable cotton, New PlasticsEconomy Global Commitment, circular fashion design, forest products policy, sustainable seafood, etc.). Yet consumer's sustainability awareness / willingness to pay /boycott could vary across product types (e.g. necessities vs luxury products; healthcare / food), it remains unclear how Target's current measures and policies are wellplaced against the "consumer awareness hotspots" and also against various age groups of consumers. Target is actively working on a number of projects to understandevolving guest attitudes and how our merchandise assortment meets those needs. For example, we have teams across the enterprise focused on understanding andimproving attributes (including environmental) of our owned- and national-brand product assortment. This team is comprised of representatives from key departments withinour merchandising, sourcing, and marketing divisions. The work of this team is helping to inform and guide our merchandise strategy. In addition, the CR team works withhundreds of partners across the company to set goals, develop initiatives and monitor and report progress. LINK:https://corporate.target.com/_media/TargetCorp/csr/pdf/2019_corporate_responsibility_report.pdf
Comment
IdentifierOpp4
Where in the value chain does the opportunity occur?Upstream
Opportunity typeProducts and services
Primary climate-related opportunity driverOther, please specify (Employee Recruitment and Retention)
Primary potential financial impactOther, please specify (Increased employee recruitment, engagement, and retention)
Company-specific descriptionWe recognize that environmental sustainability is important to both our current and prospective team members and guests. We communicate with team membersthroughout the year and involve them in generating new ideas and sharing their environmental efforts. We also launched an interactive, internal web portal for teammembers that houses suggested volunteer activity organized around social and environmental themes. As we pursue significant growth in the coming years, we believe oursustainability efforts will position us to retain our current top performers, and attract the best talent, by differentiating Target from other potential employers.
Time horizonMedium-term
LikelihoodVirtually certain
Magnitude of impactMedium-low
Are you able to provide a potential financial impact figure?No, we do not have this figure
Potential financial impact figure (currency)<Not Applicable>
Potential financial impact figure – minimum (currency)<Not Applicable>
CDP Page of 5216

Potential financial impact figure – maximum (currency)<Not Applicable>
Explanation of financial impact figureAttracting and retaining talent has direct cost implications for Target. While climate strategy and Target’s overall corporate responsibility initiatives are known to be linked totalent attraction and retention, Target has not yet conducted a full analysis of the opportunity and its magnitude.
Cost to realize opportunity
Strategy to realize opportunity and explanation of cost calculationTarget is striving to be a leader in sustainability. In 2017, we introduced a new climate policy and goals to guide our process, based on the latest climate science. Then in2019 we announced our approved Science Based Target goals to reduce our Scope 1, 2 and 3 carbon emissions by 30 percent below 2017 levels by 2030. To reduce ourScope 1 and 2 emissions, we’ll continue to ramp up investments in renewable energy and energy saving initiatives across our business. Scope 3 accounts for 94 percent ofour GHG emissions. That is why we have committed to having 80 percent of our suppliers set their own carbon reduction targets by 2023. We will work with our suppliers totransition to renewable energy sources and implement their own emissions reduction projects. We will expand our implementation of manufacturing performanceimprovement programs through initiatives such as Apparel Impact Institute’s programs to scale performance improvements in energy use and emissions in in ourmanufacturing supply chain.
Comment
IdentifierOpp5
Where in the value chain does the opportunity occur?Downstream
Opportunity typeMarkets
Primary climate-related opportunity driverOther, please specify (Increased financial backing from investors)
Primary potential financial impactOther, please specify (Increased financial backing from investors)
Company-specific description827 investors are now requesting data from companies through CDP's climate change program. These investors represent over US $100tn. The expectation for corporateresponsibility reporting has grown significantly in the past 30 years. Over 93% of the G250 (world’s 250 largest companies by revenue based on the Fortune 500 ranking of2016) reported on corporate responsibility in 2016. Target has the opportunity to potentially increase investor backing if we can demonstrate a progressive transition to alow-carbon business.
Time horizonMedium-term
LikelihoodLikely
Magnitude of impactHigh
Are you able to provide a potential financial impact figure?No, we do not have this figure
Potential financial impact figure (currency)<Not Applicable>
Potential financial impact figure – minimum (currency)<Not Applicable>
Potential financial impact figure – maximum (currency)<Not Applicable>
Explanation of financial impact figure
Cost to realize opportunity
Strategy to realize opportunity and explanation of cost calculationTarget is striving to be a leader in sustainability. In 2017, we introduced a new climate policy and goals to guide our process, based on the latest climate science. Then in2019 we announced our approved Science Based Target goals to reduce our Scope 1, 2 and 3 carbon emissions by 30 percent below 2017 levels by 2030. To reduce ourScope 1 and 2 emissions, we’ll continue to ramp up investments in renewable energy and energy saving initiatives across our business. Scope 3 accounts for 94 percent ofour GHG emissions. That is why we have committed to having 80 percent of our suppliers set their own carbon reduction targets by 2023. We will work with our suppliers totransition to renewable energy sources and implement their own emissions reduction projects. We will expand our implementation of manufacturing performanceimprovement programs through initiatives such as Apparel Impact Institute’s programs.
Comment
IdentifierOpp6
Where in the value chain does the opportunity occur?Downstream
Opportunity typeProducts and services
Primary climate-related opportunity driverDevelopment of climate adaptation, resilience and insurance risk solutions
Primary potential financial impact
CDP Page of 5217

Increased revenues resulting from increased demand for products and services
Company-specific descriptionThe prevalence and transmission of vector-borne disease is likely to be affected by changing climate conditions, such as rising temperature, shifts in precipitation patternsand seasons, etc. While the influence of temperature on various diseases tends to be nonlinear and vector specific, parts of the world are likely to experience increasedtransmission rates (Central and South America) and the expansion of vector-born disease transmission regions and extension of transmission season (North America). Forexample, in the U.S., the suitable habitat for mosquito vectors is expected to continue shifting North in the Northeast region over the next few decades, while the projectedcases for West Nile Virus are likely to double to over 1,000 cases nationwide by 2050. The increasing risk of vector-borne disease could drive up the demand for insectrepellent and related care products. Warmer temperatures, longer seasons and changes in rainfall could increase the production and release of airborne allergens, leadingto higher frequency and intensity of allergic respiratory diseases such as asthma and hay fever. Additionally, the increased prevalence of wildfires due to climate changefurther reduce air quality. The increasing risk of allergic episodes could lead to higher sales in allergy medication. At least 38% of the stores (based on ft2) are located instates subject to the most significant increase in mean temperature due to climate change. The mean temperature for U.S. on average is expected to increase by 2.2°F(1.2°C) in the next few decades, according to the NCA4. This could result in increased sales of cooling related products (fans, air-conditioners) in the future.
Time horizonLong-term
LikelihoodVery likely
Magnitude of impactMedium-low
Are you able to provide a potential financial impact figure?No, we do not have this figure
Potential financial impact figure (currency)<Not Applicable>
Potential financial impact figure – minimum (currency)<Not Applicable>
Potential financial impact figure – maximum (currency)<Not Applicable>
Explanation of financial impact figure
Cost to realize opportunity
Strategy to realize opportunity and explanation of cost calculationIf needed, we would be able to increase our inventory of insect repellent and related care products, allergy products, and cooling related products to accommodate anincrease in demand.
Comment
C3. Business Strategy
C3.1
(C3.1) Have climate-related risks and opportunities influenced your organization’s strategy and/or financial planning?Yes, and we have developed a low-carbon transition plan
C3.1a
(C3.1a) Does your organization use climate-related scenario analysis to inform its strategy?Yes, qualitative and quantitative
C3.1b
CDP Page of 5218

(C3.1b) Provide details of your organization’s use of climate-related scenario analysis.
Climate-relatedscenariosand modelsapplied
Details
RCP 4.5RCP 8.5IEASustainabledevelopmentscenarioOther,pleasespecify (IEACurrentPoliciesScenario,SSP2,SSP3, USFourthNationalClimateAssessment)
In keeping with this best practice we chose well-established third-party scenarios to look at both physical and transition risks and opportunities over three timeframes (2025, 2030, and 2040). Forphysical risks and opportunities, we drew on IPCC RCP 4.5 and RCP 8.5. For transition risks and opportunities, we used IEA’s WEO Sustainable Development Scenario and Current PoliciesScenario. We also used the WRI Aqueduct tool to investigate water-related risks under different decarbonization pathways. In addition to the IPCC scenarios already mentioned, the tool usessocioeconomic assumptions from the Shared Socioeconomic Pathways (e.g. SSP2 and SSP3). Inputs: We also reviewed the U.S. Government’s Fourth National Climate Assessment to incorporaterelevant U.S. region-specific findings. For internal data sources we analyzed: historical financial results e.g. sales, Target Scope 1 & 2 emissions, energy use across our physical locations (stores,distribution centers, headquarters, etc.), relevant supply chain information (e.g. raw ingredients in products), etc. Coverage: The scenario analysis covered Target’s owned buildings, logistics, andthree product lines: apparel & accessories, beauty & household essentials, and food & beverage. For these lines, we considered supply chain, operations, and sales. Time-horizons: We consideredscenarios on our business in 2025 and in 2030 as this is in line with our current GHG emission targets, and to 2040 to capture physical impacts. While Target business strategy does not extend to2040, we felt that this was an appropriate time frame for trying to capture physical risks, as differences in climate impacts in the scenarios may not become apparent before this time. Assumptions: Inthe 2°C (RCP 4.5, IEA SDS, SSP2) scenario, we assume in the period to 2025 and to 2030, society acts rapidly to limit emissions & puts in place measures to restrain deforestation & discourageemissions (e.g. implementing a carbon price). In the 4°C scenario to 2025 and to 2030, we assume climate policy is less ambitious with emissions remaining high. For this time period, there is not asignificant difference in physical impacts between the two scenarios. For the period to 2040, the transition assumptions remain the same for both scenarios, however the physical manifestationsbecome more apparent in the 4°C scenario. Results: We identified material impacts on our business arising from each scenario based on existing internal & external data (see inputs above).Examples of impacts of the 2°C scenario: federal, state or local efforts to regulate fuel-efficiency would impact Target’s business most significantly through changing prices for transportation costs;zero net deforestation requirements introduced & shifts to sustainable agriculture pressures agricultural production, raising the price of key raw materials; a higher carbon price applied in moregeographies could increase Target’s operational costs, as well as supply chain costs through pass-through. Examples of impacts of the 4°C scenario: chronic & acute water stress, reducingagricultural productivity in some regions, raising prices of raw materials such as cotton, which is crucial to Target’s apparel products; increased frequency of extreme weather causing increasedincidences of disruption to manufacturing & distribution networks; temperature increase & extreme weather events reducing economic activity, and is more pronounced in Target’s planned expansionareas. Since completing our TCFD Climate risk analysis for the first time in 2019 we have joined other companies in the BSR Value Chain Risk to Resilience working group to best determine ourstrategy to more comprehensively integrate climate risk into our core business practices. Although we have taken many steps on our journey of climate risk mitigation, we are working to betterunderstand how to most efficiently implement more resilient business strategies going forward.
C3.1d
(C3.1d) Describe where and how climate-related risks and opportunities have influenced your strategy.
Have climate-related risksand opportunities influencedyour strategy in this area?
Description of influence
Productsandservices
Yes Target tracks weather-related events and natural disasters that trigger an emergency response. From 2007 through 2018, the number of these types of events hassteadily risen from 2 in 2007 to 13 in 2018. Damages to property and inventory have increased to the tens of millions of USD, with it being the highest in 2017, mainlydue to major hurricanes. Hurricanes, rain storm/hail, and tornadoes/wind cause the most damage to Target’s property and inventory.
Supplychainand/orvaluechain
Yes Although Target understands that our suppliers and vendors have felt the effects of climate-related issues in some forms to date, we have yet to see the major impactsof that trickle down to our enterprises. Thus, we have no specific impacts to report for this past year. We expect that if business continues as usual and we reach abovea 2-degree warming by 2030 we will see that risk impact significantly increase in tandem.
Investmentin R&D
Not evaluated Target’s investment in R&D has not yet been impacted enough to pivot our current strategy. We foresee this will continue to stay unimpacted in the short-term future.
Operations Evaluation in progress Target’s operations team is evaluating which locations are more at risk for energy supply interruptions, including from climate-related disruption events, in order toprioritize sites for energy resiliency investments.
C3.1e
(C3.1e) Describe where and how climate-related risks and opportunities have influenced your financial planning.
Financialplanningelementsthat havebeeninfluenced
Description of influence
Row1
IndirectcostsCapitalexpendituresAssets
Indirect Costs: Warmer climate zones may require longer HVAC run times, increasing Target's energy costs. Target's energy team works with internal asset teams to evaluate equipment runstrategies and their associated costs. These costs are reflected in Target's long-range planning process for operating cost forecasts. Revenues from the sale of Renewable Energy Creditsgenerated from behind-the-meter solar installations at select Target stores help reduce operating costs. Target's solar, offsite renewable energy, and energy efficiency programs produce energycost savings that reduce overall operating costs. Capital Expenditures: Increased capital costs from extreme weather event-impacted stores are included in corporate financial planning. Targetis evaluating improving the energy resiliency at stores and distribution centers in areas of the country that are likely to experience more extreme weather events. Resiliency measures are likelyto require additional capital expenditures, and these costs are evaluated by Target's Property Management team in store planning and long-range financial planning. Assets: Chronic changes totemperature, humidity, and dew points may reduce the expected lifespan of store equipment that was installed under different condition expectations, requiring more frequent replacement. Assetaging and turnover is monitored and included in financial planning. Target's Property Management team is also evaluating how to use Target's existing store and distribution center footprint tocreate additional opportunities in onsite solar, energy efficiency, and electric vehicle charging stations for guests. The financial value of these programs is evaluated in long term planning andcapital request processes.
C3.1f
CDP Page of 5219

(C3.1f) Provide any additional information on how climate-related risks and opportunities have influenced your strategy and financial planning (optional).
In 2015, Target announced a set of energy-related goals as part of signing on to the White House’s American Business Act on Climate Pledge. These include energyefficiency, renewable energy, and refrigeration emission management goals. Senior leadership is updated on progress against these goals quarterly, and teams areresponsible for ensuring progress toward the goals. In the short term, GHG emissions reductions from operations are the primary climate-related driver for changing ourbusiness strategy. Both reputational and potential regulatory/financial impacts of climate change have also influenced our short-term strategy. This is evident in our allocationof capital specifically for sustainability projects. These projects include energy efficiency projects, onsite solar, and projects that reduce our high global warming potentialrefrigerants. Our formal innovation process has been designed to bring together partners in engineering, architecture, operations, energy management, and sustainability toidentify and test new technologies or processes. Innovation funds small tests and pilots and helps make the business case to implement successful projects across the chain.In 2016, we expanded programs engaging manufacturing suppliers in our supply chain to implement energy and water efficiency projects. Initially partnering with the NaturalResources Defense Council’s Clean by Design program (now managed by the Apparel Impact Institute), we have expanded to additional facilities outside of the scope of thatprogram. We continue to pursue additional opportunities to scale the learnings from that program. We also recognize the long-term impacts climate change and potentialcarbon regulations have on our business. We are developing processes and technologies that enable us to track and monitor the impact of extreme weather events on ourfacilities, team members, and guests. The current and evolving tools prepare us to address any possible increases in extreme weather events associated with climate change.In addition, we began to examine the environmental impacts embedded within our supply chain to understand our exposure to climate change within our supply chain. Ourcombination of operational efficiency, energy management, reputation management, and our evolving tools and technology provide a strategic advantage encompassingclimate change. Short-term operational efficiencies enable improvements in expenses while we continue to pursue our public goals. In 2017, we introduced a new climatepolicy and goals to guide our progress, based on the latest climate science. We have set goals to reduce our greenhouse gas footprint, and continue to work with our industrypartners, policymakers and other stakeholders to accelerate the transition to a low-carbon economy. We have begun implementing projects in our owned-brandmanufacturing facilities that will result in the avoidance of Scope 3 emissions. In 2019, we also developed and received approval of our Scope 3 goal that, coupled with ourScope 1 and 2 goal, has fulfilled our commitment to the Science-Based Targets initiative. This initiative provides guidance for and champions science-based target setting asa powerful way of boosting companies’ competitive advantage in the transition to the low-carbon economy. In December 2019, Supply Chain Dive awarded Target the 2019Sustainability Plan of the Year, in recognition of our leadership in setting carbon-reduction goals for the entire supply chain.
In 2019, we also performed a scenario analysis in line with TCFD recommendations. In addition, we have joined other companies in the BSR Value Chain Risk to Resilienceworking group to best determine our strategy to more comprehensively integrate climate risk into our core business practices. Although we have taken many steps on ourjourney of climate risk mitigation, we are working to better understand how to most efficiently implement more resilient business strategies going forward.
C4. Targets and performance
C4.1
(C4.1) Did you have an emissions target that was active in the reporting year?Absolute target
C4.1a
(C4.1a) Provide details of your absolute emissions target(s) and progress made against those targets.
Target reference numberAbs 1
Year target was set2019
Target coverageCompany-wide
Scope(s) (or Scope 3 category)Scope 1+2 (market-based)
Base year2017
Covered emissions in base year (metric tons CO2e)2567880
Covered emissions in base year as % of total base year emissions in selected Scope(s) (or Scope 3 category)100
Target year2030
Targeted reduction from base year (%)30
Covered emissions in target year (metric tons CO2e) [auto-calculated]1797516
Covered emissions in reporting year (metric tons CO2e)2298450
% of target achieved [auto-calculated]34.9743757496456
Target status in reporting year
CDP Page of 5220

Underway
Is this a science-based target?Yes, this target has been approved as science-based by the Science-Based Targets initiative
Please explain (including target coverage)By 2030, Target will reduce its absolute Scope 1 and 2 greenhouse gas emissions by 30% percent below 2017 levels. In 2017, Target's Scope 1 and 2 GHG emissionswere 2,567,880 mt CO2e (market-based). Target restated the 2017 baseline Scope 1 and 2 inventory in 2020 due to a corrected chilled water and steam billing error.Target received approval of our Scope 1, 2, and 3 Climate goals by SBTi in January of 2019.
Target reference numberAbs 2
Year target was set2019
Target coverageCompany-wide
Scope(s) (or Scope 3 category)Other, please specify (Scope 3: Retail Purchased goods & services)
Base year2017
Covered emissions in base year (metric tons CO2e)26939000
Covered emissions in base year as % of total base year emissions in selected Scope(s) (or Scope 3 category)100
Target year2030
Targeted reduction from base year (%)30
Covered emissions in target year (metric tons CO2e) [auto-calculated]18857300
Covered emissions in reporting year (metric tons CO2e)26363000
% of target achieved [auto-calculated]7.12721333382828
Target status in reporting yearUnderway
Is this a science-based target?Yes, this target has been approved as science-based by the Science-Based Targets initiative
Please explain (including target coverage)By 2030, Target will reduce its absolute Scope 3 Retail Purchased goods & services greenhouse gas emissions by 30% percent below 2017 levels. Target also commitsthat 80% of its suppliers by spend covering all purchased goods and services will set science-based scope 1 and scope 2 targets by 2023. Target received approval of ourScope 1, 2, and 3 Climate goals by SBTi in January of 2019.
C4.2
(C4.2) Did you have any other climate-related targets that were active in the reporting year?Target(s) to increase low-carbon energy consumption or productionTarget(s) to reduce methane emissions
C4.2a
(C4.2a) Provide details of your target(s) to increase low-carbon energy consumption or production.
Target reference numberLow 1
Year target was set2019
Target coverageCompany-wide
Target type: absolute or intensityAbsolute
Target type: energy carrierElectricity
Target type: activity
CDP Page of 5221

Consumption
Target type: energy sourceRenewable energy source(s) only
Metric (target numerator if reporting an intensity target)Percentage
Target denominator (intensity targets only)<Not Applicable>
Base year2018
Figure or percentage in base year22
Target year2030
Figure or percentage in target year100
Figure or percentage in reporting year27
% of target achieved [auto-calculated]6.41025641025641
Target status in reporting yearNew
Is this target part of an emissions target?The renewable electricity goal contributes to the Scope 2 emissions goal
Is this target part of an overarching initiative?RE100
Please explain (including target coverage)We have committed to source 100% of our electricity from renewable sources by 2030. The goal, which applies to all of Target’s domestic operations, will help us powerour stores, distribution centers and offices even more responsibly. We’ll track our progress closely, and we’re already working toward an initial checkpoint of sourcing 60%of our electricity through renewable sources by 2025. We set our 100% renewable electricity goal at the same time we joined the RE100 initiative.
Target reference numberLow 2
Year target was set2014
Target coverageCompany-wide
Target type: absolute or intensityAbsolute
Target type: energy carrierElectricity
Target type: activityProduction
Target type: energy sourceRenewable energy source(s) only
Metric (target numerator if reporting an intensity target)Percentage
Target denominator (intensity targets only)<Not Applicable>
Base year2014
Figure or percentage in base year20.8
Target year2020
Figure or percentage in target year100
Figure or percentage in reporting year103.2
% of target achieved [auto-calculated]104.040404040404
Target status in reporting yearAchieved
CDP Page of 5222

Is this target part of an emissions target?The rooftop solar goal contributes to the Scope 2 emissions goal.
Is this target part of an overarching initiative?Science-based targets initiative
Please explain (including target coverage)We report our annual solar installation progress in the U.S. Solar Energy Industry Association’s annual “Solar Means Business” report.
C4.2b
(C4.2b) Provide details of any other climate-related targets, including methane reduction targets.
Target reference numberOth 1
Year target was set2019
Target coverageSite/facility
Target type: absolute or intensityAbsolute
Target type: category & Metric (target numerator if reporting an intensity target)Please select
Target denominator (intensity targets only)<Not Applicable>
Base year2012
Figure or percentage in base year0
Target year2020
Figure or percentage in target year100
Figure or percentage in reporting year74
% of target achieved [auto-calculated]74
Target status in reporting yearUnderway
Is this target part of an emissions target?Not directly, however, the addition of EV Charging is in support of the transition to more sustainable modes of transportation for our guests and team members within thecommunities that we operate.
Is this target part of an overarching initiative?No, it's not part of an overarching initiative
Please explain (including target coverage)This goal encompasses our efforts to setup EV charging at 100 sites by the end of 2020. We are making advances in our electric vehicle infrastructure with the help ofindustry experts Tesla, ChargePoint and Electrify America.
Target reference numberOth 2
Year target was set2019
Target coverageSite/facility
Target type: absolute or intensityAbsolute
Target type: category & Metric (target numerator if reporting an intensity target)Please select
Target denominator (intensity targets only)<Not Applicable>
Base year2012
Figure or percentage in base year0
CDP Page of 5223

Target year2020
Figure or percentage in target year600
Figure or percentage in reporting year527
% of target achieved [auto-calculated]87.8333333333333
Target status in reporting yearUnderway
Is this target part of an emissions target?Not directly, however, the addition of EV Charging is in support of the transition to more sustainable modes of transportation for our guests and team members within thecommunities that we operate.
Is this target part of an overarching initiative?No, it's not part of an overarching initiative
Please explain (including target coverage)This goal encompasses our efforts to setup 600 parking spaces with EV charging by the end of 2020. We are making advances in our electric vehicle infrastructure with thehelp of industry experts Tesla, ChargePoint and Electrify America.
Target reference numberOth 3
Year target was set2019
Target coverageSite/facility
Target type: absolute or intensityAbsolute
Target type: category & Metric (target numerator if reporting an intensity target)Please select
Target denominator (intensity targets only)<Not Applicable>
Base year2012
Figure or percentage in base year0
Target year2020
Figure or percentage in target year20
Figure or percentage in reporting year16
% of target achieved [auto-calculated]80
Target status in reporting yearUnderway
Is this target part of an emissions target?Not directly, however, the addition of EV Charging is in support of the transition to more sustainable modes of transportation for our guests and team members within thecommunities that we operate.
Is this target part of an overarching initiative?No, it's not part of an overarching initiative
Please explain (including target coverage)This goal encompasses our efforts to setup EV charging across 20 states by the end of 2020. We are making advances in our electric vehicle infrastructure with the help ofindustry experts Tesla, ChargePoint and Electrify America.
Target reference numberOth 4
Year target was set2014
Target coverageOther, please specify (All Stores)
Target type: absolute or intensityIntensity
Target type: category & Metric (target numerator if reporting an intensity target)
CDP Page of 5224

Low-carbon buildings Percentage of buildings with a green building certificate
Target denominator (intensity targets only)Other, please specify (Total Store Count)
Base year2014
Figure or percentage in base year
Target year
Figure or percentage in target year
Figure or percentage in reporting year1515
% of target achieved [auto-calculated]<Calculated field>
Target status in reporting yearAchieved
Is this target part of an emissions target?More efficient buildings contribute to Target’s Scope 1 and 2 reductions.
Is this target part of an overarching initiative?Science Based Targets initiative
Please explain (including target coverage)Target’s ENERGY STAR goal preceded our Science-Based Climate goal but pursuing ENERGY STAR certification has presented energy efficiency savings opportunitiesthat, when implemented, contribute to Target’s climate goals.
Target reference numberOth 5
Year target was set2014
Target coverageOther, please specify (All Stores)
Target type: absolute or intensityIntensity
Target type: category & Metric (target numerator if reporting an intensity target)
Waste management Percentage of total waste generated that is recycled
Target denominator (intensity targets only)metric ton of waste
Base year2014
Figure or percentage in base year67.9
Target year2020
Figure or percentage in target year70
Figure or percentage in reporting year77.5
% of target achieved [auto-calculated]457.142857142858
Target status in reporting yearAchieved
Is this target part of an emissions target?Waste reduction and diversion reduce Target’s Scope 3 emissions.
Is this target part of an overarching initiative?Science Based Targets initiative
Please explain (including target coverage)Target’s landfill diversion goal preceded our Science-Based Climate goal but it does contribute to reducing emissions from waste treatment.
C4.3
CDP Page of 5225

(C4.3) Did you have emissions reduction initiatives that were active within the reporting year? Note that this can include those in the planning and/orimplementation phases.Yes
C4.3a
(C4.3a) Identify the total number of initiatives at each stage of development, and for those in the implementation stages, the estimated CO2e savings.
Number of initiatives Total estimated annual CO2e savings in metric tonnes CO2e (only for rows marked *)
Under investigation
To be implemented* 3 20450
Implementation commenced*
Implemented* 9 422083
Not to be implemented 0
C4.3b
(C4.3b) Provide details on the initiatives implemented in the reporting year in the table below.
Initiative category & Initiative type
Energy efficiency in buildings Lighting
Estimated annual CO2e savings (metric tonnes CO2e)21145
Scope(s)Scope 2 (location-based)
Voluntary/MandatoryVoluntary
Annual monetary savings (unit currency – as specified in C0.4)5000000
Investment required (unit currency – as specified in C0.4)47400000
Payback period1-3 years
Estimated lifetime of the initiative6-10 years
CommentAnnual energy savings from Target's 2019 investments in LED lighting on the sales floor, backrooms, parking lots, and building downlights (49,834 MWh) was multiplied bythe effective CO2e/MWh emission factor from Target's Location-based Scope 2 inventory in order to calculate the CO2 value of this initiative.
Initiative category & Initiative type
Low-carbon energy consumption Solar PV
Estimated annual CO2e savings (metric tonnes CO2e)48588
Scope(s)Scope 2 (location-based)
Voluntary/MandatoryVoluntary
Annual monetary savings (unit currency – as specified in C0.4)
Investment required (unit currency – as specified in C0.4)
Payback period4-10 years
Estimated lifetime of the initiative11-15 years
CommentThe 2019 REC total from Target's 2 active onsite solar projects was multiplied by the effective CO2e/MWh emission factor from Target's Location-based Scope 2 inventoryin order to calculate the CO2 value of this initiative.
Initiative category & Initiative type
CDP Page of 5226

Low-carbon energy consumption Low-carbon electricity mix
Estimated annual CO2e savings (metric tonnes CO2e)
Scope(s)Scope 2 (market-based)
Voluntary/MandatoryVoluntary
Annual monetary savings (unit currency – as specified in C0.4)
Investment required (unit currency – as specified in C0.4)
Payback periodNo payback
Estimated lifetime of the initiativeOngoing
CommentTarget annually requests scope 2 market-based emission factors from our electric utilities across the United States. We have also worked with peer companies, the EdisonElectric Institute, and the World Resources Institute to improve the quantity and quality of utility-reported emission factors. Since we started to collect utility-specific data in2017 we have noticed a reduction in the carbon intensity of electric supply in particular parts of the United States. We have not yet isolated the effect of this change in theScope 2 inventory compared to other inventory changes, such as reduced electricity usage and increased Target renewable energy project production. We will continue tocollect these emission factors and monitor for changes in future years.
Initiative category & Initiative type
Low-carbon energy generation Solar PV
Estimated annual CO2e savings (metric tonnes CO2e)2791
Scope(s)Scope 2 (market-based)
Voluntary/MandatoryVoluntary
Annual monetary savings (unit currency – as specified in C0.4)
Investment required (unit currency – as specified in C0.4)
Payback periodNo payback
Estimated lifetime of the initiative11-15 years
CommentThe 2019 REC total from Target's 2 active solar green tariffs was multiplied by the effective CO2e/MWh emission factor from Target's Market-based Scope 2 inventory inorder to calculate the CO2 value of this initiative.
Initiative category & Initiative type
Low-carbon energy generation Wind
Estimated annual CO2e savings (metric tonnes CO2e)121620
Scope(s)Scope 2 (market-based)
Voluntary/MandatoryVoluntary
Annual monetary savings (unit currency – as specified in C0.4)
Investment required (unit currency – as specified in C0.4)
Payback periodNo payback
Estimated lifetime of the initiative11-15 years
CommentThe 2019 REC total from Target's 2 active wind VPPAs was multiplied by the effective CO2e/MWh emission factor from Target's Market-based Scope 2 inventory total inorder to calculate the CO2 value of this initiative.
Initiative category & Initiative type
Waste reduction and material circularity Product/component/material recycling
CDP Page of 5227

Estimated annual CO2e savings (metric tonnes CO2e)3679
Scope(s)Scope 3
Voluntary/MandatoryVoluntary
Annual monetary savings (unit currency – as specified in C0.4)
Investment required (unit currency – as specified in C0.4)
Payback periodNo payback
Estimated lifetime of the initiativeOngoing
CommentTarget held two car seat take back events in 2019. The events combined collected 7.0 million tons of material to be recycled. GHG Savings estimates were developed usingthe U.S. EPA's WARM model, v15. Category: mixed plastics. Baseline management method = landfill, alternative management method = recycled. U.S. National Averagedefaults were used in the model.
Initiative category & Initiative type
Waste reduction and material circularity Waste reduction
Estimated annual CO2e savings (metric tonnes CO2e)220358
Scope(s)Scope 3
Voluntary/MandatoryVoluntary
Annual monetary savings (unit currency – as specified in C0.4)
Investment required (unit currency – as specified in C0.4)
Payback periodNo payback
Estimated lifetime of the initiativeOngoing
CommentTarget's food donation program donates food that would otherwise be discarded to shelters and food banks. Savings estimates were developed using the U.S. EPA'sWARM model, v15. Category: food waste. Baseline management method = landfill, alternative management method = source reduced. U.S. National Average defaultswere used in the model. Total tons of donated food = 52,442
Initiative category & Initiative type
Waste reduction and material circularity Other, please specify (Composting)
Estimated annual CO2e savings (metric tonnes CO2e)3903
Scope(s)Scope 3
Voluntary/MandatoryVoluntary
Annual monetary savings (unit currency – as specified in C0.4)
Investment required (unit currency – as specified in C0.4)
Payback periodNo payback
Estimated lifetime of the initiativeOngoing
CommentTarget composts a portion of its food waste, waste that would otherwise be likely landfilled. Savings estimates were developed using the U.S. EPA's WARM model, v15.Category: food waste. Baseline management method = landfill, alternative management method = compost. U.S. National Average defaults were used in the model. Totaltons of food waste composted = 5,435.
Initiative category & Initiative type
Transportation Other, please specify (EV Charging Stations)
CDP Page of 5228

Estimated annual CO2e savings (metric tonnes CO2e)
Scope(s)Scope 3
Voluntary/MandatoryVoluntary
Annual monetary savings (unit currency – as specified in C0.4)
Investment required (unit currency – as specified in C0.4)
Payback periodNo payback
Estimated lifetime of the initiative6-10 years
CommentWe are making advances in our electric vehicle infrastructure with the help of industry experts Tesla, ChargePoint and Electrify America. As of the end of 2019, our electricvehicle program spanned 74 sites in sixteen states, and we plan to expand our electric vehicle program over the next two years to more than 600 parking spaces withcharging stations at over 100 sites across more than 20 states.
C4.3c
(C4.3c) What methods do you use to drive investment in emissions reduction activities?
Method Comment
Dedicated budget for energyefficiency
Target allocates capital for energy efficiency projects.
Dedicated budget for other emissionsreduction activities
Target allocates capital for our onsite solar program for feasible sites where third party power purchase agreements (PPAs) are not available or financially viable.
Financial optimization calculations Targets evaluates non-capital low-carbon projects using internal NPV standards. These types of projects include onsite solar power purchase agreements (PPAs) and virtualpower purchase agreements (VPPAs) for large scale renewable energy projects.
C4.5
(C4.5) Do you classify any of your existing goods and/or services as low-carbon products or do they enable a third party to avoid GHG emissions?Yes
C4.5a
CDP Page of 5229

(C4.5a) Provide details of your products and/or services that you classify as low-carbon products or that enable a third party to avoid GHG emissions.
Level of aggregationGroup of products
Description of product/Group of productsEnergy Star Certified Products: Target offers a range of Energy Star certified products through our stores and digital platform, which includes offerings like air conditionerunits, dehumidifiers, and bathroom fans.
Are these low-carbon product(s) or do they enable avoided emissions?Avoided emissions
Taxonomy, project or methodology used to classify product(s) as low-carbon or to calculate avoided emissionsOther, please specify (ENERGY STAR Certification )
% revenue from low carbon product(s) in the reporting year0
% of total portfolio value<Not Applicable>
Asset classes/ product types<Not Applicable>
CommentOur assortment of Energy Star certified products allow our guests to to identify and purchase energy-efficient products that offer savings on energy bills verified via EPAestablished energy efficiency requirements. Target does not disclose revenue for specific product categories.
Level of aggregationGroup of products
Description of product/Group of productsLED Light Bulbs: Target offers a vast assortment of LED light bulbs. The assortment includes a variety of price points including options for less than $10. Our Up & Upowned brand lightbulbs typically have a 10-year lifespan and utilize on average 80% less energy than incandescent light bulbs.
Are these low-carbon product(s) or do they enable avoided emissions?Avoided emissions
Taxonomy, project or methodology used to classify product(s) as low-carbon or to calculate avoided emissionsOther, please specify ( U.S. Department of Energy Life-Cycle Assessment of Energy and Environmental Impacts of LED Lighting Products)
% revenue from low carbon product(s) in the reporting year0
% of total portfolio value<Not Applicable>
Asset classes/ product types<Not Applicable>
CommentAs a part of our energy efficient light bulb program Target works with electric utilities across the country to help promote LED light bulbs with customers as part of theutility’s demand-side management efficiency programs. Target is a key vendor in the distribution of energy efficient products. Target does not disclose revenue for specificproduct categories.
C5. Emissions methodology
C5.1
CDP Page of 5230

(C5.1) Provide your base year and base year emissions (Scopes 1 and 2).
Scope 1
Base year startFebruary 1 2017
Base year endJanuary 31 2018
Base year emissions (metric tons CO2e)706176
CommentThe 2017 baseline values are calculated using the AR4 GWP values.
Scope 2 (location-based)
Base year startFebruary 1 2017
Base year endJanuary 31 2018
Base year emissions (metric tons CO2e)1936817
CommentThe 2017 baseline values are calculated using the AR4 GWP values. Due to a chilled water consumption billing error in 2020 Target restated the 2017 baseline Scope 2(location-based) total.
Scope 2 (market-based)
Base year startFebruary 1 2017
Base year endJanuary 31 2018
Base year emissions (metric tons CO2e)1861703
CommentThe 2017 baseline values are calculated using the AR4 GWP values. Due to a chilled water consumption billing error in 2020 Target restated the 2017 baseline Scope 2(market-based) total.
C5.2
(C5.2) Select the name of the standard, protocol, or methodology you have used to collect activity data and calculate emissions.The Climate Registry: General Reporting Protocol
C6. Emissions data
C6.1
(C6.1) What were your organization’s gross global Scope 1 emissions in metric tons CO2e?
Reporting year
Gross global Scope 1 emissions (metric tons CO2e)752552
Start date<Not Applicable>
End date<Not Applicable>
Comment
C6.2
CDP Page of 5231

(C6.2) Describe your organization’s approach to reporting Scope 2 emissions.
Row 1
Scope 2, location-based We are reporting a Scope 2, location-based figure
Scope 2, market-basedWe are reporting a Scope 2, market-based figure
CommentTarget continues to collect supplier-specific emission factors compliant with the GHG Protocol Scope 2 Guidance Emission Factor Hierarchy. We have led efforts with peercompanies and the Edison Electric Institute to increase the reporting of these emission factors within the United States.
C6.3
(C6.3) What were your organization’s gross global Scope 2 emissions in metric tons CO2e?
Reporting year
Scope 2, location-based1680682
Scope 2, market-based (if applicable)1545898
Start date<Not Applicable>
End date<Not Applicable>
Comment
C6.4
(C6.4) Are there any sources (e.g. facilities, specific GHGs, activities, geographies, etc.) of Scope 1 and Scope 2 emissions that are within your selected reportingboundary which are not included in your disclosure?Yes
C6.4a
(C6.4a) Provide details of the sources of Scope 1 and Scope 2 emissions that are within your selected reporting boundary which are not included in yourdisclosure.
SourceNon-US Office Facilities
Relevance of Scope 1 emissions from this sourceEmissions are not relevant
Relevance of location-based Scope 2 emissions from this sourceEmissions are not relevant
Relevance of market-based Scope 2 emissions from this source (if applicable)Emissions are not relevant
Explain why this source is excludedOur current GHG disclosure does not include our facilities outside of the United States. This includes three buildings in India and several small offices scattered around theglobe. Based on electricity consumption estimates from all of these sources, they are considered de minimis, and likely would contribute significantly less than 1% of ouroverall Scope 1 and Scope 2 emissions.
C6.5
(C6.5) Account for your organization’s gross global Scope 3 emissions, disclosing and explaining any exclusions.
CDP Page of 5232

Purchased goods and services
Evaluation statusRelevant, calculated
Metric tonnes CO2e27389000
Emissions calculation methodologyEmissions from this category are comprised of both purchased goods and services for retail and non-retail. In 2019, our retail PG&S emissions were 26,363,000 metrictonnes CO2e and our non-retail emissions were 1,026,000 metric tonnes CO2e. Total emissions for retail and non-retail products were summed to provide a total set ofemissions for Target's purchased goods and services. Our absolute 30% reduction goal, approved by SBTi, is inclusive of only our Retail PG&S. For the majority of retailproducts, sales, and weights data split by Target's class level was used. For product classes without weights, estimates were calculated by using Department, Division andGroup level data. Product classes were then mapped to a secondary data set of life cycle emission factors. In cases where product classes did not map to the secondarydata, an estimated emission factor was generated using the median factor value from each group or were mapped to a Department level. The Target-mapped product classweights (units or kg) were then multiplied by the life cycle emission factors to provide GHG emissions for each class. The total emissions for each class was summed toprovide emissions for purchased retail products. For textile based retail products, an alternative approach was used where product fiber composition (fiber type andpercentage) and weight were mapped and multiplied against a corresponding fiber carbon footprint. For non-retail products, spend data was evaluated and allocated toappropriate sectors and then multiplied by Carnegie Mellon EE I/O emissions factors to estimate total emissions from non-retail spend. This figure does not include supplierreported emissions reductions as we use CDP Supply Chain and Higg Facility Environmental Module (FEM) data which is not available to us before CDP reporting. Targetwill be releasing an update on progress to our 30% absolute reduction target at the end of our fiscal year 2020.
Percentage of emissions calculated using data obtained from suppliers or value chain partners0
Please explainThese data points reflect our 2019 emissions. Due to timing of CDP Supply Chain data submission by suppliers, our comprehensive reduction analysis was not available toalign with our annual CR Report and our CDP Climate response. We will be releasing an update on progress to our 30% absolute reduction target at the end of our fiscalyear 2020.
Capital goods
Evaluation statusRelevant, calculated
Metric tonnes CO2e743000
Emissions calculation methodologyTarget’s capital goods spend was evaluated by pyramid to identify appropriate sector allocations and then multiplied by Carnegie Mellon EE I/O emission factors.
Percentage of emissions calculated using data obtained from suppliers or value chain partners0
Please explainThese data points reflect our 2019 emissions.
Fuel-and-energy-related activities (not included in Scope 1 or 2)
Evaluation statusRelevant, calculated
Metric tonnes CO2e509000
Emissions calculation methodologyEmissions were calculated for fuel-and-energy-related activities (not included in Scope 1 or 2) by totaling activity data for each Scope 1 fuel type and electricityconsumption by country. These totals were multiplied by their relevant specific emission factors from UK DEFRA / DECC 2017 Conversion Factors for Company Reporting.UK DEFRA factors were used since there are no equivalent factors within the US (e.g. US EPA) which provide life cycle or well-to-tank (WTT) factors for fuels consumed oremissions associated with electricity generation and transmission and distribution. GWPs are from the IPCC (2007) Fourth Assessment Report.
Percentage of emissions calculated using data obtained from suppliers or value chain partners0
Please explainThese data points reflect our 2019 emissions.
CDP Page of 5233

Upstream transportation and distribution
Evaluation statusRelevant, calculated
Metric tonnes CO2e1655000
Emissions calculation methodologyTarget’s retail products supplied by China are transported to the US east and west coasts by sea freight. There are three legs to this transportation: initially products areconsolidated on the ground in China and then transported by truck to the port; and then finally shipped to the US by sea. Calculations were completed by Target for each ofthese three legs as follows: Field Consolidation: Target considered points of origin for field consolidation (multi-stop pick-ups). The truck load volume is from historical data.Distance is estimated average distance we consider could cover 80% of the jobs. The distances are scaled up for a full year and then multiplied by a factor of 1.467 kg CO2per vehicle-mile (source: EPA). This only covers CO2 emissions. Fuel & LNG Truck: Target used total distance (km) for the LNG truck (only used the origins) and multipliedit by an emissions factor of 0.23 g CO2 per km and similarly, the same total distance was used and multiplied by 1.02 kg CO2 per km. The truck load volume is fromhistorical data and distance is estimated average distance and covers 80% of all jobs. Emission factors were sources from Nike. This only covers CO2 emissions. ContainerUtilization: Target’s sea container transport from China to US are allocated by a general percentage allocation of 65% of shipments to the US West Coast (USWC) and 35%to US East Coast (USEC). Total kg CO2 was calculated using the distance traveled (km) to each US coast was then multiplied by an appropriate 2015 BSR sourcedemissions factors: 0.118 kg CO2 per FEU-km for USWC and 0.158 kg CO2 per FEU-km for USWC. The reason why all of Asia is considered is because a large portion ofvolume is from Asia. For domestic transportation, four modes of transportation were evaluated: air, intermodal, less than a truck load, and full truck load. For each mode,distance traveled by product in miles was multiplied by product mass (short ton) for each trip segment. The sum of this product (ton-mile) by mode was multiplied byappropriate 2018 EPA emission factors for product transportation to provide associated GHG emissions. Domestic transportation emissions and emissions frominternational transportation by sea were summed for a total Scope 3 GHG impact for Target's upstream transportation and distribution activities.
Percentage of emissions calculated using data obtained from suppliers or value chain partners0
Please explainThese data points reflect our 2019 emissions.
Waste generated in operations
Evaluation statusRelevant, calculated
Metric tonnes CO2e271000
Emissions calculation methodologyTonnage of waste generated by treatment type of waste (e.g., recycling, incineration, landfill, etc.) may be used to calculate emissions from waste using methodologies andemission factors from the EPA's Waste Reduction Model (WARM), version 13, March 2015. Emissions factors are used directly from WARM with recycling emission factorscovering transportation emissions only. This model bases its emissions calculations on a life-cycle analysis, including emissions from the long-term decomposition of wastein a landfill and upstream sources/sinks. GWPs are from the IPCC (2007) Fourth Assessment Report.
Percentage of emissions calculated using data obtained from suppliers or value chain partners0
Please explainThese data points reflect our 2019 emissions.
Business travel
Evaluation statusRelevant, calculated
Metric tonnes CO2e22000
Emissions calculation methodologyTarget's passenger miles on commercial airlines was equivalent to 17,511 MT C02e in 2019. Emissions factors from U.S. EPA Climate Leaders Business Travel Modulewere used in these calculations. GWPs are from the IPCC Fourth Assessment Report. Radiative forcing adjustment to the airline travel emissions were not applied. Thisindirect GHG emissions data only includes corporate employee air travel. Gases included in the calculation include: CO2, CH4 and N2O. Target also has spend data foremployee mileage reimbursement from business travel via car. This total spend was multiplied by Carnegie Mellon EE I/O factor for "travel arrangement and reservationservices". This result was added to the business air travel for total emission from business travel to get a total of 22,016 MT C02e.
Percentage of emissions calculated using data obtained from suppliers or value chain partners0
Please explainThese data points reflect our 2019 emissions.
Employee commuting
Evaluation statusRelevant, calculated
Metric tonnes CO2e585000
Emissions calculation methodologyAssume average distance travelled per year per employee. Distribute % of employees to different transport methods (based on Bureau of Transport Statistics figures), andthen multiply total distance per year per transport methods by the appropriate emissions factors. Emissions factors from U.S. EPA Climate Leaders Business Travel Modulewere used in these calculations. GWPs are from the IPCC Fourth Assessment Report.
Percentage of emissions calculated using data obtained from suppliers or value chain partners0
Please explainThese data points reflect our 2019 emissions.
CDP Page of 5234

Upstream leased assets
Evaluation statusNot relevant, explanation provided
Metric tonnes CO2e<Not Applicable>
Emissions calculation methodology<Not Applicable>
Percentage of emissions calculated using data obtained from suppliers or value chain partners<Not Applicable>
Please explainTarget’s upstream leased assets are accounted for in our Scope 1 and Scope 2 emissions.
Downstream transportation and distribution
Evaluation statusRelevant, calculated
Metric tonnes CO2e5672000
Emissions calculation methodologyThis calculation includes emissions from guests travelling to Target stores to shop and emissions from online purchases shipped to guests by both air and ground (truck).Emissions from guests travelling to Target stores were calculated by using trip count in FY2019. Trip count was then multiplied by average miles travelled by guests by car,bus and light rail. The product of the weighted transactions, average miles travelled by mode by an appropriate EPA product transport emissions factor. For onlinepurchases, the shipment count was used. An average distance of 7.5 miles (representing average last mile distances of Target's ecommerce fulfilment centers) wasestimated. The shipment count was multiplied by the average distance and average weight and then this product was multiplied by an appropriate EPA product transportemissions factor. The resultant emissions for each Target Group were summed to provide the total GHG emissions from shipping products purchased online by truck to thecustomer. A similar calculation methodology was applied to products purchased online and shipped by air. It was assumed that the products would travel by intermodaltruck to airport of departure from distribution center and to customer from destination airport. A similar approach and set of assumptions used for ground shipping wasapplied to the intermodal portion. Average product weights per Target Group were applied as before, utilizing FY2017 sales data. The average distance by air wasmultiplied by average product weight and by the weighted transactions and finally by the appropriate EPA product transport emissions factor. The similar methodology wasapplied for the intermodal truck. All emissions by air and intermodal truck for each of the Target Groups were summed to provide the total GHG emissions from productspurchased online and shipped by air and intermodal truck to the customer.
Percentage of emissions calculated using data obtained from suppliers or value chain partners0
Please explainThese data points reflect our 2019 emissions.
Processing of sold products
Evaluation statusNot relevant, explanation provided
Metric tonnes CO2e<Not Applicable>
Emissions calculation methodology<Not Applicable>
Percentage of emissions calculated using data obtained from suppliers or value chain partners<Not Applicable>
Please explainTarget does not sell intermediate products.
Use of sold products
Evaluation statusRelevant, calculated
Metric tonnes CO2e12897000
Emissions calculation methodologyThis calculation utilized a mix of primary data (i.e. sample of wattage for energy using products sold by Target, as well as sales quantities and weight) and secondary data(i.e. various estimates for average lifetime of products groups and estimates for average annual usage for product groups). Target's sales data by class was summed, andthen, classes which contained wattage data were manually identified using a mixture of assumptions and manual searching of the product inventory. When a class hadsome wattage data an assumption was made to determine percentage of total number of products that should have wattage data that sample represents (e.g., only 3%percent of Electric Shave items had wattage data, so this would be uplifted to account for 100% percent of electric shave items). Estimates of the lifetime energy use usingthe wattage data provided were multiplied by estimated annual hours, and in some cases a standby Wattage is added. Wattage data by merchandise type was footprinteddue to the inability to reasonably generate ‘usage profiles’ by class type. Products with ‘no wattage data’ available, were footprinted by class, and assigned a basichigh/medium/low footprint to these products. In both instances wattage (incl. those projected) were multiplied by an appropriate EPA electricity emissions factor and theresults of each were summed to provide total estimate of emissions from the use of products sold by Target. GWPs are from the IPCC Fourth Assessment Report.
Percentage of emissions calculated using data obtained from suppliers or value chain partners0
Please explainThese data points reflect our 2019 emissions.
CDP Page of 5235

End of life treatment of sold products
Evaluation statusRelevant, calculated
Metric tonnes CO2e2306000
Emissions calculation methodologyEach product sold was allocated with a weight and material type. An average for Department/Division/Class was used if this information was not available. The materialweight was multiplied by an appropriate US EPA WARM Emission Factor (version released March 2020) – that is weighted by waste destination (based on US EPAresearch into waste destinations) to calculate tonnes of CO2e per tonne of material disposed, by destination and material. GWPs are from the IPCC (2007) FourthAssessment Report.
Percentage of emissions calculated using data obtained from suppliers or value chain partners0
Please explainThese data points reflect our 2019 emissions.
Downstream leased assets
Evaluation statusNot relevant, explanation provided
Metric tonnes CO2e<Not Applicable>
Emissions calculation methodology<Not Applicable>
Percentage of emissions calculated using data obtained from suppliers or value chain partners<Not Applicable>
Please explainTarget does not lease any significant number of assets to other tenants that are not already included in Target's Scope 1 and 2 inventory under the operational controlapproach.
Franchises
Evaluation statusNot relevant, explanation provided
Metric tonnes CO2e<Not Applicable>
Emissions calculation methodology<Not Applicable>
Percentage of emissions calculated using data obtained from suppliers or value chain partners<Not Applicable>
Please explainTarget does not operate any franchises.
Investments
Evaluation statusNot relevant, explanation provided
Metric tonnes CO2e<Not Applicable>
Emissions calculation methodology<Not Applicable>
Percentage of emissions calculated using data obtained from suppliers or value chain partners<Not Applicable>
Please explainNo investments made in 2019 not already captured in Scope 1 or Scope 2
Other (upstream)
Evaluation status
Metric tonnes CO2e<Not Applicable>
Emissions calculation methodology<Not Applicable>
Percentage of emissions calculated using data obtained from suppliers or value chain partners<Not Applicable>
Please explain
CDP Page of 5236

Other (downstream)
Evaluation status
Metric tonnes CO2e<Not Applicable>
Emissions calculation methodology<Not Applicable>
Percentage of emissions calculated using data obtained from suppliers or value chain partners<Not Applicable>
Please explain
C6.7
(C6.7) Are carbon dioxide emissions from biogenic carbon relevant to your organization?No
C6.10
(C6.10) Describe your gross global combined Scope 1 and 2 emissions for the reporting year in metric tons CO2e per unit currency total revenue and provide anyadditional intensity metrics that are appropriate to your business operations.
Intensity figure0.00763
Metric numerator (Gross global combined Scope 1 and 2 emissions, metric tons CO2e)2298450
Metric denominatorsquare foot
Metric denominator: Unit total301414905
Scope 2 figure usedMarket-based
% change from previous year9.71
Direction of changeDecreased
Reason for changeThis decrease is consistent with the absolute reduction in scope 1 & 2 emissions. As described in table C7.9a Target saw a reduction in absolute emissions as a result ofincreased use of renewable electricity and energy efficiency investments.
C7. Emissions breakdowns
C7.1
(C7.1) Does your organization break down its Scope 1 emissions by greenhouse gas type?Yes
C7.1a
(C7.1a) Break down your total gross global Scope 1 emissions by greenhouse gas type and provide the source of each used greenhouse warming potential(GWP).
Greenhouse gas Scope 1 emissions (metric tons of CO2e) GWP Reference
CO2 283427 IPCC Fourth Assessment Report (AR4 - 100 year)
CH4 132 IPCC Fourth Assessment Report (AR4 - 100 year)
N2O 523 IPCC Fourth Assessment Report (AR4 - 100 year)
HFCs 468470 IPCC Fourth Assessment Report (AR4 - 100 year)
C7.2
CDP Page of 5237

(C7.2) Break down your total gross global Scope 1 emissions by country/region.
Country/Region Scope 1 emissions (metric tons CO2e)
United States of America 752552
C7.3
(C7.3) Indicate which gross global Scope 1 emissions breakdowns you are able to provide.By activity
C7.3c
(C7.3c) Break down your total gross global Scope 1 emissions by business activity.
Activity Scope 1 emissions (metric tons CO2e)
Stationary Combustion 242612
Mobile Sources 41470
Refrigerants 468470
C7.5
(C7.5) Break down your total gross global Scope 2 emissions by country/region.
Country/Region Scope 2, location-based(metric tons CO2e)
Scope 2, market-based(metric tons CO2e)
Purchased and consumed electricity,heat, steam or cooling (MWh)
Purchased and consumed low-carbon electricity, heat, steam or coolingaccounted for in Scope 2 market-based approach (MWh)
United States ofAmerica
1680682 1545898 4077385 3664070
C7.6
(C7.6) Indicate which gross global Scope 2 emissions breakdowns you are able to provide.By activity
C7.6c
(C7.6c) Break down your total gross global Scope 2 emissions by business activity.
Activity Scope 2, location-based (metric tons CO2e) Scope 2, market-based (metric tons CO2e)
Electricity 1676067 1541283
Steam 2852 2852
Chilled Water 1762 1762
C7.9
(C7.9) How do your gross global emissions (Scope 1 and 2 combined) for the reporting year compare to those of the previous reporting year?Decreased
C7.9a
CDP Page of 5238

(C7.9a) Identify the reasons for any change in your gross global emissions (Scope 1 and 2 combined), and for each of them specify how your emissions compareto the previous year.
Change inemissions(metrictonsCO2e)
Directionof change
Emissionsvalue(percentage)
Please explain calculation
Change inrenewableenergyconsumption
69708 Decreased 3 Reductions from the increase in Target’s retired RECs total from 2019 to 2018 multiplied by the average value of the market-based Scope 2 emissions/MWh.
Otheremissionsreductionactivities
21143 Decreased 0.9 Estimate of reduced emissions resulting from energy efficiency investments
Divestment <NotApplicable>
Acquisitions <NotApplicable>
Mergers <NotApplicable>
Change inoutput
<NotApplicable>
Change inmethodology
<NotApplicable>
Change inboundary
<NotApplicable>
Change inphysicaloperatingconditions
<NotApplicable>
Unidentified 149117 Decreased 6.5 Target saw additional emissions reductions outside of increased energy efficiency and renewable energy efforts. This reduction is likely due to a combination ofchanges in energy consumption due to weather or operating hours, reduction in the CO2e intensity of electricity supplied by Target’s utilities, improvedefficiencies outside of the direct energy efficiency investment program, and other sources. The 149,117 value in this row is the difference of the absolutechange between 2019 and 2018 Scope 1 and 2 inventories (-239,968) and the measured energy efficiency and renewable energy projects listed in the rowsabove.
Other <NotApplicable>
C7.9b
(C7.9b) Are your emissions performance calculations in C7.9 and C7.9a based on a location-based Scope 2 emissions figure or a market-based Scope 2emissions figure?Market-based
C8. Energy
C8.1
(C8.1) What percentage of your total operational spend in the reporting year was on energy?More than 0% but less than or equal to 5%
C8.2
(C8.2) Select which energy-related activities your organization has undertaken.
Indicate whether your organization undertook this energy-related activity in the reporting year
Consumption of fuel (excluding feedstocks) Yes
Consumption of purchased or acquired electricity Yes
Consumption of purchased or acquired heat Yes
Consumption of purchased or acquired steam Yes
Consumption of purchased or acquired cooling Yes
Generation of electricity, heat, steam, or cooling Yes
CDP Page of 5239

C8.2a
(C8.2a) Report your organization’s energy consumption totals (excluding feedstocks) in MWh.
Heating value MWh from renewable sources MWh from non-renewable sources Total (renewable and non-renewable) MWh
Consumption of fuel (excluding feedstock) HHV (higher heating value) 1498552 1498552
Consumption of purchased or acquired electricity <Not Applicable> 298801 3931637
Consumption of purchased or acquired heat <Not Applicable>
Consumption of purchased or acquired steam <Not Applicable> 15739 15739
Consumption of purchased or acquired cooling <Not Applicable> 15496 15496
Consumption of self-generated non-fuel renewable energy <Not Applicable> 114514 <Not Applicable> 114514
Total energy consumption <Not Applicable> 5575937
C8.2b
(C8.2b) Select the applications of your organization’s consumption of fuel.
Indicate whether your organization undertakes this fuel application
Consumption of fuel for the generation of electricity Yes
Consumption of fuel for the generation of heat Yes
Consumption of fuel for the generation of steam No
Consumption of fuel for the generation of cooling No
Consumption of fuel for co-generation or tri-generation No
C8.2c
(C8.2c) State how much fuel in MWh your organization has consumed (excluding feedstocks) by fuel type.
Fuels (excluding feedstocks)Diesel
Heating valueHHV (higher heating value)
Total fuel MWh consumed by the organization172185
MWh fuel consumed for self-generation of electricity
MWh fuel consumed for self-generation of heat
MWh fuel consumed for self-generation of steam<Not Applicable>
MWh fuel consumed for self-generation of cooling<Not Applicable>
MWh fuel consumed for self-cogeneration or self-trigeneration<Not Applicable>
Emission factor22.51
Unitlb CO2 per gallon
Emissions factor sourceEPA - CCL
Comment
Fuels (excluding feedstocks)Natural Gas
Heating valueHHV (higher heating value)
Total fuel MWh consumed by the organization1318227
MWh fuel consumed for self-generation of electricity
MWh fuel consumed for self-generation of heat
MWh fuel consumed for self-generation of steam<Not Applicable>
CDP Page of 5240

MWh fuel consumed for self-generation of cooling<Not Applicable>
MWh fuel consumed for self-cogeneration or self-trigeneration<Not Applicable>
Emission factor53.11
Unitkg CO2e per million Btu
Emissions factor sourceEPA - CCL
Comment
Fuels (excluding feedstocks)Propane Gas
Heating valueHHV (higher heating value)
Total fuel MWh consumed by the organization8140
MWh fuel consumed for self-generation of electricity
MWh fuel consumed for self-generation of heat
MWh fuel consumed for self-generation of steam<Not Applicable>
MWh fuel consumed for self-generation of cooling<Not Applicable>
MWh fuel consumed for self-cogeneration or self-trigeneration<Not Applicable>
Emission factor63.3
Unitkg CO2e per million Btu
Emissions factor sourceEPA - CCL
Comment
C8.2d
(C8.2d) Provide details on the electricity, heat, steam, and cooling your organization has generated and consumed in the reporting year.
Total Gross generation(MWh)
Generation that is consumed by theorganization (MWh)
Gross generation from renewable sources(MWh)
Generation from renewable sources that is consumed by theorganization (MWh)
Electricity 283393 283393 114514 114514
Heat
Steam
Cooling
C8.2e
CDP Page of 5241

(C8.2e) Provide details on the electricity, heat, steam, and/or cooling amounts that were accounted for at a zero emission factor in the market-based Scope 2figure reported in C6.3.
Sourcing methodOther, please specify (Off-grid energy consumption from an on-site installation or through a direct line to an off-site generator owned by another company )
Low-carbon technology typeSolar
Country/region of consumption of low-carbon electricity, heat, steam or coolingNorth America
MWh consumed accounted for at a zero emission factor114514
CommentOnsite solar
Sourcing methodPower purchase agreement (PPA) with a grid-connected generator with energy attribute certificates
Low-carbon technology typeWind
Country/region of consumption of low-carbon electricity, heat, steam or coolingNorth America
MWh consumed accounted for at a zero emission factor286636
Comment2019 RECs from Target’s two operating virtual power purchase agreements: Stephen’s Ranch Wind Farm and Solomon Forks Wind Farm.
Sourcing methodGreen electricity products (e.g. green tariffs) from an energy supplier, supported by energy attribute certificates
Low-carbon technology typeSolar
Country/region of consumption of low-carbon electricity, heat, steam or coolingNorth America
MWh consumed accounted for at a zero emission factor6578
Comment2019 RECs from Target’s active solar green tariff agreements with Xcel Energy – Colorado and Georgia Power.
Sourcing methodGreen electricity products (e.g. green tariffs) from an energy supplier, supported by energy attribute certificates
Low-carbon technology typeWind
Country/region of consumption of low-carbon electricity, heat, steam or coolingNorth America
MWh consumed accounted for at a zero emission factor5587
CommentRECs from Target’s green tariff with Puget Sound Energy.
Sourcing methodOther, please specify (Grid Mix of Renewable Electricity )
Low-carbon technology typeOther, please specify (Solar PV, Wind, Hydropower, Nuclear, Biomass)
Country/region of consumption of low-carbon electricity, heat, steam or coolingNorth America
MWh consumed accounted for at a zero emission factor675707
CommentTarget uses the U.S. Energy Information Administration’s Annual Energy Outlook report for grid renewables data. The January 2020 AEO reported 18.6% renewableelectricity generation. Target applied the 18.6% to Target’s electricity usage total after subtracting the RECs from Target’s onsite solar projects, VPPAs, and green tariffs.
C9. Additional metrics
C9.1
CDP Page of 5242

(C9.1) Provide any additional climate-related metrics relevant to your business.
DescriptionEnergy usage
Metric value516
Metric numeratorNumber of Target locations with solar
Metric denominator (intensity metric only)
% change from previous year
Direction of change<Not Applicable>
Please explainGrowing our solar program is a big priority for us. In 2019, we added more than 26 MW of solar, increasing our total solar capacity to over 85 MW. In some cases, Targetmay generate the solar energy in support of utility and state clean energy programs and policies. In those instances, we do not retain the renewable energy credits. In 2019,we met our goal to reach 500 buildings with rooftop solar panels by 2020, with 516 projects completed at the end of fiscal year 2019.
DescriptionOther, please specify (Electric Vehicle Charging Locations)
Metric value74
Metric numeratorLocations with EV charging stations
Metric denominator (intensity metric only)
% change from previous year
Direction of change<Not Applicable>
Please explainWe are making advances in our electric vehicle infrastructure with the help of industry experts Tesla, ChargePoint and Electrify America. As of the end of 2019, our electricvehicle program spanned 74 sites in sixteen states, and we plan to expand our electric vehicle program over the next two years to more than 600 parking spaces withcharging stations at over 100 sites across more than 20 states.
C10. Verification
C10.1
(C10.1) Indicate the verification/assurance status that applies to your reported emissions.
Verification/assurance status
Scope 1 Third-party verification or assurance process in place
Scope 2 (location-based or market-based) Third-party verification or assurance process in place
Scope 3 Third-party verification or assurance process in place
C10.1a
CDP Page of 5243

(C10.1a) Provide further details of the verification/assurance undertaken for your Scope 1 emissions, and attach the relevant statements.
Verification or assurance cycle in placeAnnual process
Status in the current reporting yearComplete
Type of verification or assuranceLimited assurance
Attach the statementGHGVerificationStatement Target 2019_Final.pdf
Page/ section referenceSee attached for verification
Relevant standardThe Climate Registry's General Verification Protocol
Proportion of reported emissions verified (%)100
C10.1b
(C10.1b) Provide further details of the verification/assurance undertaken for your Scope 2 emissions and attach the relevant statements.
Scope 2 approachScope 2 location-based
Verification or assurance cycle in placeAnnual process
Status in the current reporting yearComplete
Type of verification or assuranceLimited assurance
Attach the statementGHG 2017-2018 Restatement Verification Statement_Final.pdfGHGVerificationStatement Target 2019_Final.pdf
Page/ section referenceSee attached for verification
Relevant standardThe Climate Registry's General Verification Protocol
Proportion of reported emissions verified (%)100
Scope 2 approachScope 2 market-based
Verification or assurance cycle in placeAnnual process
Status in the current reporting yearComplete
Type of verification or assuranceLimited assurance
Attach the statementGHG 2017-2018 Restatement Verification Statement_Final.pdfGHGVerificationStatement Target 2019_Final.pdf
Page/ section referenceSee attached for verification
Relevant standardThe Climate Registry's General Verification Protocol
Proportion of reported emissions verified (%)100
C10.1c
CDP Page of 5244
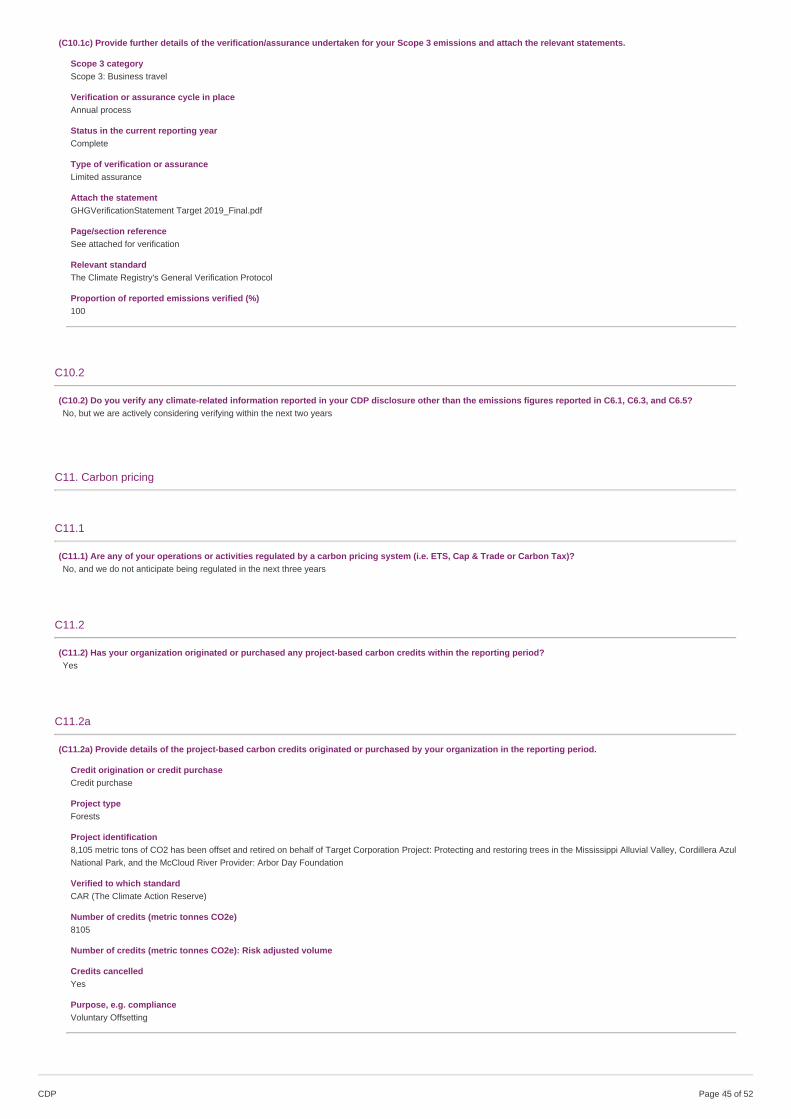
(C10.1c) Provide further details of the verification/assurance undertaken for your Scope 3 emissions and attach the relevant statements.
Scope 3 categoryScope 3: Business travel
Verification or assurance cycle in placeAnnual process
Status in the current reporting yearComplete
Type of verification or assuranceLimited assurance
Attach the statementGHGVerificationStatement Target 2019_Final.pdf
Page/section referenceSee attached for verification
Relevant standardThe Climate Registry's General Verification Protocol
Proportion of reported emissions verified (%)100
C10.2
(C10.2) Do you verify any climate-related information reported in your CDP disclosure other than the emissions figures reported in C6.1, C6.3, and C6.5?No, but we are actively considering verifying within the next two years
C11. Carbon pricing
C11.1
(C11.1) Are any of your operations or activities regulated by a carbon pricing system (i.e. ETS, Cap & Trade or Carbon Tax)?No, and we do not anticipate being regulated in the next three years
C11.2
(C11.2) Has your organization originated or purchased any project-based carbon credits within the reporting period?Yes
C11.2a
(C11.2a) Provide details of the project-based carbon credits originated or purchased by your organization in the reporting period.
Credit origination or credit purchaseCredit purchase
Project typeForests
Project identification8,105 metric tons of CO2 has been offset and retired on behalf of Target Corporation Project: Protecting and restoring trees in the Mississippi Alluvial Valley, Cordillera AzulNational Park, and the McCloud River Provider: Arbor Day Foundation
Verified to which standardCAR (The Climate Action Reserve)
Number of credits (metric tonnes CO2e)8105
Number of credits (metric tonnes CO2e): Risk adjusted volume
Credits cancelledYes
Purpose, e.g. complianceVoluntary Offsetting
CDP Page of 5245

C11.3
(C11.3) Does your organization use an internal price on carbon?No, and we do not currently anticipate doing so in the next two years
C12. Engagement
C12.1
(C12.1) Do you engage with your value chain on climate-related issues?Yes, our suppliersYes, our customers
C12.1a
(C12.1a) Provide details of your climate-related supplier engagement strategy.
Type of engagementCompliance & onboarding
Details of engagementCode of conduct featuring climate change KPIsClimate change is integrated into supplier evaluation processes
% of suppliers by number
% total procurement spend (direct and indirect)
% of supplier-related Scope 3 emissions as reported in C6.5
Rationale for the coverage of your engagementTarget’s Standards of Vendor Engagement (SOVE) includes both tier 1 and 2 suppliers in our supply chain. Our SOVE covers topics that pertain to energy and climate,including: energy management, emissions to air, as well as environmental management and monitoring systems. Target audits contain questions to measure adherence tothese standards.
Impact of engagement, including measures of successTarget’s Standards of Vendor Engagement require suppliers have ENV management systems, meet regulatory requirements for air emissions and monitor energy use.Target monitors our SOVE through our Responsible Sourcing audit. In 2019, we conducted 2082 audits.
CommentTarget’s Standards of Vendor Engagement (SOVE) includes both tier 1 and 2 suppliers in our supply chain. Our SOVE covers topics that pertain to energy and climate,including: energy management, emissions to air, as well as environmental management and monitoring systems. Target audits contain questions to measure adherence tothese standards.
Type of engagementCompliance & onboarding
Details of engagementClimate change is integrated into supplier evaluation processes
% of suppliers by number
% total procurement spend (direct and indirect)
% of supplier-related Scope 3 emissions as reported in C6.5
Rationale for the coverage of your engagementAll owned brand suppliers are part of Target’s supplier scorecard.
Impact of engagement, including measures of successAll owned brand suppliers are part of Target’s supplier scorecard.
CommentHigg Facilities Environmental Module (FEM) completion of the self-assessment is integrated into internal supplier performance metrics.
Type of engagementInformation collection (understanding supplier behavior)
Details of engagementCollect climate change and carbon information at least annually from suppliers
% of suppliers by number
% total procurement spend (direct and indirect)
% of supplier-related Scope 3 emissions as reported in C6.5
CDP Page of 5246

Rationale for the coverage of your engagementHigg FEM self-assessment is requested, annually from all our manufacturing locations that produce Target owned brand products (except food & FDA regulated), nationalbrand products where Target is the importer of record, as well as apparel tier 2 factories.
Impact of engagement, including measures of successIn 2019, Higg FEM assessment was sent to 3000 factories for completion, and the adoption rate was 60%.
CommentHigg FEM self-assessment is requested, annually from all our manufacturing locations that produce Target owned brand products (except food & FDA regulated), nationalbrand products where Target is the importer of record, as well as apparel tier 2 factories.
Type of engagementEngagement & incentivization (changing supplier behavior)
Details of engagementRun an engagement campaign to educate suppliers about climate change
% of suppliers by number
% total procurement spend (direct and indirect)
% of supplier-related Scope 3 emissions as reported in C6.5
Rationale for the coverage of your engagementResponsible Sourcing & Sustainability conducts Climate and Energy trainings for new suppliers and factories, and an annual update for existing suppliers within ourmanufacturing supply chain. This entails a comprehensive training on our climate goals and the commitment required from our suppliers and factories. In terms of climateand energy, on boarding training focuses on setting science-based targets and reporting via the annual CDP climate questionnaire at the supplier level, as well ascompleting the Higg FEM self-assessment at the factory level. In addition, existing suppliers received a refresher that covered Supply chain visibility and SOVE training.
Impact of engagement, including measures of successIn 2019, we completed 11 on boarding sessions that provided training for 610 attendees. This training covers 100% of suppliers that produce Target owned brands, as wellas national brands where Target is the importer of record.
CommentResponsible Sourcing & Sustainability conducts Climate and Energy trainings for new suppliers and factories, and an annual update for existing suppliers within ourmanufacturing supply chain. This entails a comprehensive training on our climate goals and the commitment required from our suppliers and factories. In terms of climateand energy, on boarding training focuses on setting science-based targets and reporting via the annual CDP climate questionnaire at the supplier level, as well ascompleting the Higg FEM self-assessment at the factory level. In addition, existing suppliers received a refresher that covered Supply chain visibility and SOVE training.
Type of engagementEngagement & incentivization (changing supplier behavior)
Details of engagementRun an engagement campaign to educate suppliers about climate change
% of suppliers by number100
% total procurement spend (direct and indirect)100
% of supplier-related Scope 3 emissions as reported in C6.5100
Rationale for the coverage of your engagementTarget developed training tools and resources to educate our suppliers on climate and energy reporting. All Target business partners and suppliers have access to ourpartners online platform, where these resources were made available. We also did some targeted engagement of all our suppliers in scope for the supplier engagementgoal to spread awareness of the resources. (Target Commits that 80% of suppliers, by spend will set science-based scope 1 and 2 targets by 2023). This entails 650+suppliers within owned brand, national brand and non-retail sectors of our business.
Impact of engagement, including measures of successThese resources include supporting guidance materials that are tailored to specific segments of business partners (at different stages of maturity on GHG inventory andsetting science-based targets, in addition to sector-specific reporting guidance). Target also conducted live CDP reporting webinars in both English and Mandarin toaccommodate a broader spectrum of suppliers.
CommentThese resources include supporting guidance materials that are tailored to specific segments of business partners (at different stages of maturity on GHG inventory andsetting science-based targets, in addition to sector-specific reporting guidance). Target also conducted live CDP reporting webinars in both English and Mandarin toaccommodate a broader spectrum of suppliers.
Type of engagementOther, please specify (Manufacturing performance improvement programs)
Details of engagementOther, please specify (Partnered with Apparel Impact Institute to implement efficiency programs for key supplier’s factories. )
% of suppliers by number
% total procurement spend (direct and indirect)
% of supplier-related Scope 3 emissions as reported in C6.5
Rationale for the coverage of your engagementOur Responsible Sourcing & Sustainability team selects factories to participate in the Apparel Impact Institute (Aii) programs, as well as Vietnam Improvement Project (VIP)and Cambodia Improvement Project (CIP). Factories are prioritized and selected based on their emission footprint within the manufacturing stage. Higg FEM data is utilizedto identify high impact factories to be prioritized for manufacturing performance improvement programs.
Impact of engagement, including measures of success
CDP Page of 5247

In 2019, we completed VIP in 25 factories, that accounted for 24% savings compared to baseline, and energy savings of 63,759,405 KwH/yr. Similarly, with Aii programs,that were completed by the end of 2019, savings accounted for 12% savings relative to baseline, and total energy savings of 273,610,995 KwH/yr. In 2019, we alsoexpanded programs to Cambodia with 10 new factories, while continuing our efforts in Vietnam with 7 new factories in phase 1 of the program. In 2019, with VIP, wesuccessfully initiated phase 2 of VIP with 6 factories (advanced phase of VIP that engages partners on more advanced energy efficiency programs). In four of thesefactories we have initiated renewable energy options, to install solar panels to further reduce their carbon footprint. In 2019, we have continued our work with the ApparelImpact Institute in China and Taiwan, while expanding our work to India. In 2019, we implemented process improvement programs that enable energy efficiencies with atotal of 27 textile suppliers, with the Apparel Impact Institute.
CommentTarget is a founding and a strategic supporter of the Apparel Impact Institute (Aii). Through the mill program initiative of Aii we identify practical, cost-saving opportunitiesfor our manufacturers to increase operational efficiencies in their factories, while reducing resource usage, waste and emissions. Target contributes towards the programcost for a factory to complete the program, and offers program monitoring and strategic guidance. Target collaborated with International Financial Corporation’s (IFC’s)Vietnam Improvement Program (VIP) which focuses on improving manufacturing process efficiencies. We expanded this program with IFC to Cambodia in 2019 with theCambodia Improvement Program (CIP). Target contributes to the program cost for a given factory to complete CIP or VIP programs, and provides program monitoring andstrategic guidance. We are awaiting figures on more energy savings when the current round of programs concludes.
Type of engagementInformation collection (understanding supplier behavior)
Details of engagementCollect climate change and carbon information at least annually from suppliers
% of suppliers by number
% total procurement spend (direct and indirect)80
% of supplier-related Scope 3 emissions as reported in C6.581
Rationale for the coverage of your engagementTo track progress against out supplier engagement climate goal, we requested all suppliers that are in scope for this goal (top 80% of our spend) to disclose their climateperformance via the CDP Supply Chain Climate Survey.
Impact of engagement, including measures of successIn 2018 we started by sending the CDP Supply Chain Climate survey to a pilot group of 350 suppliers. Then in 2019 we expanded that to include our top 80% of oursuppliers by spend that are in scope for our supplier engagement goal. In 2019, we had a 51% response rate among our 627 suppliers that were requested. Each year wewill refine our data collection and feedback process to better work with our suppliers and continue to increase our engagement and response rate. Our vendors thatcomprise our top 80% of spend make up 81% of our PG&S footprint and 40% of our total Scope 3 footprint.
CommentSince becoming a lead member of the CDP Supply Chain program in 2018, we have continued to expand the scope of suppliers we engage. Target will utilize this data toinform Scope 3 targets and gain greater visibility into our supply chain emissions, as we work to reduce our GHG footprint and accelerate the transition to a low-carboneconomy.
Type of engagementEngagement & incentivization (changing supplier behavior)
Details of engagementOther, please specify (SBTi Goal)
% of suppliers by number
% total procurement spend (direct and indirect)80
% of supplier-related Scope 3 emissions as reported in C6.581
Rationale for the coverage of your engagementIn order to cover two-thirds of our Scope 3 emissions, we set both an absolute reduction goal and a supplier engagement goal. Scope 3 Absolute Reduction goal of 30% &Supplier Goals for the top 80% of suppliers to set Scope 1 &2 science-based targets
Impact of engagement, including measures of successWe will also work with our suppliers, where 94 percent of our GHG emissions occur, to transition to renewable energy sources and implement their own emissions reductionprojects in order to reduce Scope 3 emissions across our global supply chain. At the end of fiscal 2019, suppliers equating to 17% of the spend goal had set science-basedtargets. Our vendors that comprise our top 80% of spend make up 81% of our PG&S footprint and 40% of our total Scope 3 footprint.
CommentBy unifying our suppliers around the same goals, whether they are working with the raw materials that create our products or manufacturing and transporting thoseproducts to our shelves, we know we can drive even greater change that will support improved environmental outcomes.
C12.1b
CDP Page of 5248

(C12.1b) Give details of your climate-related engagement strategy with your customers.
Type of engagementEducation/information sharing
Details of engagementShare information about your products and relevant certification schemes (i.e. Energy STAR)
% of customers by number
% of customer - related Scope 3 emissions as reported in C6.5
Portfolio coverage (total or outstanding)<Not Applicable>
Please explain the rationale for selecting this group of customers and scope of engagement
Impact of engagement, including measures of successTarget works with electric utilities across the country to promote LED light bulbs through the utilities’ energy efficiency programs. On a monthly basis Target runspromotions in over 500 stores in conjunction with utilities. In 2019, Target worked with the electric utility Puget Sound Energy on two in-store LED distribution events at 6stores, reaching over 4,000 customers directly with energy efficiency product information from the utility’s representatives.
C12.3
(C12.3) Do you engage in activities that could either directly or indirectly influence public policy on climate-related issues through any of the following?Direct engagement with policy makersTrade associationsOther
C12.3a
(C12.3a) On what issues have you been engaging directly with policy makers?
Focus oflegislation
Corporateposition
Details of engagement Proposed legislative solution
Cleanenergygeneration
Supportwith minorexceptions
In 2019, Target directly engaged in the following clean energy policies that included a joint letter to Minnesotalegislature urging action on climate change as a threat to our business. We joined with General Mills, Best Buy,Aveda, Cargill, Tennant Company, Uponor, Clif Bar and Ben & Jerry's on the letter, which attracted local newscoverage.
The policies Target advocated for in 2019 were increased clean energyoptions for businesses and customers in regulated electric markets, theexpansion of organized electric markets, and fair rates for solar energyproduction. Most of these policies are determined at state regulatoryproceedings in the U.S.
Cleanenergygeneration
Supportwith minorexceptions
Target contributed to regulatory comments to the Virginia State Corporation Commission group commentssupporting renewable energy tariffs that are favorable to customers and opposing efforts to reduce customerrenewable energy access in Virginia.
The policies Target advocated for in 2019 were increased clean energyoptions for businesses and customers in regulated electric markets, theexpansion of organized electric markets, and fair rates for solar energyproduction. Most of these policies are determined at state regulatoryproceedings in the U.S.
Cleanenergygeneration
Supportwith minorexceptions
Target signed a business-coalition letter to South Carolina legislature supporting the study of expanding energymarkets in the Southeast US.
The policies Target advocated for in 2019 were increased clean energyoptions for businesses and customers in regulated electric markets, theexpansion of organized electric markets, and fair rates for solar energyproduction. Most of these policies are determined at state regulatoryproceedings in the U.S.
Cleanenergygeneration
Supportwith minorexceptions
Target led a group of Minnesota businesses, cities, and Universities in response to a Minnesota Public UtilitiesCommission docket that proposed changes to how behind-the-meter solar energy is compensated. Over a twoyear effort we successfully defended the PV demand credit for demand-metered customers, which helps thefinancial case for Target and other commercial customers to expand solar energy investment in our home stateof Minnesota.
The policies Target advocated for in 2019 were increased clean energyoptions for businesses and customers in regulated electric markets, theexpansion of organized electric markets, and fair rates for solar energyproduction. Most of these policies are determined at state regulatoryproceedings in the U.S.
C12.3b
(C12.3b) Are you on the board of any trade associations or do you provide funding beyond membership?Yes
C12.3c
CDP Page of 5249

(C12.3c) Enter the details of those trade associations that are likely to take a position on climate change legislation.
Trade associationRetail Industry Leaders Association (RILA)
Is your position on climate change consistent with theirs?Consistent
Please explain the trade association’s positionRILA does not currently have a public position on climate change legislation because they have not been asked to develop one by their members. In their public resourcesand communities, they affirm climate change’s existence and the role of greenhouse gas emissions from the industry, and they develop tools, resources, guidance, industrycoalitions, and member spotlights to help minimize retailers’ carbon emissions. RILA also helped establish Employers for Renewable Energy (ERE), a cross-industrycoalition of which Target is a member, that represents job creators nationwide who support state policies that enable greater customer choice of renewable energy andstrong competition among producers.
How have you influenced, or are you attempting to influence their position?Target has company representation on RILA’s Sustainability, Responsible Sourcing, Energy Management and Environmental Compliance Committees.
Trade associationRenewable Energy Buyers Alliance (REBA)
Is your position on climate change consistent with theirs?Consistent
Please explain the trade association’s positionREBA is steadfastly working towards the creation of a resilient, zero-carbon energy system in collaboration with its membership. REBA’s goal is to catalyse 60 gigawatts(GW) of new renewable energy projects by 2025 and to unlock the energy market for all large-scale energy buyers by creating viable pathways to procurement.
How have you influenced, or are you attempting to influence their position?Target has company representation on REBA’s Advisory Board.
Trade associationEdison Electric Institute’s Customer Advisory Group
Is your position on climate change consistent with theirs?Unknown
Please explain the trade association’s positionIn 2019, Target worked with the EEI Customer Advisory Group and the World Resources Institute to create the first-ever US electric utility CO2 emission factor dataset forend use customers. The data pilot resulted in utilities that comprise 43% of US electric sales reporting their CO2 emission factors into the database. Having the emissionfactors in one place will help improve compliance with the emission factor hierarchy in the GHG Protocol Scope 2 guidance and bring more light to utility emissionsperformance.
How have you influenced, or are you attempting to influence their position?Target is active in the EEI customer advisory group.
Trade associationApparel Impact Institute
Is your position on climate change consistent with theirs?Consistent
Please explain the trade association’s positionApparel Impact Institute is a technical impact solution platform that brings brands, manufacturers and donors towards environmental infinitives within the apparel andfootwear industry. Target is a founding and a strategic collaborator of Aii. As an organization, Aii scales manufacturing impact programs for greater operational efficienciesin resource and energy. In terms of energy solutions, Aii offers manufacturers the opportunity to scale their performance improvements as a continuous improvementframework, ranging from simple to complex solutions. MIll impact program of Aii span across a number of countries such as China, Vietnam, Taiwan and India.
How have you influenced, or are you attempting to influence their position?Target has representation within Apparel Impact Institute’s board of directors, and on the Apparel Impact Roundtable (AIR). Target’s contributions include providingexpertise on Aii's vision and strategic direction, as well as funding beyond membership.
C12.3e
(C12.3e) Provide details of the other engagement activities that you undertake.
Target is also a member of the U.S. Environmental Protection Agency’s GreenChill Partnership, which promotes the use of low-GHG potential refrigerants. In 2019, Targethad three stores certified at the silver level, 24 at the gold level, and two at the platinum level.
C12.3f
(C12.3f) What processes do you have in place to ensure that all of your direct and indirect activities that influence policy are consistent with your overall climatechange strategy?
Target’s Energy & Sustainability, Government Affairs, and Corporate Responsibility teams have a standing quarterly meeting to align on energy and climate-related activitiesand to ensure Target’s Government Affairs representatives are informed of Target’s public commitments and key strategic initiatives. These quarterly meetings are inaddition to near-weekly informal check ins on active public policy initiatives.
CDP Page of 5250

C12.4
(C12.4) Have you published information about your organization’s response to climate change and GHG emissions performance for this reporting year in placesother than in your CDP response? If so, please attach the publication(s).
PublicationIn voluntary sustainability report
StatusUnderway – previous year attached
Attach the document2019_corporate_responsibility_report.pdf
Page/Section referencePlease see our 2019 CR Report attached.
Content elementsGovernanceStrategyEmissions figuresEmission targets
Comment
PublicationIn voluntary communications
StatusComplete
Attach the documentplanet.pdfWhy Target Stores Flipped the Switch to These Energy-Saving Lights.pdfTarget Partners Up to Bring New Workforce Development Center to North Minneapolis.pdfTarget Just Announced Our Most Ambitious Climate Goals Yet.pdfHere Comes The Sun_ Target Reaches 500 Solar Installations.pdfLarge Corporations Are Leading America’s Surge in Solar Deployment _ SEIA.pdfTarget Just Joined Industry Leaders in a Movement to Make Fashion More Sustainable.pdf
Page/Section reference
Content elementsStrategy
CommentAttached are various web pages from Target and external websites which discuss in various levels of detail Target’s strategy for combating climate change with energyefficiency measures and remodels, among other efforts.
C15. Signoff
C-FI
(C-FI) Use this field to provide any additional information or context that you feel is relevant to your organization's response. Please note that this field is optionaland is not scored.
C15.1
(C15.1) Provide details for the person that has signed off (approved) your CDP climate change response.
Job title Corresponding job category
Row 1 Vice President, Corporate Responsibility Chief Sustainability Officer (CSO)
Submit your response
In which language are you submitting your response?English
CDP Page of 5251

Please confirm how your response should be handled by CDP
I am submitting to Public or Non-Public Submission
I am submitting my response InvestorsCustomers
Public
Please confirm belowI have read and accept the applicable Terms
CDP Page of 5252