tapi working paper-yogesh - department of human … working paper...demographic characteristics of...
TRANSCRIPT


DEMOGRAPHIC CHARACTERISTICS
OF TAPI DISTRICT
Working Paper: 2
Yogesh N Vansiya
Bhavesh Parmar
Ashish Naik
CENTRE FOR HUMAN DEVELOPMENT STUDIES
Department of Human Resource Development Veer Narmad South Gujarat University
Surat – 395 007
August-2016

i
PREFACE
The Department of Human Resource Development is actively involved in undertaking research
projects and offering courses on research methodology. The focus of research is broadly in the
area of Human Development and Human Resource Development. It is felt that concentrated
efforts in understanding Human Development issues and processes is essential. Developmental
issues have regional characteristics. Hence, we thought to set up Centre for Human
Development Studies with a long-run objective to promote human development research and
provide platform for interdisciplinary studies. The Centre is expected to create adequate
database and promote suitable publications in the field of Human Development.
The Centre has brought out its second Working Paper on Demographic Characteristics of Tapi
District. It provides useful information on Demographic Status and its trends of Tapi District.
I hope, the researchers, students and policy makers find it useful. We have made our best
attempts to minimize statistical errors. Usual caveat applies for the error, if any, in this paper.
I take this opportunity to express my profound gratitude to the Vice Chancellor, Dr Dakshesh
Thakar, Pro Vice Chancellor Dr Bhaskar Raval and the University Syndicate for allowing the
Department to set up the Centre for Human Development Studies. This is a unique initiative by
the University that will bolster research in the areas of Human Development.
KIRAN PANDYA August 5, 2016
Honorary Director, CHDS
and
Head, Department of HRD

ii
ACKNOWLEDGEMENT
This working paper is a part of DHDR Tapi Project, under the department of HRD, VNSGU,
Surat. We express our gratitude to the Dr. Dakshesh R Thakar, Vice-Chancellor and Pro-Vice
Chancellor Dr. Bhaskar M Raval, Veer Narmad South Gujarat University, Surat. They took keen
interest to see that this research work is published in the form of 'Working Paper'. We are also
thankful to the university administration especially Mr. A V Dhaduk, In-charge Registrar for
their institutional support who helped us at each stage of publication. Authors gratefully
acknowledge Dr. Kiran Pandya Prof. & Head, Department of Human Resource Development, VNSGU,
Surat for providing the opportunity to work as the team members in DHDR of Tapi. While preparing
working paper he helped us in sorting out some difficulties regarding the research. He is also kind to check
the manuscript of our working paper and give incisive comments for its improvement.
Special thanks to Dr. Gaurang D Rami, Professor, Department of Economics, Veer Narmad South
Gujarat University, Surat and Dr. Smruti balsari Associate Professor, Department of HRD,
VNSGU, Surat, for being very helpful and extending support in the preparation of present
working paper.
We express our sincere thanks to Dr. S.S.Rao, Professor and head, (Department of Economics,
VNSGU, Surat), for his kind moral support. We also express our special thanks to Dr.
Nimisha Shukla (Prof. & Head, Department of Rural Economics, Gujarat Vidhyapith,
Ahmedabad) for her valuable guidance and moral support at different stages of our work. We
thank all those who have helped us directly or indirectly in completing our working paper. We
hope that the working paper is useful to policy makers, administrators, academicians, research
scholars and all those who are interested in issues of demography.
Yogesh N Vansiya
Bhavesh Parmar
Ashish Naik
Surat
5th
August 2016

iii
CONTENTS
Preface .................................................................................................................................. i
Acknowledgement ............................................................................................................... ii
List of Figures ..................................................................................................................... iv
Abbreviations used in the report ........................................................................................ v
1 Introduction .................................................................................................................. 1
2 Research Issues ............................................................................................................. 1
3 Objective of the Study .................................................................................................. 1
4 Methodology and Collection of Data ........................................................................... 1
5 Introduction to Tapi ..................................................................................................... 2
6 Physical Features .......................................................................................................... 3
7 Administrative Set-Up .................................................................................................. 4
8 Climate .......................................................................................................................... 5
9 Demographic Characteristics ...................................................................................... 5
10 Sex ratio ........................................................................................................................ 9
11 Decadal Change by Residence and Gender ............................................................... 14
12 Rural Urban Population ............................................................................................ 16
13 Main Observation ....................................................................................................... 24
14 Policy Recommendations ........................................................................................... 26
15 Conclusion .................................................................................................................. 26
Bibliography ...................................................................................................................... 27

iv
LIST OF TABLES
Table 1: Administrative Set-Up of Tapi ..................................................................................... 4
Table 2: Population and Decadal Change by Residence and Gender (Gujarat and Tapi
District) ..................................................................................................................................... 7
Table 3: Population and Decadal Change by Residence and Gender (Taluka of Tapi
District) ..................................................................................................................................... 8
Table 4: Child Population (0-6 Years) and Decadal Change by Residence and Gender
(Gujarat and Tapi District) ....................................................................................................... 12
Table 5: Child Population (0-6 Years) and Decadal Change by Residence and Gender
(Taluka of Tapi District) .......................................................................................................... 13
Table 6: Schedule Caste Population in the District ................................................................... 18
Table 7: Schedule Caste Population in the District ................................................................... 19
Table 8: Schedule Tribe Population in the Gujarat and Tapi District ........................................ 21
Table 9: Schedule Tribe Population in the Tapi District (Taluka wise) ..................................... 22
LIST OF FIGURES
Figure 1 : Map of Tapi District .................................................................................................. 3
Figure 2 : Overall Sex Ratio in Gujarat / Tapi and its Talukas ...................................................... 9
Figure 3 :0 to 6 year population Sex Ratio in Gujarat / Tapi and its Talukas ............................. 10
Figure 4 : Sex Ratio of SC population in Gujarat / Tapi and its Talukas ..................................... 10
Figure 5 : Sex Ratio of ST population in Gujarat / Tapi and its Talukas.................................... 11
Figure 6 : Decadal Growth rate of population in Gujarat / Tapi and its Talukas ........................ 14
Figure 7 :Decadal Growth rate of 0 to 6 year population in Gujarat / Tapi and its
Talukas ................................................................................................................................... 15
Figure 8 : Decadal Growth rate of ST population in Gujarat / Tapi and its Talukas ................... 15
Figure 9 : Percentage of Rural Urban Population ..................................................................... 16
Figure 10 : Percentage of SC population in Gujarat / Tapi and its Talukas................................ 20
Figure 11 : Percentage of ST population in Gujarat / Tapi and its Talukas ................................ 23
Figure 12 : Percentage of ST Population in Gujarat and Tapi ................................................... 24

v
ABBREVIATIONS
APL : Above Poverty Line
BPL : Below Poverty Line
CBR : Crude birth Rate
CDPO : Community Development Programme Officer
CDR : Crude Death Rate
CEW : Community Extensive Worker
DDO : District Development Officer
DRDA : District Rural Development Agency
DSA : District Statistical Abstract
DSO : District Statistical Officer
FYPs : Five Year Plans
GAD : General Administrative Department
GOI : Government of India
GSDP : Gross State Domestic Product
NGO : Non-Governmental Organisation
Popu. : Population
SC : Scheduled Caste
ST : Scheduled Tribe
TFR : Total Fertility Rate
UCD : Urban Community Development
Sq. : Square Kilometre
Km : Kilometre
OBC : Other Backward Class

1
1 INTRODUCTION
India in last six decades has been successful in raising human capacity. Similarly
Gujarat has been equally successful. There has been reduction in its birth rate and
death rate and the income and expectation of life at birth have increased; education
level has improved; equality between women and men has been established to a large
extent; the condition of their education and health has improved. Compared to
Gujarat, in Haryana, Kerala, Maharashtra, Punjab, Tamilnadu states we find more
economic development. Gujarat has a leading place in India in context with industrial
development as it has secured fourth rank among the state in India. After 1991, more
importance has been given to the industries in Gujarat and economy of Gujarat has
been diversified, but still improvements can be made in the agricultural field. Due to
famine the link between agricultural and industry becomes feeble. The adverse effect
of polluted environment can also be seen on human development and due to famine
for many years Gujarat has not obtained a better human development index compared
to that of India. Gujarat secures an important place in India as compared to other
states, Gujarat is a well-developed state. While examining various issues of
development of the state we find inequalities in different parts of the state.
2 RESEARCH ISSUES
The present study is a focus on various issue of demographic indicator in Tapi district
of Gujarat state. In many of the districts in Gujarat where have unequally developed.
Present working paper find trends and status of such demographic indicator like sex
ratio, Decadal Change by Residence and Gender, Rural Urban Population etc.
3 OBJECTIVE OF THE STUDY
The present paper deals with an important issue on demographic indicator. The
objectives of the study are as follows:
1) To evaluate status and trends of rural urban population.
2) To analyse taluka wise trends of sex ratio and child sex ratio in the district.
3) To analyse taluka wise decadal change by residence and gender in the district.
4 METHODOLOGY AND COLLECTION OF DATA
In this study, researcher has used secondary data which is published by state
government (Socio Economic Review) and district panchayat (District Statistical

2
Abstract). Study also uses various population census of Gujarat and Tapi district. We
have tried to examine the demographic with secondary data.
5 INTRODUCTION TO TAPI
The formation of a new district is a historic event. It is also an opportunity. Tapi is a
newly formed district, which bifurcated from Surat district on 27 September 2007,
with its headquarters at Vyara. Tapi district largely comprises tribal population, living
in rural areas. The social customs, traditions, beliefs and even the dialect of Gujarati
language of people living in rural areas of the Tapi district, differ to a large extent
from the mainstream population living in nearby urban centres. The rural and interior
areas of Tapi district have modest infrastructure facilities. Three talukas1 – Nizar,
Uchchhal and Songadh – out of total five talukas of Tapi district were identified as
backward by the Cowlagi committee. This is in stark contrast with Surat, one of the
flourishing and affluent urban centres in the vicinity.
The bifurcation of Surat district and formation of Tapi district took place not only for
administrative convenience but for other reasons as well. Surat was known for its
affluence since the prehistoric times. Surat has the geographical advantage of being
near to the sea, making it a hub of exports of valuable items. Surat flourished during
the Moughal and the British regime but the nearby areas with tribal population
remained detached and therefore, these areas are still underdeveloped. Thus, it
became necessary to plan separately for development of this region.
The government of Gujarat, under the decentralized planning, has started focusing on
district-level and taluka-level planning and policy formulation. It would be more
appropriate to have a different and a separate plan for development of the tribal
district. The geographical features and the demographic profile of the district would
provide insight for development. The present infrastructure facilities in the district
would give an idea about the areas in which infrastructure facilities are required to be
developed and strengthened. This chapter gives an overview of the physical features,
administrative set-up, demographic profile and existing infrastructure facilities in the
Tapi district.
1 Blocks are called Talukas in Gujarat.

3
Historically, Vyara (the present district headquarters of Tapi) was known as the
eastern corridor of Gujarat. Vyara was one of the flourishing villages of historical
Antaahpur paragana (state). However, that ancient Vyara, which was then known as
Vijaynagar got completely destroyed by a devastating fire. The people, who survived,
migrated to the banks of river Mindhola and the area that developed over a period of
time is the Vyara of present times.
6 PHYSICAL FEATURES
Tapi district is one of the 26 districts of Gujarat state in western India. Tapi is located
in South Gujarat region. Tapi is located in the Southern part of Gujarat state between
73.5° to 74.23° East (Longitude) and 21.0° to 21.23° North (Latitude). The area of the
Tapi district is 3434.64 sq. km. The map of Tapi district is shown in figure:
Figure 1 : Map of Tapi District
Source: Census
The Tapi district comprises five Talukas: Vyara, Songadh, Uchchhal, Nizar and
Valod. These five talukas comprise 523 villages out of which 450 villages are
inhabited.
Satpuda mountain range is situated on the northern frontier and Sahyadri mountain
range is located on the southern frontier of Tapi district. Tapi River flows from

4
northern parts of Tapi district. Rivers Zhankhri Midhola and Purna flow from the
central parts of the district. River Ambika flows from southern regions of Tapi
district. These rivers are major source of irrigation. Tapi is one of the perennial rivers
of India. A dam is constructed on river Tapi in Ukai village of Songadh district. The
water stored in the reservoir is also a major source of irrigation.
The economy of Tapi district is largely agrarian. The chief crops of Tapi district are
Paddy (Dangar), Sugarcane, Jowar, Groundnut and Bananas (Kel). There are dense
bamboo forests in the district. Tapi is the home to the natural habitats of many wild
animals including tigers, lions, snakes, sloth bear etc.
7 ADMINISTRATIVE SET-UP
The district headquarter of Tapi is Vyara. Tapi comprises 5 talukas and the district
collector looks after the general administration, collection of land revenue, settlement
of land disputes, civil supplies, mid-day meal scheme etc. at district level. Mamlatdar
takes care of land development, revenue collection, and law and order. Administration
of law and order is taken care of by the Superintendent of Police. An officer is
designated for the developmental activities in each sector of the economy. The details
of Tapi district are given in Table 1:
Table 1: Administrative Set-Up of Tapi
Sr. No. Heads Nos.
1 Area (Sq. Kms.) 3434.64
2 No. of Talukas 5
3 Prants 2
4 Municipal Corporations 0
5 Municipal Towns 2
6 Panchayats 284
6.1 Taluka Panchayats 5
6.2 Gram Panchayats 284
7 Villages 523
Source: Registrar General of India
One integral and important component of administration is the Panchayati Raj. In
Gujarat, the system of Panchayati Raj was introduced in 1963. This is a three tier
pyramid structure with the District Panchayat at the top most tier, The Taluka
Panchayat at middle level and The Gram (Village) Panchayat at the base of the
pyramid. The role of The Gram Panchayat is to provide facilities for primary

5
education, drinking water, electricity, construction and maintenance of roads, bridges
and similar developmental activities. The Gram Panchayat has to see that the benefits
of the important development programmes planned and implemented by the higher
authorities percolate down to the neediest people.
In Tapi district, it has 284 Gram Panchayat and 2 nagarpalikas (Municipal Towns).
This is because the Gram Panchayat is constituted for the local area having population
less than 10000.
8 CLIMATE
The climate of Tapi district is characterized by hot summers and cold winters. The
months of summer and winter in Tapi district are March to May and December to
February respectively. The humidity in atmosphere is less. The months of monsoon in
Tapi district are June to September.
The maximum temperature reaches around 40° C in the months of March to May and
the lowest temperature is around 11° C in the months of December to February.
Winds are light and moderate in the months of March to May and become stronger in
the months of monsoon. These winds are predominantly from west to east. During
winter, the winds change their direction and blow from north-east direction. The
average rainfall of the Tapi district is 813.40 mm2.
9 DEMOGRAPHIC CHARACTERISTICS
The population of Tapi district has increased from 7,19,634 in 2001 to 8,07,022 in
2011, a decadal growth rate of 12.10 per cent. This population growth rate has
decreased from 14.78 in 1991-2001. This is much lower than the population growth
rate of Gujarat (19.30 per cent). There are wide variations in population growth rate
across talukas. Valod has the lowest population growth rate of 3.90 and Nizar has
maximum growth rate of 23.30 per cent.
The sex ratio of Tapi is 1007, highest among the all districts; more than the state
average of 919. The sex ratio of Tapi has increased and is now favourable. The sex
ratio of Tapi has increased from 996 in 2001 to 1007 in 2011. Nizar and Uchchhal
talukas have a highly favourable sex ratio of 1017 and 1025 respectively. The details
2 As per data given by the Collector Office to the Director of Relief, Government of Gujarat as on
October 31, 2014.

6
of population and decadal change in population are shown in Table 2 and 3
respectively.
The child population in the district has reduced by 10 per cent during the 2001-2011
decade. This is in contrast to the state growth rate, which is positive (3.30 per cent).
This means that the growth rate in overall population could be because of in-
migration from other districts or because of increase in life expectancy. Highest
reduction (-17.34 per cent) in child population growth is observed in Valod. On the
other hand, Nizar is the only taluka to have a positive growth rate of 6.1 per cent of
child population, which is more than the state’s average. Talukas with urban centres
show a very high reduction in child population growth rate where is the rural areas
show either a low reduction or an increase in child population growth rate.
As per Census-2011, Child sex ratio of Tapi is 953, which is the second highest
among all districts of Gujarat. This has marginally improved over the last decade (in
2001, it was 951). Child Sex ratio is minimum in Valod (988) and maximum in
Uchchhal (975). The details of child population, its growth rate and sex ratio are given
in table 5:

7
Table 2: Population and Decadal Change by Residence and Gender (Gujarat and Tapi District)
State/
District/
Taluka
P/M/F Total Population % of Decadal Change Sex Ratio
Total Rural Urban T R U
2001 2011 2001 2011 2001 2011 2001-2011 2001 2011
Gujarat
State
P 50671017 60439692 31740767 34694609 18930250 25745083 19.30 9.30 36.00 920 919
M 26385577 31491260 16317771 17799159 10067806 13692101 19.40 9.10 36.00
F 24285440 28948432 15422996 16895450 8862444 12052982 19.20 9.50 36.00
Tapi
District
P 719634 807022 650119 727535 69515 79487 12.10 11.90 14.30 996 1007
M 360467 402188 324802 36154 35665 40640 11.60 11.30 13.90
F 359167 404834 325317 365987 33850 38847 12.70 12.50 14.80
Source: Census 2001 and 2011
Note : P = Person, M = Male, F = Female, T = Total, R=Rural, U=Urban
8
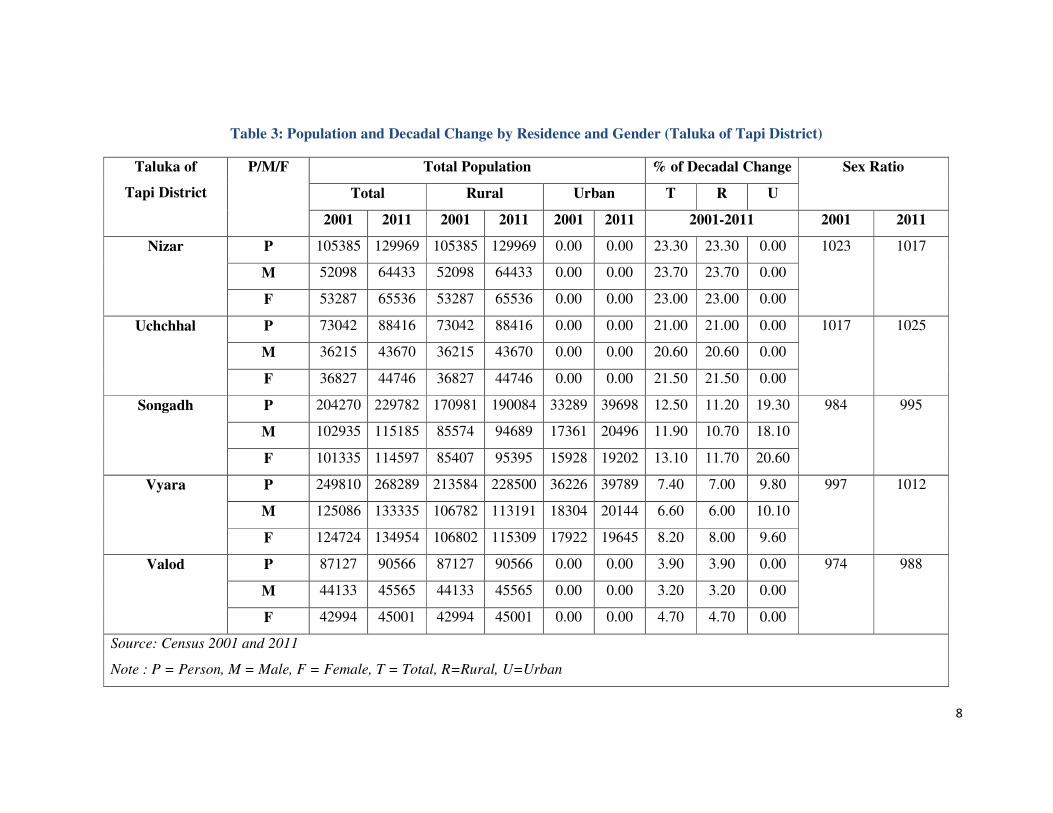
Table 3: Population and Decadal Change by Residence and Gender (Taluka of Tapi District)
Taluka of
Tapi District
P/M/F Total Population % of Decadal Change Sex Ratio
Total Rural Urban T R U
2001 2011 2001 2011 2001 2011 2001-2011 2001 2011
Nizar P 105385 129969 105385 129969 0.00 0.00 23.30 23.30 0.00 1023 1017
M 52098 64433 52098 64433 0.00 0.00 23.70 23.70 0.00
F 53287 65536 53287 65536 0.00 0.00 23.00 23.00 0.00
Uchchhal P 73042 88416 73042 88416 0.00 0.00 21.00 21.00 0.00 1017 1025
M 36215 43670 36215 43670 0.00 0.00 20.60 20.60 0.00
F 36827 44746 36827 44746 0.00 0.00 21.50 21.50 0.00
Songadh P 204270 229782 170981 190084 33289 39698 12.50 11.20 19.30 984 995
M 102935 115185 85574 94689 17361 20496 11.90 10.70 18.10
F 101335 114597 85407 95395 15928 19202 13.10 11.70 20.60
Vyara P 249810 268289 213584 228500 36226 39789 7.40 7.00 9.80 997 1012
M 125086 133335 106782 113191 18304 20144 6.60 6.00 10.10
F 124724 134954 106802 115309 17922 19645 8.20 8.00 9.60
Valod P 87127 90566 87127 90566 0.00 0.00 3.90 3.90 0.00 974 988
M 44133 45565 44133 45565 0.00 0.00 3.20 3.20 0.00
F 42994 45001 42994 45001 0.00 0.00 4.70 4.70 0.00
Source: Census 2001 and 2011
Note : P = Person, M = Male, F = Female, T = Total, R=Rural, U=Urban

9
10 SEX RATIO
Sex ratio is one of the important demographic parameter, which indicates the balance between
females and males in the society. Gender composition reflects mortality and migration
character of a given population. Distribution pattern of male and female in a population affects
relative roles and economic relationships. There are different tools to measure gender equity in
a population. Sex ratio is one such widely used tool for cross sectional analysis to measure
gender balance. Sex ratio is defined in the Census of India as the number of females at per 1000
males in the population. Sex ratio indicates the balance between females and males in the
society. More than a century (1901 to 2011) the Sex ratio in India has been historically adverse
and unfavourable to females.
In Tapi district the sex ratio of Tapi is 1007, highest among the all districts; more than the state
average of 919. The sex ratio of Tapi has increased and is now favourable. The sex ratio of
Tapi has increased from 996 in 2001 to 1007 in 2011. Nizar and Uchchhal talukas have a
highly favourable sex ratio of 1017 and 1025 respectively.
Figure 2 : Overall Sex Ratio in Gujarat / Tapi and its Talukas
As per Census-2011, Child sex ratio of Tapi is 953, which is the second highest among all
districts of Gujarat. This has marginally improved over the last decade (in 2001, it was 951). As
per Census-2011, in Tapi district Child Sex ratio is minimum in Valod (988) and maximum in
Uchchhal (975).

10
Figure 3 :0 to 6 year population Sex Ratio in Gujarat / Tapi and its Talukas
As per Census-2011, Scheduled Caste sex ratio of Tapi is 973, which is higher than Gujarat
state average. In rural area this ratio found 974 and in urban area it’s found 973, which is found
higher the state average. The Scheduled Caste sex ratio of all taluka of Tapi district is found
favourable, Nizar 989, Uchchhal 900, Songadh 972, Vyara 985 and Valod 922 respectively.
Figure 4 : Sex Ratio of SC population in Gujarat / Tapi and its Talukas

11
As per Census-2011, Scheduled Tribe sex ratio of Tapi is 1022, which is higher than Gujarat
state average (981). In rural area this ratio found 1022 and in urban area it’s found 1020, which
is found higher the state average.
Figure 5 : Sex Ratio of ST population in Gujarat / Tapi and its Talukas
The Scheduled Tribe sex ratio of all taluka of Tapi district is found favourable, Nizar 1033,
Uchchhal 1029, Songadh 1012, Vyara 1025 and Valod 1013 respectively.

12
Table 4: Child Population (0-6 Years) and Decadal Change by Residence and Gender (Gujarat and Tapi District)
State /
District /
Taluka
P/M/
F
Child Population (0-6 years) % of Decadal Change Sex Ratio
(0-6) Total Rural Urban Total Rural Urban
2001 2011 2001 2011 2001 2011 2001-2011 2001 2011
Gujarat
State
P 7532404 7777262 5085941 4824903 2446463 2952359 3.25 -5.13 20.68 883 890
M 4000148 4115384 2668527 2521455 1331621 1593929 2.88 -5.51 19.70
F 3532256 3661878 2417414 2303448 1114842 1358430 3.67 -4.71 21.85
Tapi
District
P 99008 89075 90483 80048 8525 9027 -10.03 -11.53 5.89 951 953
M 50753 45619 46217 40887 4536 4732 -10.12 -11.53 4.32
F 48255 43456 44266 39161 3989 4295 -9.95 -11.53 7.67
Source: Census 2001 and 2011
Note : P = Person, M = Male, F = Female

13
Table 5: Child Population (0-6 Years) and Decadal Change by Residence and Gender (Taluka of Tapi District)
State /
District /
Taluka
P/M/
F
Child Population (0-6 years) % of Decadal Change Sex Ratio
(0-6) Total Rural Urban Total Rural Urban
2001 2011 2001 2011 2001 2011 2001-2011 2001 2011
Nizar P 15522 16464 53287 16464 0.00 0 6.07 -69.10 NA 937 933
M 8015 8519 15522 8519 0.00 0 6.29 -45.12 NA
F 7507 7945 8015 7945 0.00 0 5.83 -0.87 NA
Uchchhal P 11073 10783 36827 10783 0.00 0 -2.62 -70.72 NA 997 975
M 5544 5461 11073 5461 0.00 0 -1.50 -50.68 NA
F 5529 5322 5544 5322 0.00 0 -3.74 -4.00 NA
Songadh P 29524 26304 85407 21388 15928 4916 -10.91 -74.96 -69.14 947 962
M 15161 13406 25169 10820 4355 2586 -11.58 -57.01 -40.62
F 14363 12898 12853 10568 2308 2330 -10.20 -17.78 0.95
Vyara P 32036 26553 106802 22442 17922 4111 -17.12 -78.99 -77.06 947 963
M 16450 13525 27866 11379 4170 2146 -17.78 -59.17 -48.54
F 15586 13028 14222 11063 2228 1965 -16.41 -22.21 -11.80
Valod P 10853 8971 42994 8971 0.00 0 -17.34 -79.13 NA 944 905
M 5583 4708 10853 4708 0.00 0 -15.67 -56.62 NA
F 5270 4263 5583 4263 0.00 0 -19.11 -23.64 NA
Source: Census 2001 and 2011
Note : P = Person, M = Male, F = Female

14
11 DECADAL CHANGE BY RESIDENCE AND GENDER
Decadal growth rate of Tapi district is 12.10 per cent (2001-2011); this population
growth rate has decreased from 14.78 in 1991-2001. In male population growth rate is
found 11.60 per cent, in rural and urban area this per cent found 11.30 and 13.90
respectively. In female population growth rate is found 12.70 per cent, in rural and
urban area this per cent found 12.50 and 14.80 respectively. Tapi district decadal
growth is found lower than state average.
Figure 6 : Decadal Growth rate of population in Gujarat / Tapi and its Talukas
Decadal growth rate of 0 to 6 year population in Tapi district is -10.03 per cent (2001-
2011). In rural area this rate is -11.53 per cent and urban area it is 5.89 per cent
respectively. In male population growth rate is found -10.12 per cent, in rural and
urban area this per cent found -11.53 and 4.32 respectively. In female population
growth rate is found -9.95 per cent, in rural and urban area this per cent found -11.53
and 7.67 respectively.

15
Figure 7 :Decadal Growth rate of 0 to 6 year population in Gujarat / Tapi and its
Talukas
Decadal growth rate of Scheduled Caste population in Tapi district is -2.59 per cent
(2001-2011). In rural area this rate is -2.09 per cent and urban area it is -3.49 per cent
respectively. In male population growth rate is found -1.24 per cent, in rural and urban
area this per cent found -0.74 and -2.15 respectively. In female population growth rate
is found -3.93 per cent, in rural and urban area this per cent found -3.44 and -4.84
respectively.
Figure 8 : Decadal Growth rate of ST population in Gujarat / Tapi and its
Talukas

16
Decadal growth rate of Scheduled Tribe population in Tapi district is 13.01 per cent
(2001-2011). In rural area this rate is 13.47 per cent and urban area it is 0.81 per cent
respectively. In male population growth rate is found 12.58 per cent, in rural and urban
area this per cent found 12.98 and 1.88 respectively. In female population growth rate
is found 13.43 per cent, in rural and urban area this per cent found 13.96 and -0.21
respectively.
12 RURAL URBAN POPULATION
The details in table 2 in terms of percentage of rural-urban population are summarized
in figure 9.
Figure 9 : Percentage of Rural Urban Population
Source: Census 2011
A large proportion of the population of Tapi district are Adivasis. Adivasi literally
means aborigins. Today they are known as tribal population or people belonging to
schedule tribes. These tribal are actually aborigins and are found to live in these areas
since prehistoric times. Tribal are categorized further according to their communities.
The tribal of Tapi district belong largely to seven such communities: Choudhari,
Gamit, Vasava, Kotwalia, Bhil, Valvi and Padvi.
Choudharis are found in all the five talukas of Tapi district. They are said to be the
descendants of Rajput’s and Bhils. Gamits are found largely in Uchchhal, Nizar and
Valod talukas of Tapi. They are said to be the sub-caste of Bhils. Vasava are found in
Uchchhal, Nizar and Songadh talukas of Tapi district. Dhodias are found largely in
Songadh taluka. Kotwalias are found to live in the hilly regions of Tapi district. Their

17
main occupation is to make articles out of bamboo and other forest produce. They are
also into agriculture labour and sugarcane cutting. Halpatis are found in almost all
talukas of Tapi. Their main occupation is to till the lands of Zamindars (landowners).
It can be said that despite being categorized as tribals or aborigins, these tribes are
heterogeneous in terms of culture and tradition. Thus, it would be appropriate to have
different policy for upliftment of each of these tribes. The caste wise bifurcation of
population, its growth rate and sex ratio for each taluka of Tapi district are given in
table 6 to 9.

18
Table 6: Schedule Caste Population in the Gujarat and Tapi District
State/
District/
Taluka
P /
M /
F
Scheduled Caste Population % of Decadal Change
(SC)
% of SC Population to
Total Population
Sex Ratio
(SC)
Total Rural Urban T R U T R U T R U
2001 2011 2001 2011 2001 2011 2001-2011 2011 2011
Gujarat
State
P 3592715 4074447 2180441 2281573 1412274 1792874 13.41 4.6 4 26.95 6.74 11.74 6.96 931 940 919
M 1866283 2110331 1127423 1176107 738860 934224 13.08 4.32 26.44 6.70 11.86 6.82
F 1726432 1964116 1053018 1105466 673414 858650 13.77 4.98 27.50 6.78 11.63 7.12
Tapi
District
P 8385 8168 5409 5296 2976 2872 -2.59 -2.09 -3.49 1.01 1.12 3.61 973 974 973
M 4191 4139 2703 2683 1488 1456 -1.24 -0.74 -2.15 1.03 11.45 3.58
F 4194 4029 2706 2613 1488 1416 -3.93 -3.44 -4.84 1.00 1.10 3.65
Source: Census 2001 and 2011
Note : P = Person, M = Male, F = Female, T = Total, R=Rural, U=Urban

19
Table 7: Schedule Caste Population in the Tapi District (Taluka wise)
State/
District/
Taluka
P / M /
F
Scheduled Caste Population % of Decadal Change
(SC)
% of SC Population to Total
Population
Sex Ratio
(SC)
Total Rural Urban T R U T R U T R U
2001 2011 2001 2011 2001 2011 2001-2011 2011 2011
Nizar P 1878 2261 1878 2261 0 0 20.39 20.39 0.00 1.74 1.74 0.00 989 989 0
M 920 1137 920 1137 0 0 23.59 23.59 0.00 1.76 1.76 0.00
F 958 1124 958 1124 0 0 17.33 17.33 0.00 1.72 1.72 0.00
Uchchhal P 193 114 193 114 0 0 -40.93 -40.93 0.00 0.13 0.13 0.00 900 900 0
M 106 60 106 60 0 0 -43.40 -43.40 0.00 0.14 0.14 0.00
F 87 54 87 54 0 0 -37.93 -37.93 0.00 0.12 0.12 0.00
Songadh P 2732 2286 910 368 1822 1918 -16.33 -59.56 5.27 0.99 1.20 4.83 972 1033 961
M 1410 1159 466 181 944 978 -17.80 -61.16 3.60 1.01 1.22 4.77
F 1322 1127 444 187 878 940 -14.75 -57.88 7.06 0.98 1.18 4.90
Vyara P 2629 2519 1475 1565 1154 954 -4.18 6.10 -17.33 0.94 1.10 2.40 985 979 999
M 1267 1269 723 791 544 478 0.16 9.41 -12.13 0.95 1.12 2.37
F 1362 1250 752 774 610 476 -8.22 2.93 -21.97 0.93 1.08 2.42
Valod P 953 988 953 988 0 0 3.67 3.67 0.00 1.09 1.09 0.00 922 922 0
M 488 514 488 514 0 0 5.33 5.33 0.00 1.13 1.13 0.00
F 465 474 465 474 0 0 1.94 1.94 0.00 1.05 1.05 0.00
Source: Census 2001 and 2011
Note : P = Person, M = Male, F = Female, T = Total, R=Rural, U=Urban

20
It can be seen from Table that Gujarat state has 6.74 per cent Schedule Caste (SC) population
where as in Tapi district it is 1.01 per cent. Uchchhal has minimum (0.13) SC population
among all talukas of Tapi and Nizar (1.74) has maximum.
The sex ratio of SC population in Tapi is 973, which is greater than that of the state, which are
931. Sex ratio, albeit skewed, is maximum in Nizar (989) and minimum in Uchchhal (900).
Figure 10 : Percentage of SC population in Gujarat / Tapi and its Talukas

21
Table 8: Schedule Tribe Population in the Gujarat and Tapi District
State/
District/
Taluka
P/M/F Scheduled Tribe Population % of Decadal
Change (ST)
% of ST Population to
Total Population
Sex Ratio
(ST)
Total Rural Urban T R U T R U T R U
2001 2011 2001 2011 2001 2011 2001-2011 2011 2011
Gujarat
State
P 7481160 8917174 6866637 8021848 614523 895326 19.2 16.80 45.7 14.75 23.12 3.48 981 984 952
M 3790117 4501389 3471002 4042691 319115 458698 18.77 16.47 43.74 14.29 22.71 3.35
F 3691043 4415785 3395635 3979157 295408 436628 19.64 17.18 47.81 15.25 23.55 3.62
Tapi
District
P 601114 679320 579201 657229 21913 22091 13.01 13.47 0.81 84.18 90.34 27.79 1022 1022 1020
M 298413 335958 287680 325023 10733 10935 12.58 12.98 1.88 83.53 89.9 26.91
F 302701 343362 291521 332206 11180 11156 13.43 13.96 -0.21 84.82 90.77 28.72
Source: Census 2001 and 2011
Note : P = Person, M = Male, F = Female, T = Total, R=Rural, U=Urban

22
Table 9: Schedule Tribe Population in the Tapi District (Taluka wise)
State/
District/
Taluka
P/M/F Scheduled Tribe Population % of Decadal Change
(ST)
% of ST Population to Total
Population
Sex Ratio
(ST)
Total Rural Urban T R U T R U T R U
2001 2011 2001 2011 2001 2011 2001-2011 2011 2011
Nizar P 83843 105043 83843 105043 0 0 25.29 25.29 0.00 80.82 80.82 0 1033 1033 0
M 41035 51669 41035 51669 0 0 25.91 25.91 0.00 80.19 80.19 0
F 42808 53374 42808 53374 0 0 24.68 24.68 0.00 81.44 81.44 0
Uchchhal P 71084 86693 71084 86693 0 0 21.96 21.96 0.00 98.05 98.05 0 1029 1029 0
M 35167 42732 35167 42732 0 0 21.51 21.51 0.00 97.85 97.85 0
F 35917 43961 35917 43961 0 0 22.40 22.40 0.00 98.25 98.25 0
Songadh P 170464 195103 161464 185295 9000 9808 14.45 14.76 8.98 84.91 97.48 24.71 1012 1012 1016
M 84922 96953 80425 92088 4497 4865 14.17 14.50 8.18 84.17 97.25 27.74
F 85542 98150 81039 93207 4503 4943 14.74 15.01 9.77 85.65 97.71 25.74
Vyara P 211611 227613 198698 215330 12913 12283 7.56 8.37 -4.88 84.84 94.24 30.87 1025 1025 1024
M 105078 112382 98842 106312 6236 6070 6.95 7.56 -2.66 84.29 93.92 30.13
F 106533 115231 99856 109018 6677 6213 8.16 9.18 -6.95 85.39 94.54 31.63
Valod P 64112 64868 64112 64868 0 0 1.18 1.18 0.00 71.63 71.63 0 1013 1013 0
M 32211 32222 32211 32222 0 0 0.03 0.03 0.00 70.72 70.72 0
F 31901 32646 31901 32646 0 0 2.34 2.34 0.00 72.55 72.55 0
Source: Census 2001 and 2011
Note : P = Person, M = Male, F = Female, T = Total, R=Rural, U=Urban

23
The details of Schedule Tribe (ST) population are given in table 9.
In Gujarat, the percentage of ST population is 14.75 per cent where as in Tapi it is 84.18 per
cent. As discussed earlier, Tapi still comprises the population of its aborigins. Uchchhal has
98.05 per cent of ST population and Valod has 71.63 per cent of ST population.
Figure 11 : Percentage of ST population in Gujarat / Tapi and its Talukas
The growth rate of ST population is 13.01 per cent which is lower than that of the state (19.20
per cent). Maximum population growth rate for STs is in Nizar (25.29 per cent) and minimum
is in Valod (1.18 per cent).
Sex ratio among ST population (1022) is more than the overall sex ratio as well as the sex
ratio of SC population. Not only that, it is much higher than the sex ratio of STs of the state
(981). The sex ratio of ST population of Tapi is 1022 and that of the Gujarat state is 981.
Among talukas, highest sex ratio is observed in Nizar (1033) and lowest in Songadh (1012),
but still above 1000.

24
Figure 12 : Percentage of ST Population in Gujarat and Tapi District
Source: Census 2011
Tapi is basically a tribal district. Thus, the proportion of Schedule Tribe population in Tapi is
far higher in comparison with Gujarat, at macro-level.
13 MAIN OBSERVATION
• The population of Tapi district has increased from 7,19,634 in 2001 to 8,07,022 in
2011.
• Decadal growth rate of Tapi district is 12.10 per cent (2001-2011), This population
growth rate has decreased from 14.78 in 1991-2001.
• The sex ratio of Tapi is 1007, highest among the all districts; more than the state
average of 919. The sex ratio of Tapi has increased and is now favourable.
• The sex ratio of Tapi has increased from 996 in 2001 to 1007 in 2011. Nizar and
Uchchhal talukas have a highly favourable sex ratio of 1017 and 1025 respectively.
• The child population in the Tapi district has reduced by 10 per cent during the 2001-
2011 decade. This is in contrast to the state growth rate, which is positive (3.30 per
cent).

25
• In Tapi district Highest reduction (-17.34 per cent) in child population growth is
observed in Valod. On the other hand, Nizar is the only taluka to have a positive
growth rate of 6.1 per cent of child population, which is more than the state’s average.
• As per Census-2011, Child sex ratio of Tapi is 953, which is the second highest
among all districts of Gujarat. This has marginally improved over the last decade (in
2001, it was 951).
• As per Census-2011, in Tapi district Child Sex ratio is minimum in Valod (988) and
maximum in Uchchhal (975).
• Decadal growth rate of 0 to 6 year population in Tapi district is -10.03 per cent (2001-
2011). In rural area this rate is -11.53 per cent and urban area it is 5.89 per cent
respectively.
• As per Census-2011, Scheduled Caste sex ratio of Tapi is 973, which is higher than
Gujarat state average. In rural area this ratio found 974 and in urban area it’s found
973, which is found higher the state average.
• The Scheduled Caste sex ratio of all taluka of Tapi district is found favourable, Nizar
989, Uchchhal 900, Songadh 972, Vyara 985 and Valod 922 respectively.
• Decadal growth rate of Scheduled Caste population in Tapi district is -2.59 per cent
(2001-2011). In rural area this rate is -2.09 per cent and urban area it is -3.49 per cent
respectively.
• As per Census-2011, Scheduled Tribe sex ratio of Tapi is 1022, which is higher than
Gujarat state average (981). In rural area this ratio found 1022 and in urban area it’s
found 1020, which is found higher the state average.
• The Scheduled Tribe sex ratio of all taluka of Tapi district is found favourable, Nizar
1033, Uchchhal 1029, Songadh 1012, Vyara 1025 and Valod 1013 respectively.
• Decadal growth rate of Scheduled Tribe population in Tapi district is 13.01 per cent
(2001-2011). In rural area this rate is 13.47 per cent and urban area it is 0.81 per cent
respectively.

26
14 POLICY RECOMMENDATIONS
On the basis of all the data and information analyzed, following suggestions may be adopted
for development in the region. The suggestions could either be in the form of works
undertaken under existing policies or formation of new policies:
• Skill development programmes can be introduced.
• Large proportion of ST population. These people are aborigns of Tapi and thus,
understand the rural economy better. If given proper direction and guidance, it may help
for sustainable development.
• To build the capacity of local institutions with Government functionaries, for enhanced
service delivery.
• To develop policy framework that links the resources of the region with development;
and development of the region with local people.
15 CONCLUSION
Tapi district was part of Surat district till September 2007. Erstwhile Surat district consisted
of both intense urban agglomeration and most remote tribal areas. These extreme realities
required completely different approach in managing such diverse areas in same district.
Statistical profile of the district due to aggregation of data failed to highlight real condition of
different area and provide alert for severe need for developmental efforts in some of these
tribal areas. In this milieu, Tapi district was created by splitting five rural tribal talukas viz.
Vyara, Songadh, Uchchhal, Nizar and Valod from Surat district. This newly formed Tapi
district being part of tribal belt of Gujarat faces many developmental challenges on poverty,
livelihood, displacement, education, public health, infrastructure, gender issues. It needs
greater government support for progress on human development count.

27
16 BIBLIOGRAPHY
District Panchayat (Various Issues), District Statistical Abstract-Surat.
District Panchayat (Various Issues), District Statistical Abstract-Tapi.
GOI (1991), District Census Hand Book 1991, Surat Series - 7, Part XII - A & B, Village &
Town Directory.
GOI (2001), District Census Hand Book 2001, Surat Series - 7, Part XII - A & B, Village &
Town Directory.
Government of Gujarat, (2007-2008), Socio Economic Review : Gujarat State. Gandhinagar:
Directorate of Economics and Statistics, Government of Gujarat.
Socio- Economic Review, (Various Issue), Gujarat State, Directorate of Economics and
Statistics, Government of Gujarat.
TAPI District Human Development Report (2015), Gujarat Social Infrastructure
Development Society (GSIDS), General Administration Department (Planning), Government
of Gujarat.
28
THE WORKING PAPER SERIES
DEPARTMENT OF HUMAN RESOURCE DEVELOPMENT
1. Joshi Prashant and Pandya Kiran (2007), Modelling Volatility of Indian Stock
Markets.
2. Desai Jayesh and Pandya Kiran (2007), India and Outsourcing of Services: A New
Growth Engine for India
3. Chudasama Krishnaraj and Pandya Kiran (2008), Measuring Efficiency of Indian
Ports.
4. Raj Madhusudan and Pandya Kiran (2008), State of Elementary Education in
Public Schools of Gujarat: A Study of Schools Run by Bharuch Municipality.
5. Bulsari Smruti (2009), Telecommunications and Economic Growth in India
6. Prashant Joshi (2009), Empirical Investigation of Stock Market Linkages Using
VAR Approach
7. Gaurang Rami (2009), Interrelations between Money, Price and Output in India :
New Evidence
CENTER FOR HUMAN DEVELOPMENT STUDIES
1. Pandya Kiran and Rami Gaurang (2016), Health Status of Tapi District.

