tanzania - export investment · tanzania comes out eighth out of 17 markets in our infrastructure...
TRANSCRIPT

Q4 2016www.bmiresearch.com
TANZANIAINFRASTRUCTURE REPORTINCLUDES 10-YEAR FORECASTS TO 2025
Published by:BMI Research

Tanzania Infrastructure Report Q4 2016INCLUDES 10-YEAR FORECASTS TO 2025
Part of BMI’s Industry Report & Forecasts Series
Published by: BMI Research
Copy deadline: July 2016
ISSN: 2047-9395
BMI ResearchSenator House85 Queen Victoria StreetLondonEC4V 4ABUnited KingdomTel: +44 (0) 20 7248 0468Fax: +44 (0) 20 7248 0467Email: [email protected]: http://www.bmiresearch.com
© 2016 Business Monitor International LtdAll rights reserved.
All information contained in this publication iscopyrighted in the name of Business MonitorInternational Ltd, and as such no part of thispublication may be reproduced, repackaged,redistributed, resold in whole or in any part, or usedin any form or by any means graphic, electronic ormechanical, including photocopying, recording,taping, or by information storage or retrieval, or byany other means, without the express written consentof the publisher.
DISCLAIMERAll information contained in this publication has been researched and compiled from sources believed to be accurate and reliable at the time ofpublishing. However, in view of the natural scope for human and/or mechanical error, either at source or during production, Business MonitorInternational Ltd accepts no liability whatsoever for any loss or damage resulting from errors, inaccuracies or omissions affecting any part of thepublication. All information is provided without warranty, and Business Monitor International Ltd makes no representation of warranty of any kindas to the accuracy or completeness of any information hereto contained.


CONTENTS
BMI Industry View ............................................................................................................... 5Table: Five-Year Forecast Scenario (Tanzania 2016-2025) . . . . . . . . . . . . . . . . . . . . . . . . . . . . . . . . . . . . . . . . . . . . . . . . . . . . . . . . . . . . . . . . . . . . . . . . . . . . . . . . . . . . . . . . . . . . 5
Table: Infrastructure Risk/Reward Index (Tanzania 2016) . . . . . . . . . . . . . . . . . . . . . . . . . . . . . . . . . . . . . . . . . . . . . . . . . . . . . . . . . . . . . . . . . . . . . . . . . . . . . . . . . . . . . . . . . . . . . 6
SWOT .................................................................................................................................... 7Infrastructure SWOT .................................................................................................................................. 7
Industry Forecast ................................................................................................................ 9Construction And Infrastructure Forecast Scenario .......................................................................................... 9
Table: 10-Year Forecast Scenario (Tanzania 2016-2025) . . . . . . . . . . . . . . . . . . . . . . . . . . . . . . . . . . . . . . . . . . . . . . . . . . . . . . . . . . . . . . . . . . . . . . . . . . . . . . . . . . . . . . . . . . . . . . 9
Industry Risk Reward Ratings .......................................................................................... 17Tanzania - Infrastructure Risk/Reward Index ................................................................................................ 17
Rewards ............................................................................................................................................... 17
Risks .................................................................................................................................................... 18
Industry Risk/Reward Index ....................................................................................................................... 19Table: SSA RRI . . . . . . . . . . . . . . . . . . . . . . . . . . . . . . . . . . . . . . . . . . . . . . . . . . . . . . . . . . . . . . . . . . . . . . . . . . . . . . . . . . . . . . . . . . . . . . . . . . . . . . . . . . . . . . . . . . . . . . . . . . . . . . . . . . . . . . . . . . 26
Methodology ...................................................................................................................... 28Industry Forecast Methodology ................................................................................................................ 28
Sector-Specific Methodology .................................................................................................................... 29
Risk/Reward Index Methodology ............................................................................................................... 33
Sector-Specific Methodology .................................................................................................................... 34Table: Infrastructure Risk/Reward Index Indicators . . . . . . . . . . . . . . . . . . . . . . . . . . . . . . . . . . . . . . . . . . . . . . . . . . . . . . . . . . . . . . . . . . . . . . . . . . . . . . . . . . . . . . . . . . . . . . . . . . . 34
Table: Weighting Of Indicators . . . . . . . . . . . . . . . . . . . . . . . . . . . . . . . . . . . . . . . . . . . . . . . . . . . . . . . . . . . . . . . . . . . . . . . . . . . . . . . . . . . . . . . . . . . . . . . . . . . . . . . . . . . . . . . . . . . . . . . . . 35
Tanzania Infrastructure Report Q4 2016
© Business Monitor International Ltd Page 4

BMI Industry View
BMI View: Improvements to Tanzania's poor transport logistics network will be the main driver of
construction industry growth throughout our 10-year forecast period, with interest in the country's nascent
gas sector and the construction of the necessary export infrastructure expected only after 2020 owing to
depressed commodity prices. The government will need to tackle allegations of corruption so as not to deter
investors.
Forecast & Industry Developments
■ We are maintaining our forecasts of 7.6% real growth for 2016 and annual average growth of 7.4% inreal terms over our five-year forecast period up to 2020. The development of transport infrastructure,supported by international funding flows, will be the primarily driver of construction industry expansion,as the government works to improve the country's poor logistics profile and capitalise on its maritimeaccess.
■ Over our full 10-year forecast period we project annual average growth of 8.4%. Nominal industry valueis projected to rise from an estimated USD5.1bn in 2015 to USD15.3bn in 2025, keeping Tanzania as thesecond-largest construction market in East Africa, behind Ethiopia.
■ Persistently low commodity prices and an uncertain regulatory environment continue to deter investmentinto the country's nascent gas sector.
■ Increasing activity in non-residential construction - particularly industrial and commercial developments -supports our outlook for strong industry growth.
Table: Five-Year Forecast Scenario (Tanzania 2016-2025)
2016f 2017f 2018f 2019f 2020f 2021f 2022f 2023f 2024f 2025f
Constructionindustry value,TZSbn
11,861.0 13,379.2 15,172.1 17,315.9 20,110.7 23,348.5 27,039.9 31,236.5 35,993.8 41,666.4
ConstructionIndustryValue, RealGrowth, % y-o-y
7.55 6.80 6.30 7.63 8.89 9.10 9.81 9.52 9.23 8.76
ConstructionIndustryValue, % ofGDP
11.7 11.6 11.5 11.5 11.8 12.0 12.3 12.5 12.7 12.9
f=BMi forecast. Source: BMI
Tanzania Infrastructure Report Q4 2016
© Business Monitor International Ltd Page 5
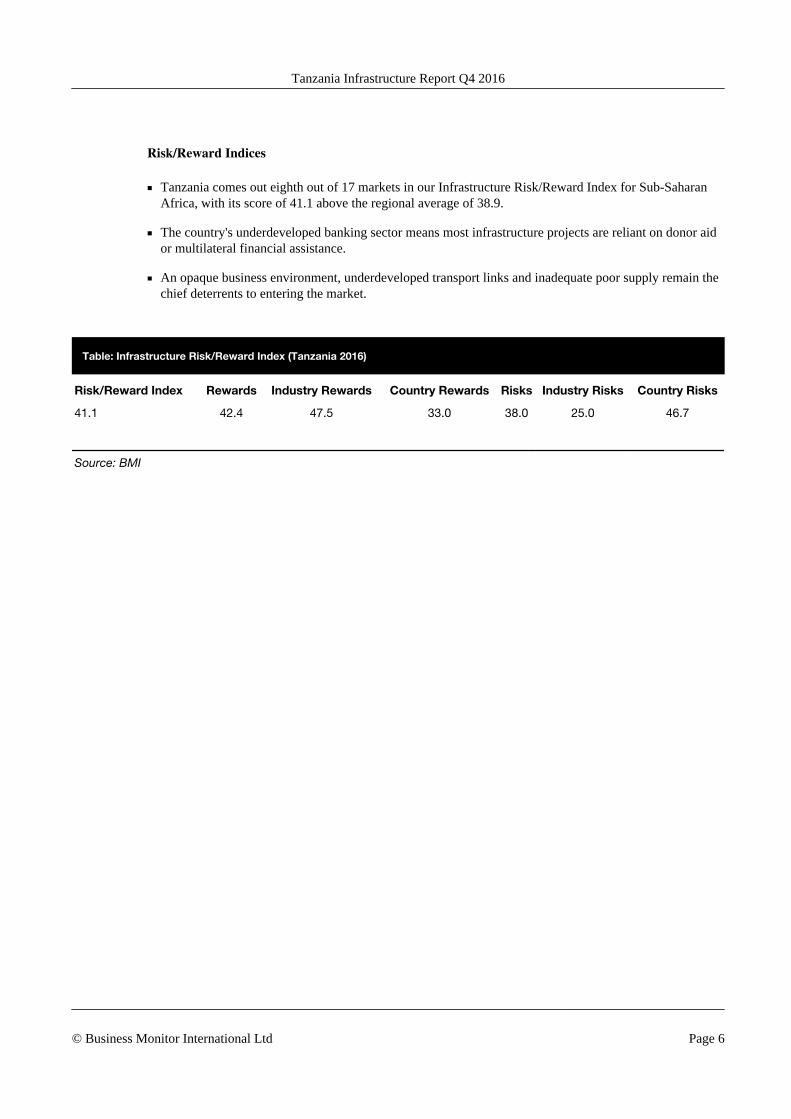
Risk/Reward Indices
■ Tanzania comes out eighth out of 17 markets in our Infrastructure Risk/Reward Index for Sub-SaharanAfrica, with its score of 41.1 above the regional average of 38.9.
■ The country's underdeveloped banking sector means most infrastructure projects are reliant on donor aidor multilateral financial assistance.
■ An opaque business environment, underdeveloped transport links and inadequate poor supply remain thechief deterrents to entering the market.
Table: Infrastructure Risk/Reward Index (Tanzania 2016)
Risk/Reward Index Rewards Industry Rewards Country Rewards Risks Industry Risks Country Risks
41.1 42.4 47.5 33.0 38.0 25.0 46.7
Source: BMI
Tanzania Infrastructure Report Q4 2016
© Business Monitor International Ltd Page 6

SWOT
Infrastructure SWOT
SWOT Analysis
Strengths ■ Since becoming independent in the early 1960s, Tanzania has earned a reputation as
one of the more stable political systems in Africa.
■ The country's maritime access makes it vital to landlocked countries for the import
and export of goods in East Africa.
Weaknesses ■ Corruption levels remain high, hindering the transparency of the tendering process.
■ Delays to project implementation are common.
■ An overreliance on hydropower means the current drought conditions have had a
severe impact on power generation.
Opportunities ■ Huge gas deposits have been found in the country, providing auxiliary infrastructure
investment and a boost to future government revenues.
■ A strong relationship with the Chinese government and Chinese construction
companies will continue to support the country's infrastructure development plans.
■ The demand for hotel rooms is exceeding the supply in Dar es Salaam and highlights
opportunities for growth in the hotel sector.
■ Funds and loans awarded to government to improve roads.
Tanzania Infrastructure Report Q4 2016
© Business Monitor International Ltd Page 7

SWOT Analysis - Continued
Threats ■ Talk of Tanzania leaving the East African Community, although unlikely, could
discourage investment.
■ Severe power shortages impact investor appetite and construction projects, although
weak oil prices lower the cost of running generators.
■ The government still relies heavily on foreign assistance for budget support, meaning
withdrawal of this support could have serious implications for fiscal accounts.
Tanzania Infrastructure Report Q4 2016
© Business Monitor International Ltd Page 8

Industry Forecast
Construction And Infrastructure Forecast Scenario
BMI View: We remain upbeat on the expansion of Tanzania's construction industry, forecasting 7.6% real
growth in 2016 and annual average growth of 8.4% over our 10-year forecast period. Investment into
transport infrastructure, particularly port and rail, will be the primary driver of growth as the government
seeks to improve its weak logistics profile. Increased movement in the country's gas sector after 2020 - in
line with our expectation for an improved commodities outlook - will also keep growth levels elevated.
Latest Updates
■ The Tanzanian government has received a USD7.6bn loan from the China Export-Import Bank to carryout the development of a 2,200km intraregional rail network extending from Dar es Salaam to Rwandancapital Kigali, and connecting with cities in Burundi, Uganda and the Democratic Republic of Congo.
■ Following the Ugandan government's decision to direct its crude export oil pipeline through Tanzaniarather than Kenya, we expect work to begin on upgrading Tanga port - currently geared primarily towardsagricultural exports - in the first half of our forecast period.
■ Construction of a flyover in the capital city Dar es Salaam, at the junction of the Tanzania-ZambiaRailway Authority headquarters and Mandela Expressway, is scheduled to start in October 2016.
■ Two industrial construction projects announced in July 2016 - including a tractor assembling plant and aroof tile factory - are scheduled to begin development end-2016.
Table: 10-Year Forecast Scenario (Tanzania 2016-2025)
2016f 2017f 2018f 2019f 2020f 2021f 2022f 2023f 2024f 2025f
Constructionindustry value,TZSbn
11,861.0 13,379.2 15,172.1 17,315.9 20,110.7 23,348.5 27,039.9 31,236.5 35,993.8 41,666.4
ConstructionIndustryValue, RealGrowth, % y-o-y
7.55 6.80 6.30 7.63 8.89 9.10 9.81 9.52 9.23 8.76
ConstructionIndustryValue, % ofGDP
11.7 11.6 11.5 11.5 11.8 12.0 12.3 12.5 12.7 12.9
f=BMI forecast. Source: BMI
Tanzania Infrastructure Report Q4 2016
© Business Monitor International Ltd Page 9

Structural Trends
2016-2025: Buoyant Growth Outlook
We remain upbeat on the expansion of Tanzania's construction industry, forecast to grow at an annual
average of 8.4% in real terms over our 10-year forecast period, comfortably above the Sub-Saharan Africa
(SSA) average of 6.3% over the same period. Nominal industry growth will rise from an estimated
USD5.1bn in 2015 to USD15.3bn in 2025, keeping Tanzania as the second-largest market in East Africa,
after Ethiopia.
Expansion over the first half of our forecast period will be driven mainly by investment in improving the
country's existing ports and rail infrastructure, which currently ranks poorly from a global and regional
perspective. We also highlight the potential of non-residential building projects - most notably in the
commercial and industrial construction sectors - to drive growth as more businesses enter the country.
Over the second half our forecast period, in line with improving commodity prices, we expect investment
into the nascent gas sector, which will boost energy infrastructure and the supporting logistics. For now, the
weak oil price environment as well as an uncertain regulatory picture will deter private investment into
Tanzania's gas sector. The government will need to focus on the latter if it is to attract significant foreign
investment into gas extraction and the necessary infrastructure development once prices improve.
Tanzania Infrastructure Report Q4 2016
© Business Monitor International Ltd Page 10

Growth To Outperform Regional Average
Construction Industry Value, TZSbn & Real Growth, y-o-y (%)
Tanzania - Construction industry value, TZSbn (LHS)SSA - Construction Industry Value, Real Growth, % y-o-y (RHS)Tanzania - Construction Industry Value, Real Growth, % y-o-y (RHS)
2016
f
2017
f
2018
f
2019
f
2020
f
2021
f
2022
f
0
10,000
20,000
30,000
4
6
8
10
12
f=BMI forecast. Source: BMI
Transport Expansion On Track Despite Bagamoyo Uncertainty
While last quarter we removed the ambitious USD10bn Bagamoyo Port project from our forecasts, owing to
the continued uncertainty around its feasibility, we remain positive on the progression of other port
infrastructure developments and the growth of the transport sector as a whole (see 'Robust Construction
Growth Despite Bagamoyo Uncertainty', May 13). Our Infrastructure Key Projects Database reflects a
strong project pipeline for transport sector, thereby underpinning our view for strong growth. The sector
will continue to benefit from external funding flows, stemming from development banks and foreign
firms. Ongoing upgrades will help to ease some of the logistics capacity constraints currently faced in the
country. Within BMI's Operational Risk Index, Tanzania scores below the SSA average in its Transport
Logistics Risk score, indicating its lack of competitiveness in the region (see 'Poor Logistics Infrastructure
Impedes Regional Competitiveness', March 10).
Tanzania Infrastructure Report Q4 2016
© Business Monitor International Ltd Page 11
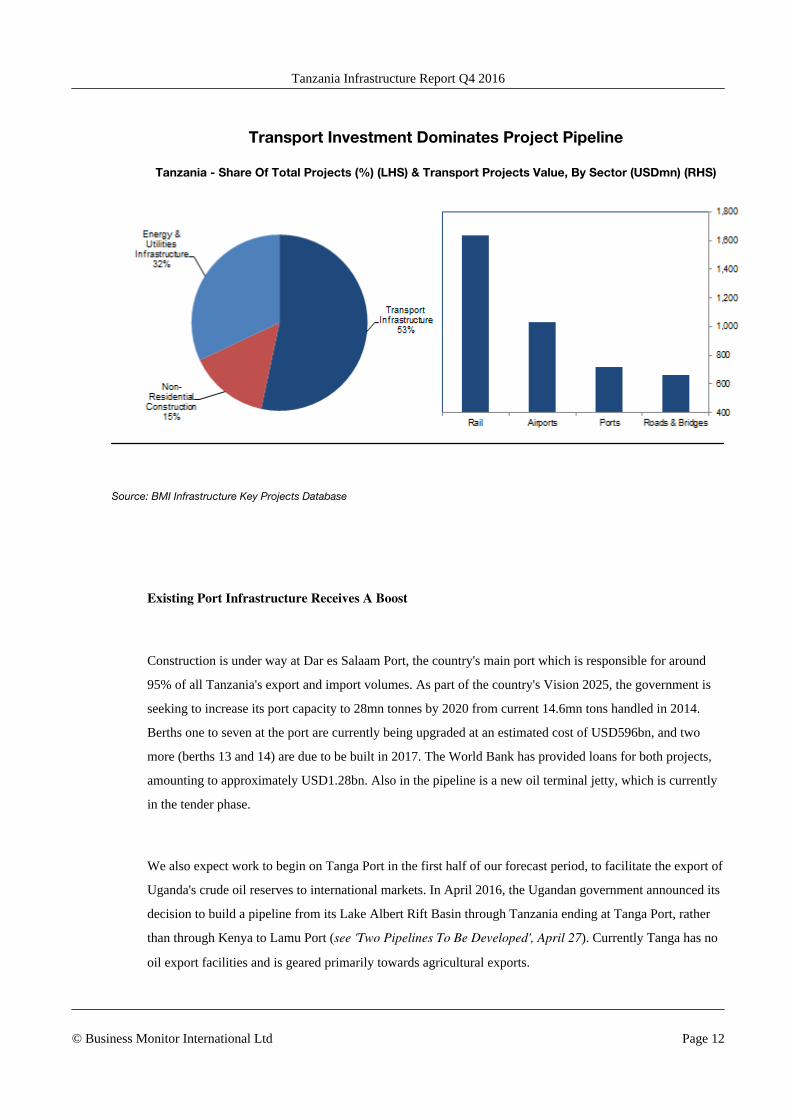
Transport Investment Dominates Project Pipeline
Tanzania - Share Of Total Projects (%) (LHS) & Transport Projects Value, By Sector (USDmn) (RHS)
Source: BMI Infrastructure Key Projects Database
Existing Port Infrastructure Receives A Boost
Construction is under way at Dar es Salaam Port, the country's main port which is responsible for around
95% of all Tanzania's export and import volumes. As part of the country's Vision 2025, the government is
seeking to increase its port capacity to 28mn tonnes by 2020 from current 14.6mn tons handled in 2014.
Berths one to seven at the port are currently being upgraded at an estimated cost of USD596bn, and two
more (berths 13 and 14) are due to be built in 2017. The World Bank has provided loans for both projects,
amounting to approximately USD1.28bn. Also in the pipeline is a new oil terminal jetty, which is currently
in the tender phase.
We also expect work to begin on Tanga Port in the first half of our forecast period, to facilitate the export of
Uganda's crude oil reserves to international markets. In April 2016, the Ugandan government announced its
decision to build a pipeline from its Lake Albert Rift Basin through Tanzania ending at Tanga Port, rather
than through Kenya to Lamu Port (see 'Two Pipelines To Be Developed', April 27). Currently Tanga has no
oil export facilities and is geared primarily towards agricultural exports.
Tanzania Infrastructure Report Q4 2016
© Business Monitor International Ltd Page 12
Finally, the Export-Import Bank of China (Chexim) is reportedly funding a sixth port in Zanzibar to ease
congestion on the Malindi Port, which handles around 95% of the island's trade flows. The project is
estimated to cost USD200mn and is scheduled to begin construction in 2016.
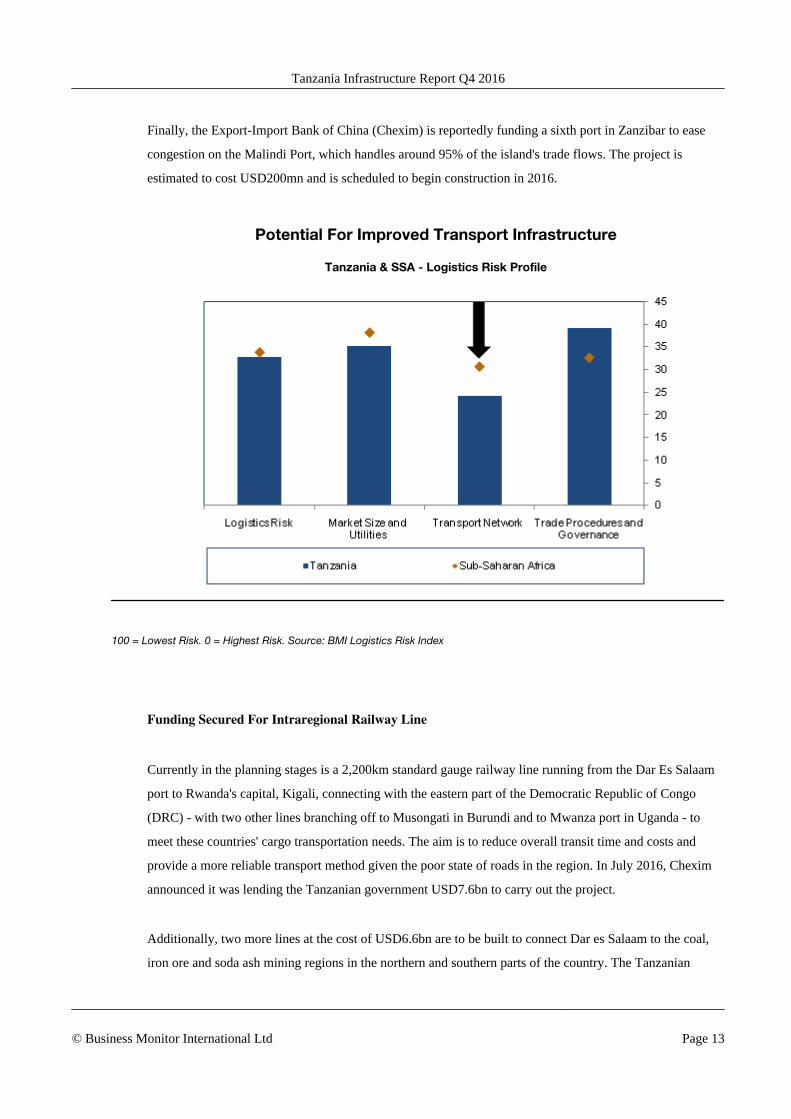
Potential For Improved Transport Infrastructure
Tanzania & SSA - Logistics Risk Profile
100 = Lowest Risk. 0 = Highest Risk. Source: BMI Logistics Risk Index
Funding Secured For Intraregional Railway Line
Currently in the planning stages is a 2,200km standard gauge railway line running from the Dar Es Salaam
port to Rwanda's capital, Kigali, connecting with the eastern part of the Democratic Republic of Congo
(DRC) - with two other lines branching off to Musongati in Burundi and to Mwanza port in Uganda - to
meet these countries' cargo transportation needs. The aim is to reduce overall transit time and costs and
provide a more reliable transport method given the poor state of roads in the region. In July 2016, Chexim
announced it was lending the Tanzanian government USD7.6bn to carry out the project.
Additionally, two more lines at the cost of USD6.6bn are to be built to connect Dar es Salaam to the coal,
iron ore and soda ash mining regions in the northern and southern parts of the country. The Tanzanian
Tanzania Infrastructure Report Q4 2016
© Business Monitor International Ltd Page 13

government has signed a framework agreement with the China Railway No.2 Engineering Group
Company to develop a 1,000km SGR line from the coal and iron mines from Njombe region to Mtwara
Port.
Funding Flows Into Roads Sector
The government is eager to improve its road networks, and in December 2015 received a loan from the
African Development Bank (AfDB) worth USD364.4mn for its Transport Sector Support Programme,
which involves rehabilitating and upgrading around 500km of roads. The upgrades will benefit trade
between Tanzania and its neighbours Malawi and Mozambique, through the Mtwara corridor; and Zambia
and the DRC through the Tunduma/Nakonde border and Kasanga Port. The AfDB's contribution will cover
88% of the costs, with the remainder coming from the government.
Also in December 2015, Tanzania signed a USD400mn loan deal with the Japanese government to boost the
construction of roads. Projects thus far include the upgrade of the 230km Arusha-Holili-Voi Road and the
new alignment of the 100km Kikafu Bridge.
In April 2016, the government launched a project to build a flyover in the capital city Dar es Salaam, at the
junction of the Tanzania-Zambia Railway Authority headquarters and Mandela Expressway. Estimated to
cost USD500mn, around USD46.5mn will be provided by the Japanese government and the remainder by
the Tanzania government. Construction is scheduled to start in October 2016 There are also plans to
construct a six-lane 128km highway in the capital city from Kigambini Bridge to Chalinze.
Airport Expansion Under Way
Further supporting business operations, is the expansion of the Julius Nyerere International Airport, which
is undergoing its second phase at a cost of USD110mn. Dutch contractor BAM International secured the
contract for this next leg having successfully completed the USD143mn first phase construction. With the
main terminal building, parking, access roads, platforms and a taxiway complete, the company will now
undertake the design and construction of Terminal 3, expected to handle the increased international traffic.
The 60,000sq m terminal building will increase the total annual capacity to six million passengers. Terminal
2 will then begin catering for domestic flights.
Tanzania Infrastructure Report Q4 2016
© Business Monitor International Ltd Page 14

Weak Commodity Prices Weigh On Power Sector
Despite government's plans to use natural gas to boost the ailing power grid, we note this is unlikely to
impact on energy infrastructure and the surrounding supply chain logistics in the short term. Our Oil & Gas
team highlights a weak oil price environment and an uncertain regulatory picture will hinder progress in the
country's natural gas sector.
While the Petroleum Act passed in October 2015 intends to create a more stable and transparent above-
ground environment, improving the prospects for exploration and development, there are several layers of
fiscal and regulatory uncertainty remaining. Moreover, the significantly expanded role for the Tanzanian
state may dull the appetite to invest.
Falling Oil To Drag On LNG
Front-Month Brent Price Forecast (USD/bbl)
Brent, /bbl
2014 2015e 2016f 2017f 2018f 2019f 2020f 2021f
40
60
80
100
120
e/f=BMI estimate/forecast. Source: BMI
The weak oil price, however, will benefit energy-intensive industries like manufacturing and heavy
industry, given that fuel forms a high proportion of a firm's cost base and is usually sourced from diesel-run
Tanzania Infrastructure Report Q4 2016
© Business Monitor International Ltd Page 15
generators. This will drive expansion and investment bodes well for infrastructure development, as
manufacturing drives development of factories, labour facilities, supply chain logistics and access to
facilities.
Non-Residential Construction Boosting Growth
Within non-residential building, we highlight the potential for Tanzania to capitalise on the potential of its
hotel sector as a growth driver. An increasing number of investment activities - as well as the vital tourism
industry - are driving the need for international hotels and lodges in strategic areas. Dar es Salaam is
currently experiencing a shortage of hotel rooms as the economy expands and the government is eager to
attract investment to boost the tourism sector's competitiveness in the region. Providing a necessary boost is
the USD20mn committed by Ramada Worldwide to service the 116-room Ramada Encore Hotel in
Tanzania's capital, with the chief objective to increase bed capacity. We note the increased demand for
rooms is in spite of the country's frequent power outages. However, an increased and more reliable power
supply is critical for reducing operating costs for hotel owners, who rely on fuel to run operations during
blackouts and load-shedding.
We also highlight increased activity in industrial construction as a growth driver over the medium term. In
July 2016, Dar es Salaam secured a soft loan of USD110mn from Poland to build a tractor assembling
factory. The manufacturing unit is expected to be in the Kibaha District and intended to produce around
2,400 tractors annually, to be sold in local markets and to other east African countries. Construction is
expected to start before end 2016. Also in July 2016, it was announced that Chinese investors will spend
USD100mn building a roof tile factory in the Mkuranga District to manufacture 800,000 roofing tiles a day.
Nigerian firm Goodwill Ceramic Limited is scheduled to begin construction in December 2016.
Tanzania Infrastructure Report Q4 2016
© Business Monitor International Ltd Page 16

Industry Risk Reward Ratings
Tanzania - Infrastructure Risk/Reward Index
BMI View: Strong growth forecasts for Tanzania's construction industry will keep the overall
Rewards score more or less in line with the regional average, while the small size of the market and
government corruption allegations will have a negative impact on overall Risk profile. In BMI's Sub-
Saharan Africa (SSA) infrastructure Risk/Reward Index (RRI), Tanzania scores 41.1 out of 100, placing the
market in eighth position out of 17 countries and above the regional average of 38.9.
Rewards
Industry Rewards
With a strong construction industry value growth forecast (averaging 8.4% between 2016 and 2025),
industry rewards are elevated in Tanzania. It continues to score 47.5 for this indicator, above the regional
average of 40.6. Raised capital investment levels bode well for expansion and confidence in the market.
However, the industry will remain fairly small in nominal value terms and this, along with pressure on
Tanzania's fiscal position, will hinder faster growth.
Country Rewards
The Country Rewards offered by Tanzania are limited, with conditions on the ground often greatly
increasing the time and cost of developing a project. At 33, its score remains unchanged from last quarter,
and is just below the regional average of 33.4. A weak financial system means the country is ill-equipped to
handle project financing demands and so most infrastructure projects require donor aid or multilateral
financial assistance. An inadequate electrification rate is a hindrance to the wider business environment
(although lower oil prices mean energy-intensive projects make up a lower proportion of a firm's cost base
than previously), and a lack of skilled labour increases the costs for potential sponsors of infrastructure
projects.
Tanzania Infrastructure Report Q4 2016
© Business Monitor International Ltd Page 17

Risks
Industry Risks
At 25, the Industry Risk score remains unchanged - well below the regional average of 36.5 - which reflects
high levels of opacity in the market. This is particularly true within the infrastructure sector in terms of the
transparency of the tendering process. At present the market is heavily dominated by Chinese investment,
although in the long term we expect more engineering companies to enter the industry, as the nascent oil &
gas sector demands higher levels of technical expertise. The country will need to increase competition
levels through public-private partnerships, and if there is deregulation of state-controlled areas of the
economy, coupled with action to reduce bureaucracy, significant inflows of foreign investment could
follow.
Country Risks
Tanzania scores 46.7 for Country Risks, keeping above the regional average of 43.6. In spite of growing
discontent with the ruling party, which presents a downside risk, the overall political environment is among
the most stable in SSA. The country's corruption credentials (as quantified by Transparency International)
have deteriorated, with Tanzania ranked 117 in the 2015 Corruption Perceptions Index. If left unchecked,
corruption will adversely affect the country's reputation, deterring potential foreign investment.
Note: Individual country scores are subject to change, based on the latest data available.
Tanzania Infrastructure Report Q4 2016
© Business Monitor International Ltd Page 18

Industry Risk/Reward Index
BMI View: Sub-Saharan Africa remains the riskiest region globally to develop infrastructure, as
volatile currencies, security threats and inadequate utilities infrastructure hinder the potential to secure a
substantial return on investment. Subdued construction industry growth outlooks in the region's largest
infrastructure markets - Nigeria and South Africa - is denting investor interest, as both nations battle
domestic and external headwinds. Meanwhile, rewards on offer in East Africa on the back of the positive
growth story are offset by markets' low industry value in nominal terms and underdeveloped financial
sectors.
This quarter we highlight the following trends and changes in our Infrastructure Risk/Reward Index (RRI)
for Sub-Saharan Africa (SSA):
■ The most significant shift comes as Nigeria slumps from fourth place to rank sixth overall, asmacroeconomic challenges take hold and attacks on oil pipelines in the Niger Delta limit governmentrevenue and exacerbate an already dangerous operating environment. West Africa as a whole remains ahigh-risk region, with political uncertainty and the growing presence of terrorist groups. Cameroon facesthe added risk of a political vacuum in the wake of incumbent president Paul Biya's departure fromoffice, expected during our forecast period.
■ Botswana, Namibia and South Africa have remained the most attractive investment destinations inSouthern Africa, performing consistently well across all four pillars of our index and highlighting theregion as the most stable in SSA. This sustained solid performance of these markets is primarily the resultof stable policies and lower levels of corruption compared to elsewhere in SSA.
■ An improvement in Ghana's economic outlook and energy security sees the market move from eight toseventh place overall. We also expect it to recover from the 2015 recession, estimated at a contraction of2%, to record positive growth throughout our forecast period.
■ Inadequate utilities infrastructure remains a key deterrent to infrastructure companies and investorsentering SSA, with insufficient power generation and increasingly constrained water supplies leading tosupply chain disruptions and an increase in business costs. Despite commercial and institutional investorinterest in the renewable energy sector, markets remain constrained by underdeveloped grid infrastructureand the financial instability and creditworthiness of state utilities. Meanwhile, markets in Southern Africacontinue to struggle with persistent droughts that have seen dam levels drop significantly.
Tanzania Infrastructure Report Q4 2016
© Business Monitor International Ltd Page 19

High Risk, Low Reward
SSA RRI Index
*Scores 0-100, with higher scores preferable. Source: BMI
The comparatively substantial value of the Nigerian and South African construction industries in SSA has
kept these markets positioned near the top of our RRI, despite slower real growth than other markets in the
region. However, we note growing operational risks, deteriorating economic outlooks and a decline in
foreign direct investment (FDI) in both countries is weighing heavily on their attractiveness and further
weakening industry growth. Investors are expected to exercise greater caution operating in these markets as
the potential to capitalise on their rewards and garner significant return on capital outlays becomes
increasingly less certain.
In Nigeria, private sector involvement in construction projects has declined severely owing to the lack of
liquidity in the banking sector - a result of the 2015 introduction of capital controls and the maintenance of a
currency peg to the USD despite significant pressure on the naira. We also believe the government will
struggle to meet its spending targets as revenues remain under pressure throughout the year, even with a
mild increase expected in oil prices - particularly as oil production stumbles in light of increased attacks on
oil pipelines in the Niger Delta. Heightened terrorist activity will be a major deterrent to investors, who are
already cautious of the exposure of key infrastructure to sabotage. In light of these factors, last quarter we
Tanzania Infrastructure Report Q4 2016
© Business Monitor International Ltd Page 20

revised Nigeria's construction growth forecast to 1.1% in real terms for 2016 from the previous projection
of 7.0% (see 'Construction: Growth Slashed As Liquidity Bites - Q3 2016', June 3).
Capital Controls Will Continue To Deter Investment
Nigeria - Capital Importation, Components, USDmn
Source: National Bureau of Statistics, Nigeria
Our forecasts for real growth in South Africa's construction market remain subdued at 1.9% expected in
2016. Despite lower risks compared to other SSA markets and its position as the most financially advanced
market in the region, South Africa is weighed down by the government's growing inability to deploy the
financial capital it has earmarked for the infrastructure sector, as economic growth slows to the lowest level
since the 2009 recession. We are also expecting a further slump in foreign direct investment (FDI) inflows
to the country in 2016: the prospect of an investment rating downgrade remains a major drag on business
sentiment, with further pressure stemming from the uncertainty over policy reform seeking to extend the
state's power in land expropriation (see 'New Investment Legislation: Key Implications For Construction',
June 23).
Tanzania Infrastructure Report Q4 2016
© Business Monitor International Ltd Page 21

Business Confidence Takes A Knock
South Africa - Business Confidence Index, 2010=100
Source: South African Chamber of Commerce And Industry, BMI
Our RRI outperformers, Namibia and Botswana - coming in first and second respectively - continue to be
boosted by both governments' prudent fiscal management and increased capital expenditure towards
infrastructure development. The transport and utilities sectors will receive major attention as the countries
work to improve their overall logistics risk profile in Southern Africa. We also highlight the mining sector's
importance to economic growth in both markets remains a key source of demand for infrastructure, keeping
their growth trajectories in positive territory over 2016.
Tanzania Infrastructure Report Q4 2016
© Business Monitor International Ltd Page 22

Strong Operational Risk Profiles Boost Rewards
Operational Risk Scores
*Scores 0-100, with higher scores preferable. Source: BMI
In West Africa, we highlight Cote d'Ivoire as an investment bright spot for infrastructure, with one of the
most developed public-private partnership (PPP) markets in SSA, supported by the government's pro-
business strategies. Its currency peg to the euro has kept price growth stable, even as currencies in SSA
weakened substantially in the commodities downturn. While Nigeria and Ghana score positively across the
remaining three pillars, macroeconomic headwinds, caution from private investors and poorer growth
stories in these markets have seen Cote d'Ivoire jump to the lead in the Industry Rewards pillar with a score
of 42.5. It is the only market in West Africa to rank above the SSA average in this regard.
Dragging on the attractiveness of the Ivorian market is its small size in nominal value terms, which spells
greater risks for investors in gaining substantial return on investment that comes with operating in larger
markets. Estimated to be worth USD800mn in 2015, Cote d'Ivoire's nominal industry value is small -
especially compared with Nigeria at USD18.4bn. Ghana, Cameroon and Gabon are all above the USD1bn
mark, worth USD4.2bn, USD1.9bn and USD1.1bn respectively. As such, the country scores lower for
Industry Risks than Nigeria and Ghana.
Tanzania Infrastructure Report Q4 2016
© Business Monitor International Ltd Page 23

Nigeria Overshadows Peers
West Africa - Construction Industry Value, USDmn
Nigeria Ghana Cameroon Gabon Cote d`Ivoire
2015e 2016f 2017f 2018f 2019f
0
10
20
30
40
50
e/f=BMI estimate/forecast. Source: National Sources, BMI
In East Africa, Kenya and Ethiopia remain the most attractive markets for investment, with the former
offering a far greater diversity of opportunity compared to its neighbours and the latter boosted by its
attractive growth trajectory. Overall Kenya fares significantly better in our Index, ranking above the SSA
average across all pillars. The government's effort to open the construction market to greater competition
vis-à-vis the PPP model has been critical in attracting private investment and we highlight Nairobi is firmly
cementing its reputation as the choice destination for firms operating in East Africa, with a growing hotel
industry catering to business and direct flights to the US and Morocco starting in 2016. Meanwhile,
Ethiopia's reliance on international sources of capital means many projects go to companies from the source
nation. With China dominating these financing flows, Chinese firms have steadily built up a strong market
share and are able to undercut on price, limiting the success of other international firms.
Tanzania Infrastructure Report Q4 2016
© Business Monitor International Ltd Page 24

China Dominates Ethiopia's Industry Landscape
Market Share (%) According To Major Project Value
Source: BMI Infrastructure Key Projects Database
Kenya's overall attractiveness is also boosted by its outperformer status for renewable energy in the SSA
region. The government has made strides harnessing geothermal and wind to address its power deficit, and
while the country still struggles with an inadequate power supply, it fares much better in this regard than its
neighbours. In comparison, Ethiopia's electrification rate (currently the lowest per capita in the region)
adversely impacts the timely completion of projects and the efficiency of the manufacturing sector, and
substantially increases operational costs. We note, however, total generation is forecast to improve by 62%
between 2016 and 2020 as the government devotes significant attention to its power sector.
Tanzania Infrastructure Report Q4 2016
© Business Monitor International Ltd Page 25

Kenya Posts Most Consistent Performance
East Africa - Risk/Reward Index
*Scores 0-100, with higher scores preferable. Source: BMI
Less risk-averse investors will be drawn to Ethiopia, the only construction market in SSA forecast to record
double-digit growth over the next 10 years, as the government continues with its major push for
infrastructure development. The country's Industry Rewards score is also boosted by its position as the
largest market in East Africa in nominal value terms, having risen from USD1.1bn in 2011, overtaking that
of Tanzania (USD5.1bn) and significantly higher than Uganda (USD3.1bn) and Kenya (USD3.1bn).
Table: SSA RRI
IndustryRewards
CountryRewards Rewards
IndustryRisks
CountryRisks Risks
InfrastructureR/R Score
RegionalRanking
Botswana 55 43.0 50.8 45 65.8 57.5 52.8 1
Namibia 65 40.2 56.3 42.5 44.8 43.9 52.6 2
South Africa 37.5 62.7 46.3 57.5 61.4 59.8 50.4 3
Kenya 45 42.8 44.2 45 47.3 46.4 44.9 4
Zambia 47.5 32.1 42.1 40 44.4 42.6 42.3 5
Nigeria 30 57.8 39.7 35 53.5 46.1 41.6 6
Tanzania Infrastructure Report Q4 2016
© Business Monitor International Ltd Page 26

SSA RRI - Continued
IndustryRewards
CountryRewards Rewards
IndustryRisks
CountryRisks Risks
InfrastructureR/R Score
RegionalRanking
Ethiopia 60 19.5 45.8 25 36.1 31.7 41.6 7
Tanzania 47.5 33.0 42.4 25 46.7 38.0 41.1 8
Ghana 32.5 46.5 37.4 50 47.6 48.5 40.7 9
Uganda 42.5 25.6 36.6 32.5 46.3 40.8 37.8 10
Cameroon 37.5 29.9 34.8 50 41.1 44.7 37.8 11
Cote d'Ivoire 42.5 22.4 35.5 40 44.3 42.6 37.6 12
Mozambique 42.5 23.0 35.7 35 37.1 36.3 35.8 13
Angola 40 12.8 30.5 30 32.9 31.8 30.9 14
Gabon 27.5 29.9 28.3 27.5 40.9 35.5 30.5 15
Zimbabwe 25 26.9 25.7 26 23.4 24.4 25.3 16
Sudan & SouthSudan 12.5 19.2 14.9 15 27.2 22.3 17.1 17
RegionalAverage 40.6 33.4 38.1 36.5 43.6 40.8 38.9 -
*Scores 0-100, with higher scores preferable. Source: BMI
Tanzania Infrastructure Report Q4 2016
© Business Monitor International Ltd Page 27

Methodology
Industry Forecast Methodology
BMI's Industry forecasts are generated using the best-practice techniques of time-series modelling and
causal/econometric modelling. The precise form of model we use varies from industry to industry, in each
case being determined, as per standard practice, by the prevailing features of the industry data being
examined.
Common to our analysis of every industry, is the use of vector autoregressions. Vector autoregressions
allow us to forecast a variable using more than the variable's own history as explanatory information. For
example, when forecasting oil prices, we can include information about oil consumption, supply and
capacity.
When forecasting for some of our industry sub-component variables, however, using a variable's own
history is often the most desirable method of analysis. Such single-variable analysis is called univariate
modelling. We use the most common and versatile form of univariate models: the autoregressive moving
average model (ARMA).
In some cases, ARMA techniques are inappropriate because there is insufficient historic data or data quality
is poor. In such cases, we use either traditional decomposition methods or smoothing methods as a basis for
analysis and forecasting.
We mainly use OLS estimators and in order to avoid relying on subjective views and encourage the use of
objective views, we use a 'general-to-specific' method. BMI mainly uses a linear model, but simple non-
linear models, such as the log-linear model, are used when necessary. During periods of 'industry shock', for
example poor weather conditions impeding agricultural output, dummy variables are used to determine the
level of impact.
Effective forecasting depends on appropriately selected regression models. We select the best model
according to various different criteria and tests, including but not exclusive to:
■ R2 tests explanatory power; adjusted R2 takes degree of freedom into account
■ Testing the directional movement and magnitude of coefficients
■ Hypothesis testing to ensure coefficients are significant (normally t-test and/or P-value)
■ All results are assessed to alleviate issues related to auto-correlation and multi-collinearity
Tanzania Infrastructure Report Q4 2016
© Business Monitor International Ltd Page 28

BMI uses the selected best model to perform forecasting.
It must be remembered that human intervention plays a necessary and desirable role in all of our industry
forecasting. Experience, expertise and knowledge of industry data and trends ensure that analysts spot
structural breaks, anomalous data, turning points and seasonal features where a purely mechanical
forecasting process would not.
Sector-Specific Methodology
Construction Industry
Construction Industry Value
Our data is derived from GDP by output figures from each country's national statistics office (or
equivalent). Specifically, it measures the output of the construction industry over the reported 12-month
period in nominal values (ie domestic currency terms). As it is derived from GDP data, it is a measure of
value added within the industry (ie the additional contribution of the construction industry over other
industries, such as cement production). Consequently, it does not measure the nominal value of all inputs
used in the construction industry, which, for most states would increase the overall figure by 50-60%.
Furthermore, it is important to note that the data does not provide an indication of the total value of a
country's buildings, only the construction sector's output in a given year.
This data is used because it is reported by virtually all countries and can therefore be used for comparative
purposes.
Construction Industry Value Real Growth
Our data and forecasts for real construction measures the real increase in output (rather than nominal
growth, which would also incorporate inflationary increases). In short, it is an inflation-adjusted value of the
output of the construction industry y-o-y. Consequently, real growth will be lower than the nominal growth
of our 'construction value' indicator, except in instances where deflation is present in the industry.
Data for this is sourced from the constant values for construction value added, using the same sources noted
above. We use officially calculated data to accurately account for inflation specific to the construction
industry.
Tanzania Infrastructure Report Q4 2016
© Business Monitor International Ltd Page 29

Construction Industry, % Of GDP/Construction Value (USD)
These are derived indicators. We use BMI's Country Risk team's GDP and exchange rate forecasts to
calculate these indicators.
Capital Investment
Total Capital Investment
Our data is derived from GDP by expenditure data from each country's national statistics office (or
equivalent). It is a measure of total capital formation (excluding stock build) over the reported 12-month
period. Total capital formation is a measure of the net additions to a country's capital stock, so takes into
account depreciation as well as new capital. In this context, capital refers to structures, equipment, vehicles
etc. As such, it is a broader definition than construction or infrastructure, but is used by BMI as a proxy for
a country's commitment to development.
Capital Investment (USD), % Of GDP, Per Capita
These are derived indicators. We use our Country Risk team's population, GDP and exchange rate forecasts
to calculate them. As a rule of thumb, we believe an appropriate level of capital expenditure is 20% of GDP,
although in rapidly developing emerging markets it may, and arguably should, account for up to 30%.
Government Capital Expenditure
This is obtained from government budgetary data and covers all non-current spending (ie spending on
transfers, salaries to government employees, etc). Due to the absence of global standards for reporting
budgetary expenditure, this measure is not as comparable as construction/capital investment.
Tanzania Infrastructure Report Q4 2016
© Business Monitor International Ltd Page 30

Government Capital Expenditure, USDbn, % Of Total Spending
These are derived indicators.
Construction Sector Employment
Total Construction Employment
This data is sourced from either the national statistics office or the International Labor Organization (ILO).
It includes all those employed within the sector.
Construction Employment, % y-o-y; % Of Total Labour Force
These are derived indicators.
Average Wage In Construction Sector
This data is sourced from either the national statistics office or the ILO.
Infrastructure Data Sub-Sectors
BMI's Infrastructure data examines the industry from the top down and bottom up in order to calculate the
industry value of infrastructure and its sub-sectors. We use a combination of historic data as reported by the
central banks, national statistics agencies and other official data sources, and BMI's Infrastructure Key
Projects Database tool.
Where possible we source historic data for the relative portion of either infrastructure spend or value
generated by the various sub-sectors we classify as infrastructure. We seek to segment official infrastructure
data into pre-set categories classified by us, across all countries, in order to optimise the ability to compare
industry value across the sub-sectors of infrastructure. We then apply ratios to the infrastructure subsector
value in order to derive the value. Real growth is calculated using the official construction inflation rate.
In those instances where historic data is not available, we use a top down and bottom up approach
incorporating full use of BMI's Infrastructure Key Projects Database, in most cases dating back to 2005.
This allows us to calculate historical ratios between general infrastructure industry value and its sub-sectors,
Tanzania Infrastructure Report Q4 2016
© Business Monitor International Ltd Page 31

which we then use for forecasting. Our Key Projects Database is not exhaustive, but it is comprehensive
enough to provide a solid starting point for our calculations.
The top down approach uses data proxies. We have separated countries into three tiers. Each tier comprises
a group of countries on a similar economic development trajectory and with similar patterns in terms of
infrastructure spending, levels of infrastructure development and sector maturity. This enables us to confirm
and overcome any deficiencies of infrastructure-specific data by applying an average group ratio (calculated
from the countries for which official data exists) to the countries for which data is limited.
■ Tier I - Developed States. Common characteristics include:
■ Mature infrastructure markets;
■ Investments typically target maintenance of existing assets or highly advanced projects at the top of thevalue chain;
■ Infrastructure as percent of total construction averages around 30%.
■ Tier I countries: Canada, Germany, Greece, UK, US, France, Hong Kong, Taiwan, Singapore, Israel,Japan, Australia.
• Tier II - Core Emerging Markets. Common characteristics include
■ The most rapidly growing emerging markets, where infrastructure investments are a governmentpriority;
■ Significant scope for new infrastructure facilities from very basic levels (eg highways, heavy rail) tomore high value projects (renewables, urban transport);
■ Infrastructure as percent of total construction averages around 45% and above.
■ Tier II countries: Colombia, Malaysia, Mexico, South Korea, Peru, Philippines, Turkey, Vietnam,Poland, Hungary, South Africa, Nigeria, Russia, China, India, Brazil, Indonesia.
• Tier III- Emerging Europe. Common characteristics include:
■ Regional socioeconomic trajectories;
■ Development defined by recent or pending accession to European structures such as the EU.Infrastructure development to a large degree dictated by EU development goals and financed throughvehicles such as the PHARE and ISPA programmes, and institutions such as the EBRD and EIB;
■ Infrastructure as percentage of total construction averages between 30% and 40%.
■ Tier III countries: Czech Republic, Romania, Bulgaria, Slovakia, Slovenia, Estonia, Latvia, Lithuania,Croatia, Ukraine.
This methodology has enabled us to calculate infrastructure industry values for states where this was not
previously possibly. Furthermore, it has enabled us to create comparable indicators.
Tanzania Infrastructure Report Q4 2016
© Business Monitor International Ltd Page 32

The top down hypothesis-led approach has been used solely to calculate the infrastructure industry value as
a percentage of total construction. For all sub-sector calculations we apply the bottom-up approach, ie
calculating the ratios from our Key Projects Database where data was not otherwise available.
Risk/Reward Index Methodology
BMI's Risk/Reward Index (RRI) provides a comparative regional ranking system evaluating the ease of
doing business and the industry-specific opportunities and limitations for potential investors in a given
market.
The RRI system divides into two distinct areas:
Rewards: Evaluation of sector's size and growth potential in each state, and also broader industry/state
characteristics that may inhibit its development. This is further broken down into two sub categories:
■ Industry Rewards (this is an industry-specific category taking into account current industry size andgrowth forecasts, the openness of market to new entrants and foreign investors, to provide an overallscore for potential returns for investors).
• Country Rewards (this is a country-specific category, and the score factors in favourable political andeconomic conditions for the industry).
Risks: Evaluation of industry-specific dangers and those emanating from the state's political/economic
profile that call into question the likelihood of anticipated returns being realised over the assessed time
period. This is further broken down into two sub categories:
■ Industry Risks (this is an industry-specific category whose score covers potential operational risks toinvestors, regulatory issues inhibiting the industry, and the relative maturity of a market).
• Country Risks (this is a country-specific category in which political and economic instability,unfavourable legislation and a poor overall business environment are evaluated to provide an overallscore).
We take a weighted average, combining industry and country risks, or industry and country rewards. These
two results in turn provide an overall Risk/Reward Index, which is used to create our regional ranking
system for the risks and rewards of involvement in a specific industry in a particular country.
For each category and sub-category, each state is scored out of 100 (100 being the best), with the overall
Risk/Reward Index a weighted average of the total score. Importantly, as most of the countries and
territories evaluated are considered by us to be 'emerging markets', our score is revised on a quarterly basis.
This ensures that the score draws on the latest information and data across our broad range of sources, and
Tanzania Infrastructure Report Q4 2016
© Business Monitor International Ltd Page 33

the expertise of our analysts. Our approach in assessing the Risk/Reward balance for infrastructure industry
investors globally is fourfold:
■ First, we identify factors (in terms of current industry/country trends and forecast industry/countrygrowth) that represent opportunities to would-be investors.
■ Second, we identify country and industry-specific traits that pose or could pose operational risks towould-be investors.
■ Third, we attempt, where possible, to identify objective indicators that may serve as proxies for issues/trends to avoid subjectivity.
■ Finally, we use BMI's proprietary Country Risk Index (CRI) in a nuanced manner to ensure that only theaspects most relevant to the infrastructure industry are incorporated. Overall, the system offers anindustry-leading, comparative insight into the opportunities/risks for companies across the globe.
Sector-Specific Methodology
In constructing these indices, the following indicators have been used. Almost all indicators are objectively
based.
Indicators
Table: Infrastructure Risk/Reward Index Indicators
Rationale
Rewards
Industry rewards
Construction expenditure, USDbn Objective measure of size of sector. The larger the sector, the greater theopportunities available.
Sector growth, % y-o-y Objective measure of growth potential. Rapid growth results in increasedopportunities.
Capital investment, % of GDP Proxy for the extent the economy is already oriented towards the sector.
Government spending, % of GDP Proxy for extent to which structure of economy is favourable to infrastructure/
Country rewards
Labour market infrastructure From BMI's Country Risk Index (CRI). Denotes availability/cost of labour. Highcosts/low quality will hinder company operations.
Financial infrastructure From CRI. Denotes ease of obtaining investment finance. Poor availability offinance will hinder company operations across the economy.
Access to electricity From CRI. Low electricity coverage is proxy for pre-existing limits toinfrastructure coverage.
Risks
Industry risks
Tanzania Infrastructure Report Q4 2016
© Business Monitor International Ltd Page 34

Infrastructure Risk/Reward Index Indicators - Continued
Rationale
No. of companies Subjective evaluation against BMI-defined criteria. This indicator evaluatesbarriers to entry.
Transparency of tendering process Subjective evaluation against BMI-defined criteria. This indicator evaluatespredictability of operating environment.
Country risks
Structure of economy From CRI. Denotes health of underlying economic structure, including sevenindicators such as volatility of growth; reliance on commodity imports, relianceon single sector for exports.
External risk From CRI. Denotes vulnerability to external shock - principal cause of economiccrises.
Policy continuity Subjective score from CRI. Denote predictability of policy over successivegovernments.
Legal framework From CRI. Denotes strength of legal institutions in each state. Security ofinvestment can be a key risk in some emerging markets.
Corruption From CRI. Denotes risk of additional illegal costs/possibility of opacity intendering/business operations affecting companies' ability to compete.
Source: BMI
Weighting
Given the number of indicators/datasets used, it would be inappropriate to give all sub-components equal
weight. Consequently, the following weighting has been adopted:
Table: Weighting Of Indicators
Component Weighting, %
Rewards 70, of which
- Industry rewards 65
- Country rewards 35
Risks 30, of which
- Industry risks 40
- Country risks 60
Source: BMI
Tanzania Infrastructure Report Q4 2016
© Business Monitor International Ltd Page 35